China’s Timber Industry and Trade
Lu Wenming
Professor
Chinese Academy of Forestry

China in Brief
• As one of the largest countries in the world
– Population: ranks 1
– GDP: ranks 2
– Trade: ranks 2
– Land area: rank 3
– Forest area: rank 5
– Forest stock volume: rank 6
• China is one of the largest countries in the world also in terms of:
– Production, processing, import and export of forest products
• Import raw materials (logs and sawnwood)
• Export finished products (furniture, plywood, wooden products)
• Woodworking industry
– Growth has been always rapid
– Recently, big challenges are getting serious
• Mainly a temperate country, but also with tropical areas
– Largest member in ITTO in terms of net timber trade

China’s Timber Industry and Trade
• 1. Timber trade
– 1.1 Timber import
– 1.2 Timber export
• 2. Timber industry
• 3. Challenges
– 3.1 Traditional challenges
– 3.2 New challenges

1. Timber trade
– 1.1 Timber import
– 1.2 Timber export

Timber trade in 2014
• Forest products trade: US$ 140 billion, mainly timber products
– Timber products trade: US$ 99 billion
– NTFPs trade: US$ 40.9 billion
Total %
Timber products NTFPs
Value % Percent Value % Percent
Import 67.8 7 45.5 10 67 22.2 0.5 33
Export 72.2 16 53.5 12 74 18.7 26 26

Timber trade in 2004-2014

1.1 Timber import

绿奥诺Woodworking industry
Concentration


Timber products import
wood pulp
27%
logs
26%sawn timber
18%
waste paper
12%
paper and
board
9%
chip
3%
others
5%
The proportion of China’s major wood
products import value in 2014
• Total import: US$ 44.5 billion
• Pulp and paper are the largest imported forest products
• Then, logs and sawnwood
• Top 6 products: pulp, logs, sawnwood, waste paper (and paper, paperboard and paper products), chips
• These top 6 products: US$ 43.1 billion, accounting for 95%
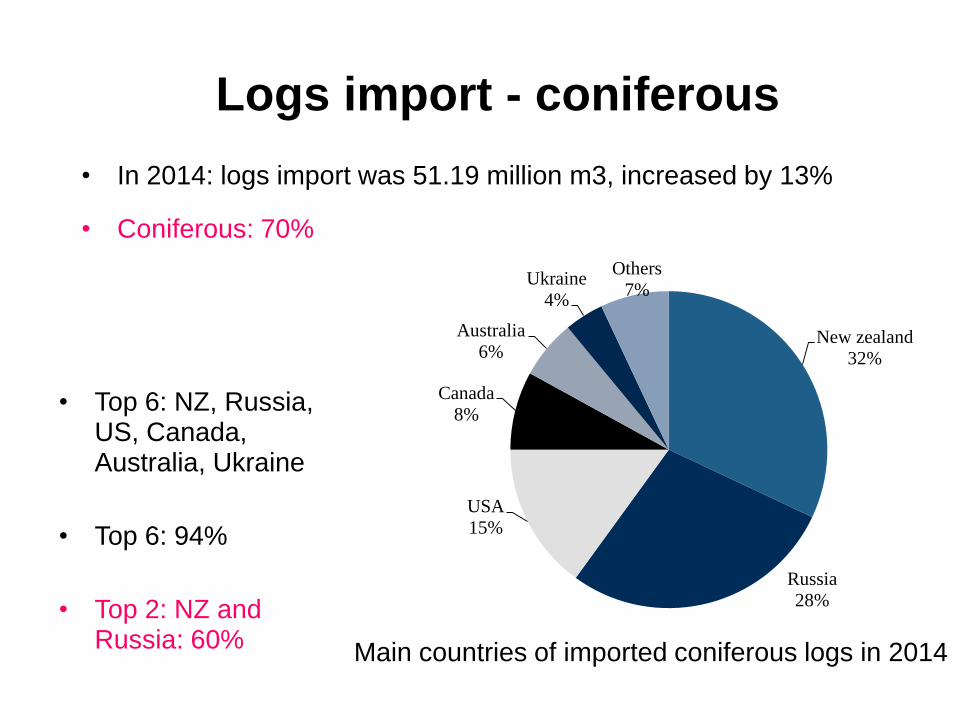
Main countries of imported coniferous logs in 2014
Logs import - coniferous
New zealand
32%
Russia
28%
USA
15%
Canada
8%
Australia
6%
Ukraine
4%
Others
7%
• Top 6: NZ, Russia, US, Canada, Australia, Ukraine
• Top 6: 94%
• Top 2: NZ and Russia: 60%
• In 2014: logs import was 51.19 million m3, increased by 13%
• Coniferous: 70%

Main countries of imported hardwood logs in 2014
Logs import - hardwood
Papua New
Guinea
21%
Solomon
14%
Russia
9%Myanmar
5%
Mozambique
4%
Republic of the
Congo
4%
USA
4%
Nigeria
3%
Equatorial
Guinea
3%
Cameroon
3%
Others
30%
• Countries: scattered
• Top 10: 70%
– Temperate hardwood logs: Russia and US, but only 13%
– Tropical hardwood logs: many tropical countries, PNG and Solomon

Sawnwood import - coniferous
Main countries of imported coniferous sawnwood in 2014
Russia
41%
Canada
36%
Chile
5%
USA
5%
Swedish
2%
Finland
2%
New Zealand
2%
Germany
2%
Brazil
1%
Argentina
1% Others
3%
• In 2014, sawnwood import: 25.75 million m3, increased by 7%
• Coniferous: 70%
– Top 2: Russia (7.21 million m3, 41%), Canada (6.57 million m3, 36%)
– Before 2014: Canada was more than Russia
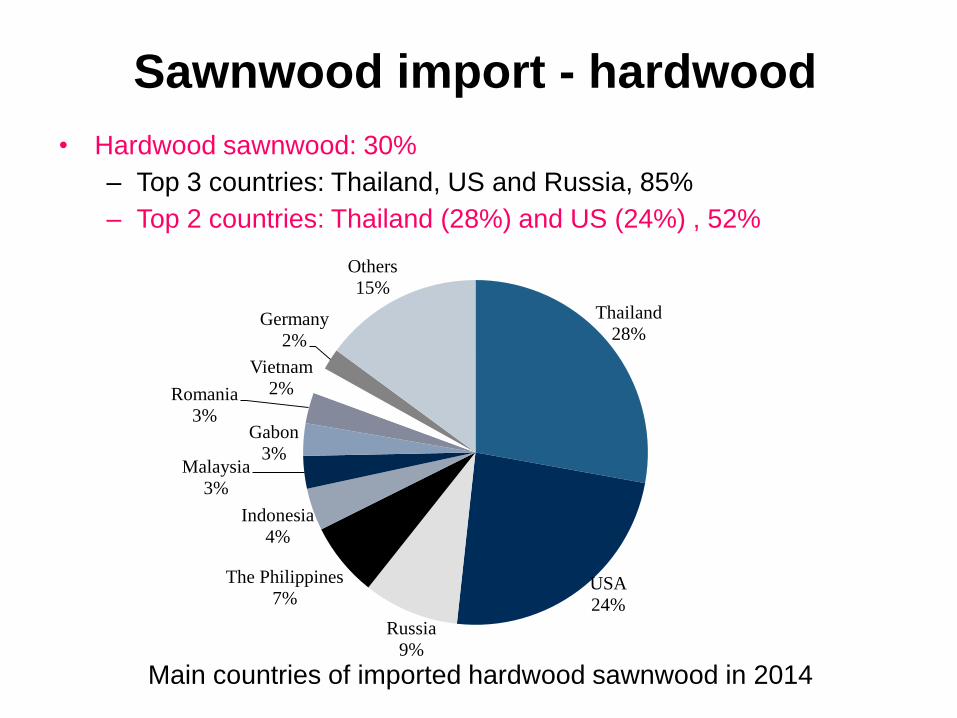
Sawnwood import - hardwood
Main countries of imported hardwood sawnwood in 2014
Thailand
28%
USA
24%
Russia
9%
The Philippines
7%
Indonesia
4%
Malaysia
3%
Gabon
3%
Romania
3%
Vietnam
2%
Germany
2%
Others
15%
• Hardwood sawnwood: 30%
– Top 3 countries: Thailand, US and Russia, 85%
– Top 2 countries: Thailand (28%) and US (24%) , 52%

Wood pulp import
Main countries of imported wood pulp in 2014
USA
23%
Canada
16%
Brazil
12%
Indonesia
7%
Chile
6%
Japan
4%
Russia
4%
Finland
4%
England
3%
Holland
1%
Others
20%
• In 2014, wood pulp import: 17.96 million ton, with US$ 12.1 billion, increase by 6.6% and 6.1% respectively
• Top 3 countries: US (23%), Canada (16%) and Brazil (12%)

Wood chip import
Main countries of imported wood chip in 2014
Vietnam
45%
Australia
24%
Indonesia
14%
Thailand
12%
Others
5%
• In 2014, wood pulp import: 8.86 million ton, with US$ 1.54 billion, decrease by 6% and 22% respectively
• Top 4 countries: Viet Nam (45%), Australia (24%), Indonesia (14%) and Thailand (12%), totally 95%

1.2 Timber export

Timber products export in 2014
Proportion of China's major wood products exports value
wood furniture
41%
paper and board
27%
plywood
11%
wood products
10%
others
11%
• Total timber products export: US$ 53.5 billion, increased by 12%
• Top 4 products: furniture, paper (and paperboard, paper products), plywood and wooden products, 89%

Furniture export
China's wooden furniture export countries
USA
32%
Japan
7%
England
6%Germany
5%
Austialia
4%
French
4%
Canada
3%
Holland
3%
Hong Kong
3%
Korea
2%
Others
31%
• In 2014, furniture export: 31.63 million pieces, valued at US$ 22.1 billion
– Increased respectively by 10% and 14%
• Top 4: US (32%), Japan (7%), UK (6%), Germany (5%), about half
– If considering EU, EU should be second following US
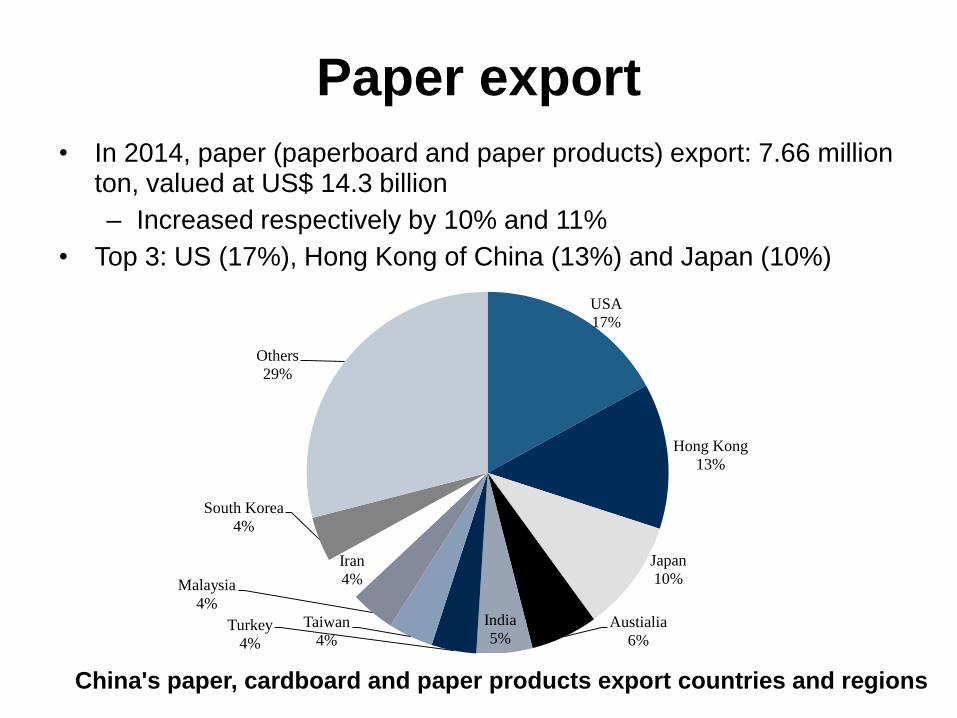
Paper export
USA
17%
Hong Kong
13%
Japan
10%
Austialia
6%
India
5%Turkey
4%
Taiwan
4%
Malaysia
4%
Iran
4%
South Korea
4%
Others
29%
China's paper, cardboard and paper products export countries and regions
• In 2014, paper (paperboard and paper products) export: 7.66 million ton, valued at US$ 14.3 billion
– Increased respectively by 10% and 11%
• Top 3: US (17%), Hong Kong of China (13%) and Japan (10%)
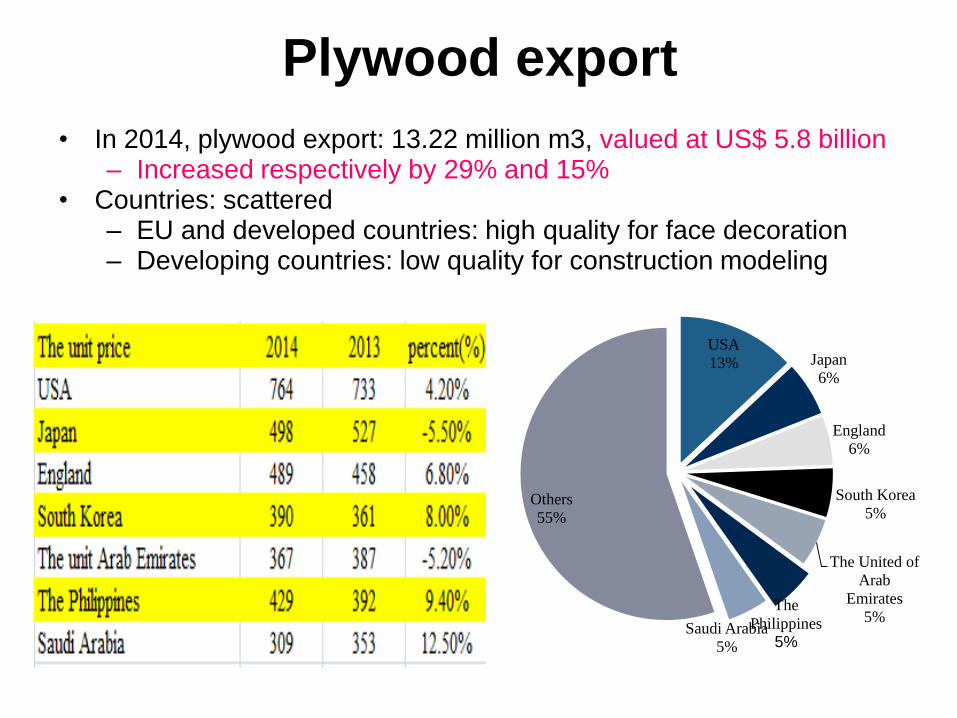
Plywood export
USA
13% Japan
6%
England
6%
South Korea
5%
The United of
Arab
Emirates
5%The
Philippines
5%Saudi Arabia
5%
Others
55%
• In 2014, plywood export: 13.22 million m3, valued at US$ 5.8 billion– Increased respectively by 29% and 15%
• Countries: scattered– EU and developed countries: high quality for face decoration– Developing countries: low quality for construction modeling

Wooden products export
USA
28%
Japan
15%
England
5%Germany
4%Hong Kong
4%South Korea
4%
Holland
3%
Australia
3%
Canada
3%
Taiwan Province
2%
Others
29%
China's wood products export countries in 2014
• In 2014, plywood export: US$ 5.5 billion, increased 15%
• Mainly export to: US (28%), Japan (15%), UK (5%)

Timber trade in 2015
• In 2014 and before: quite good!
• But in 2015……
• Import:
– Logs import: 44.568 million m3, decreased by 12.94%
• Reasons: too much import in 2014, economic growth slowdown
– Sawnwood import: 26.5769 million, increased by 3.59%
• Reasons: Guangdong, increased a lot; Other areas: decreased
• Export:
– Plywood and composite flooring export: 10.7668 million m3, decreased by 18.53%
• Reasons: world economic recession with less demand such as Japan, Saudi Arabia, Korea, higher standard requirement by US
– Wooden furniture and wooden products export: US$ 22.855 billion, increased by 3.13%, but slower than 2014 (14%)
• Reasons: slowdown world economic growth, currency depreciation by many countries
• Conclusion: Too bad! Both for imported logs market, and for exported plywood and furniture market

2. Timber industry

Land area: 9.6 million km2; Population: billion
China at A Glance

绿奥诺Timber/woodworking industry
Concentration

Timber production in 2010
• Mostly big increase compared with previous year
• Logs: 80.8962 million m3, increased by 14.45%
• Sawnwood: 37.2263 million m3, increased by 15.26%
• Wood based panel: 153.6083 million m3, increased by 33.03%
– Plywood: 71.3966 million m3, increased by 60.40%
– Fiberboard: 43.5454 million m3, increased by 24.82%
– Particleboard: 12.642 million m3, decreased by 11.66%
– Other panel: 26.0243 million m3, increased by 19.61%
• Wood and bamboo flooring: 479 million, increased by 26.92%
• Wooden furniture: 260.73 million pieces, increased by 27.18%
• Wood pulp: 7.08 million ton, increased by 28.49%

Timber production in 2011
• All big increase compared with previous year
• Logs: 81.4592 million m3, around the same as previous year
• Sawnwood: 44.6025 million m3, increased by 19.81%
Wood based panel: 209.1929 million m3, increased by 36.19%
– Plywood: 98.6963 million m3, increased by 38.24%
– Fibreboard: 55.6212 million m3, increased by 27.73%
– Particleboard: 25.5939 million m3, increased by 102.45%
– Other panel: 29.2815 million m3, increased by 12.52%
• Wood and bamboo flooring: 629 million m2, increased by 31.29%
• Wooden furniture: 248 million m3
• Wooden pulp: 8.23 million ton, increased by 16.24%

Timber production in 2012
• Mostly big increase compared with previous year, but lower than
before
• Logs: 81.7487 million m3, around the same as previous year
• Sawnwood: 55.6819 million m3, increased by 24.84%
• Wood based panel: 223.3579 million m3, increased by 6.77%
– Plywood: 109.8117 million m3, increased by 11.26%
– Fibreboard: 58.0035 million m3, increased by 4.28%
– Particleboard: 23.4955 million m3, increased by 8.20%
– Other panel: 32.0471 million m3, increased by 9.44%
• Wood and bamboo flooring: 604 million m2, decreased by 3.94%
• Wooden furniture: 238.97 million pieces, decreased by 3.64%
• Wood pulp: 8.1 million ton, decreased by 1.58

Timber production in 2013
• Mostly increase compared with previous year, much lower than
before
• Logs: 84.385 million m3, increased by 3.22
• Sawnwood: 62.976 million m3, increased by 13.10%
• Wood passed panel: 255.5991 million m3, increased by 14.43%
• Wood and bamboo flooring: 689 million m2, increased by 14.06%
• Wooden furniture: 236.4635 million pieces, decreased by 1.05%
• Wood pulp: 8.82 million ton, increased by 8.89%

Timber production in 2014
• Mostly increase compared with previous year, but much lower
than before
• Logs: 82.333 million m3, around the same as previous year
• Sawnwood: 68.3698 million m3, increased by 8.56%
• Wood based panel: 273.7179 million m3, increased by 7.09%
• Wood and bamboo flooring: 760 million m2, increased by 10.30%
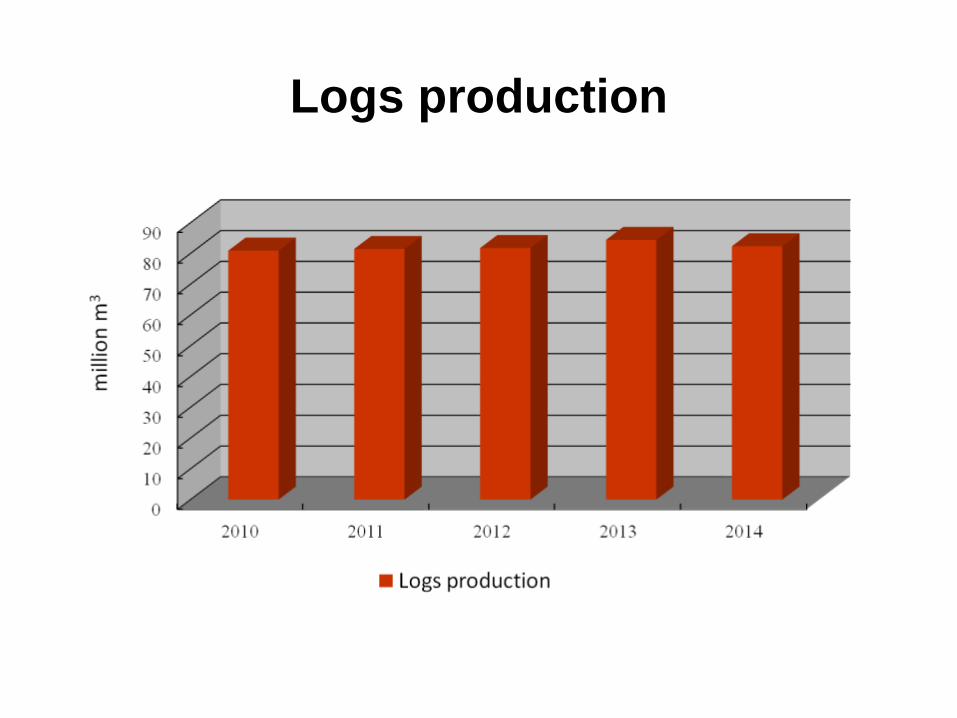
Logs production

Sawnwood production

Wood based panel production

Wood and bamboo flooring production

3. Challenges
– 3.1 Traditional challenges
– 3.2 New challenges

3.1 Traditional challenges

Traditional challenges (2-1)
• Serious challenges: for last 5 years
• Domestic:
– Production cost: increases
• Labor costs: increase
• Land cost: increase
• Raw materials: increase
• Oils: increased before, decreased right now
– Currency rate: appreciate a lot, only depreciate a little recently
• External:
– World economic recession, which decreases export
– Trade friction increases (anti-dumping and anti-subsidy)
– Legality issue (diligent and discipline)
Traditional challenges (2-2)
• Serious challenges: for last 5 years
• Consequences:
– Wood and woodmaking industry is not very profitable
– Export oriented companies very much rely on tax refund (even
caring for only 1% of fluctuation)
– Hundreds of mills close down
– Thousands people unemployed
• Of course, situation across country varies
– Some area such as Guangdong, Zhejiang etc is general OK
– Some big companies, especially with higher quality products
is generally OK

3.2 New challenges

New challenges in 2015 (2-1)
• The situation is getting a little bit worse in 2015
• National general macro situation
– Economic slowdown, leading to less demand: both globally
and in China
• China’s GDP growth: 6.9% in 2015, the lowest in 30 years
– Real estate slowdown
• Huge Stock in most of cities, only except a few very big
cities such as Beijing, Shanghai, Guangzhou etc
• Recent policy: might alleviate the situation but not much
• Forestry sector situation
– Domestic: too much timber imported in 2014, while not too
much domestic demand, not well sold out
– External: Stricter DDS requirement for timber export,
especially to EU

New challenges in 2015 (2-2)
• The situation is getting a little bit worse
• Consequences in 2015
– Some ports stock much logs (NZ logs in Zhangjiagang etc)
– Some industries bases such as Dongguan etc: more mills
closed, especially for small companies and with lower quality
products
• The only good news is that the oil price is going down, but
timber industry does not consume too much oil

Thank you!
Recommended