Program on ReproductiveHealth and the Environment
Chemicals in the indoor environment:Implications for human exposure and health
Veena Singla, PhDAssociate Director, Science & PolicyUCSF PRHE

RESEARCH CLINICAL ENGAGEMENT POLICY
ResearchTranslation
EpidemiologyExposureScience
Basic Science
Healthy moms & kids
Transform Clinical Care and Public Policy

Roadmap Why indoor environment? Consumer product chemicals in
indoor dust Implications for human health Highlights for Program

People in developed countries spend ~90% of time indoors
Klepeis 2001

Indoor environments are unique microenvironments
RadonMoldPest allergensStructural & indoor pesticidesLead
FormaldehydeBenzeneFlame retardantsPhthalates
Weschler & Nazaroff, 2008; Weschler 2009; Bradman 2012; Bolden 2015

Chemicals from products affect indoor environmental quality
• Furniture• Electronics• Wire & cable• Flooring• Wall
coverings• Paint• Personal care
products• Beauty
products• Adhesives• Stain & water
resistance
• Formaldehyde• Benzene• Toluene
VOCs• Flame
retardants• Phthalates• Fluorinated
chemicals• Phenolic
chemicals• Fragrances
SVOCs
Weschler 2009; Rudel 2009; Bolden 2015

Chemicals from products: human exposure
~2,000 chemicalsStrongest predictor of detection in human biomonitoring:Indoor/ consumer product use
Wambaugh 2013

Exposure in the indoor environment: Product Emission Exposure
InhalationAir-to-skin
AIR
DUST
InhalationIngestion (hand to mouth)Dust-to-skin
Direct product contact
VOCs
SVOCs
SVOCs
SVOCs
SVOCs
SVOCs
Weschler & Nazaroff, 2008; Weschler 2012; Rudel 2003
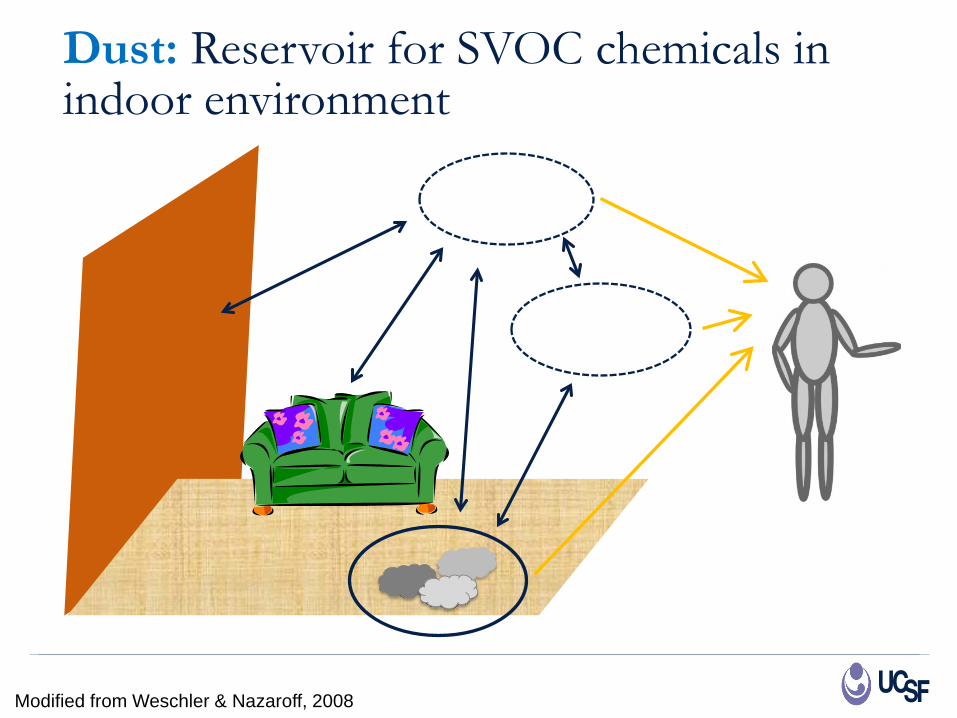
Dust: Reservoir for SVOC chemicals in indoor environment
Modified from Weschler & Nazaroff, 2008

Consumer product chemicals in indoor dust: a quantitative meta-analysis of U.S. studies
Susanna D. Mitro, Robin. E. Dodson, Veena Singla, Gary Adamkiewicz, Angelo
F. Elmi, Monica K. Tilly, Ami R. ZotaEnvironmental Science & Technology, 2016

Our approach
Criteria• SVOC consumer
product chemicals• Current use• Dust from U.S. indoor
environment• Vacuum cleaner
collected
Literature Search
Descriptive Statistics
Meta-Analysis
Intake Assessment
Hazard Identification

5 SVOC consumer product chemical classesPhthalates and
alternatives Environmental phenols Fragrances
Replacement flame retardants(RFRs)
Fluorinated chemicals (PFASs)
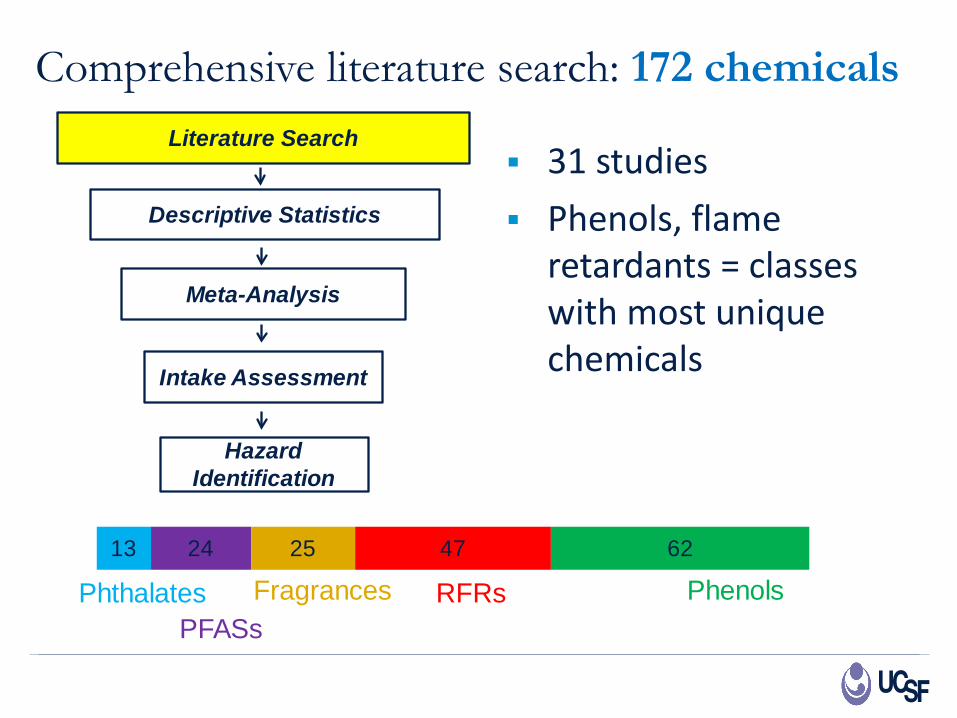
Comprehensive literature search: 172 chemicals
31 studies Phenols, flame
retardants = classes with most unique chemicals
Literature Search
Meta-Analysis
Intake Assessment
Hazard Identification
Descriptive Statistics
13 24 25 47 62
RFRsPhthalates PhenolsFragrancesPFASs

Descriptive info and statistics: 74 chemicals
Chemicals measured in ≥2 datasets
96% of fragrances measured in only 1 dataset
Literature Search
Descriptive Statistics
Meta-Analysis
Intake Assessment
Hazard Identification
11 19 1 20 23 RFRs
Phthalates
Phenols
FragrancesPFASs

Meta-analysis: 45 chemicals Chemicals measured in
≥3 datasets Geometric Mean (GM)
and Geometric Standard Deviation (GSD) available
Calculated pooled GM and 95% Confidence Interval
Literature Search
Descriptive Statistics
Meta-Analysis
Intake Assessment
Hazard Identification
8 11 1 15 10RFRs
Phthalates
Phenols
FragrancesPFASs

Samples taken in 14 states

Samples mostly from home environments
RFRs
Phthalates
Phenols
FragrancesPFASs
Home Car Non-residential
Mixture

Ten chemicals consistently detected across data sets
Chemical # datasets Detected
DEHP 8 100%
DEHA 4 100%
HHCB 3 100%
BBzP 8 98-100%
TPHP 8 98-100%
TDCIPP 14 95-100%
DnBP 7 95-100%
DiBP 7 95-100%
HBCDD (and isomers) 10 92-100%
MeP 3 90-100%
RFRsPhthalates
PhenolsFragrances
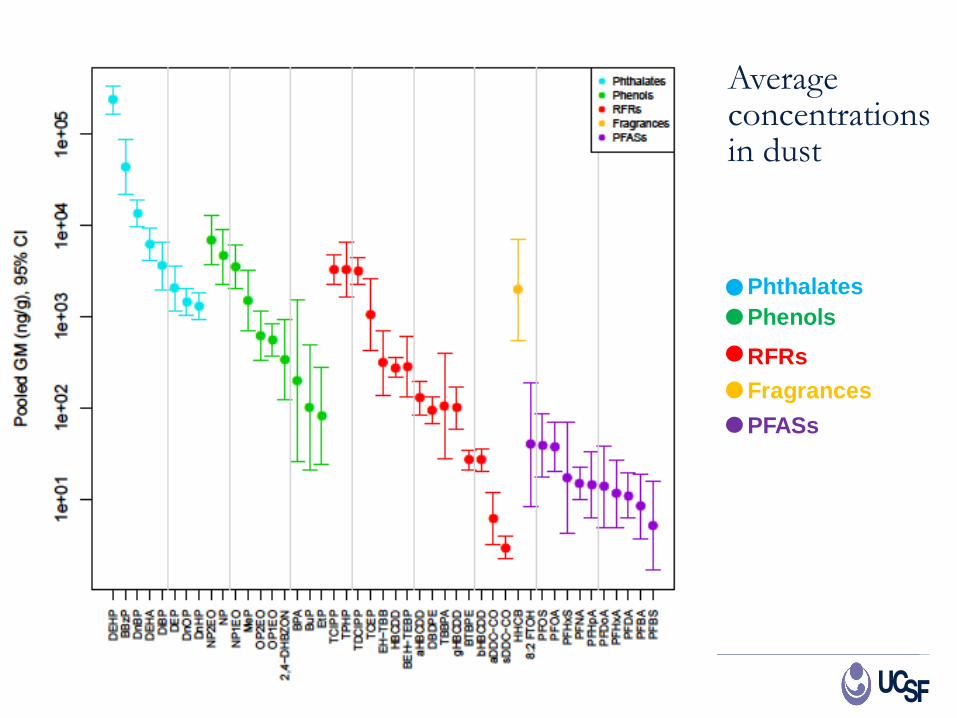
Average concentrations in dust
RFRsFragrances
PhthalatesPhenols
PFASs

Intake Assessment Estimated total
residential intake Adult female Child (3-6 years old)
Literature Search
Descriptive Statistics
Meta-Analysis
Intake Assessment
Hazard Identification

Child: Highest estimated residential intake of flame retardants and phthalates
Estim
ated
inta
ke, u
g/kg
/day RFRs
Phthalates
Phenols
FragrancesPFASs

Dust contribution to exposure varies by chemical
IngestionInhalationDermal from air

Hazard Identification: 35 chemicals
California Safer Consumer Products Candidate Chemical list
Hazard traits identified by authoritative bodies
Literature Search
Descriptive Statistics
Meta-Analysis
Intake Assessment
Hazard Identification

High intake chemicals have multiple hazards
Estimated intake
RFRs
Phthalates
Phenols
PFASs

Some dust levels exceed EPA screening levels for cancer health risks
200
2000
20000
200000
2000000
Chem
ical
con
cent
ratio
n in
dus
t (ng
/g)
BBP(phthalate)
DEHP(phthalate)
TCEP(flame retardant)
TDCIPP(flame retardant)
Average concentration in dust
Highest concentration in dust
EPA soil screening levelDust level exceeds EPA soil screening level

Summary Phthalates and phenols- highest levels in dust Phthalates and RFRs -highest estimated intakes Phthalates and PFASs- most hazard traits Daily co-exposure to multiple chemicals in indoor
environment Concern for cumulative exposures and impacts Some chemicals’ dust levels exceed EPA screening
benchmarks
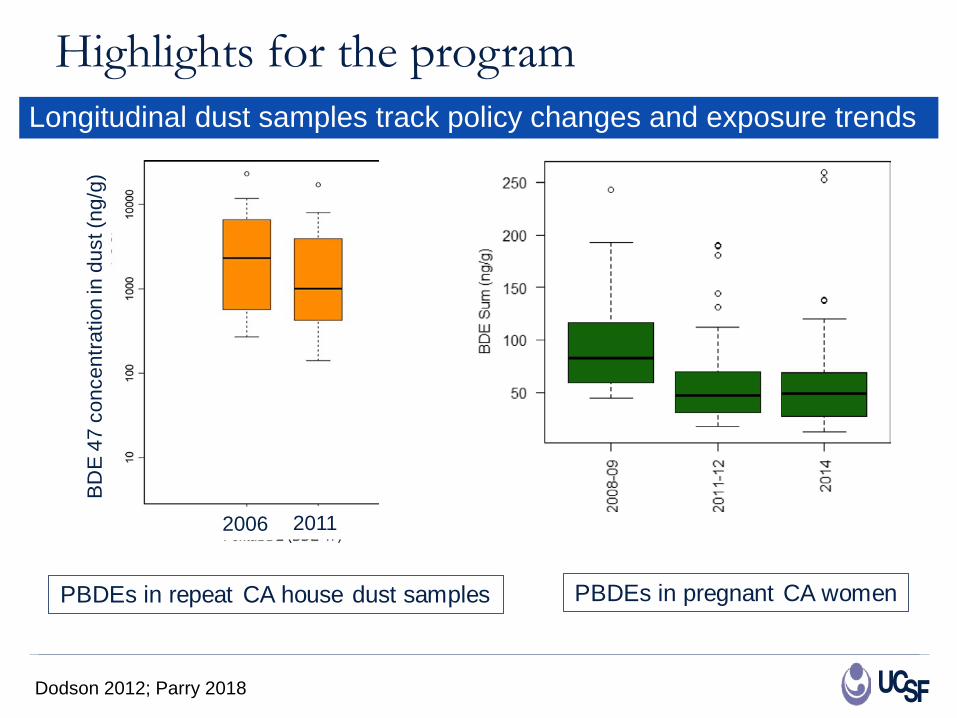
Highlights for the programLongitudinal dust samples track policy changes and exposure trends
2006 2011
BDE
47 c
once
ntra
tion
in d
ust (
ng/g
)
PBDEs in repeat CA house dust samples PBDEs in pregnant CA women
Dodson 2012; Parry 2018

Highlights for the program
Studies to explore contributions of indoor sources to exposures for priority chemicals- Intervention (ala FREES*) or other designs
Potential for complementary dust sampling CA AB2998 restricts flame retardants in 2020 -
track exposure trends
*Foam Replacement Environmental Exposure Study

Thank you!Program on Reproductive Health and the Environment
@UCSF.PRHE @UCSF_PRHE https://prheucsf.blog/
Recommended