The Analysis of Profitability – Chapter 11 p. 267
CHAPTER ELEVEN
The Analysis of Profitability
Concept Questions
C11.1 The two rates of return will be the same in either of the following conditions:
(a) The SPREAD is zero, that is, return on net operating assets equals net
borrowing cost.
(b) Financial leverage (FLEV) is zero, that is, financial assets equal
financial obligations.
C11.2 The two rates of return will be the same in either of the following conditions:
(a) The operating liability leverage spread (OLSPREAD) is zero, that is,
ROOA equals the implicit borrowing rate for operating liabilities.
(b) Operating liability leverage is zero, that is, the firm has no operating
liabilities.
C11.3 (a) Positive
(b) Negative
(c) Negative
(d) It depends on whether the operating liability leverage spread is positive
or negative
(e) Positive
(f) It depends on whether the operating spread is positive or negative
(g) Positive
Note: the advertising expense ratio (advertising/sales) might be high in the
current period, producing a negative effect on ROCE. But the large amount of
p. 268 Solutions Manual to accompany Financial Statement Analysis and Security Valuation
advertising might produce higher future sales, so could be regarded as a positive value
driver (and a positive driver of future ROCE).
C11.4 If the assets in which the cash from issuing debt is invested earn at a rate
greater than the borrowing cost of the debt, ROCE increases: shareholders earn from
the SPREAD.
C11.5 If a firm can generate income using the liabilities that are higher than the
implicit cost that creditors charge for the credit, it increases its RNOA.
C11.6 Not necessarily. If the supplier charges a higher price for the goods to
compensate him for financing the credit, buying on credit may not be favorable. The
operating liability leverage created by buying on credit will be favorable if the return
earned on the inventory is greater than the implicit cost the supplier charges for the
credit.
C11.7 The first part of the statement is correct: A drop in the advertising expense
ratio increases current ROCE. But a drop in advertising might damage share value
as future ROCE might drop because of reduced sales.
C11.8 Return on common equity (ROCE) is affected by leverage. If a firm borrows,
pays dividends, or makes a stock repurchase, it can increase its ROCE. But its return
on operations (RNOA) may not change, or even decline. Always examine increases
in ROCE to see if they are due to leverage.

The Analysis of Profitability – Chapter 11 p. 269
C11.9 If the firm loses the ability to deduct interest expense for tax purposes, it does
not get the tax benefit of debt and so increases its after-tax borrowing cost. Of course
the firm also may find that creditors will charge a higher before-tax borrowing rate if
it is making losses.
C11.10 The inventory yield is a measure of the profitability of inventory, the profit
from selling inventory relative to the inventory carried. If gross profit falls or
inventories increase, the ratio will fall.
C11.11 ROA mixes operating and financial activities. Financial assets are in the
denominator and operating liabilities are missing from the denominator. Interest
income is in the numerator. This calculation yields a low profitability measure, as the
return on financial assets is typically lower than operating profitability and the effect
of operating liabilities --- to lever up operating profitability --- is not included.
Exercises
E11.1 Leveraging Equations
(a) By the stocks and flows equation for equity
net dividends = earnings - CSE
= 207 300
= (93) (i.e. net capital contribution)

p. 270 Solutions Manual to accompany Financial Statement Analysis and Security Valuation
(This answer assumes no dirty-surplus accounting)
2002 2003 Average
NOA 1,900 2,400 2,150
NFO 1,000 1,200 1,100
CSE 900 1,200 1,050
ROCE = 207/1,050 = 19.71%
Operating income (OI) = Sales operating expense tax on
OI
= 2,100 1,677 [106 + (0.34 x 110)]
= 279.6
RNOA = OI/ave. NOA = 279.6/2,150 = 13.0%
ROCE = [PM ATO] + [FLEV (RNOA NBC)]
PM = OI/Sales = 279.6/2,100 = 0.1331 (or 13.31%)
ATO = Sales/av. NOA = 2,100/2,150 = 0.9767
FLEV = Ave. NFO/av. NOA = 1,100/1,050 = 1.0476
NBC = Net interest expense/ave. NFO = (110 0.66)/1,100 = 6.6%
So,
19.71% = (0.1331 0.9767) + [1.0476 (13.0% - 6.6%)]
(b)
2002 2003 Average
Operating assets 2,000 2,700 2,350
Operating liabilities (100) (300) (200)
NOA 1,900 2,400 2,150
Implicit interest on operating liabilities (OL) = 200 4.5%
= 9
Return on operating assets (ROOA) = (OI + Implicit interest)/ave. OA
= (279.6 + 9)/2,350
= 12.28%
Operating liability leverage = OL/NOA

The Analysis of Profitability – Chapter 11 p. 271
= 150,2
200
= 0.093
So,
13.0% = 12.28% + [0.093 (12.28% - 4.5%)]
(c) This is the case of a net creditor firm (net financial assets).
Net dividends = 339 – 700
= (361)
ROCE = 339/3,050 = 11.11%
Operating income = 2,100 – 1,677 – (174 – (0.34 90))
= 279.6 (as before)
RNOA = 279.6/2,150 = 13.0% (as before)
Return on net financial assets (RNFA) = Net financial income/ave. FA
= 900
0.66 90
= 6.6%
FLEV = -900/3,050 = -0.295
PM and ATO are as before.
So,
11.11% = (0.1331 0.9767) – [0.295 (13.0% - 6.6%)]
E11.2 First-level Analysis of Financial Statements
(a) First reformulate the financial statements:
Reformulated Balance Sheets
2002 2001 Average
NOA 1,395 1,325 1,360
NFO 300 300 300

p. 272 Solutions Manual to accompany Financial Statement Analysis and Security Valuation
CSE 1,095 1,025 1,060
Reformulated Income Statement, 2002
Sales 3,295
Operating Expenses 3,048
247
Tax reported 61
Tax on NFE 9 70
OI 177
Net interest 27
Tax on interest 9
NFE 18
Comprehensive Income 159
CSE2002 = CSE2001 + Earnings2002 – Net Dividends2002
1,095 = 1,025 + 159 - 89
Stock repurchase = 89
(b) ROCE = 060,1
159 = 15.0%
RNOA = 360,1
177 = 13.0%
FLEV = 060,1
300 = 0.283
SPREAD = RNOA – NBC
= 13.0% - 6.0% = 7.0%
300
18 =
NFO
NFE = NBC
C – I = OI - NOA
= 177 – 70
= 107
(c) The ROCE of 15% is above a typical cost of capital of 10% - 12%. So
one might expect the shares to trade above book value. But, to trade at

The Analysis of Profitability – Chapter 11 p. 273
three times book value, the market has to see ROCE to be increasing in
the future or investment to be growing substantially.
E11.3 Relationship Between Rates of Return and Leverage
(a) ROCE = RNOA + [FLEV (RNOA – NBC)]
13.4% = 11.2% + [FLEV (11.2% - 4.5%)]
FLEV = 0.328
(b) RNOA = ROOA + (OLLEV OLSPREAD)
11.2% = 8.5% + [OLLEV (8.5% - 4.0%)]
OLLEV = 0.6
(c) First calculate NFO and CSE using the financial leverage ratio (CSE
NFO)
applied to the net operating assets of $405 million.
FLEV = CSE
NFO
NOA = CSE + NFO
So CSE
NFO = 1 + FLEV
= 1.328
As NOA = $405 million
Then CSE = 1.328
million 405$
= $305 million
and NFO = $100 million
Now distinguish operating and financing assets and liabilities
OLLEV = NOA
OL = 0.6

p. 274 Solutions Manual to accompany Financial Statement Analysis and Security Valuation
So OL = 0.6 $405 million
= $243 million
OA = NOA + OL
= 405 + 243
= $648 million
Financial assets = total assets – operating assets
= 715 – 648
= $67 million
Financial liabilities = NFO + financial assets
= 100 + 67
= $167 million
Reformulated Balance Sheet
Operating assets 648 Financial liabilities 167
Operating liabilities 243 Financial assets 67
100
Common equity 305
405 405
E11.4 Measures of Profitability and Leverage: Intel Corporation
(a) Return on assets (ROA) =
Assets Total Average
InterestMinority )(after tax ExpenseInterest incomeNet
176,30
62.0346,068
= 20.2%
Return on net operating assets =Assets OperatingNet Average
)(after tax income operating iveComprehens

The Analysis of Profitability – Chapter 11 p. 275
= 027,11
598,5
= 50.8%
Comprehensive operating income is calculated in the solution to E9.1 in Chapter 9, as
is NOA for 1998. NOA for 1997 is calculated as:
Common shareholders’ equity 19,295
less Net financial assets
Short-term debt
Current maturities of long-term debt
Long-term debt
Put warrant obligation
Cash equivalents
Short-term investments
Trading assets
Long-tem investments
(212)
(110)
(448)
(2,041)
4,000
5,630
195
1,839
8,853
10,442
Average NOA is the average of this 1997 number and the 1998 NOA of $11,611
million given in the solution to E9.1 in Chapter 9.
The RNOA is considerably higher then the ROA: the ROA is weighted down
by the low return on financial assets that obscures the profitability of operations. And
it ignores the leverage from operating liabilities.
(b) Debt-to-Equity = EquityCommon
sLiabilitie Total
= 295,19
585,9
= 0.50
[Some calculations of debt-to-equity include preferred stock in equity rather than
debt.]
Financial leverage (FLEV) = CSE
NFO
= 295,19
)853,8(
p. 276 Solutions Manual to accompany Financial Statement Analysis and Security Valuation
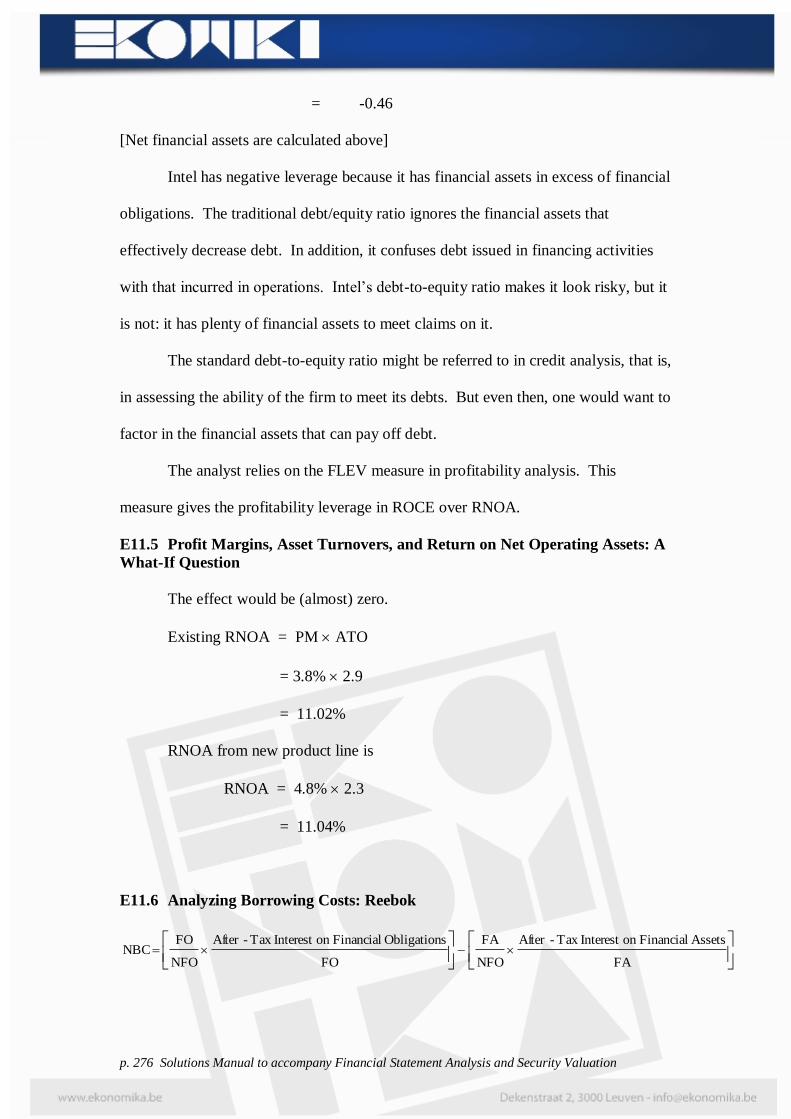
= -0.46
[Net financial assets are calculated above]
Intel has negative leverage because it has financial assets in excess of financial
obligations. The traditional debt/equity ratio ignores the financial assets that
effectively decrease debt. In addition, it confuses debt issued in financing activities
with that incurred in operations. Intel’s debt-to-equity ratio makes it look risky, but it
is not: it has plenty of financial assets to meet claims on it.
The standard debt-to-equity ratio might be referred to in credit analysis, that is,
in assessing the ability of the firm to meet its debts. But even then, one would want to
factor in the financial assets that can pay off debt.
The analyst relies on the FLEV measure in profitability analysis. This
measure gives the profitability leverage in ROCE over RNOA.
E11.5 Profit Margins, Asset Turnovers, and Return on Net Operating Assets: A
What-If Question
The effect would be (almost) zero.
Existing RNOA = PM ATO
= 3.8% 2.9
= 11.02%
RNOA from new product line is
RNOA = 4.8% 2.3
= 11.04%
E11.6 Analyzing Borrowing Costs: Reebok
FA
Assets Financialon Interest Tax -After
NFO
FA
FO
sObligation Financialon Interest Tax -After
NFO
FO NBC

The Analysis of Profitability – Chapter 11 p. 277
where FO = Financial obligations
FA = Financial assets
So,
NBC =
121
0.354)-(1 11
405
121
526
0.354) -(1 42
405
526
=
5.87%
405
1215.16%
405
526
= 4.94%
The components of the borrowing cost are
Borrowing cost on financial liabilities 5.16%
Return on financial assets 5.87%
The two components are weighted by the relative amounts of financial assets and
financial obligations.
The calculation is based on weighting ending balances by 1/3 and beginning
balances by 2/3. This weighting reflects the large debt issue for the stock repurchase
in August of 1996. But the weighting may not be appropriate for financial assets
(cash equivalents) or for other debt on the balance sheet.
Always check NBC calculations against the cost of debt in the debt footnote.
E11.7 A What-If Question: Grocery Retailers
Net operating assets for $120 million in sales and an ATO of 6.0 are $20
million.
An increase in sales of $15 million and an increase in inventory of $2 million
would increase the ATO to 2 20
25 120
= 6.59.
With a profit margin of 1.5%, the RNOA would be:
p. 278 Solutions Manual to accompany Financial Statement Analysis and Security Valuation
RNOA = 1.5% 6.59
= 9.89%
The current RNOA is:
RNOA = 1.6% 6.0
= 9.6%
So the membership program would increase RNOA slightly.

The Analysis of Profitability – Chapter 11 p. 279
E11.8 Financial Statement Analysis: Ben & Jerry’s
First reformulate the financial statements (as in Exercise 10.6 in Chapter 10):
Balance Sheets
1996 1995
Operating assets (OA):
Trade receivables 8.7 11.7
Inventories 15.4 12.6
Other current operating assets 7.1 7.5
Plant, net 65.1 59.6
Equity investments 1.0 1.0
Other long-term operating assets 2.5 2.4
99.8 94.8
Operating Liabilities (OL):
Trade payables and accrued expenses 17.4 16.5
Deferred tax liability 4.8 22.2 3.5 20.0
Net operating assets (NOA) 77.6 74.8
Net financial assets (NFA):
Short-term investments 36.6 35.4
Other receivables 0.3 0.9
Current debt (0.6) (0.5)
Long-term debt (31.1) 5.2 (32.0) 3.8
Common shareholders’ equity (CSE) 82.8 78.6
Averages for 1996:
NOA 76.2 OA 97.3
NFA 4.5 OL 21.1
CSE 80.7 76.2
Income Statements
1996 1995
Net sales 167.1 155.3
Cost of sales 115.2 109.1
Gross profit 51.9 46.2
SG&A expense (45.5) (36.4)
Other income (expense) 0.2 (0.6)
OI 6.6 9.2
Tax reported 2.4 3.5
Tax on financing income 0.1 2.5 (0.1) 3.4
OI after tax 4.1 5.8
Interest income 1.7 1.7
Interest expense (2.0) (1.5)
Net interest before tax (0.3) .2
p. 280 Solutions Manual to accompany Financial Statement Analysis and Security Valuation
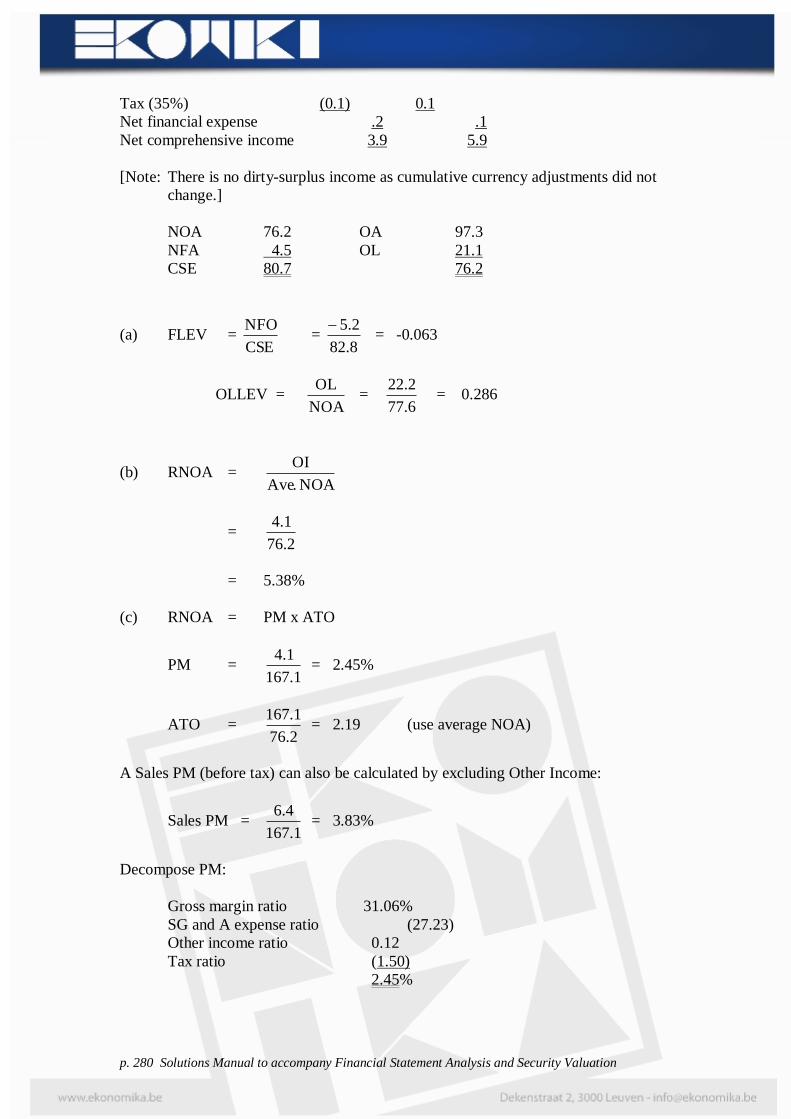
Tax (35%) (0.1) 0.1
Net financial expense .2 .1
Net comprehensive income 3.9 5.9
[Note: There is no dirty-surplus income as cumulative currency adjustments did not
change.]
NOA 76.2 OA 97.3
NFA 4.5 OL 21.1
CSE 80.7 76.2
(a) FLEV = CSE
NFO =
8.82
2.5 = -0.063
OLLEV = NOA
OL =
6.77
2.22 = 0.286
(b) RNOA = NOA .Ave
OI
= 2.76
1.4
= 5.38%
(c) RNOA = PM x ATO
PM = 1.167
1.4 = 2.45%
ATO = 2.76
1.167 = 2.19 (use average NOA)
A Sales PM (before tax) can also be calculated by excluding Other Income:
Sales PM = 1.167
4.6 = 3.83%
Decompose PM:
Gross margin ratio 31.06%
SG and A expense ratio (27.23)
Other income ratio 0.12
Tax ratio (1.50)
2.45%

The Analysis of Profitability – Chapter 11 p. 281
Decompose ATO
Turnover Inverse
Accounts receivable turnover = 2.10
1.167 = 16.38 0.0611
Inventory turnover = 0.14
1.167 = 11.94 0.0838
Other current asset turnover = 3.7
1.167 = 22.89 0.0437
PPE turnover = 4.62
1.167 = 2.68 0.3731
Other asset turnover = 5.3
1.167 = 47.74 0.0209
Operating liability turnover = 1.21
1.167 = (7.92) -0.1263
Total ATO 2.19 0.4563
[Average NOA items used in denominators.]
Analyze operating liability leverage:
RNOA = ROOA + (OLLEV OLSPREAD)
Implicit interest on operating liabilities = OL 4%
= 21.1 4.0%
= 0.844
(A 4% after-tax rate is assumed.)
Return on operating assets (ROOA) = 3.97
0.844 1.4
= 5.08%
Operating liability leverage = NOA
OL

p. 282 Solutions Manual to accompany Financial Statement Analysis and Security Valuation
= 2.76
1.21 (using averages for
year)
= 0.277
Operating liability leverage
Spread (OLSPREAD) = ROOA – 4.0%
= 1.08%
So,
RNOA = 5.08% + (0.277 1.08%)
= 5.38%

The Analysis of Profitability – Chapter 11 p. 283
Minicases
M11.1. Analysis with Equity Accounting and the Use of Proportional
Consolidation: AirTouch Communications
Introduction
This case provides an opportunity to discuss equity accounting, consolidation
accounting and segment accounting, and to appreciate the frustrations that can arise in
analyzing firms that use equity accounting for affiliate operations.
Equity accounting gives the net income share of affiliates but no detail on the
components of income. Thus this income is difficult, if not impossible, to analyze
unless one can get hold of the affiliates’ financial statements.
Consolidation accounting gives revenue and expense details of affiliates’
income, but the aggregation can be frustrating if it involves different lines of business.
Difficulties in one business and success in another may be obscured. Segmented
disclosures help to some extent but, as we see in this case, those disclosures are
limited. Look at the consolidated statements of News Corp which involve over 100
companies in many countries. They are difficult to penetrate, to say the least.
Before beginning the case, review the accounting for investments in
subsidiaries. See Accounting Clinics III and V. Also review the requirements for
segmented disclosures (in particular FASB Statement No.131).
A: Using the GAAP Presentation
Reformulation using the information in GAAP statements:

p. 284 Solutions Manual to accompany Financial Statement Analysis and Security Valuation
Reformulated Income Statement
(in millions of dollars)
Operating revenues $1,484
Cost of revenues 323
Selling and customer expenses 464
General, administrative and other 162
Depreciation and amortization 285 1,234
Operating income from sales before tax 250
Other income
Miscellaneous income 21
Merger costs (116) (95)
155
Tax as reported 98
Tax benefit of net debt 12 110
45
Minority interests in consolidated affiliates (46)
Operating income before equity income (1)
Equity in income of unconsolidated affiliates 202
Operating income after tax 201
Net financial expenses
Interest expense 36
Interest income ( 4)
32
Tax benefit (38%) 12
Net interest after tax 20
Preferred dividends 34 54
Net income applicable to common 147
This statement has allocated consolidated taxes to consolidated income but has
left equity income as a net number. So only the income of ventures where there is
more than a 50% interest can be analyzed:
Profit margin before tax and other income = 484,1
250 = 16.85%

The Analysis of Profitability – Chapter 11 p. 285
Profit margin after tax = 484,1
45 = 3.03%
Individual expense ratios can also be calculated.
But does this give a picture of the profitability of operations. What if the
profitability of unconsolidated affiliates were different from that of the consolidated
operations? And note that a large portion of the profits of the consolidated operations
accrue to the minority interests, not to AirTouch.
B: Using the Proportionate Presentation
The footnote on unconsolidated affiliates gives some information on the
German affiliate, Mannesmann. It has a profit margin before tax of 4.1%, but this is
based on operating income of $522 million that is considerably greater than the $250
million for the consolidated operations.
The proportionate presentation captures the profitability of AirTouch’s
interests:

p. 286 Solutions Manual to accompany Financial Statement Analysis and Security Valuation
$ % $ % $ % $ %
Revenues 1,116 100.0 1,079 100.0 102 100.0 2,297 100.0
Op. exp. before DA 673 60.3 629 58.3 72 70.6 1,400 60.9
443 39.7 450 41.7 30 29.4 897 39.1
Depr. and amort. 261 23.4 112 10.4 20 19.6 395 17.2
OI before tax 182 16.3 338 31.3 10 9.8 502 21.9
Tax reported 188 8.2
Tax benefit (below) 51 2.2
OI after tax 263 11.4
Interest and other 133
Tax effect 51
82
Preferred dividends 34
116
Net income to common 147
CompanyOperationsOperationsand PSC Operations
US Cellular International US Paging Total
Profit margins and their component parts are identical in this analysis, not only
for the total company but also for segments.

The Analysis of Profitability – Chapter 11 p. 287
M11.2 Analysis of the Return on Common Equity and Some “What-
If” Questions: VF Corporation
This case illustrates the profitability analysis in this chapter. To become
familiar with the firm, review the short description of the firm in the case and on the
firms’ web page at www.vfc.com . Also look at the background information of the
firm and its strategy in the annual 10-K report. The more the student is familiar with
a firm’s operations, the more the financial statement analysis comes to life.
The reformulated statements in the case are the basis for the analysis.
Question A: Analysis
Review the analysis tree in Figure 11.1 before proceeding.
1. First-level analysis
Average balance sheet amounts for calculations (in millions of
dollars):
Net operating assets (NOA) 2,596
Net financial obligations (NFO) 629
Common equity (CSE) 1,967
Operating assets (OA) 3,523
Operating liabilities (OL) 927
NOA 2,596
Financial assets (FA) 80
Financial obligations (FO) 709
NFO 629
Financial leverage affect:
ROCE = RNOA + [FLEV (RNOA – NBC)]
ROCE = 967,1
393 = 19.98%
RNOA = 596,2
434 = 16.72%

p. 288 Solutions Manual to accompany Financial Statement Analysis and Security Valuation
FLEV = 967,1
629 = 0.320
NBC = 629
41 = 6.52%
Proofing:
19.98% = 16.72% + [0.320 (16.72% - 6.52%)]
Operating liability leverage effect:
RNOA = ROOA + [OLLEV OLSPREAD]
Implicit interest on operating liabilities = 927 4.0% = 37
(using a 4% rate)
ROOA = 523,3
37 434 = 13.37%
OLLEV = 596,2
927 = 0.357
OLSPREAD = 13.37% - 4.0% = 9.37%
Proofing:
16.72% = 13.37% + (0.357 9.37%)

The Analysis of Profitability – Chapter 11 p. 289
In words:
VF Corporation’s 19.98% ROCE in 1998 was produced by a return on net
operating assets of 16.72% that was levered up by net financial leverage of 32% of
common equity. This leverage geared up a favorable spread of operating profitability
over the net after-tax borrowing cost of 6.52%.
VF’s operating profitability was also levered up by favorable operating
liability leverage of 36% of net operating assets: VF utilized operating credit to its
advantage.
2. Second-level analysis
RNOA = PM ATO
Profit Margin (PM) = 479,5
434 = 7.92%
Asset turnover (ATO) = 596,2
479,5 = 2.11
Proofing:
16.72% = 7.92% 2.11
3. Third-level analysis
Analysis of profit margin of 7.92%:
Gross margin = 479,5
892,1 = 34.53%
Miscellaneous income to sales = 479,5
3 = 0.05
Advertising expense ratio = 479,5
288 = (5.26)
Administrative expense ratio = 479,5
911 = (16.63)

p. 290 Solutions Manual to accompany Financial Statement Analysis and Security Valuation
Other expense ratio = 479,5
9 = (0.16)
Other income ratio = 479,5
11 = 0.20
PM before tax = 479,5
699 = 12.76
Tax ratio = 479,5
265 = 4.84
PM = 479,5
434 = 7.92
In words:
A dollar of sales yielded 34.53 cents of profit after cost of the goods
sold. Advertising to maintain the sales absorbed 5.26 cents for every dollar of sales
and administrative expenses absorbed 16.63 cents. After taxes of 4.84 cents per dollar
of sales and some minor items, the firm produced 7.92 cents of profit for a dollar of
sales.
Analysis of asset turnover of 2.11:
Reciprocal of
Turnover
Turnover
Accounts receivable turnover = 649
479,5 8.47 0.118
Inventory turnover = 865
479,5 6.33 0.158
PPE turnover = 741
479,5 7.39 0.135
Intangible turnover = 883
479,5 6.20 0.161
Deferred asset turnover = 191
479,5 28.69 0.035
Other asset turnover = 197
479,5 27.81 0.036

The Analysis of Profitability – Chapter 11 p. 291
Operating liability turnover = 927
479,5 (5.91) (0.169)
ATO 2.11 0.474
In words:
VF utilized investment in net operating assets to generate $2.11 dollar of sales
for a dollar of investment. Or, stated differently, each dollar of sales used 47.4 cents
of net operating assets, including an investment in accounts receivable of 11.8 cents,
inventory of 15.8 cents, PPE of 13.5 cents, and goodwill on purchased firms of 16.1
cents. The asset turnover was levered up by operating liabilities of 16.9 cents per
dollar of sales.
Analysis of net borrowing cost of 6.52%:
Net interest cost before tax was 8.9% of net financial obligations and 5.5%
after tax. Preferred stock added to the borrowing cost, in the form of preferred
dividends and a loss on conversion of preferred stock to common.
A qualifying note: Calculations are based on averages of beginning and ending
balance sheet amounts. If balances did not change evenly over the year, there will be
approximations in the calculations. Note particularly the large percentage drop in
cash equivalents and the increase in short-term borrowings.
Question B: What-if Questions
(1) At the point where RNOA = NBC, that is, if RNOA fell below 6.52%.
But note that 6.52% includes the loss on the redemption of preferred stock
which may be temporary. So the leverage indifference point will be at the “core”
borrowing rate of 393,629
357,38= 6.09% that includes preferred dividends but excludes the
loss.

p. 292 Solutions Manual to accompany Financial Statement Analysis and Security Valuation
(2) This financing transaction will have no effect on RNOA.
(3) There would be no effect on ROCE because net financial obligations
and leverage will not be affected: the cash equivalents are netted out against debt in
the NFO, so actually using the cash to pay off debt will not affect the NFO. (There
would also be a small change in the net borrowing cost if the interest rate on the cash
equivalents is different from the borrowing rate for debt.)
(4) ROCE would increase because of an increase in leverage:
1998 1997 Average
NFO, as is 774 485
Liquidation of financial assets 48 48
NFO, as is 822 533 678
CSE, as is 2,066 1,867
Share repurchase 48 48
2,018 1,819 1,919
Financial leverage (FLEV), as is 0.320
Financial leverage (FLEV), as is 0.353
As if ROCE = RNOA + [FLEV + SPREAD]
= 16.72% + 0.353 10.2%
= 20.32%
(5) If prices of inputs were to drop by the amount of the imputed interest
on the credit, the operating income (at an implicit after-tax borrowing rate of 4%)
would be:
Average payables x 4% = $321 0.04 = $ 13
Operating income, as is 434
Operating income, as is 447
NOA, as is 2,596
Loss of payables 321
NOA, as is 2,917
RNOA, as is 16.72%
RNOA, as if = 917,2
447 15.32%

The Analysis of Profitability – Chapter 11 p. 293
As if RNOA = ROOA + (As if OLLEV As if OLSPREAD)
= 13.37% +
%37.9
917,2
606
= 15.32%
(6) ROCE would, of course, be reduced by the change in RNOA from
16.72% to 15.32%. But two other things will change:
1. The operating SPREAD will change because the RNOA changes.
2. The firm will have to finance the purchase of inventory with cash.
Spread effect:
SPREAD, as is = 16.72% - 6.52% = 10.2%
SPREAD, as is = 15.32% - 6.52% = 8.8%
ROCE, as if = 15.32% + (0.320 8.8%)
= 18.14%
Financial leverage effect:
Suppose the firm were to issue shares to raise the cash (with no change in net
debt).
CSE, as is = 1,967
Share issue = 321
CSE, as is = 2,288
Financial leverage, as if = 288,2
629= 0.275
ROCE, as if = 15.32% + (0.275 8.8%)
= 17.74%
The firm might borrow to get the cash in which case FLEV would be 0.483. If
the borrowing were at the same net borrowing cost as existing debt, then ROCE
would be:
ROCE, as if = 15.32% + (0.483 8.8%)
= 19.57%

p. 294 Solutions Manual to accompany Financial Statement Analysis and Security Valuation
Notice that the increase in leverage increases ROCE even though there is a drop in the
profitability of operations.
(7) An increase in gross profit margin of 1% (before tax) would translate
into an after-tax increase in the profit margin (PM) of 0.62% to 8.54% (for a 38% tax
rate). At the (as-is) asset turnover of 2.11, the RNOA would be:
A- is RNOA = 8.54% 2.11
= 18.02%
(8) As-if ROCE = 18.02% [0.320 (18.02% - 6.52%)]
= 21.70%
The valuation part of the question servers to introduce students to issues in
Part III of the book. Proceeding naively, the residual earnings model is applied, with
no growth, as follows:
capital ofcost
CSE capital) ofcost - (ROCE CSE VE
So, with an assumed cost of capital of 11% (say):
VE , as is = 1,967 + 0.11
1,967 0.11) - 1998.0(
= $3,573 million
VE , as if = 1,967 + 0.11
1,967 0.11) - 2170.0(
= $3,880 million
The complete answer can only be given with a forecast of growth in CSE that
will earn at the higher ROCE. The perceptive student will see that such growth will
imply a change in leverage and thus a drop in the cost of capital. Part III finesses this
problem.

The Analysis of Profitability – Chapter 11 p. 295
(9) Maintaining advertising expenses at the same level at 1997 would
increase the 1999 expense by $21.8 million or 0.4% of sales. The effect on the profit
margin, after tax, would have been to reduce it from 7.92% to 7.67%. At an ATO of
2.11, the RNOA would have been 16.19% rather than 16.72%.
The quality of the 1998 RNOA needs to be investigated: is VF generating
higher RNOA at the expense of lost futures sales and profits from reduced
advertising?
Question C: Further Questions
Any question can be addressed that affects the following:
Financial leverage
- debt issues
- debt-for-equity swaps
- stock issues
- change of dividend payout
New investment in net operating assets
Change in the structure of expenses
Growth or fall in sales
New product line
Efficiency of advertising: sales generated per dollar of advertising
“Cost cutting”
Change in tax rates
Change in borrowing costs
Recommended