CHAPTER 6: GEOCHEMICAL CYCLESCHAPTER 6: GEOCHEMICAL CYCLES
• Most abundant elements: oxygen (in solid earth!), iron (core), silicon (mantle), hydrogen (oceans), nitrogen, carbon, sulfur…
• The elemental composition of the Earth has remained essentially unchanged over its 4.5 Gyr history
– Extraterrestrial inputs (e.g., from meteorites, cometary material) have been relatively unimportant
– Escape to space has been restricted by gravity
• Biogeochemical cycling of these elements between the different reservoirs of the Earth system determines the composition of the Earth’s atmosphere and oceans, and the evolution of life
THE EARTH: ASSEMBLAGE OF ATOMS OF THE 92 NATURAL ELEMENTSTHE EARTH: ASSEMBLAGE OF ATOMS OF THE 92 NATURAL ELEMENTS

BIOGEOCHEMICAL CYCLING OF ELEMENTS:BIOGEOCHEMICAL CYCLING OF ELEMENTS:examples of major processesexamples of major processes
Physical exchange, redox chemistry, biochemistry are involved
Surfacereservoirs

HISTORY OF EARTH’S ATMOSPHEREHISTORY OF EARTH’S ATMOSPHERE
Outgassing
N2
CO2
H2Ooceans form
CO2
dissolves
Life forms in oceans
Onset ofphotosynthesis
O2 O2 reaches current levels; life invades continents
4.5 GyB.P
4 GyB.P.
3.5 GyB.P.
0.4 GyB.P. present

COMPARING THE ATMOSPHERES COMPARING THE ATMOSPHERES OF EARTH, VENUS, AND MARSOF EARTH, VENUS, AND MARS
Venus Earth Mars
Radius (km) 6100 6400 3400
Surface pressure (atm) 91 1 0.007
CO2 (mol/mol) 0.96 3x10⁻⁴ 0.95
N2 (mol/mol) 3.4x10⁻² 0.78 2.7x10⁻²
O2 (mol/mol) 6.9x10⁻⁵ 0.21 1.3x10⁻³
H2O (mol/mol) 3x10⁻³ 1x10⁻² 3x10⁻⁴

EVOLUTION OF OEVOLUTION OF O22 AND O AND O33 IN EARTH’S ATMOSPHERE IN EARTH’S ATMOSPHERE

Source: EARLY EARTH Oxygen for heavy-metal fans: Lyons TW, Reinhard CTNATURE Volume: 461 Issue: 7261 Pages: 179-181 SEP 10 2009

OXIDATION STATES OF NITROGENOXIDATION STATES OF NITROGENN has 5 electrons in valence shell N has 5 electrons in valence shell 9 oxidation states from –3 to +59 oxidation states from –3 to +5
-3 0 +1 +2 +3 +4 +5
NH3
Ammonia
NH4+
Ammonium
R1N(R2)R3
Organic N
N2 N2O
Nitrous
oxide
NO
Nitric oxide
HONO
Nitrous acid
NO2-
Nitrite
NO2
Nitrogen dioxide
HNO3
Nitric acid
NO3-
Nitrate
Decreasing oxidation number (reduction reactions)
Increasing oxidation number (oxidation reactions)
radical radical

THE NITROGEN CYCLE: MAJOR PROCESSESTHE NITROGEN CYCLE: MAJOR PROCESSES
ATMOSPHEREN2 NO
HNO3
NH3/NH4+ NO3
-
orgN
BIOSPHERE
LITHOSPHERE
combustionlightning
oxidation
deposition
assimilation
decay
nitrification
denitri-ficationbiofixation
burial weathering

Oceanic Nitrogen Processes


BOX MODEL OF THE NITROGEN CYCLEBOX MODEL OF THE NITROGEN CYCLE
Inventories in Tg NFlows in Tg N yr-1
NN22O: LOW-YIELD PRODUCT OF BACTERIAL O: LOW-YIELD PRODUCT OF BACTERIAL
NITRIFICATION AND DENITRIFICATIONNITRIFICATION AND DENITRIFICATIONImportant as
• source of NOx radicals in stratosphere• greenhouse gas
IPCC[2007]
NH4
++3/2O2 NO2
− + H2O + 2 H+
NO3
− + Org-C N2 + …
N2O
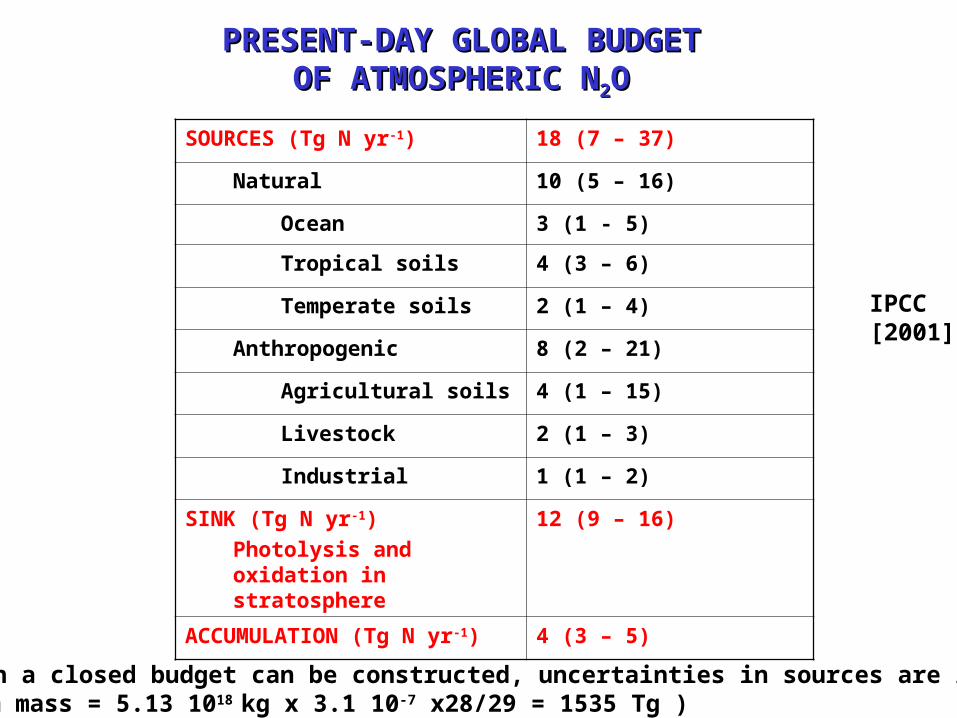
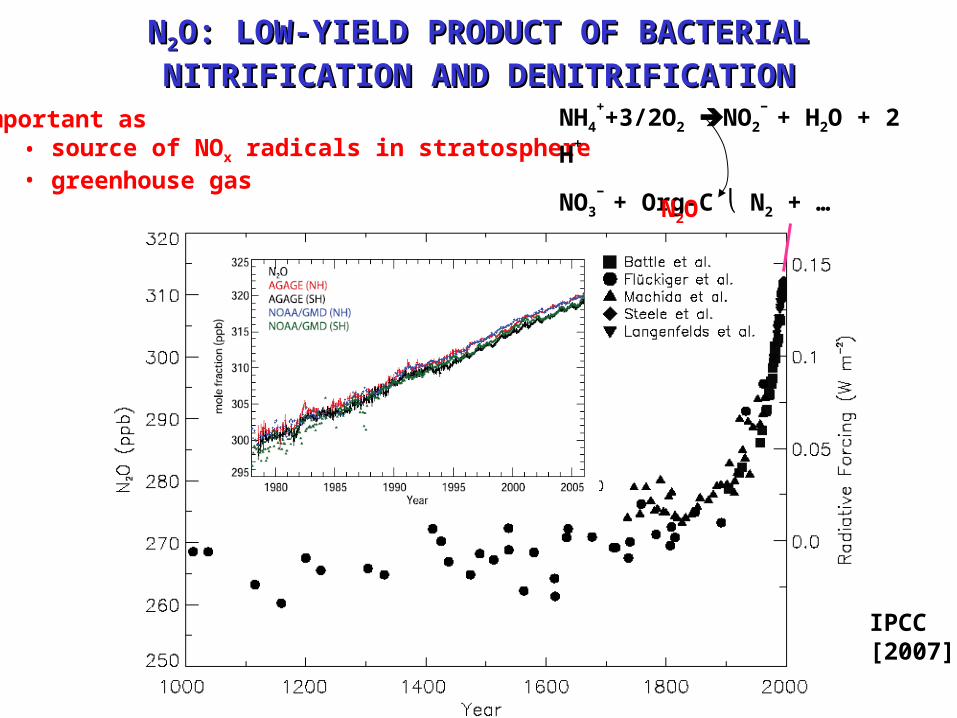
PRESENT-DAY GLOBAL BUDGET PRESENT-DAY GLOBAL BUDGET OF ATMOSPHERIC NOF ATMOSPHERIC N22O O
SOURCES (Tg N yr-1) 18 (7 – 37)
Natural 10 (5 – 16)
Ocean 3 (1 - 5)
Tropical soils 4 (3 – 6)
Temperate soils 2 (1 – 4)
Anthropogenic 8 (2 – 21)
Agricultural soils 4 (1 – 15)
Livestock 2 (1 – 3)
Industrial 1 (1 – 2)
SINK (Tg N yr-1)
Photolysis and oxidation in stratosphere
12 (9 – 16)
ACCUMULATION (Tg N yr-1) 4 (3 – 5)
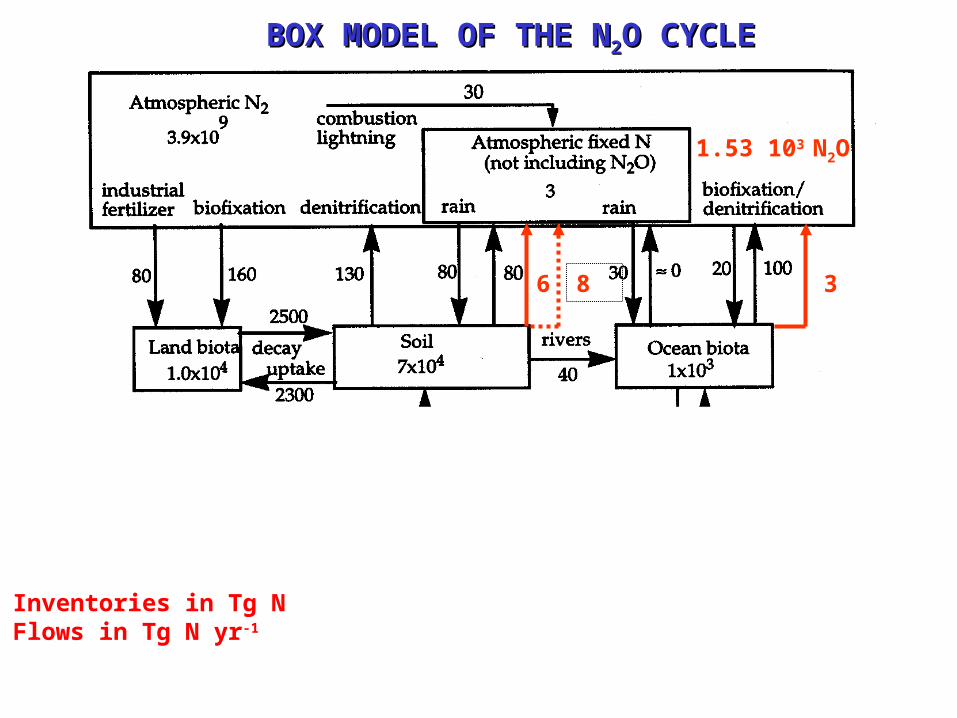
Although a closed budget can be constructed, uncertainties in sources are large! (N2O atm mass = 5.13 1018 kg x 3.1 10-7 x28/29 = 1535 Tg )
IPCC[2001]


Vertical and Horizontal Distributions of nutrients and dissolved oxygen in the sea
Summary
•Nutrients (N, P; Si) and trace elements (Cu, Zn, Fe [!]) used by plants and animals) are stripped from surface ocean and carried into the deep ocean by sedimentation.
•Re-mineralization creates excess concentrations of these elements, and depletion of oxygen, in deep water.
• The mean ratios of elements evolved during re-mineralization ("Redfield ratios") appear to be very uniform over the ocean, and possibly over geologic time, even though the ratios are not fixed in individual organisms.
• N2O is evolved during re-mineralization with a consistent ratio to O2 uptake. (Yield = ~3% N2O : NO3
- )(mole/mole; 6% as N)

Atlantic Ocean Deep Vertical Profile (Bermuda time series station)

Pacific: Average vertical distribution of temperature, salinity, and nutrients (nitrate+nitrite) at Ocean Station Aloha: 1988 to 1995. (World Ocean Circulation Experiment, Hawaii Ocean Time Series Project, University of Hawaii. Units: degrees Celsius, part-per-thousand of salt, and μmole/kg of nutrients).
http://www.soest.hawaii.edu/hioos/oceanatlas/verstructure.htm

GEOSECS WOCE
WOCE Pacific
O2 min

Figure 2 Vertical profiles of first-row transition metal ions and other elements in the N. Pacific.
A Butler Science 1998;281:207-209

( )

3.4e-3 moleN2O/mole O2 ; 0.03=N2O / NO3−

N2O and nutrients in the sea

GV launch in the rain, Anchorage, January, 2009 (HIPPO-1)
HIPPO boat: NCAR Gulfstream V "HIAPER"

HIPPO_2 Nov 2009
HIPPO_3 Apr 2010HIPPO_1 Jan 2009
preHIPPO Apr-Jun 2008
HIPPO itinerary

HIPPO-1 Atmospheric Structure (Pot'l T K): January, 2009, Mid-Pacific (Dateline) Cross section

CO2 CH4 COHIPPO sections, January 2009
0
5
10
1
5 k
m0
5
1
0
15
km
-60 -40 -20 0 20 40 60 80 -60 -40 -20 0 20 40 60 80 -60 -40 -20 0 20 40 60 80 LATITUDE
-60 -40 -20 0 20 40 60 80 -60 -40 -20 0 20 40 60 80 -60 -40 -20 0 20 40 60 80 N2O SF6 O3
0
5
10
1
5 k
m0
5
1
0
15
km
0
5
10
1
5 k
m0
5
1
0
15
km

Nov 2009 CO2 CH4 CO
Jan 2009 CO2CH4 CO
0
5
10
1
5 k
m0
5
1
0
15
km
-60 -40 -20 0 20 40 60 80 -60 -40 -20 0 20 40 60 80 -60 -40 -20 0 20 40 60 80 LATITUDE

January 2009
November 2009
-60 -40 -20 0 20 40 60 80 -60 -40 -20 0 20 40 60 80 LATITUDE
-60 -40 -20 0 20 40 60 80 -60 -40 -20 0 20 40 60 80
N2O O3
0
5
10
1
5 k
m0
5
1
0
15
km

Other tracers confirm N2O variable layers arise from different air origins
CO2
CH4
CO

Observed vs Model (ACTM)
Prabir Patra, Kentaro Ishijima (JAMSTEC)Eric Kort (Harvard)
HIPPO_1 Jan 2009
HIPPO Nitrous Oxide (N2O)
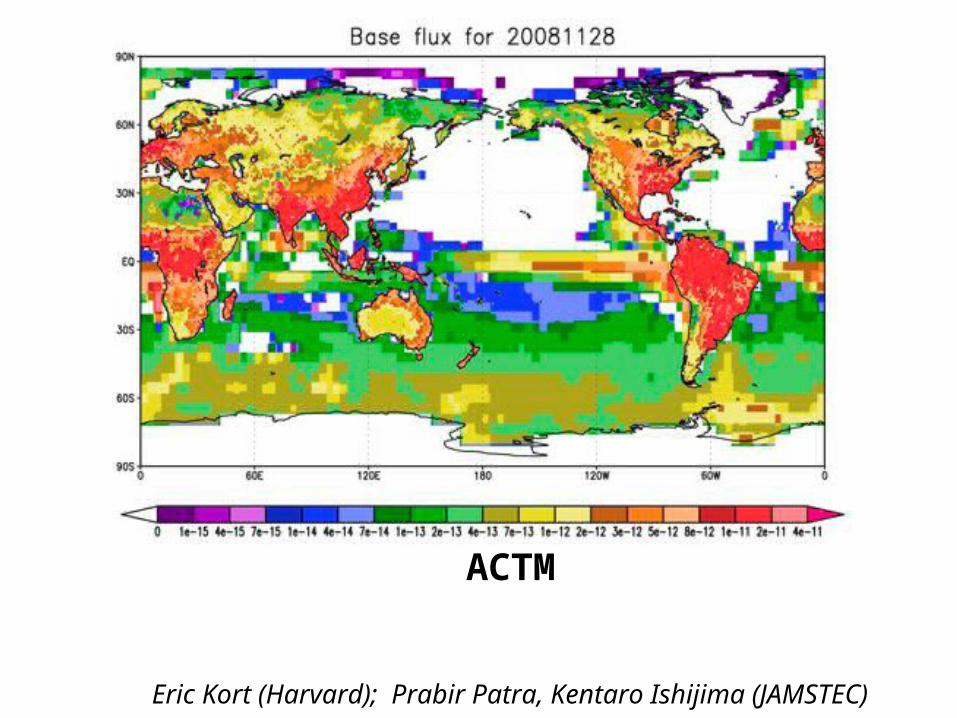
ACTM
Eric Kort (Harvard); Prabir Patra, Kentaro Ishijima (JAMSTEC)

ACTM model (optimized for ground stations)Excellent fit to surface observations
64 surface stations, monthly means (courtesy K. Ishijima)

Observed ACTM Prior
Jan., S-bound
Jan., N-bound
Nov., S-bound
Nov., N-bound

SF6
CH4
N2O
N2O HIPPO-2

Global Totals (Tg N in N2O, over 63 days)
6.4 Posterior 4.8 3.2 Prior 3.15
Global Distribution of N2O emissions: HIPPO cross sections, ACTM Model
Eric Kort (Harvard); Prabir Patra, Kentaro Ishijima (JAMSTEC)

Inversion results by regionHIPPO-1 HIPPO_2


BOX MODEL OF THE NITROGEN CYCLEBOX MODEL OF THE NITROGEN CYCLE
Inventories in Tg NFlows in Tg N yr-1
Inventories in Tg NFlows in Tg N yr-1
BOX MODEL OF THE NBOX MODEL OF THE N22O CYCLEO CYCLE
36 8
1.53 103 N2O

PRESENT-DAY GLOBAL BUDGET PRESENT-DAY GLOBAL BUDGET OF ATMOSPHERIC NOF ATMOSPHERIC N22O O
SOURCES (Tg N yr-1) 18 (7 – 37)
Natural 10 (5 – 16)
Ocean 3 (1 - 5)
Tropical soils 4 (3 – 6)
Temperate soils 2 (1 – 4)
Anthropogenic 8 (2 – 21)
Agricultural soils 4 (1 – 15)
Livestock 2 (1 – 3)
Industrial 1 (1 – 2)
SINK (Tg N yr-1)
Photolysis and oxidation in stratosphere
12 (9 – 16)
ACCUMULATION (Tg N yr-1) 4 (3 – 5)
Although a closed budget can be constructed, uncertainties in sources are large! (N2O atm mass = 5.13 1018 kg x 3.1 10-7 x28/29 = 1535 Tg )
IPCC[2001]

Short QuestionsShort Questions
1. Denitrification seems at first glance to be a terrible waste for the biosphere, jettisoning precious fixed nitrogen back to the atmospheric N2 reservoir. In fact, denitrification is essential for maintaining life in the interior of continents. Can you see why?
2. We showed that industrial fertilizer application and fossil fuel combustion have significantly increased the global nitrogen pool in the land biota and soil reservoirs over the past 200 years. Did it also significantly increase the global nitrogen pool in the surface ocean biota?
3. What might the be effects of a warmer climate on turnover rates for nitrogen in the environment ? For denitrification ?

FAST OXYGEN CYCLE: ATMOSPHERE-BIOSPHEREFAST OXYGEN CYCLE: ATMOSPHERE-BIOSPHERE
• Source of O2: photosynthesis
nCO2 + nH2O (CH2O)n + nO2
• Sink: respiration/decay
(CH2O)n + nO2 nCO2 + nH2O
O2
CO2
orgC
orgClitter
Photosynthesisless respiration
decay
O2 lifetime: 6000 years vs Photosynthesis ~200 PgO/yr
1.2x10⁶ Pg
4x10³ Pg
8x10² Pg

SLOW OXYGEN CYCLE: ATMOSPHERE-LITHOSPHERESLOW OXYGEN CYCLE: ATMOSPHERE-LITHOSPHERE
O2CO2
Compressionsubduction
Uplift
CONTINENTOCEAN
FeS2orgC
weatheringFe2O3
H2SO4
runoff
O2CO2
Photosynthesisdecay
orgC
burial
SEDIMENTS
microbesFeS2orgC
CO2orgC: 1x10⁷ Pg CFeS2: 5x10⁶ Pg S
O2: 1.2x10⁶ Pg OO2 lifetime: 3 million years

……however, abundance of organic carbon in however, abundance of organic carbon in biosphere/soil/ocean reservoirs is too small to control biosphere/soil/ocean reservoirs is too small to control
atmospheric Oatmospheric O2 2 levels levels

The heavier temperature lines 160,000 BP to present reflect more data points, not necessarily greater variability.
Source: Climate and Atmospheric History of the past 420,000 years from the Vostok Ice Core, Antarctica , by Petit J.R., Jouzel J., Raynaud D., Barkov N.I., Barnola J.M., Basile I., Bender M., Chappellaz J., Davis J. Delaygue G., Delmotte M. Kotlyakov V.M., Legrand M., Lipenkov V.M., Lorius C., Pépin L., Ritz C., Saltzman E., Stievenard M., Nature, 3 June 1999.
Antarctic Ice Core Data
CO2 varies over geologic time, within the range 190 – 280 ppm for the last 420,000 years. The variations correlate with climate: cold low CO2 . Is CO2 driving climate or vice versa?

GLOBAL PREINDUSTRIAL CARBON CYCLEGLOBAL PREINDUSTRIAL CARBON CYCLE
Inventories in Pg CFlows in Pg C a-1
1950
1960
1970
1980
1990
Year
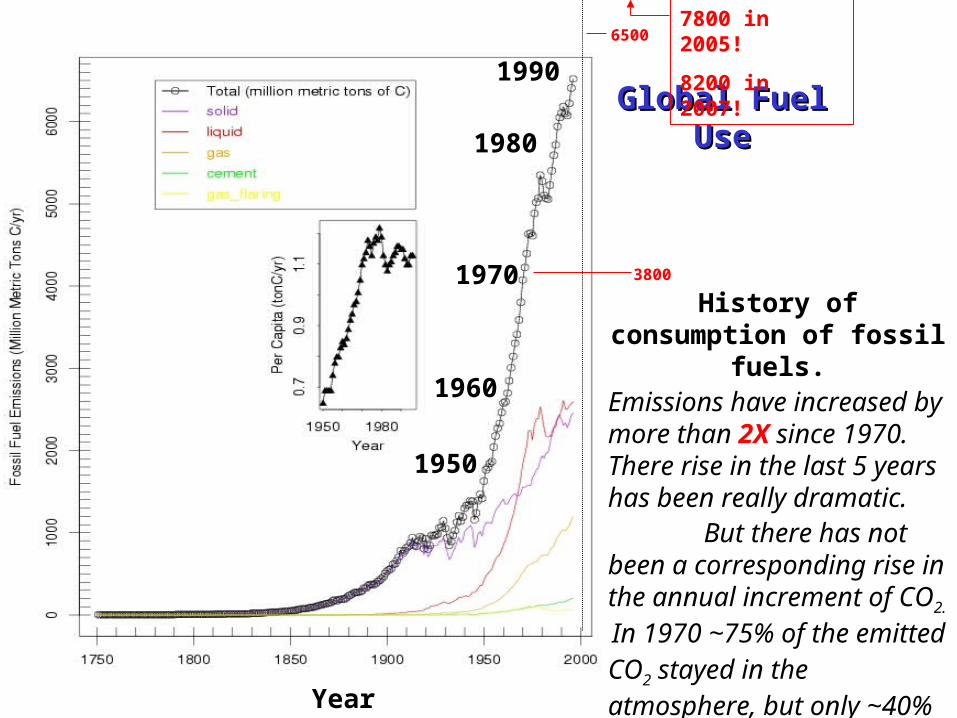
History of consumption of fossil fuels.
Emissions have increased by more than 2X since 1970. There rise in the last 5 years has been really dramatic.
But there has not been a corresponding rise in the annual increment of CO2.
In 1970 ~75% of the emitted CO2 stayed in the atmosphere, but only ~40% in 2000.
3800
6500
Global Fuel UseGlobal Fuel Use
7800 in 2005!
8200 in 2007!

Antarctic ice cores compared with modern data for COAntarctic ice cores compared with modern data for CO22

Arrows indicate El Nino events
Atmospheric increase ~57% of fossil fuel emissions
Interannual variability correlated with El Niño
CO2

The rate of CO2 accumulation in the atmosphere has risen on a decadal time scale, from 0.7 ppm/yr in the 1960's to 1.8 ppm/yr in the 2000's.
The 1980's and 1990's were(slightly) anomalous.
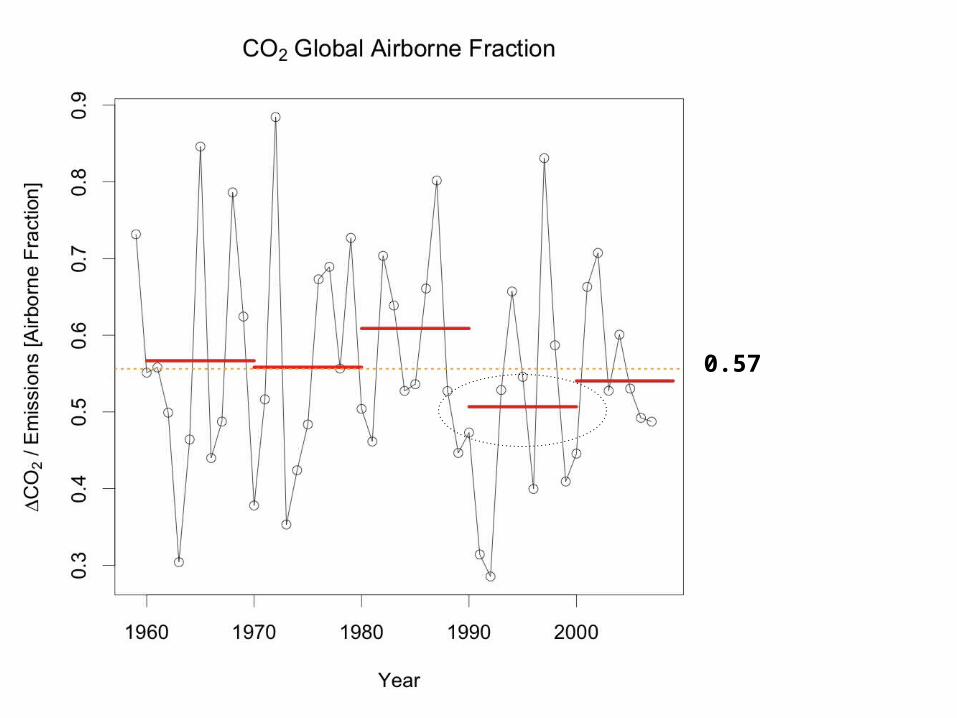
0.57

SHORT QUESTIONSSHORT QUESTIONS
Comparison of the rates of CO2 atmospheric accumulation vs. global fossil fuel emission indicates that only 57% of the CO2 emitted by fossil fuel combustion remains in the atmosphere.
1. Does this mean that inputs of fossil fuel CO2 have a residence time in the atmosphere of only 2 years?
2. Does this mean that CO2 would start declining if fossil fuel emissions were to stop tomorrow? …or if they were to level off immediately and become constant ?

Composition of Sea WaterComposition of Sea Water
"alkalinity" defines Σ' Zi [i] : response of H+ and OH- to addition of CO2
Charge balance in the ocean:[HCO3
-] + 2[CO32-] = [Na+] + [K+] + 2[Mg2+] + 2[Ca2+] - [Cl-] – 2[SO4
2-] – [Br-] The alkalinity [Alk] ≈ [HCO3
-] + 2[CO32-] = 2.3x10⁻³M

UPTAKE OF COUPTAKE OF CO22 BY THE OCEANS BY THE OCEANS
CO2(g)
CO2.H2O
CO2.H2O HCO3
- + H+
HCO3- CO3
2- + H+
KH = 3x10⁻² M atm-1
K1 = 9x10⁻⁷ M
K2 = 7x10⁻¹⁰ M pK 1
Ocean pH = 8.2
pK 2
CO2.H2O HCO3
- CO32-
OCEAN
ATMOSPHERE

LIMIT ON OCEAN UPTAKE OF COLIMIT ON OCEAN UPTAKE OF CO22::
CONSERVATION OF ALKALINITYCONSERVATION OF ALKALINITY Equilibrium calculation for [Alk] = 2.3x10⁻³ M
pCO2 , ppm100 200 300 400 500
8.6
8.4
8.2
2
3
41.4
1.6
1.8
1.9
2.0
2.1
Ocean pH
[CO32-],
10-4 M
[HCO3-],
10-3M
[CO2.H2O]+[HCO3
-]
+[CO32-], 10-3M
Charge balance in the ocean:[HCO3
-] + 2[CO32-] = [Na+] + [K+] + 2[Mg2+] +
2[Ca2+] - [Cl-] – 2[SO42-] – [Br-]
The alkalinity [Alk] ≈ [HCO3
-] + 2[CO32-] =
2.3x10⁻³M is the excess base relative to the CO2-H2O system
It is conserved upon addition of CO2
uptake of CO2 is limited by the existing supply of CO3
2-:
Increasing Alk requires dissolution of sediments:…which takes place over a time scale of thousands of years
CO2(g) + CO32 + H2O 2HCO3
-
Ca2+ + CO32-CaCO3

NCO2atm=PCO2 Natm
NCO2aq= PCO2
KH Voc (1 + K1/[H+] + K1 K2 / [H+]2 )
| | |
[CO2 aq] [HCO3
− ] [CO3
= ]
1 : 140 : 16
CO2H2O HCO3
- + H
+ K1 = [ HCO3
- ][ H+ ] / [ CO2H2O ]
HCO3
- H
+ + CO3
= K2 = [ CO3
= ][ H+ ] / [HCO3- ]
[ HCO3- ] = ( K1 /[ H+ ] ) [ CO2H2O ] ;
[CO3
= ] = ( K2K1 /[ H+ ]2 ) [ CO2H2O ]

EQUILIBRIUM PARTITIONING OF COEQUILIBRIUM PARTITIONING OF CO22
BETWEEN ATMOSPHERE AND GLOBAL OCEANBETWEEN ATMOSPHERE AND GLOBAL OCEAN
Equilibrium for present-day ocean:
only 3% of total inorganic carbon is currently in the atmosphere
But CO2(g) [H+] F … positive feedback to increasing CO2
Pose problem differently: how does a CO2 addition dN partition between the atmosphere and ocean at equilibrium (whole ocean)?
28% of added CO2 remains in atmosphere!
2
2 2 H 1 1 22
( ) 10.03
( ) ( )1 1
N [H ] [H ]
CO
CO CO oc
a
N gF
N g N aq V PK K K K
2
H 1 22 22+
( ) 10.28
( ) ( ) 1H
CO
ocCO CO
a
dN gf
V PK K KdN g dN aq
N

(buffer factor) (buffer factor) Sundquist et al. 1979Sundquist et al. 1979

FURTHER LIMITATION OF COFURTHER LIMITATION OF CO2 2 UPTAKE: UPTAKE:
SLOW OCEAN TURNOVER (~ 200 years)SLOW OCEAN TURNOVER (~ 200 years)
Inventories in 1015 m3 waterFlows in 1015 m3 yr-1
Uptake by oceanic mixed layer only (VOC= 3.6x10¹⁶ m3) would give f = 0.94 (94% of added CO2 remains in atmosphere)

comp to ~300 μmoles/kg CO3=
Observed penetration of fossil fuel CO2 into the oceans

CYCLING OF CARBON WITH TERRESTRIAL BIOSPHERECYCLING OF CARBON WITH TERRESTRIAL BIOSPHERE
Inventories in PgCFlows in PgC a-1

EVIDENCE FOR LAND UPTAKE EVIDENCE FOR LAND UPTAKE OF COOF CO22 FROM TRENDS IN O FROM TRENDS IN O22,,
1990-20001990-2000

NET UPTAKE OF CONET UPTAKE OF CO22 BY TERRESTRIAL BIOSPHERE BY TERRESTRIAL BIOSPHERE
(1.4 Pg C yr(1.4 Pg C yr-1-1 in the 1990s; IPCC [2001]) in the 1990s; IPCC [2001])is a small residual of large atm-bio exchangeis a small residual of large atm-bio exchange
• Gross primary production (GPP):
GPP = CO2 uptake by photosynthesis = 120 PgC yr-1
• Net primary production (NPP):
NPP = GPP – “autotrophic” respiration by green plants = 60 PgC yr-1
• Net ecosystem production (NEP):
NEP = NPP – “heterotrophic” respiration by decomposers = 10 PgC yr-1
• Net biome production (NBP)
NBP = NEP – fires/erosion/harvesting = 1.4 PgC yr-1
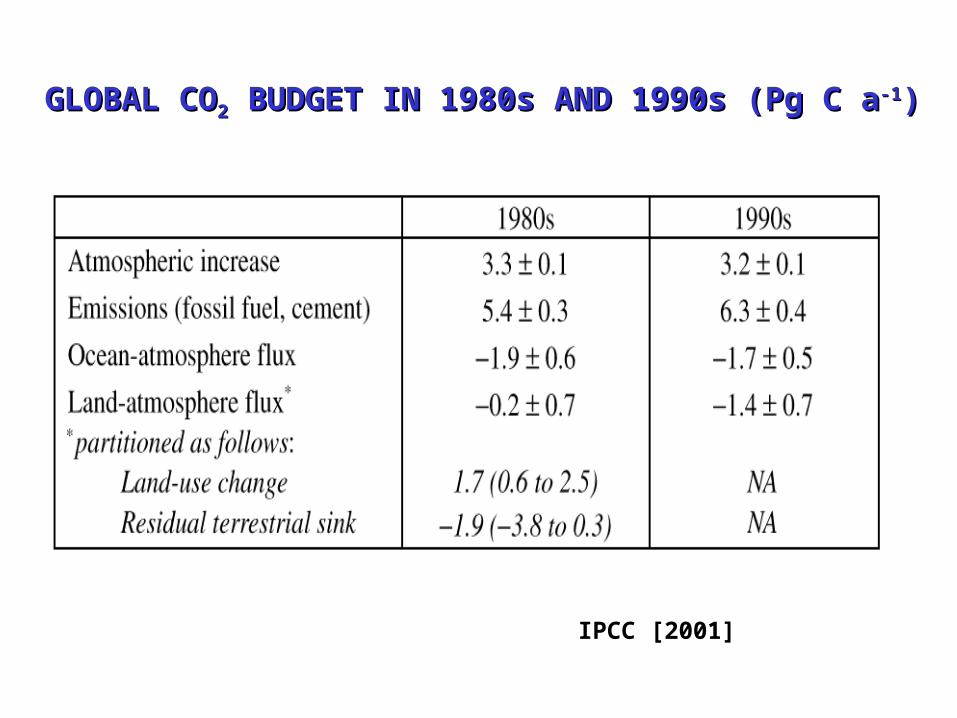
GLOBAL COGLOBAL CO22 BUDGET IN 1980s AND 1990s (Pg C a BUDGET IN 1980s AND 1990s (Pg C a-1-1))
IPCC [2001]IPCC [2001]

HUMAN INFLUENCE ON THE CARBON CYCLE
Natural fluxes in black; anthropogenic contribution (1990s) in red

1950
1960
1970
1980
1990
Year
History of consumption of fossil fuels.
Emissions have increased by more than 2X since 1970. There rise in the last 5 years has been really dramatic.
But there has not been a corresponding rise in the annual increment of CO2. In 1970 ~75% of the emitted CO2 stayed in the atmosphere, but only ~40% in 2000.
3800
6500
Global Fuel UseGlobal Fuel Use
7800 in 2005!
8200 in 2007!

2007

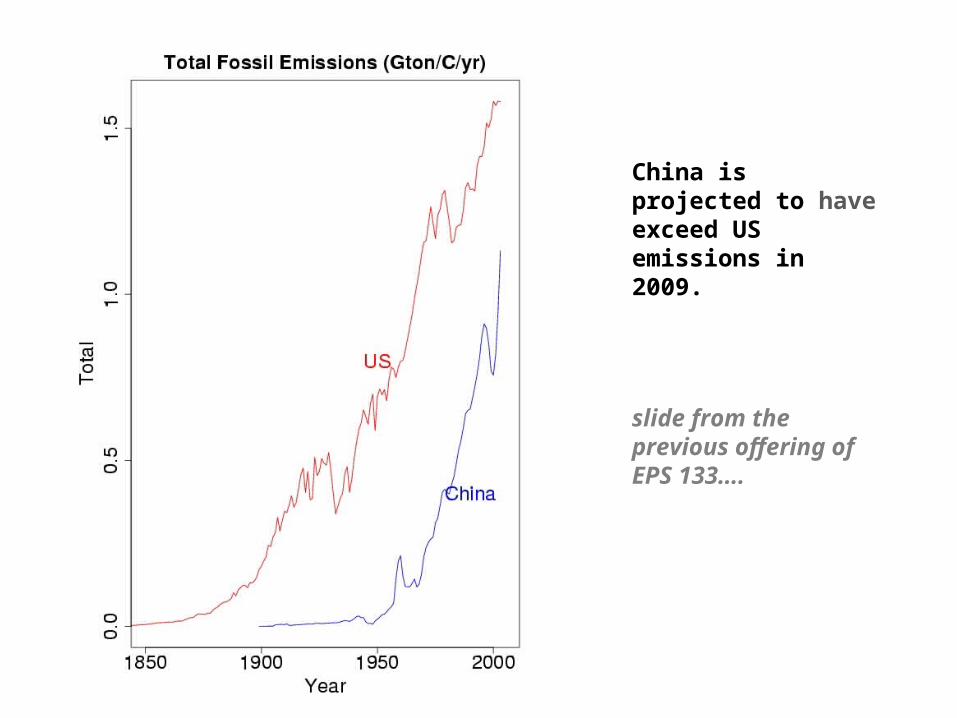
China is projected to have exceed US emissions in 2009.
slide from the previous offering of EPS 133….

China did exceed US emissions, in 2007...
USA
China
India
Em
issi
on
s (P
g C
/yr)
0
.5
1
1
.5
2
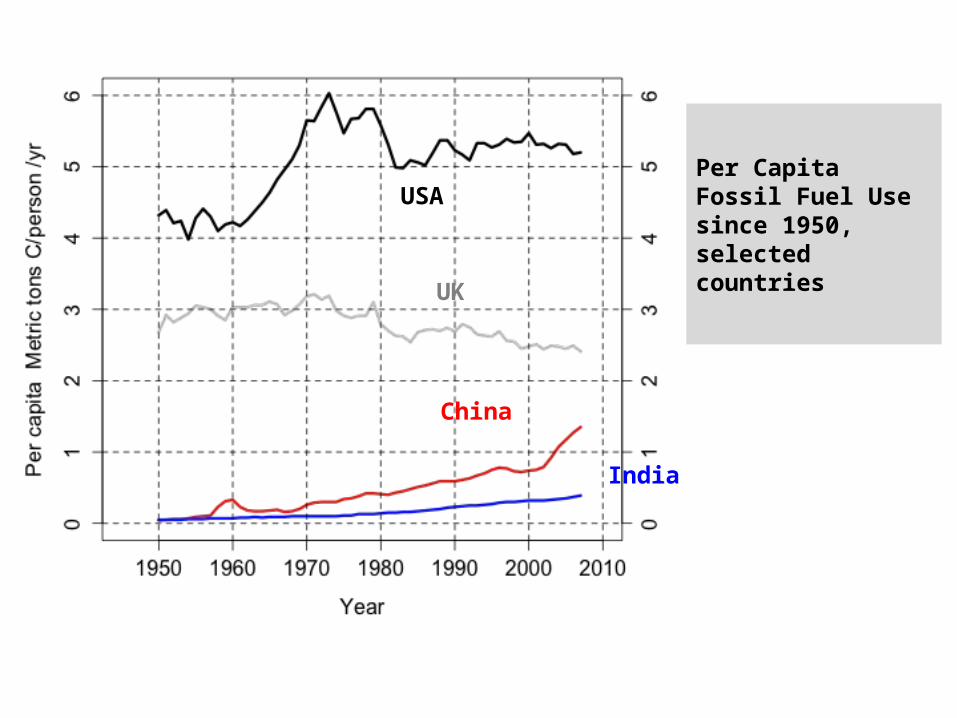
Per Capita Fossil Fuel Use since 1950, selected countries
USA
China
India
UK
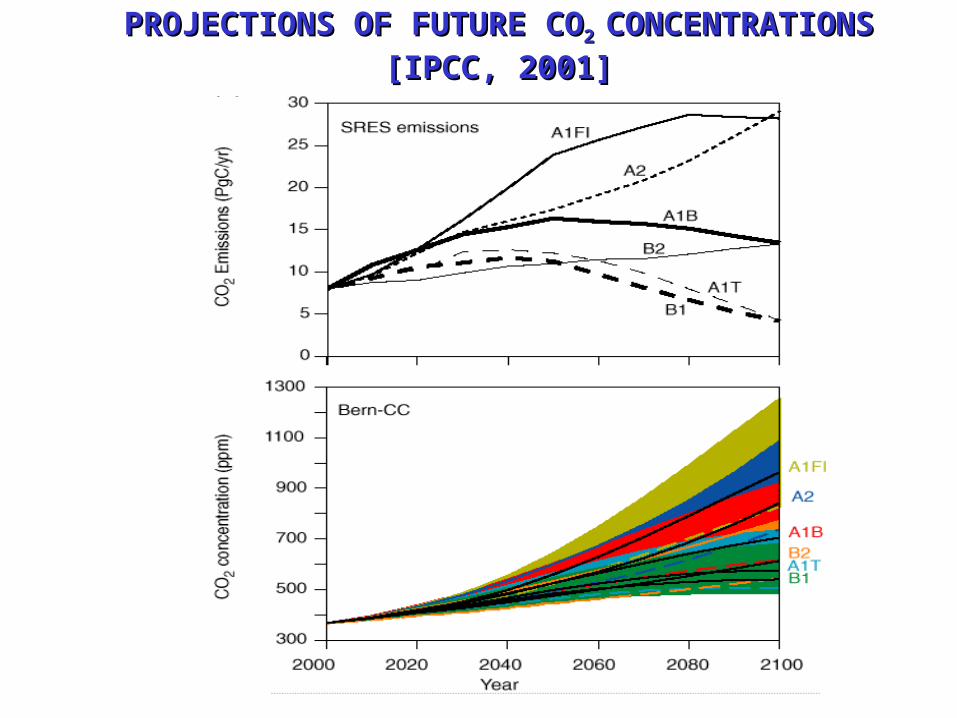
PROJECTIONS OF FUTURE COPROJECTIONS OF FUTURE CO2 2 CONCENTRATIONSCONCENTRATIONS
[IPCC, 2001][IPCC, 2001]
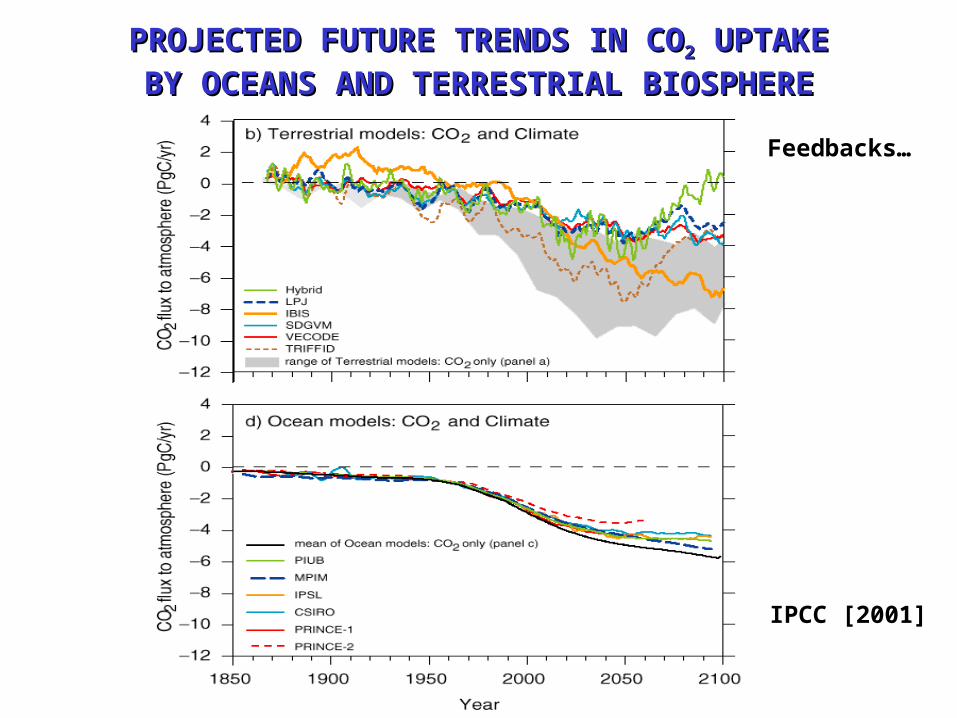
PROJECTED FUTURE TRENDS IN COPROJECTED FUTURE TRENDS IN CO22 UPTAKE UPTAKE
BY OCEANS AND TERRESTRIAL BIOSPHEREBY OCEANS AND TERRESTRIAL BIOSPHERE
IPCC [2001]
Feedbacks…


SHORT QUESTIONSSHORT QUESTIONS
1. The conventional scientific view is that fossil fuel CO2 injected to the atmosphere will affect the atmosphere for ~100 years before transfer to the deep ocean and that it represents therefore a long-term environmental problem. This view has been challenged by a skeptic from U. Virginia on the basis of bomb 14CO2 data. Above-ground nuclear tests in the 1950s injected large amounts of 14CO2 in the atmosphere, but atmospheric observations following the nuclear test ban in 1962 showed an exponential decay of 14CO2 back to background values on a time scale of 5 years. This shows, according to our skeptic, that if we were to shut down fossil fuel emissions then CO2 would return to natural background values within 5 years. What do you think of this reasoning?
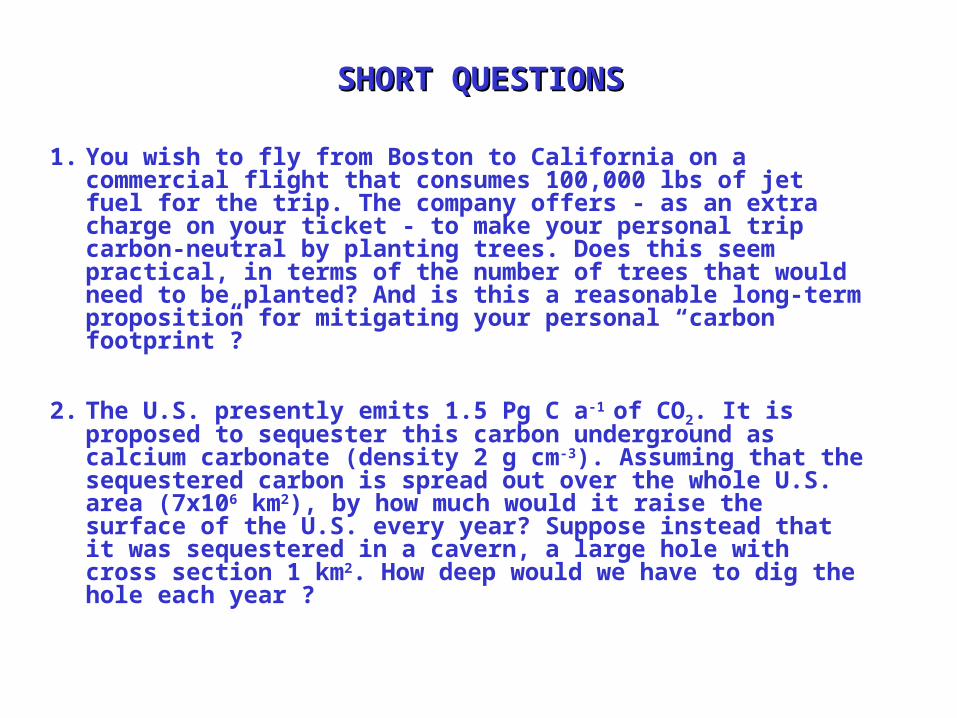
SHORT QUESTIONSSHORT QUESTIONS
1. You wish to fly from Boston to California on a commercial flight that consumes 100,000 lbs of jet fuel for the trip. The company offers - as an extra charge on your ticket - to make your personal trip carbon-neutral by planting trees. Does this seem practical, in terms of the number of trees that would need to be planted? And is this a reasonable long-term proposition for mitigating your personal “carbon footprint”?
2. The U.S. presently emits 1.5 Pg C a-1 of CO2. It is proposed to sequester this carbon underground as calcium carbonate (density 2 g cm-3). Assuming that the sequestered carbon is spread out over the whole U.S. area (7x10⁶ km2), by how much would it raise the surface of the U.S. every year? Suppose instead that it was sequestered in a cavern, a large hole with cross section 1 km2. How deep would we have to dig the hole each year ?
Recommended