Chapter 5
Discrete Probability Distributions
1
C H A P T E R
Outline5Discrete Probability Distributions
1.1Descriptive and Inferential Statistics
Slide 2Copyright © 2012 The McGraw-Hill Companies, Inc.
5-1 Probability Distributions5-2 Mean, Variance, Standard Deviation, and
Expectation5-3 The Binomial Distribution

C H A P T E R
Objectives5Discrete Probability Distributions
1.1Descriptive and inferential statistics
1 Construct a probability distribution for a random variable.
2 Find the mean, variance, standard deviation, and expected value for a discrete random variable.
3 Find the exact probability for X successes in n trials of a binomial experiment.
4 Find the mean, variance, and standard deviation for the variable of a binomial distribution.
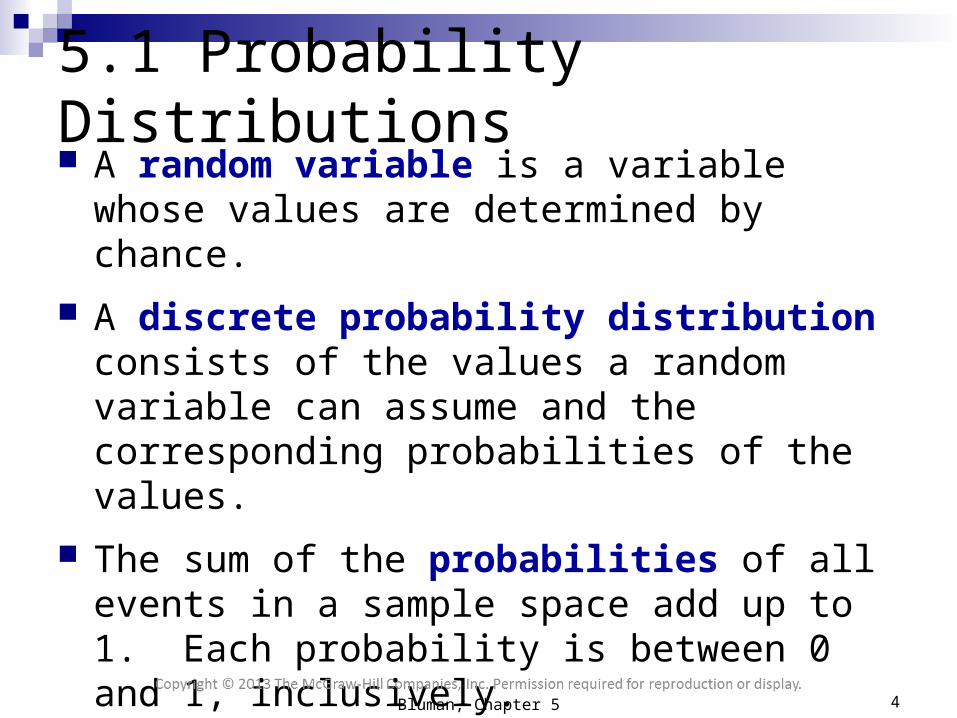
5.1 Probability Distributions A random variable is a variable whose values
are determined by chance.
A discrete probability distribution consists of the values a random variable can assume and the corresponding probabilities of the values.
The sum of the probabilities of all events in a sample space add up to 1. Each probability is between 0 and 1, inclusively.
Bluman, Chapter 5 4

Chapter 5Discrete Probability Distributions
Section 5-1Example 5-1
Page #262
Bluman, Chapter 5 5
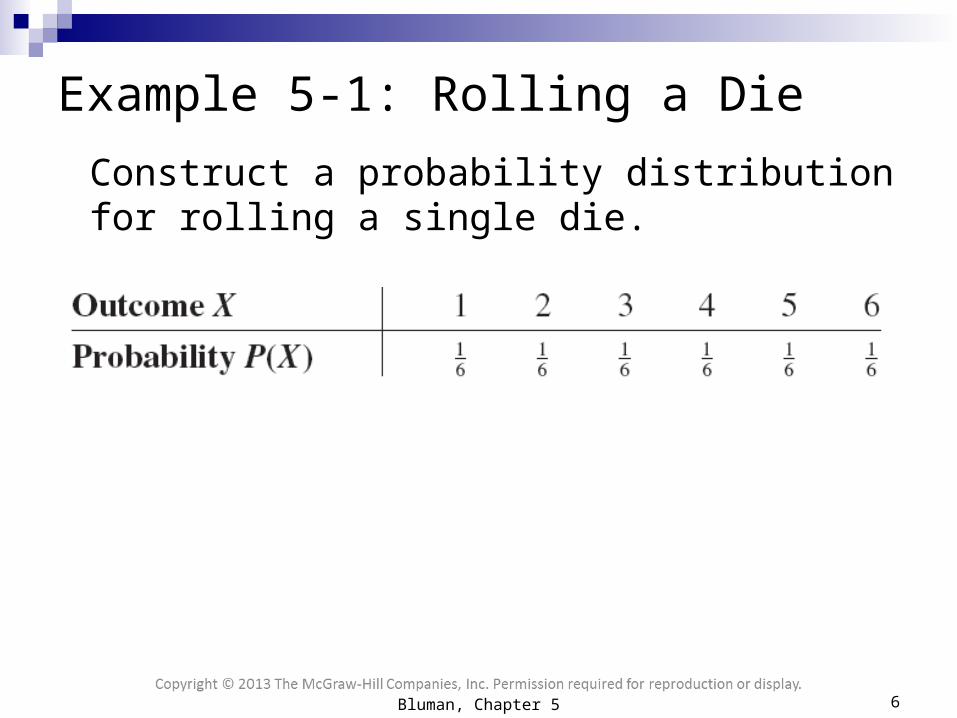
Example 5-1: Rolling a Die
Construct a probability distribution for rolling a single die.
Bluman, Chapter 5 6

Chapter 5Discrete Probability Distributions
Section 5-1Example 5-2
Page #262
Bluman, Chapter 5 7
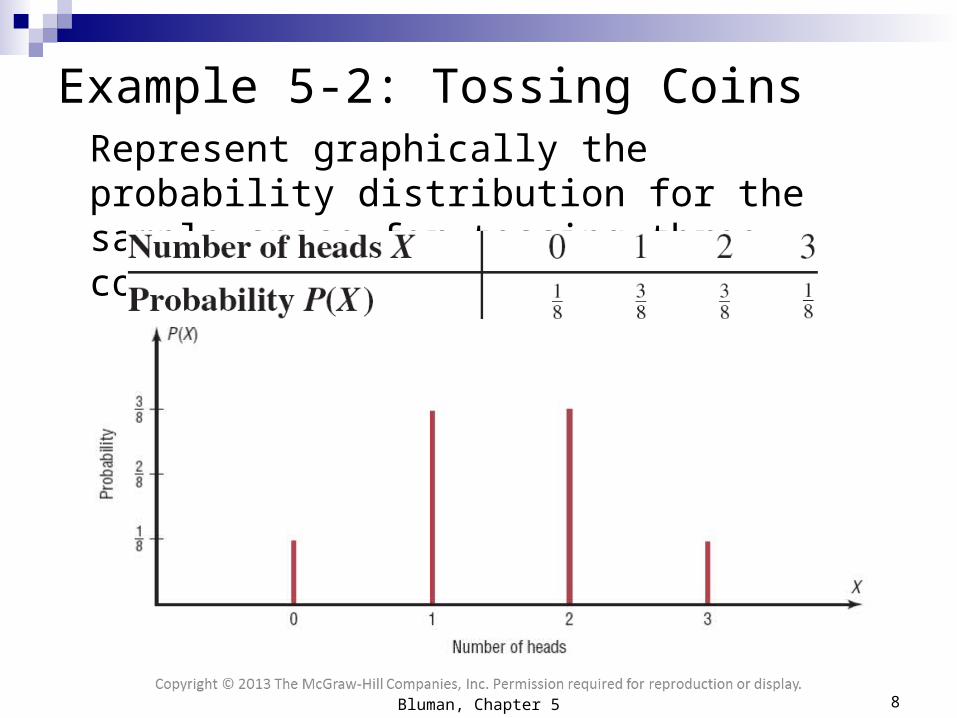
Example 5-2: Tossing CoinsRepresent graphically the probability distribution for the sample space for tossing three coins.
.
Bluman, Chapter 5 8

X
P (X ) 6
15
0
5
15
1
3
15
2
1
15
3
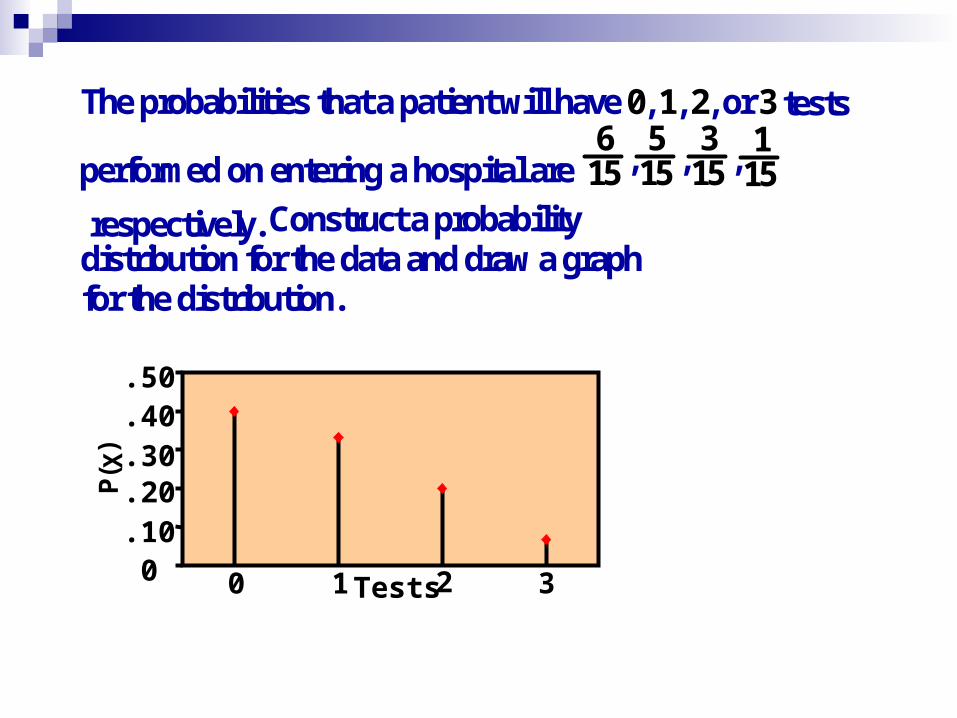
The probabilities that a patient will have 0, 1, 2, or 3 tests
performed on entering a hospital are 6
15 ,5
15 ,3
15 , 115
and 1
15 respectively. Construct a probability
distribution for the data and draw a graph for the distribution.
Exercise #19
0 1 2 3 6
The probabilities that a patient will have , , , or tests
, , ,performed on entering a hospital are
Construct a probability respectively.distribution for the data and draw a
5 3 115 15
graph
15 15
for the distribution.
.30
.100
.20
.40
.50
0 1 2 3Tests
P( X
)

A box contains two $1 bills, three $5 bills, one $10 bill, and three $20 bills. Construct a probability distribution for the data.
X $1 $5 $10 $20
P( X )
29
13
19
13
Exercise #27

Construct a probability distribution for drawing a card from a deck of 40 cards consisting of 10 cards numbered 1, 10 cards numbered 2, 15 cards numbered 3, and 5 cardsnumbered 4.
X 1 2 3 4
P(X) 14
38
18
14
Exercise #29
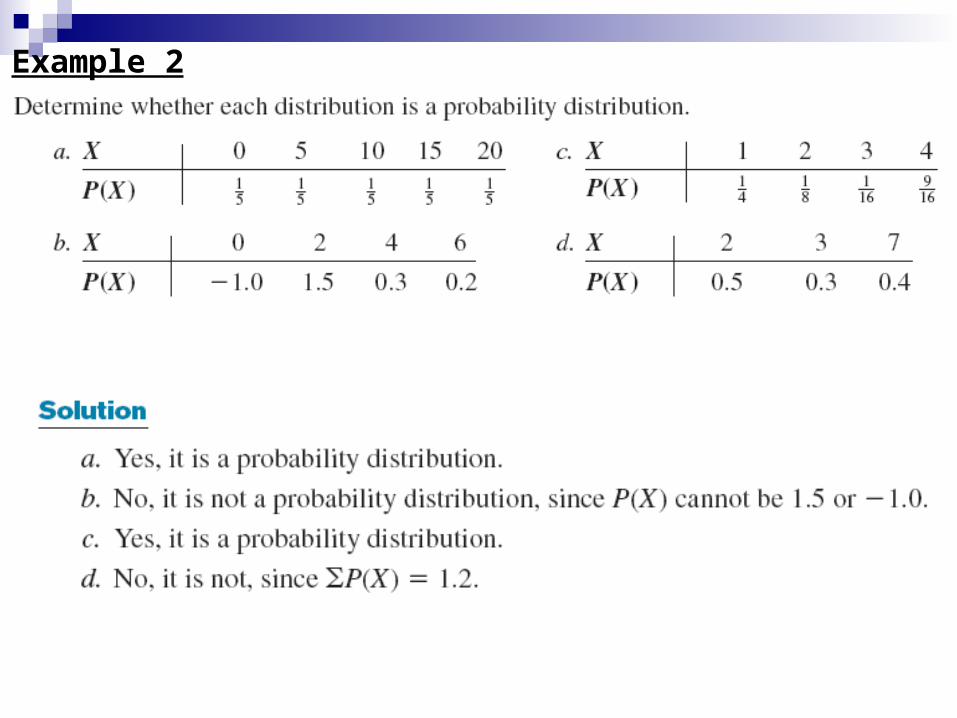
Example 2
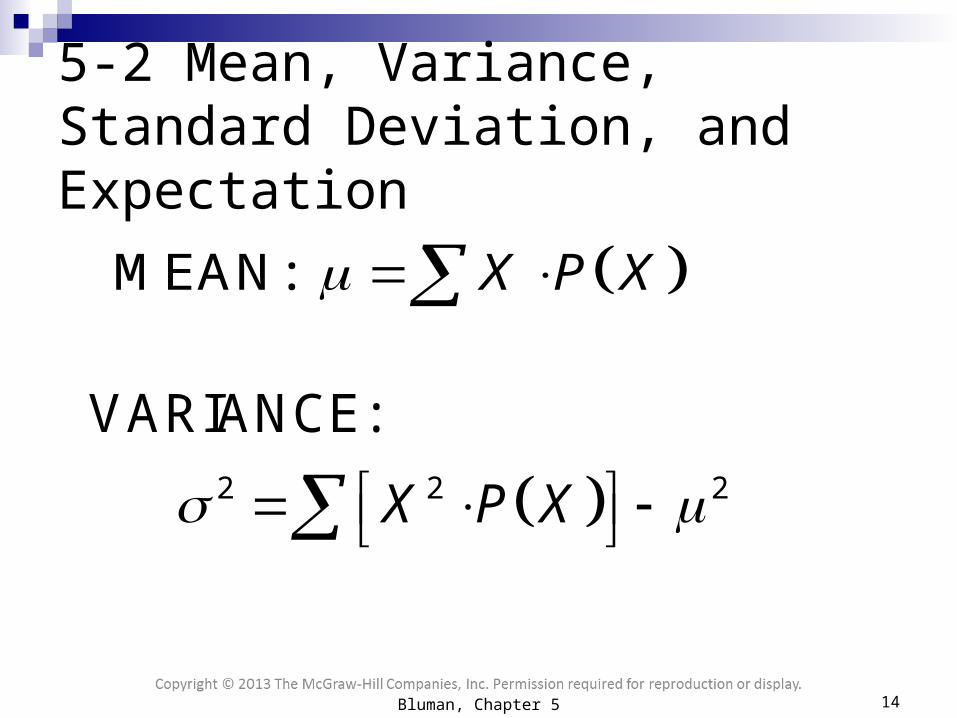
5-2 Mean, Variance, Standard Deviation, and Expectation
MEAN: X P X
2 2 2
VARIANCE:
X P X
Bluman, Chapter 5 14
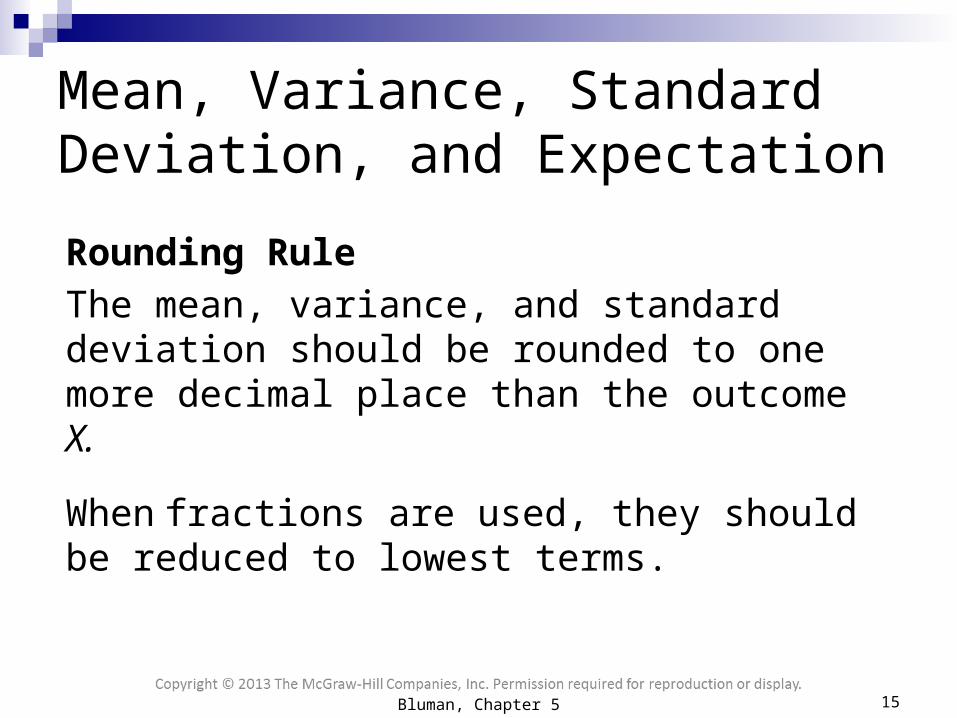
Rounding Rule
The mean, variance, and standard deviation should be rounded to one more decimal place than the outcome X.
When fractions are used, they should be reduced to lowest terms.
Mean, Variance, Standard Deviation, and Expectation
Bluman, Chapter 5 15
Chapter 5Discrete Probability Distributions
Section 5-2Example 5-5
Page #268
Bluman, Chapter 5 16

Example 5-5: Rolling a DieFind the mean of the number of spots that appear when a die is tossed.
.
X P X 1 1 1 1 1 16 6 6 6 6 61 2 3 4 5 6
216 3.5
Bluman, Chapter 5 17

Chapter 5Discrete Probability Distributions
Section 5-2Example 5-8
Page #269
Bluman, Chapter 5 18
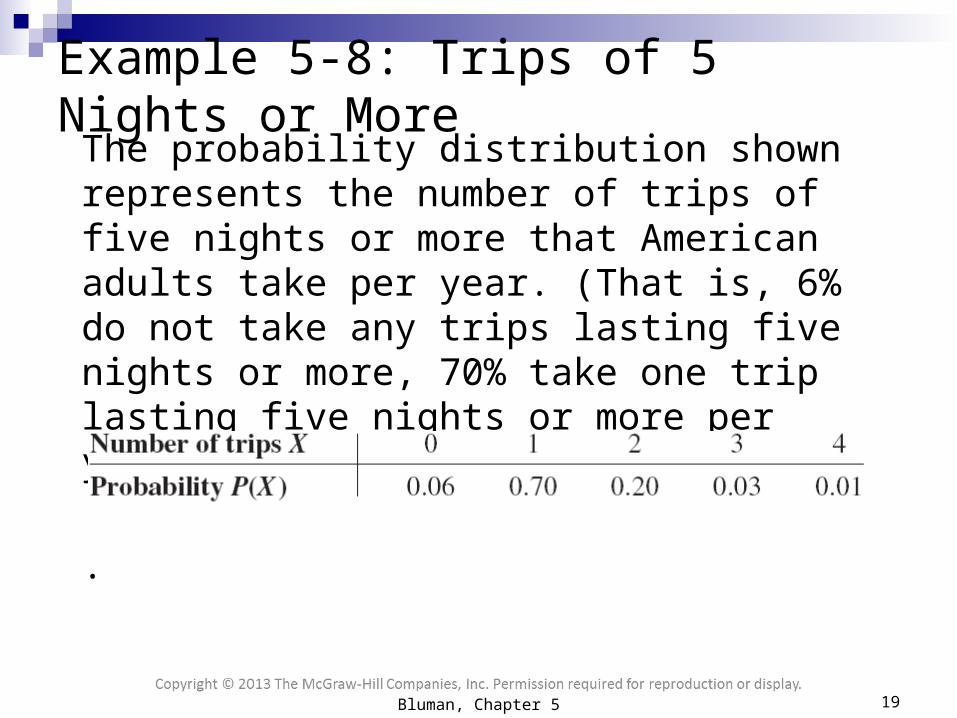
Example 5-8: Trips of 5 Nights or MoreThe probability distribution shown represents the number of trips of five nights or more that American adults take per year. (That is, 6% do not take any trips lasting five nights or more, 70% take one trip lasting five nights or more per year, etc.) Find the mean.
.
Bluman, Chapter 5 19
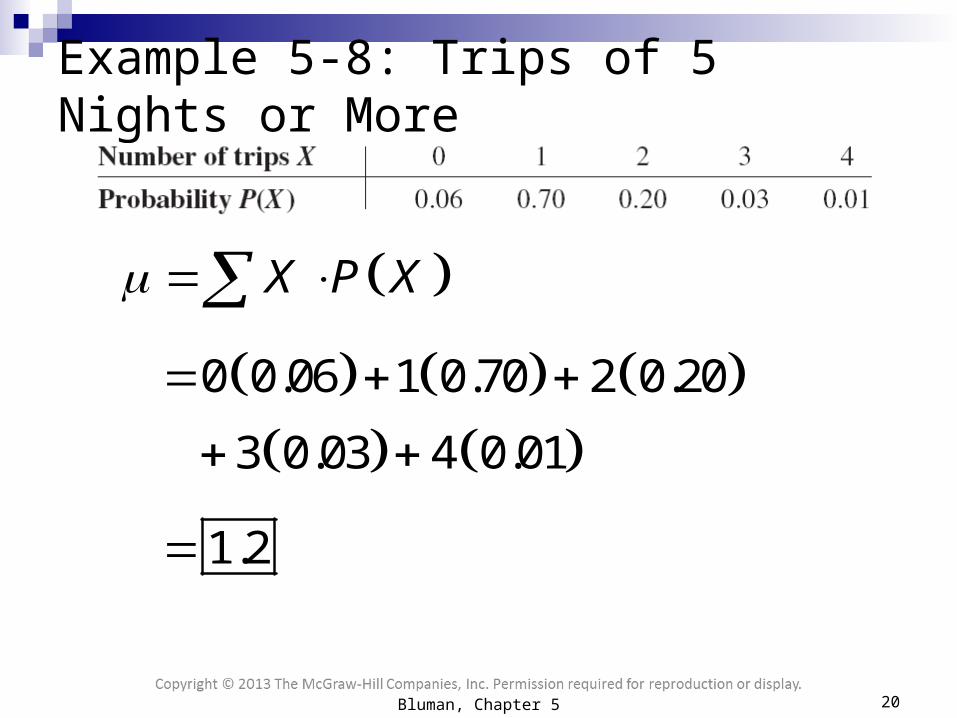
Example 5-8: Trips of 5 Nights or More
X P X
0 0.06 1 0.70 2 0.20
3 0.03 4 0.01
1.2
Bluman, Chapter 5 20
Chapter 5Discrete Probability Distributions
Section 5-2Example 5-9
Page #270
Bluman, Chapter 5 21
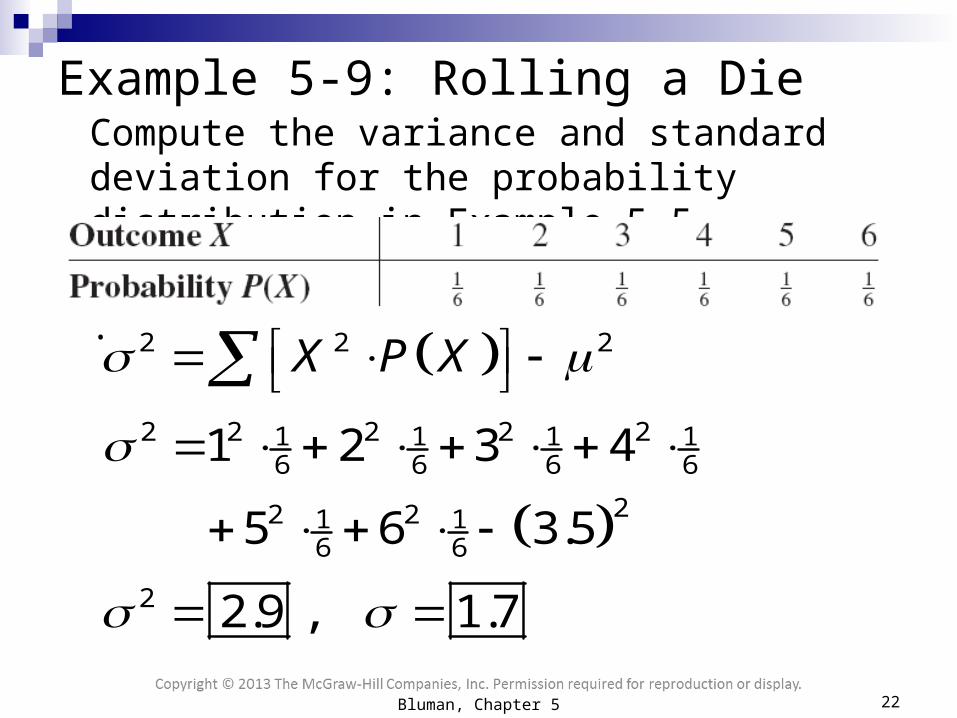
Example 5-9: Rolling a DieCompute the variance and standard deviation for the probability distribution in Example 5–5.
.
2 2 2X P X
2 2 2 2 21 1 1 16 6 6 6
22 21 16 6
1 2 3 4
5 6 3.5
2 2.9 , 1.7
Bluman, Chapter 5 22

Chapter 5Discrete Probability Distributions
Section 5-2Example 5-11
Page #271
Bluman, Chapter 5 23

Example 5-11: On Hold for Talk Radio
A talk radio station has four telephone lines. If the host is unable to talk (i.e., during a commercial) or is talking to a person, the other callers are placed on hold. When all lines are in use, others who are trying to call in get a busy signal. The probability that 0, 1, 2, 3, or 4 people will get through is shown in the distribution. Find the variance and standard deviation for the distribution.
Bluman, Chapter 5 24

Example 5-11: On Hold for Talk Radio
2 2 2 2
22 2
0 0.18 1 0.34 2 0.23
3 0.21 4 0.04 1.6
2 1.2 , 1.1
0 0.18 1 0.34 2 0.23
3 0.21 4 0.04 1.6
Bluman, Chapter 5 25
Example 5-11: On Hold for Talk Radio
A talk radio station has four telephone lines. If the host is unable to talk (i.e., during a commercial) or is talking to a person, the other callers are placed on hold. When all lines are in use, others who are trying to call in get a busy signal.
Should the station have considered getting more phone lines installed?
Bluman, Chapter 5 26
Example 5-11: On Hold for Talk Radio
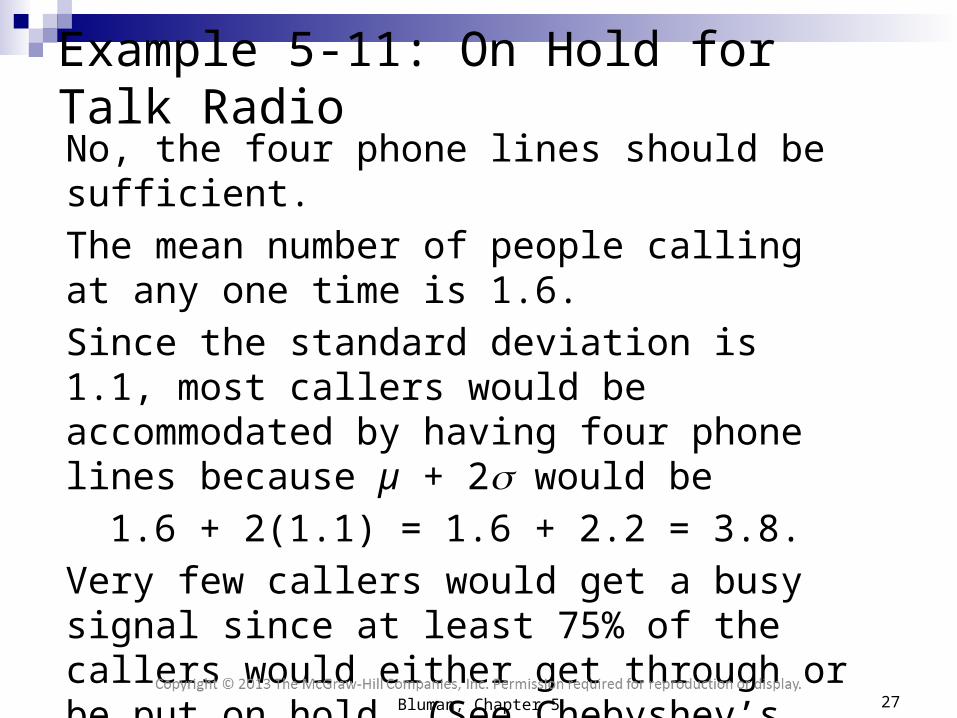
No, the four phone lines should be sufficient.
The mean number of people calling at any one time is 1.6.
Since the standard deviation is 1.1, most callers would be accommodated by having four phone lines because µ + 2 would be
1.6 + 2(1.1) = 1.6 + 2.2 = 3.8.
Very few callers would get a busy signal since at least 75% of the callers would either get through or be put on hold. (See Chebyshev’s theorem in Section 3–2.)
Bluman, Chapter 5 27
Expectation The expected value, or expectation, of
a discrete random variable of a probability distribution is the theoretical average of the variable.
The expected value is, by definition, the mean of the probability distribution.
E X X P X
Bluman, Chapter 5 28

Chapter 5Discrete Probability Distributions
Section 5-2Example 5-13
Page #273
Bluman, Chapter 5 29
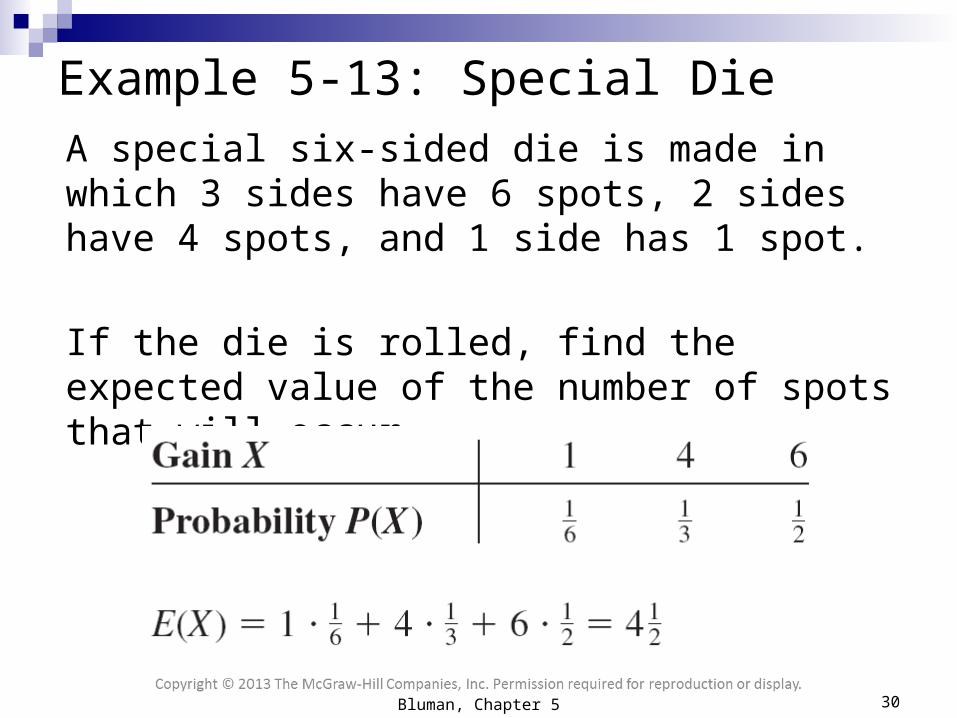
Example 5-13: Special Die
A special six-sided die is made in which 3 sides have 6 spots, 2 sides have 4 spots, and 1 side has 1 spot.
If the die is rolled, find the expected value of the number of spots that will occur.
Bluman, Chapter 5 30

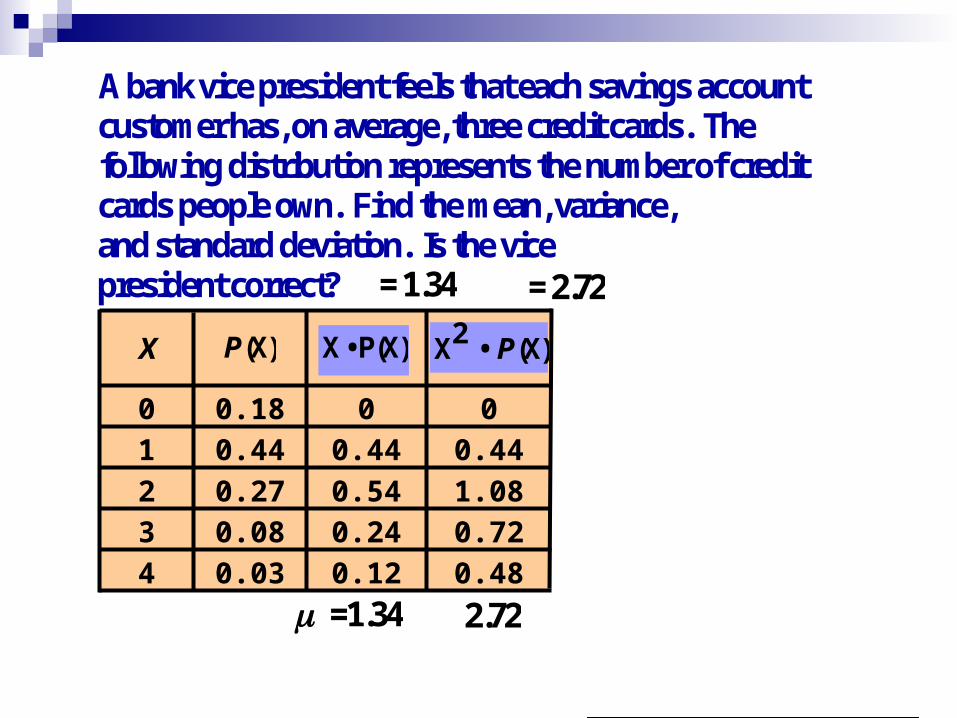
A bank vice president feels that each savings accountcustomer has, on average, three credit cards. The following distribution represents the number of credit cards people own. Find the mean, variance, and standard deviation. Is the vice president correct?
Number of cards X
0 1 2 3 4
Probability P(X)
0.18 0.44 0.27 0.08 0.03
Exercise #3
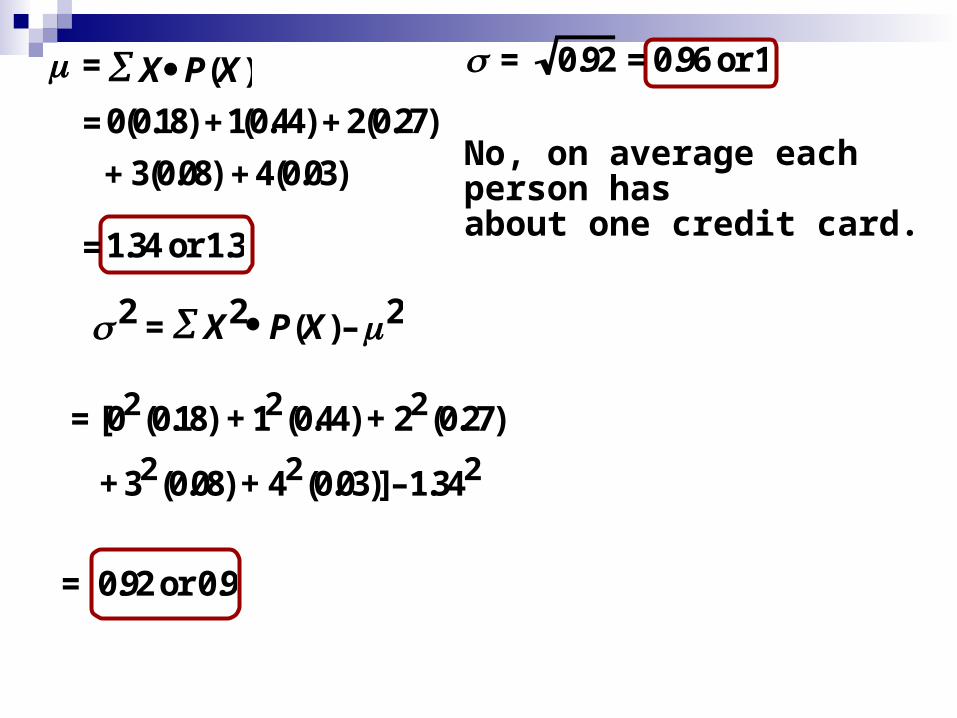
= X P(X )
= 0(0.18) + 1(0.44) + 2(0.27)
+ 3(0.08) + 4(0.03)
= 1.34 or 1.3
2 = X 2 P(X ) – 2
= [02 (0.18) + 12 (0.44) + 22 (0.27)
+ 32 (0.08) + 42 (0.03)] –1.342
= 0.92 or 0.9
= 0.92 = 0.96 or 1
No, on average each person has about one credit card.
0.480.120.034
0.720.240.083
1.080.540.272
0.440.440.441
000.180
A bank vice president feels that each savings accountcustomer has, on average, three credit cards. The following distribution represents the number of credit cards people own. Find the mean, variance, and standard deviation. Is the vice president correct?
P (X) X
= 1.34
X • P(X)
= 2.72
X2 • P (X)
=1.34 2.72
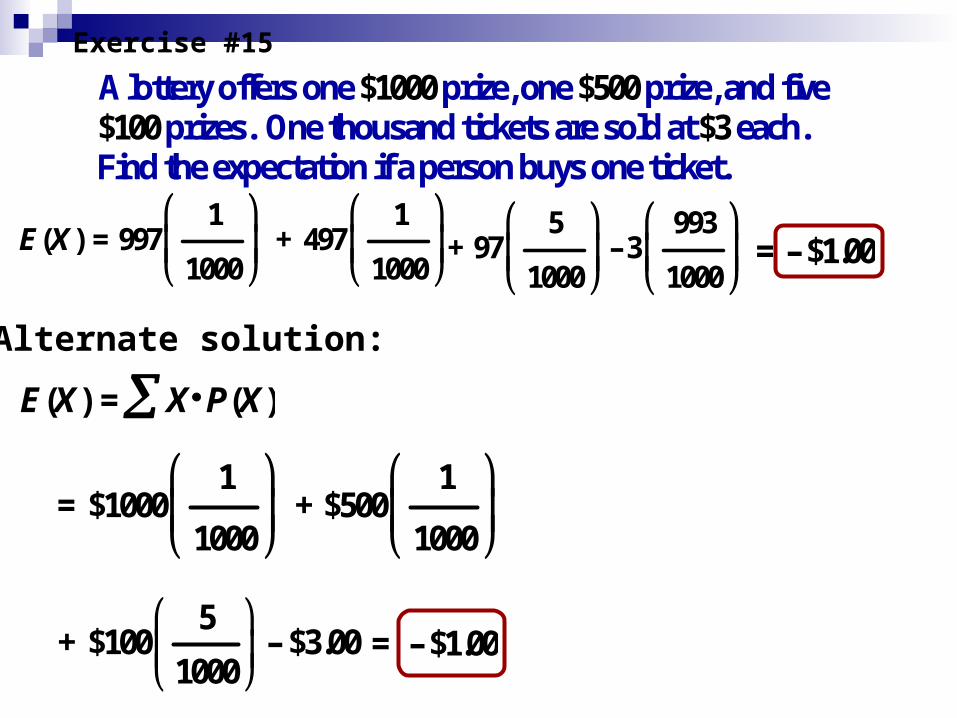
A lottery offers one $1000 prize, one $500 prize, and five $100 prizes. One thousand tickets are sold at $3 each. Find the expectation if a person buys one ticket.
Exercise #15
Alternate solution:
1 1 5 993( ) = 997 + 497 + 97 – 31000 1000 1000 1000
E X = – $1.00
E (X ) = X P(X )
= – $1.00
1 1 = $1000 + $500
1000 1000
5+ $100 – $3.00
1000

For a daily lottery, a person selects a three-digit number. If the person plays for $1, she can win $500.Find the expectation.
( ) = ( )E X X P X
1= $500 – $1.00
1000 = – $0.50
Exercise #17
1 999( ) = $499 – 1
1000 1000E X = – $0.50
Alternate solution :
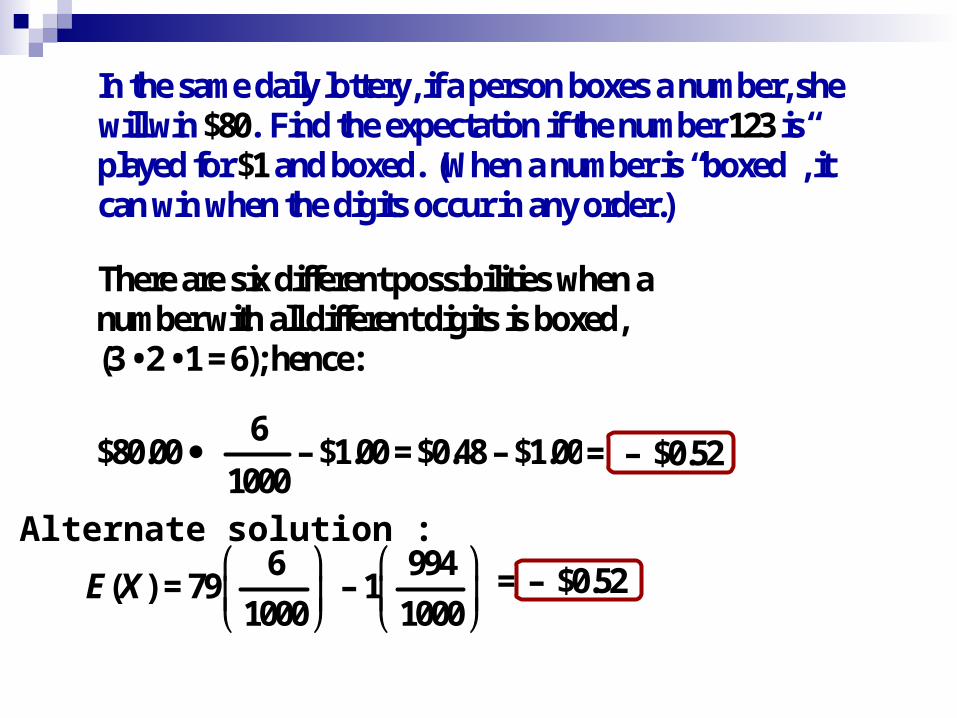
In the same daily lottery, if a person boxes a number, she will win $80. Find the expectation if the number 123 is played for $1 and boxed. (When a number is “boxed”, it can win when the digits occur in any order.)
There are six different possibilities when a number with all different digits is boxed, (3 • 2 • 1 = 6); hence:
$80.00
6
1000– $1.00 = $0.48 – $1.00 = – $0.52
Alternate solution :
6 994( ) = 79 – 1
1000 1000E X = – $0.52
5-3 The Binomial Distribution
Many types of probability problems have only two possible outcomes or they can be reduced to two outcomes.
Examples include: when a coin is tossed it can land on heads or tails, when a baby is born it is either a boy or girl, etc.
Bluman, Chapter 5 37
The Binomial Distribution
The binomial experiment is a probability experiment that satisfies these requirements:
1. Each trial can have only two possible outcomes—success or failure.
2. There must be a fixed number of trials.
3. The outcomes of each trial must be independent of each other.
4. The probability of success must remain the same for each trial.
Bluman, Chapter 5 38
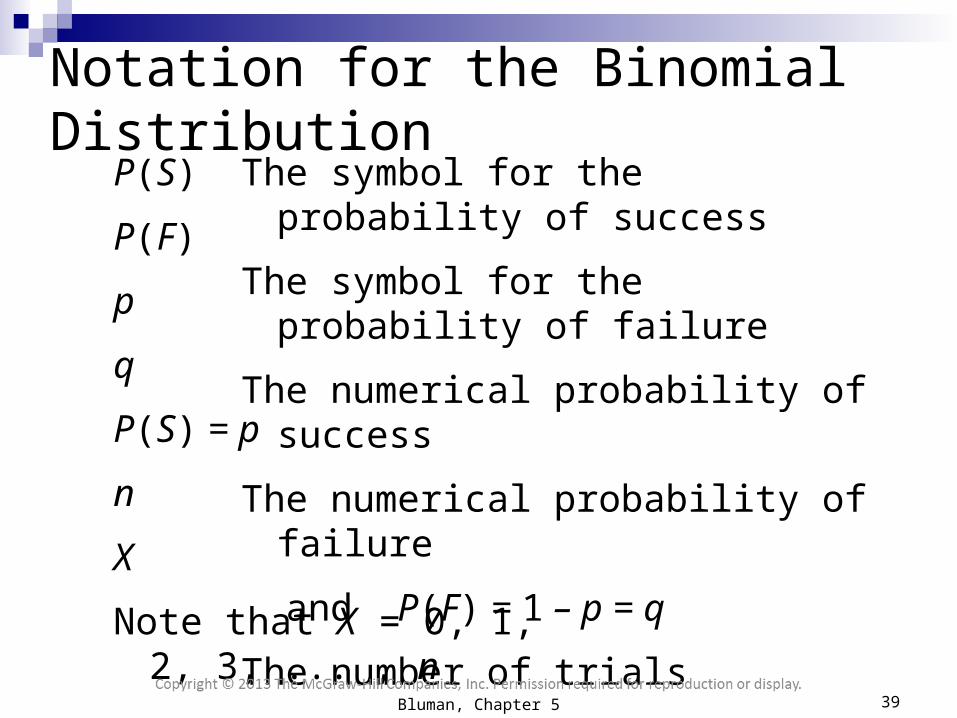
Notation for the Binomial DistributionThe symbol for the probability of success
The symbol for the probability of failure
The numerical probability of success
The numerical probability of failure
and P(F) = 1 – p = q
The number of trials
The number of successes
P(S)
P(F)
p
q
P(S) = p
n
X
Note that X = 0, 1, 2, 3, ... , n
Bluman, Chapter 5 39

The Binomial Distribution
!
! !X n Xn
P X p qn X X
In a binomial experiment, the probability of exactly X successes in n trials is
number of possible probability of adesired outcomes desired outcome
or
X n Xn xP X C p q
Bluman, Chapter 5 40

Chapter 5Discrete Probability Distributions
Section 5-3Example 5-16
Page #280
Bluman, Chapter 5 41

Example 5-16: Survey on Doctor Visits
A survey found that one out of five Americans say he or she has visited a doctor in any given month. If 10 people are selected at random, find the probability that exactly 3 will have visited a doctor last month.
!
! !X n Xn
P X p qn X X
3 7
10! 1 43
7!3! 5 5
P
1510,"one out of five" , 3 n p X
0.201
Bluman, Chapter 5 42

Chapter 5Discrete Probability Distributions
Section 5-3Example 5-17
Page #281
Bluman, Chapter 5 43
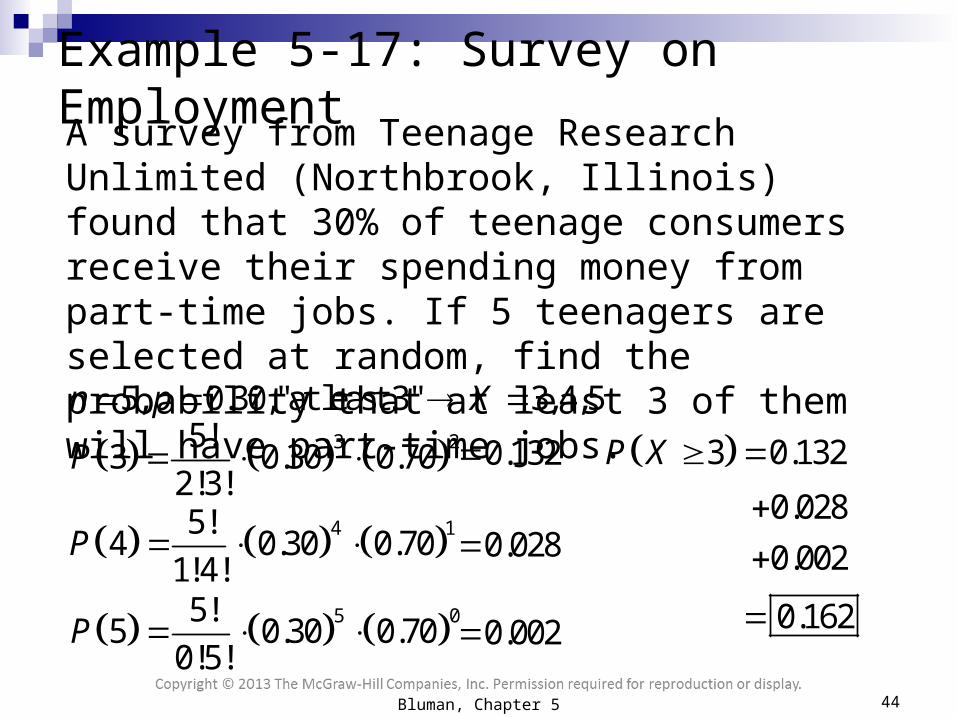
Example 5-17: Survey on EmploymentA survey from Teenage Research Unlimited (Northbrook, Illinois) found that 30% of teenage consumers receive their spending money from part-time jobs. If 5 teenagers are selected at random, find the probability that at least 3 of them will have part-time jobs.
3 25!3 0.30 0.70
2!3! P
5, 0.30,"at least 3" 3,4,5 n p X
0.132
4 15!4 0.30 0.70
1!4! P 0.028
5 05!5 0.30 0.70
0!5! P 0.002
3 0.132
0.028
0.002
0.162
P X
Bluman, Chapter 5 44
R. H. Bruskin Associates Market Research found that 40%of Americans do not think that having a college education is important to succeed in the business world. If a random sample of five Americans is selected, find these possibilities.
a. Exactly two people will agree.b. At most three people will agree.c. At least two people will agree.d. Fewer than three people will agree.
Exercise #11
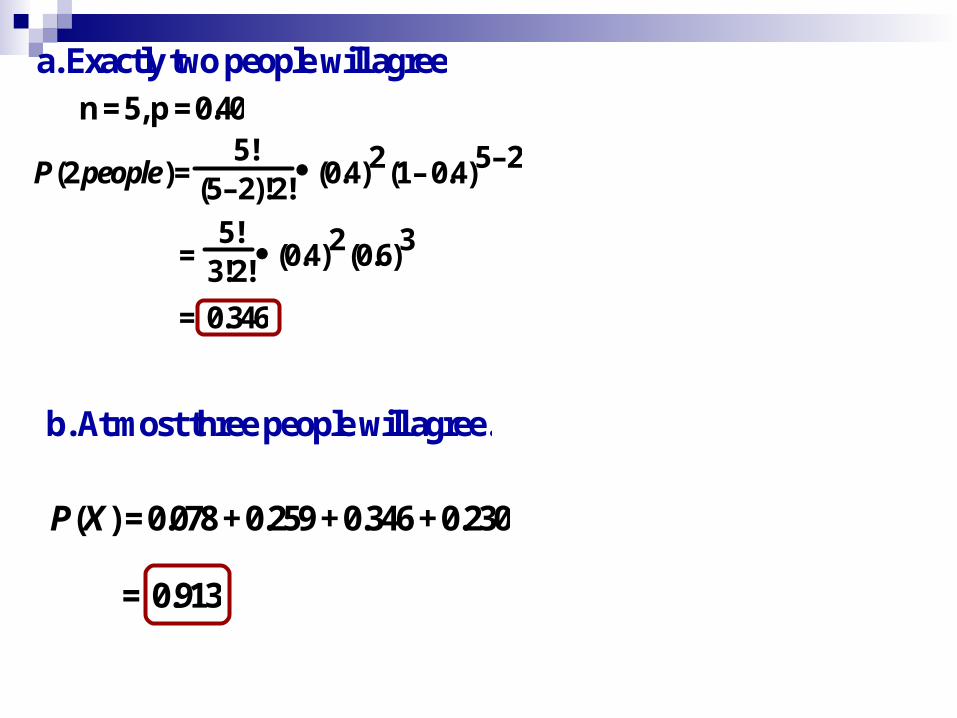
a. Exactly two people will agree
n = 5, p = 0.40
P (2 people) =
5!(5–2)!2!
(0.4)2 (1– 0.4)5–2
=
5!3!2!
(0.4)2 (0.6)3
= 0.346
b. At most three people will agree.
P(X ) = 0.078 + 0.259 + 0.346 + 0.230
= 0.913

c. At least two people will agree.
X = 2, 3, 4, or 5 people
P(X ) = 0.346 + 0.230 + 0.077 + 0.01
= 0.663
d. Fewer than three people will agree.
X = 0, 1, or 2 people
P(X ) = 0.078 + 0.259 + 0.346
= 0.683
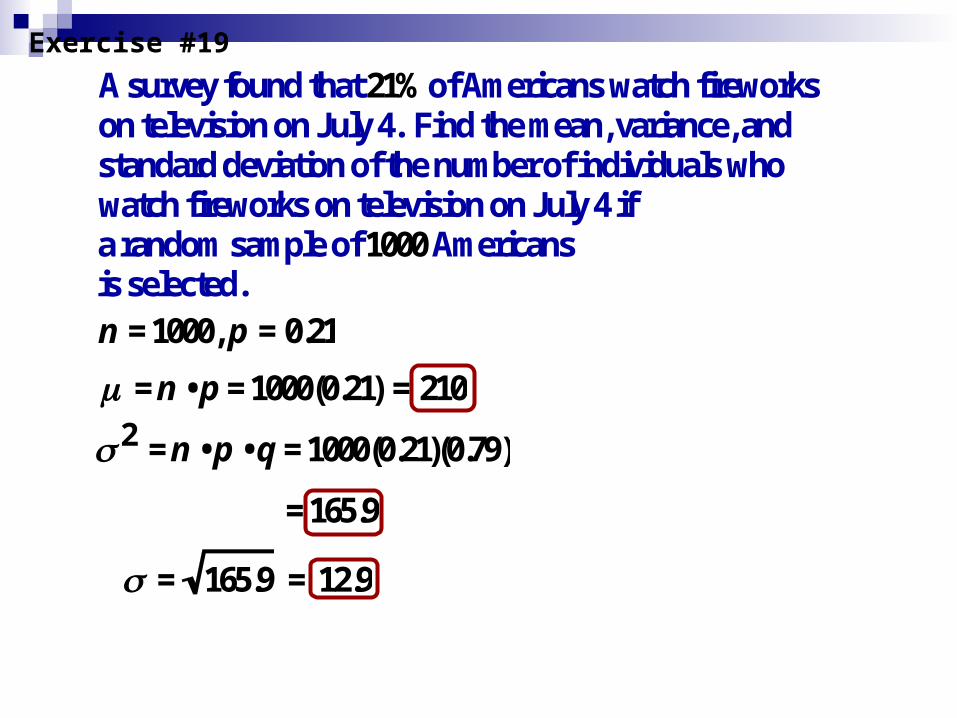
A survey found that 21% of Americans watch fireworks on television on July 4. Find the mean, variance, and standard deviation of the number of individuals who watch fireworks on television on July 4 if a random sample of 1000 Americans is selected.
n = 1000, p = 0.21
= n • p = 1000(0.21) = 210
2 = n • p • q = 1000(0.21)(0.79)
= 165.9 = 12.9
= 165.9
Exercise #19
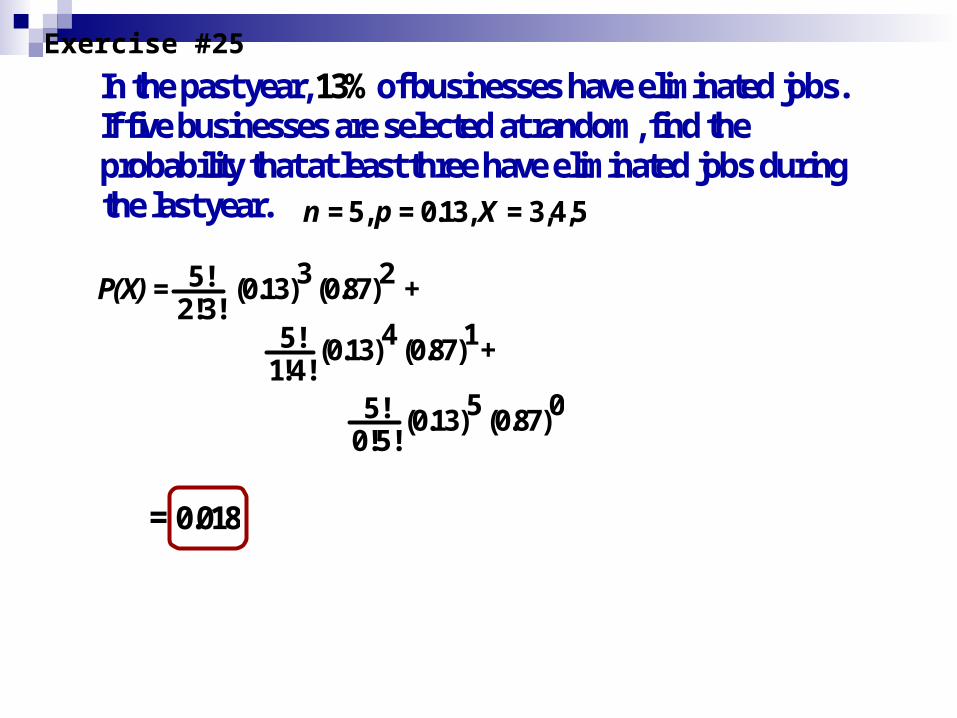
In the past year, 13% of businesses have eliminated jobs. If five businesses are selected at random, find the probability that at least three have eliminated jobs duringthe last year. n = 5, p = 0.13, X = 3,4,5
= 0.018
5!
1!4!(0.13)4 (0.87)1 +
P(X) = 5!
2!3!(0.13)3 (0.87)2 +
5!
0!5!(0.13)5 (0.87)0
Exercise #25

Chapter 5Discrete Probability Distributions
Section 5-3Example 5-18
Page #281
Bluman, Chapter 5 50
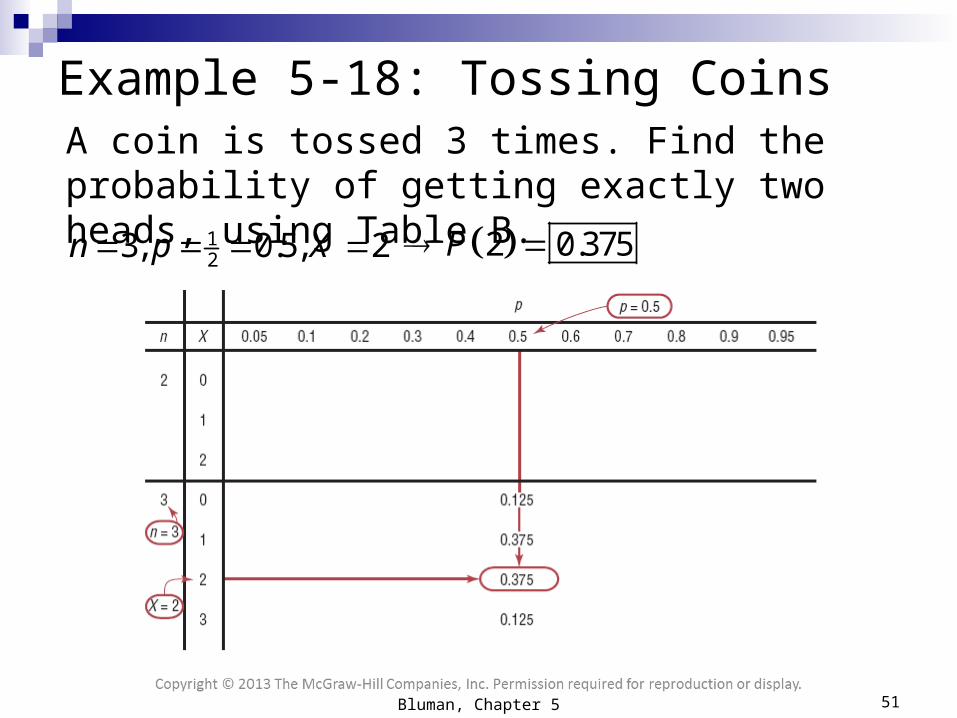
Example 5-18: Tossing CoinsA coin is tossed 3 times. Find the probability of getting exactly two heads, using Table B.
123, 0.5, 2 n p X 2 0.375 P
Bluman, Chapter 5 51
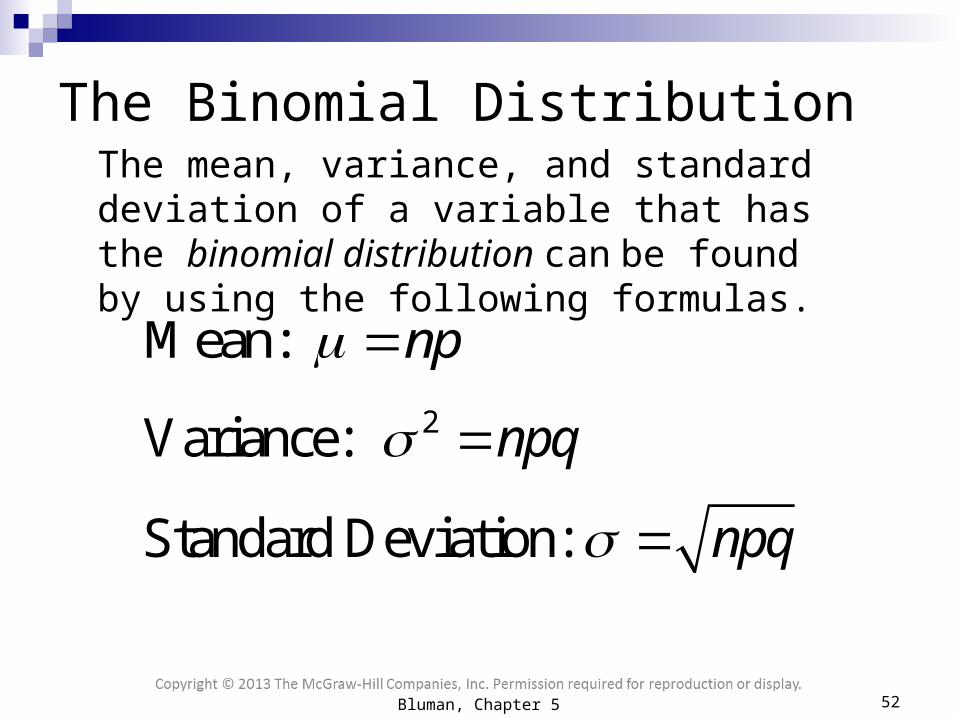
The Binomial Distribution
Mean: np2Variance: npq
The mean, variance, and standard deviation of a variable that has the binomial distribution can be found by using the following formulas.
Standard Deviation: npq
Bluman, Chapter 5 52

Chapter 5Discrete Probability Distributions
Section 5-3Example 5-23
Page #284
Bluman, Chapter 5 53
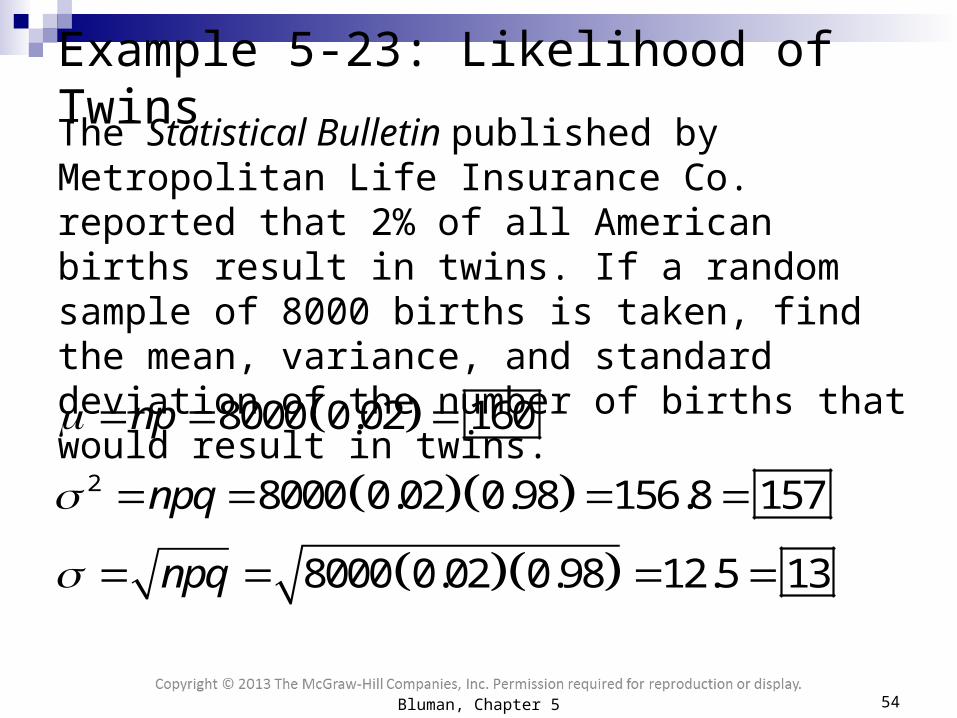
Example 5-23: Likelihood of TwinsThe Statistical Bulletin published by Metropolitan Life Insurance Co. reported that 2% of all American births result in twins. If a random sample of 8000 births is taken, find the mean, variance, and standard deviation of the number of births that would result in twins.
8000 0.02 160 np
2 8000 0.02 0.98 156.8 157 npq
8000 0.02 0.98 12.5 13 npq
Bluman, Chapter 5 54
Recommended