Chapter 21
The Monetary Policy and
Aggregate Demand Curves
© 2013 Pearson Education, Inc. All rights reserved. 21-2
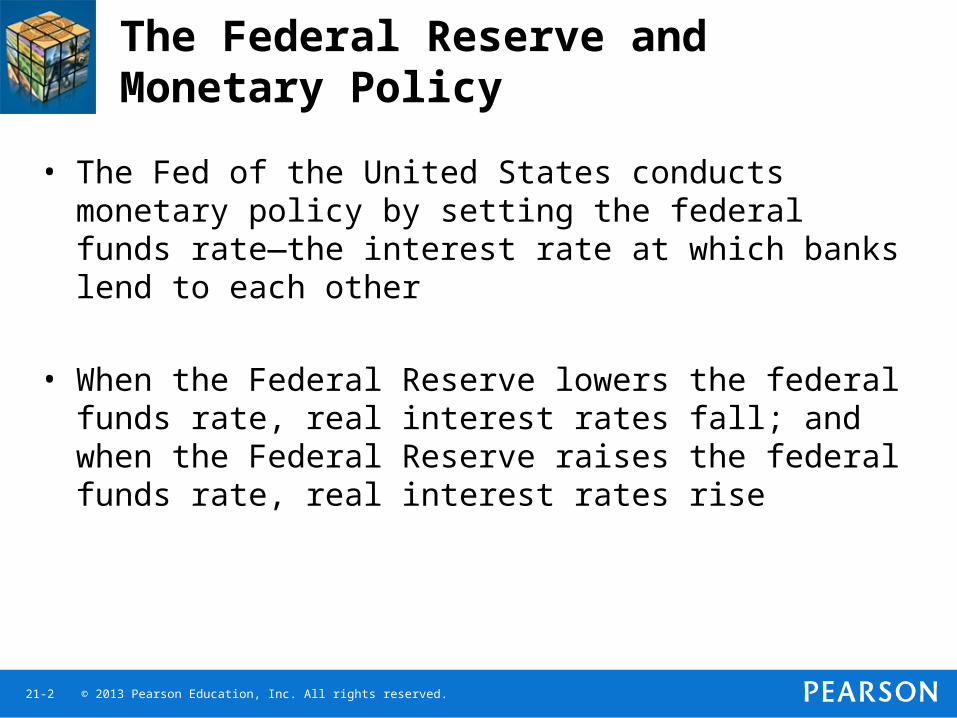
The Federal Reserve and Monetary Policy
• The Fed of the United States conducts monetary policy by setting the federal funds rate—the interest rate at which banks lend to each other
• When the Federal Reserve lowers the federal funds rate, real interest rates fall; and when the Federal Reserve raises the federal funds rate, real interest rates rise
© 2013 Pearson Education, Inc. All rights reserved. 21-3
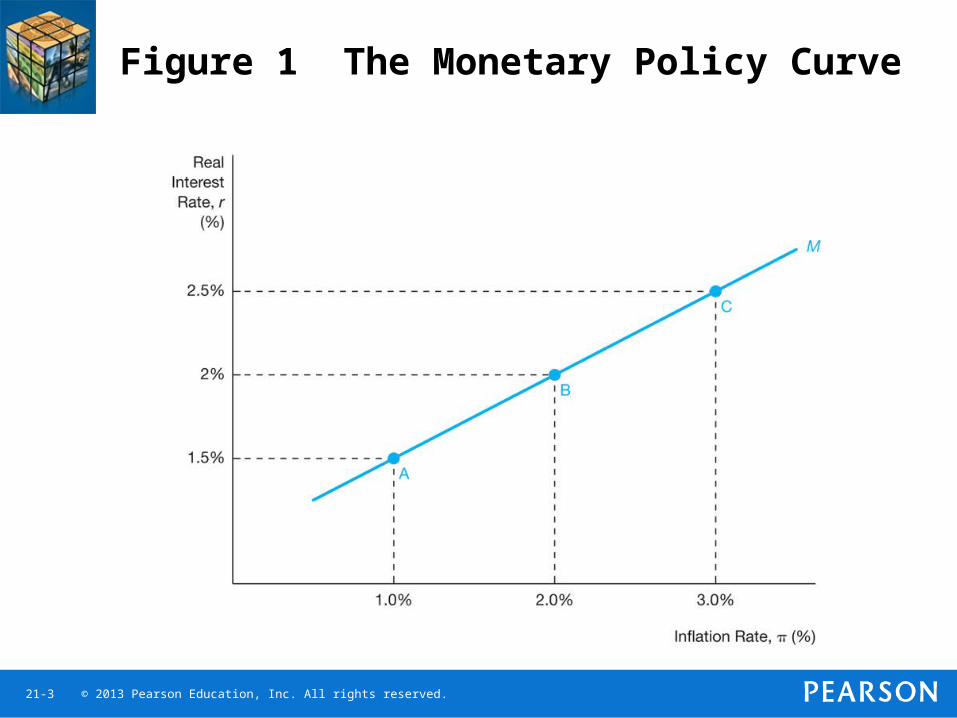
Figure 1 The Monetary Policy Curve
© 2013 Pearson Education, Inc. All rights reserved. 21-4
The Monetary Policy Curve
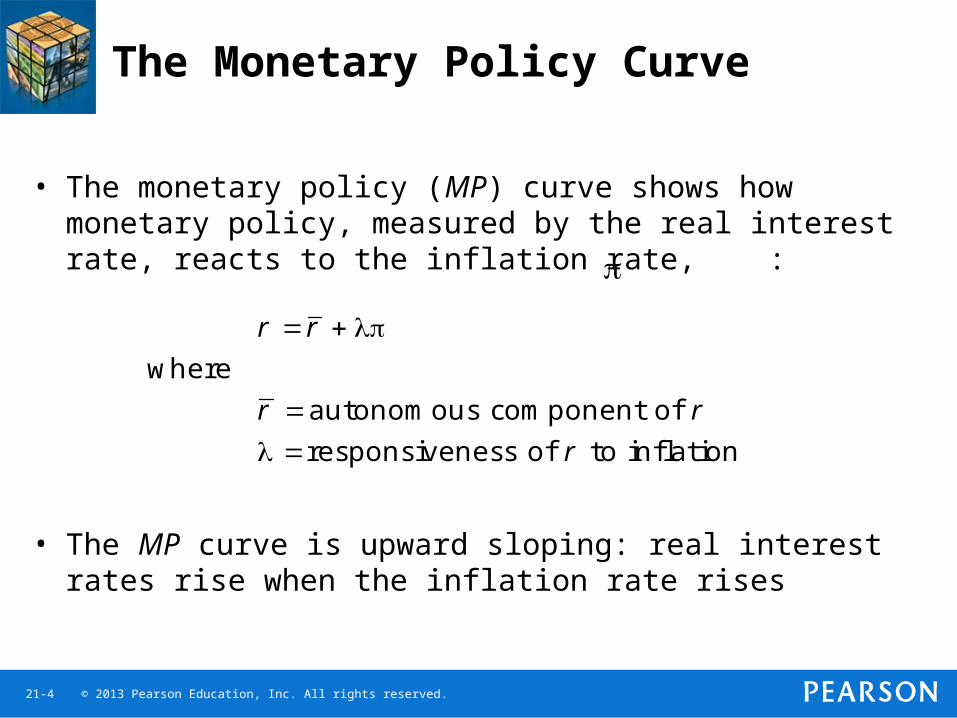
• The monetary policy (MP) curve shows how monetary policy, measured by the real interest rate, reacts to the inflation rate, :
• The MP curve is upward sloping: real interest rates rise when the inflation rate rises
where
autonomous component of
responsiveness of to inflation
r r
r r
r
© 2013 Pearson Education, Inc. All rights reserved. 21-5
The Taylor Principle: Why the Monetary Policy Curve Has an Upward Slope
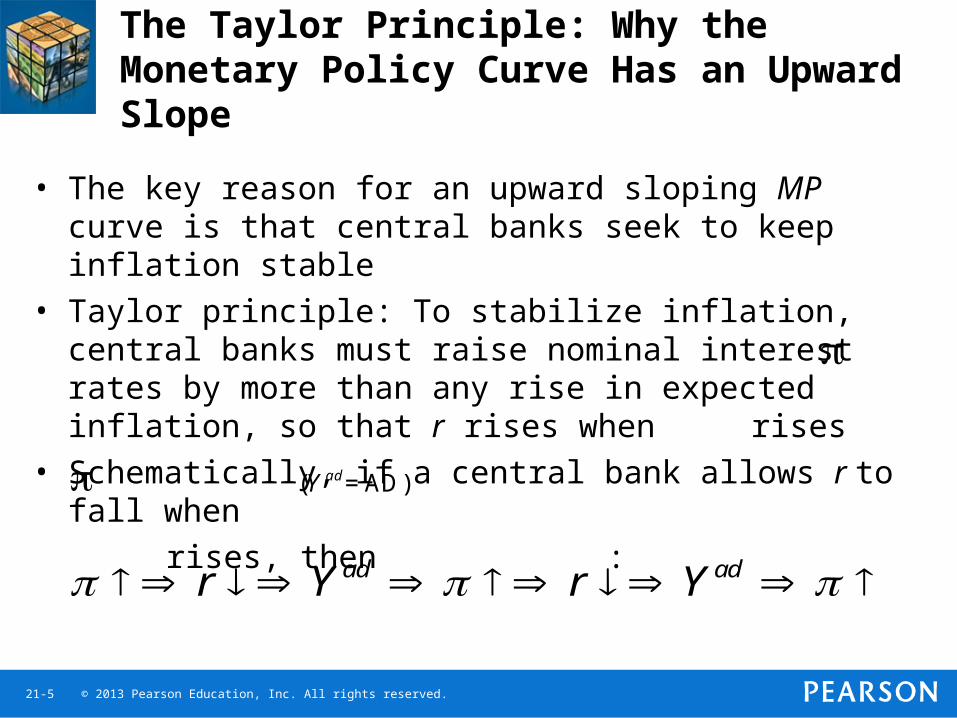
• The key reason for an upward sloping MP curve is that central banks seek to keep inflation stable
• Taylor principle: To stabilize inflation, central banks must raise nominal interest rates by more than any rise in expected inflation, so that r rises when rises
• Schematically, if a central bank allows r to fall when
rises, then : ( =AD)adY
ad adr Y r Y
© 2013 Pearson Education, Inc. All rights reserved. 21-6
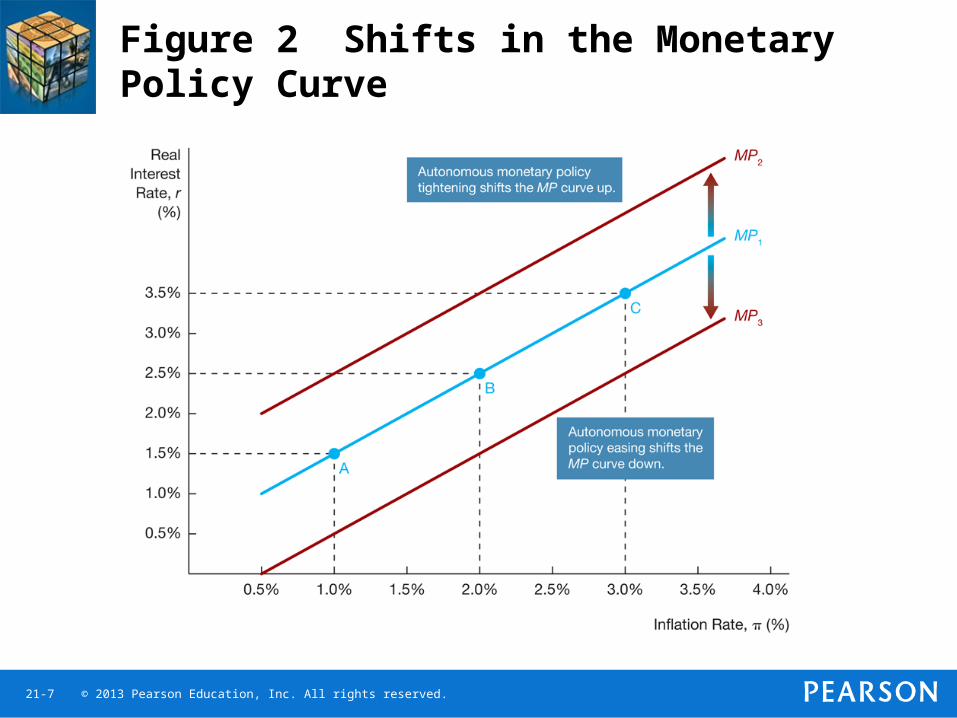
Shifts in the MP Curve
• Two types of monetary policy actions that affect interest rates:– Automatic (Taylor principle) changes as reflected
by movements along the MP curve– Autonomous changes that shift the MP curve
• Autonomous tightening of monetary policy that shifts the MP curve upward (in order to reduce inflation)
• Autonomous easing of monetary policy that shifts the MP curve downward (in order to stimulate the economy)
© 2013 Pearson Education, Inc. All rights reserved. 21-7
Figure 2 Shifts in the Monetary Policy Curve
© 2013 Pearson Education, Inc. All rights reserved. 21-8
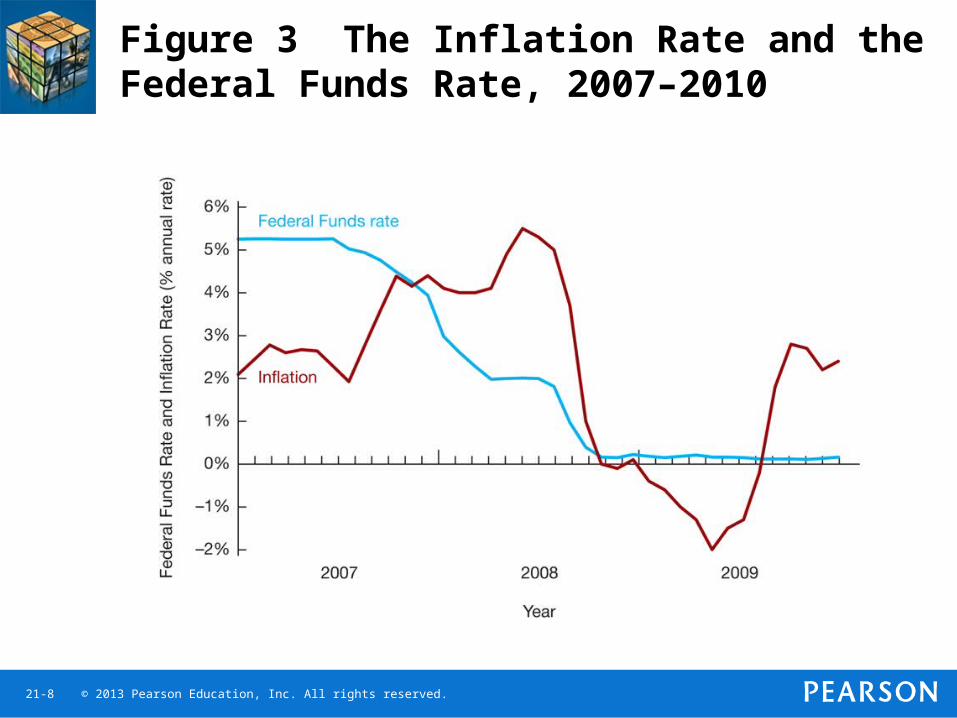
Figure 3 The Inflation Rate and the Federal Funds Rate, 2007–2010
© 2013 Pearson Education, Inc. All rights reserved. 21-9
The Aggregate Demand Curve
• The aggregate demand curve represents the relationship between the inflation rate and aggregate demand when the goods market is in equilibrium
• The aggregate demand curve is central to aggregate demand and supply analysis, which allows us to explain short-run fluctuations in both aggregate output and inflation
© 2013 Pearson Education, Inc. All rights reserved. 21-10
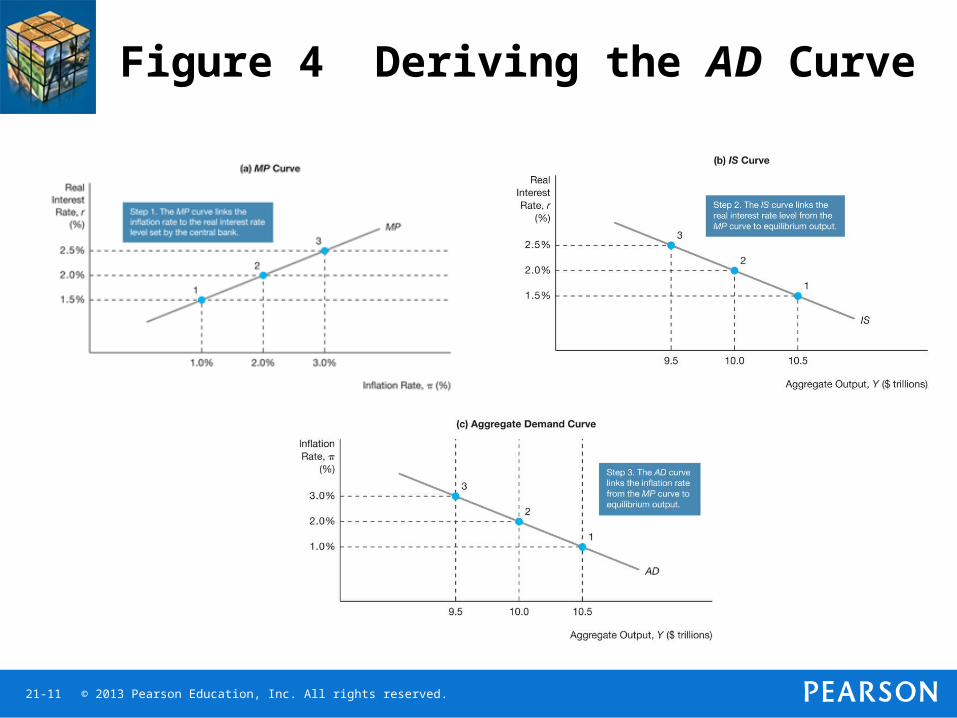
Deriving the Aggregate Demand Curve Graphically
• The AD curve is derived from:– The MP curve– The IS curve
• The AD curve has a downward slope: As inflation rises, the real interest rate rises, so that spending and equilibrium aggregate output fall
© 2013 Pearson Education, Inc. All rights reserved. 21-11
Figure 4 Deriving the AD Curve
© 2013 Pearson Education, Inc. All rights reserved. 21-12
Factors that Shift the Aggregate Demand Curve
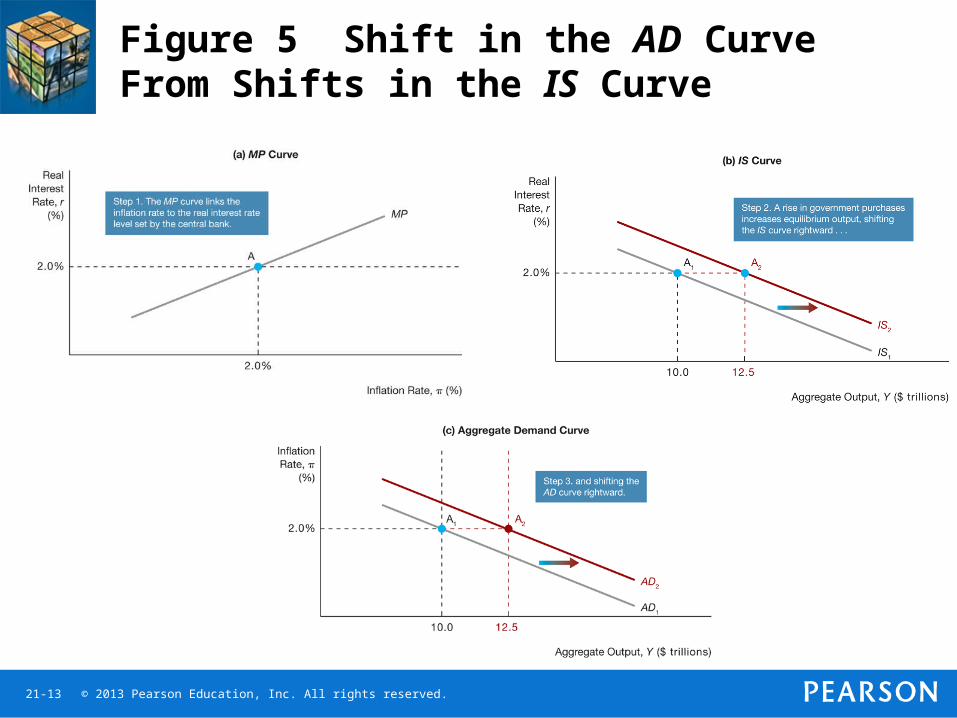
• Shifts in the IS curve– Autonomous consumption expenditure– Autonomous investment spending– Government purchases– Taxes– Autonomous net exports
• Any factor that shifts the IS curve shifts the aggregate demand curve in the same direction
© 2013 Pearson Education, Inc. All rights reserved. 21-13
Figure 5 Shift in the AD Curve From Shifts in the IS Curve
© 2013 Pearson Education, Inc. All rights reserved. 21-14
Factors that Shift the Aggregate Demand Curve (cont’d)
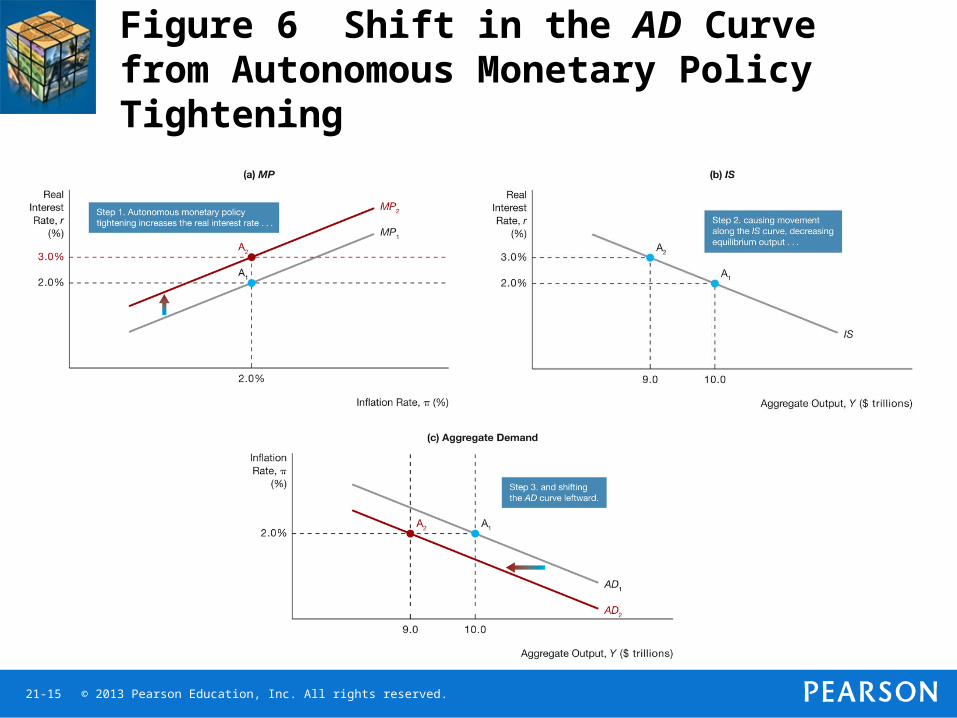
• Shifts in the MP curve– An autonomous tightening of monetary policy,
that is a rise in real interest rate at any given inflation rate, shifts the aggregate demand curve to the left
– Similarly, an autonomous easing of monetary policy shifts the aggregate demand curve to the right
© 2013 Pearson Education, Inc. All rights reserved. 21-15
Figure 6 Shift in the AD Curve from Autonomous Monetary Policy Tightening
Recommended