30
CHAPTER 2
GEOGRAPHY, METEOROLOGY
AND CLIMATOLOGY OF THE
SISTAN BASIN
2.1 Geography of the Sistan Basin
The Sistan basin lies between the Hindu Kush Mountains in Afghanistan and the
mountain ranges flanking the eastern border of Iran and is the depression that receives the
discharge of the Helmand River in the lower Helmand Basin (Fig. 2.1) and was often
described by explorers, military men and natural scientists of the 19th and early 20th
centuries as one of the most desolate deserts on the globe. It is a large and remote desert
basin, extremely arid and known for its windstorms, extreme floods and droughts; the
lower Helmand Basin in Afghanistan (Fig. 2.1) is considered to be the easternmost
extension of the Iranian Highlands. The closed basin receives the waters of the Helmand
River, the only major perennial river in western Asia between the Tigris-Euphrates and
Indus rivers. The Helmand and its tributary streams drain the southern Hindu Kush Moun-
tains of Afghanistan and flow into an otherwise waterless basin of gravel plains and sandy
tracts before terminating in Sistan (also Seistan, British spelling), a depression containing
the large delta of the Helmand river and a series of shallow, semi-connected playas at the
western edge of the basin (Fig. 2.2).
Extensive archeological ruins in the Helmand valley, on the Helmand delta and
around the terminal lakes are evidence that the Helmand River was a major focal point for
the development of early civilizations in western Asia. In fact, archeological excavations
at Shahr-i Sokhta (Tosi 1973, 1976, Whitney, 2006), located at the edge of the Hamoun
Helmand (Hamoun is a lake) (Fig. 2.2), revealed that human societies developed
rudimentary irrigation systems and lived in proto-urban settings by 3,200 B.C., several
centuries before the great Harappan cities of the Indus valley civilization appeared on the
cultural horizon.

31
Figure 2.1: Landsat 5 image showing the lower reaches of the Helmand River which terminate in the Sistan Basin, and also the general Sistan region. Note that the Sistan Basin lies between the Hindu Kush ranges in Afghanistan (top right of image) and the mountain ranges flanking eastern
Iran (lower left of image) (Sources: Whitney, 2006)
Figure 2.2: Topographic map and hydrological network and of Sistan Basin. The location of Zabol (a city in Sistan region) is indicated by the white circle (30° 57’N, 61° 34’E).

32
Sistan is also known historically as the “breadbasket of western Asia’’ (Goldsmid,
1876). Agricultural civilizations have occupied the deltaic plains in Sistan intermittently
and as late as the early 16th century A.D. After the early 16th century, Sistan was not
restored to its former prosperity. At present, a large field of active barchan dunes overlies
most of the agricultural plain on the Afghan side of the Helmand inland delta. This plain
was once the most prosperous and densely populated tract in the delta region.
In 1949 the US initiated a new program for the improvement of underdeveloped
areas of the world. The damming of the Helmand River in southern Afghanistan became
one of the showcase projects of U.S. foreign aid in the “Third World” after World War II.
Set up as the Helmand-Arghandab Valley Authority (HAVA), dams were built on the
Helmand River and its main tributary (Arghandab River) during the 1950s. The project
goals were to provide hydroelectric power, increased agricultural productivity through
irrigation and land reclamation. The Arghandab dam, located northwest of the city of
Kandahar, was completed in 1952 with a height of 145 feet (44.2 meters) and storage
capacity of 388,000 acre-feet (478.6 million cubic meters). The larger Kajakai dam on the
Helmand was completed a year later with a height of 300 feet (91.4 meters) and length of
919 feet (280 meters) and storage capacity of 1,495,000 acre-feet (1,844 million cubic
meters). About 300 miles (482.8 kilometers) of concrete-lined canals were built to
distribute the reservoir waters (Whitney, 2006)
The Sistan depression is covered by Quaternary sediments with a maximum
thickness of about 500 m in the central part of the plain (Lashkaripour and Soloki, 2002).
The main source of the Quaternary sediments is weathering of geological formations in the
Hindu-Kush Mountains in the eastern part of Afghanistan that have been eroded by fluvial
processes and with the detritus deposited in the plain where the topography is smooth with
a low slope. The major portion of this sediment is made up of clay and silt. Therefore fine-
grained soils including silt and clay as shown in Fig 2.3 are the main surface cover for the
Sistan Basin. In view of the Hirmand and the surrounding rivers that supply most of the
sediments to Sistan, a brief encapsulation of the relevant geology of the catchment area in
Afghanistan is given. Afghanistan has a very complex geology, encompassing two major
relatively young orogenies, Triassic and subsequent Himalayan, resulting in amalgamation
of crustal blocks and formation of concomitant ophiolites and younger clastic and
carbonate sedimentary rocks as well as basaltic lavas and, more recently, extensive
33
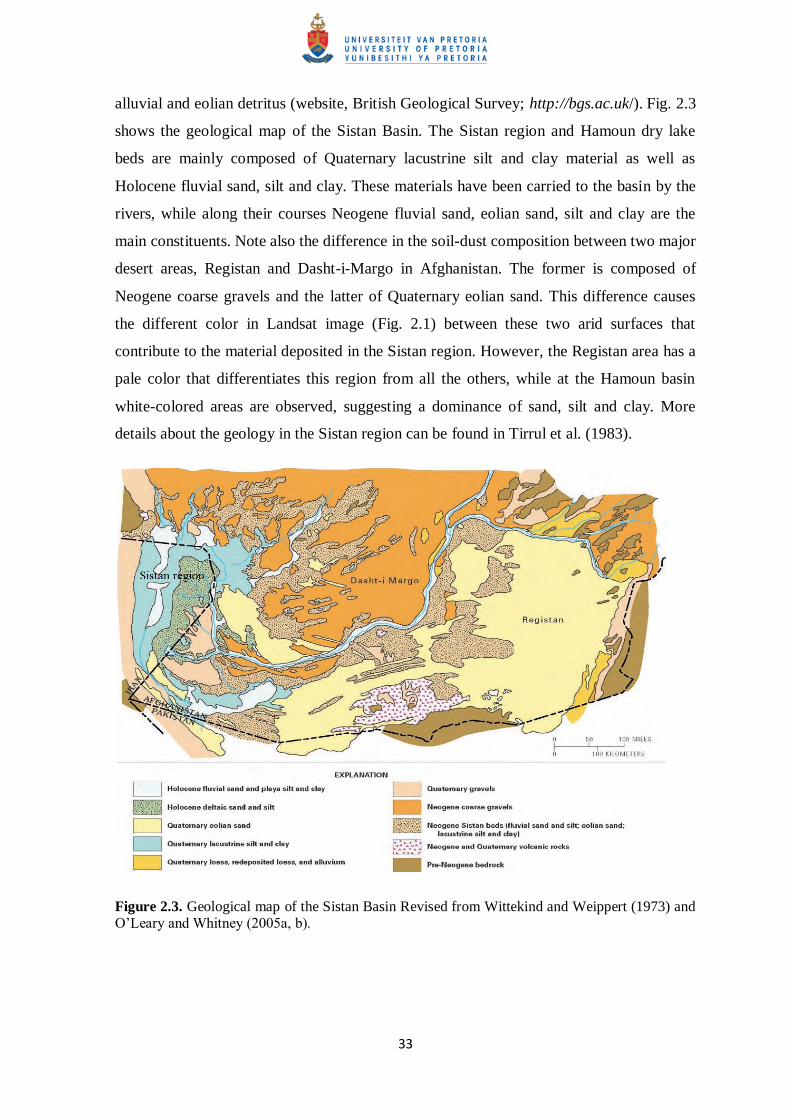
alluvial and eolian detritus (website, British Geological Survey; http://bgs.ac.uk/). Fig. 2.3
shows the geological map of the Sistan Basin. The Sistan region and Hamoun dry lake
beds are mainly composed of Quaternary lacustrine silt and clay material as well as
Holocene fluvial sand, silt and clay. These materials have been carried to the basin by the
rivers, while along their courses Neogene fluvial sand, eolian sand, silt and clay are the
main constituents. Note also the difference in the soil-dust composition between two major
desert areas, Registan and Dasht-i-Margo in Afghanistan. The former is composed of
Neogene coarse gravels and the latter of Quaternary eolian sand. This difference causes
the different color in Landsat image (Fig. 2.1) between these two arid surfaces that
contribute to the material deposited in the Sistan region. However, the Registan area has a
pale color that differentiates this region from all the others, while at the Hamoun basin
white-colored areas are observed, suggesting a dominance of sand, silt and clay. More
details about the geology in the Sistan region can be found in Tirrul et al. (1983).
Figure 2.3. Geological map of the Sistan Basin Revised from Wittekind and Weippert (1973) and O’Leary and Whitney (2005a, b).
34
2.2 The Sistan region in Iran
The Sistan region (30°5’ N - 31°28′ N and 61°15’ E - 61°50’ E), which is the main
study area for this thesis is located close to the Iranian border with Pakistan and
Afghanistan, in the south-eastern part of Iran in the north of the Sistan and Baluchistan
provinces and east of the Sistan basin (Fig. 2.4). It covers an area of approximately 15,197
km2 and has a population of about 400,000, of which half work in agricultural and animal
domesticated fields. The economy is strongly dependent on agriculture and the goods and
services provided by the wetlands. The Hirmand River from Afghanistan flows through
Sistan Plain and irrigates the Sistan agriculture areas that are about 120,000ha in size, and
finally discharges into the natural swamp of Hamoun (Fig. 2.3 to 2.4).
2.3 Hamoun Lakes
The Hamoun lakes (Fig. 2.4) are situated roughly at the termination of the Hirmand
river’s inland delta. The Hamoun lakes complex (Hamoun Puzak, Hamoun Sabori and
Hamoun Hirmand and Baringak) are located in the north of the Sistan region, which is
also the largest fresh water ecosystem of the Iranian Plateau and one of the first wetlands
in the Ramsar Convention (Moghadamnia et al. 2009). Water in the Hamoun lakes is
rarely more than 3 meters deep, while the size of the lakes varies both seasonally and from
year to year. Maximum expansion takes place in late spring, following snowmelt and
spring precipitation in the mountains. In years of exceptionally high runoff, the Hamoun
lakes overflow their low divides and create one large lake that is approximately 160 km
long and 8 to 25 km wide with nearly 4,500 km2 of surface area. Overflow from this lake
is carried southward into the normally dry Gaud-i Zirreh (Fig. 2.1), the lowest playa (463
meters above mean sea level) in the Sistan depression. Furthermore, mountain runoff
varies considerably from year to year. In fact, the Hamoun lakes have completely dried up
at least three times in the 20th century (Whitney, 2006). The maximum extent of the
Hamoun lakes following large floods is shown in Fig. 2.4, where a continuous large lake
has been created covering an extended area of ~4,500 km2 with a volume of 13000 million
m3. This figure corresponds to spring of 1998 after snowmelt in the Afghanistan
mountains that transferred large quantities of water into the Hamoun Basin. As a
consequence, livelihoods in the Sistan region are strongly dependent on the wetland

35
products and services, as well as on agricultural activities in the Sistan plain. Fishing and
hunting represent an important source of income for many households and, therefore, the
local and regional economy is strongly dependent on weather conditions, precipitation and
land use – land cover changes. The political boundary between Iran and Afghanistan splits
the Hamoun system, further complicating management possibilities in the area. Most
(90%) of the watershed is located in Afghanistan and practically all of the wetlands’ water
sources originate there. The Iranian part is desert, and produces runoff only in rare cases of
significant local rainfall (UNEP, 2006).
Figure 2.4. Position of the Hamoun Lakes in Iran and Afghanistan, showing a maximum
inundation period.
2.4 Droughts in the Sistan Basin
The Sistan Basin has recently experienced an unusually long 10-year drought
starting in 2000 (UNEP, 2003, 2006). Combined with war and severe political disruption
over the past two decades, the 10-year drought has created conditions of widespread
famine that affected many people in eastern Iran and southwestern Afghanistan. A
suggested, climatic forcing mechanism has been proposed for the recent drought by

36
Barlow and others (2002). A prolonged El Niño-Southern Oscillation (ENSO) cold phase
(known as La Niña) from 1998 to 2001 and unusually warm ocean waters in the western
Pacific appear to have contributed to the prolonged drought. The unusually warm waters
(warm pool) resulted in positive precipitation anomalies in the Indian Ocean and negative
anomalies over central Afghanistan (Barlow et al., 2002), thus contributing to the drying
of the Hamoun Basin. The contrast between a relatively wet year in 1976 and the nearly
dry Hamoun lakes in 2001 is shown in Fig. 2.5. Millions of fish and unknown number of
wildlife and cattle died. Agricultural fields and approximately 100 villages were
abandoned, and many succumbed to blowing sand and moving dunes (Partow, 2003).
Most of the Sistan population lives near the Hamoun lakes and is employed in
agricultural, fishery, handicrafts and other occupations. To counter the effects of droughts,
the Iranian government prepared facilities such as food and flour supplies, medicine and
health services and employment in the region to prevent the forced emigration of people,
but the continuous and extreme droughts have forced some people to leave the Sistan
region. Long droughts at the end of the 1960s, middle of the 1980s, and from 1999 to 2010
affected the Sistan region significantly and resulted in desiccation of the Hamoun lakes,
making the surrounding lands saline and disturbing their soil fertility, while some places
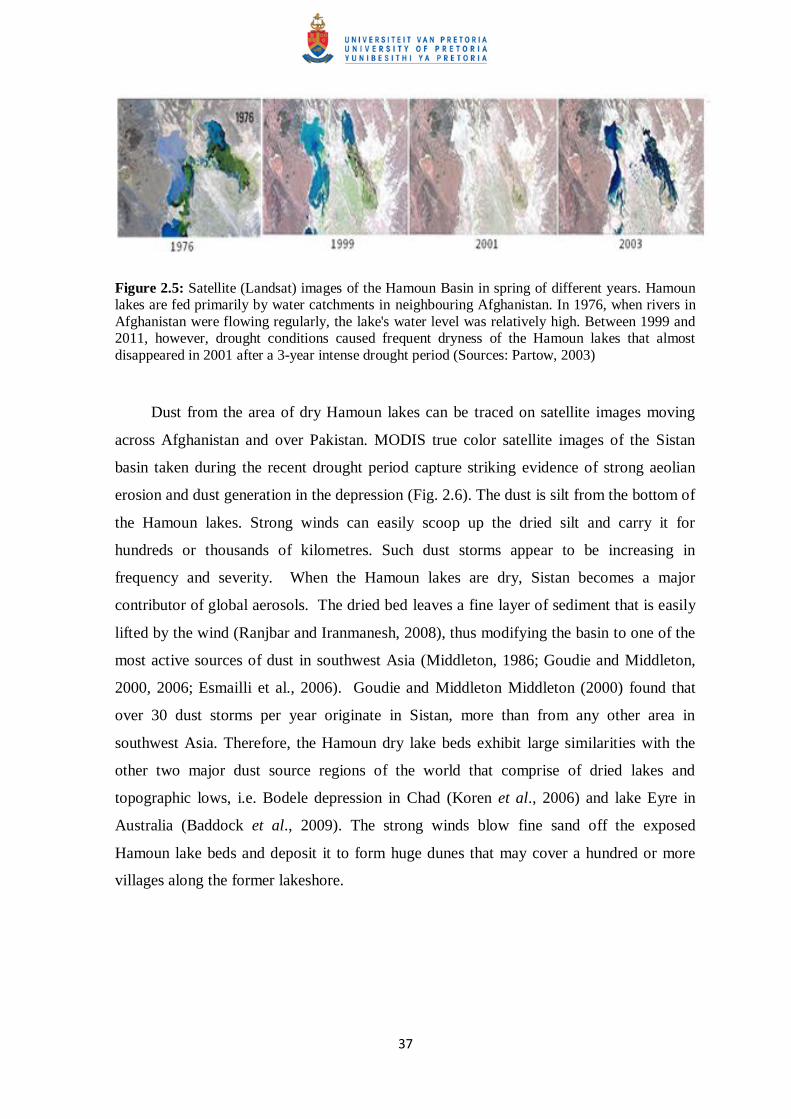
became barren (see Fig. 2.5). The most important findings in Fig. 2.5 are: (1) in 1976, the
Hamoun lakes were still thriving. Dense reed beds appear as dark green, while tamarisk
thickets fringing the margins of the upper lakes show up as pink shades in the satellite
images (Fig. 2.6). Bright green patches represent irrigated agricultural lands, mainly wheat
and barley. The lakes flood to an average depth of half a meter, denoted by lighter shades
of blue, while dark blue to black indicates deeper waters, which, however, do not exceed
four meters. (2) By 2001, the Hamoun lakes had vanished since central and southwest
Asia were hit by the largest persistent drought anywhere in the world (Partow, 2003). The
only sign of water in this scorched landscape of extensive salt flats (white) is the Chah
Nimeh reservoir in the southern part of Sistan (see Fig. 2.4), which is now only used for
drinking water. Degraded reed stands in muddy soil are visible as dark green hues at the
southern end of Hamoun Puzak. In 2003 the Hamoun Basin was covered with water again,
but with significantly lower coverage than in the mid-1976s (Partow, 2003).
37
Figure 2.5: Satellite (Landsat) images of the Hamoun Basin in spring of different years. Hamoun lakes are fed primarily by water catchments in neighbouring Afghanistan. In 1976, when rivers in
Afghanistan were flowing regularly, the lake's water level was relatively high. Between 1999 and 2011, however, drought conditions caused frequent dryness of the Hamoun lakes that almost
disappeared in 2001 after a 3-year intense drought period (Sources: Partow, 2003)
Dust from the area of dry Hamoun lakes can be traced on satellite images moving
across Afghanistan and over Pakistan. MODIS true color satellite images of the Sistan
basin taken during the recent drought period capture striking evidence of strong aeolian
erosion and dust generation in the depression (Fig. 2.6). The dust is silt from the bottom of
the Hamoun lakes. Strong winds can easily scoop up the dried silt and carry it for
hundreds or thousands of kilometres. Such dust storms appear to be increasing in
frequency and severity. When the Hamoun lakes are dry, Sistan becomes a major
contributor of global aerosols. The dried bed leaves a fine layer of sediment that is easily
lifted by the wind (Ranjbar and Iranmanesh, 2008), thus modifying the basin to one of the
most active sources of dust in southwest Asia (Middleton, 1986; Goudie and Middleton,
2000, 2006; Esmailli et al., 2006). Goudie and Middleton Middleton (2000) found that
over 30 dust storms per year originate in Sistan, more than from any other area in
southwest Asia. Therefore, the Hamoun dry lake beds exhibit large similarities with the
other two major dust source regions of the world that comprise of dried lakes and
topographic lows, i.e. Bodele depression in Chad (Koren et al., 2006) and lake Eyre in
Australia (Baddock et al., 2009). The strong winds blow fine sand off the exposed
Hamoun lake beds and deposit it to form huge dunes that may cover a hundred or more
villages along the former lakeshore.

38
Figure 2.6. MODIS image (weather satellite) of dust deflation from the dry Hamoun lakes in Sistan on August 13, 2004. The intense dust plumes form a giant U shape that extends from Sistan
into southern Afghanistan and southwestern Pakistan, and obscures the surface over much of the region. The pale color of the dust plume is consistent with that of dried wetland soils. The dust is
blowing off the dry lake beds that become the Hamoun wetlands during wet years
2.5 Climatology of Sistan region
The current research failed to find an extensive study of the climatology of the Sistan
region. However the climate of the Sistan region is often classified as totally dry.
According to the Koppen and De Martonne methods, the climatology of Sistan is defined
as dry, also definable as Saharan and mild desert when applying the Ivanove and Amberge
methods, respectively. The mean annual precipitation (1963 to 2010) is 53 mm and in wet
years this rate reached 120 mm. However, in some bad years there is almost no
precipitation (e.g. 9 mm for 2001 to 2002). This low precipitation makes it impossible for
any kind of farming. In these conditions an external water resource is needed and the
Hirmand trans-boundary river plays such a role. The annual evaporation is more than 4
meters which underlines the vulnerability of the region to climate change, such as more
droughts, or a decreasing flow discharge to the Hamoun lakes. This potential evaporation
rate is among the highest rates recorded around the globe (Zawar-Reza et al., 2006).

39
Sistan is also one of the windiest deserts in the world. In the Sistan depression, active
wind erosion and/or sand movement occurs wherever vegetation is not supported by
irrigation or ground water. The topography in Sistan has been and continues to be
dominated by the interplay of aeolian and fluvial processes in the depression. Wind-eroded
yardangs (McCauley et al., 1977) and dune fields are common features in Sistan. Active
dunes presently cover most of the agricultural fields that supported multiple historical
societies over the past 3,000 years (Whitney and Trousdale, 1982, 1984). Sistan
inhabitants historically adapted to these winds. Nearly all structures were constructed with
their long walls parallel to the north - northwest wind direction and during medieval times,
uni-axle windmills were constructed for grinding grain. In modern Iranian Sistan, small
wind intakes (bad geres) are built on the top of village houses as a form of air conditioning
during the summer. However, summer winds blow steadily from the north and northwest
and is locally called the bad-i-sad-o-bist ruz, or “Wind of 120 Days, or “Levar.” The Levar
wind over Sistan originates from the plains in Turkmenistan via the gap between the
Alborz Mountain ranges and the Hindu Kush (Zawar reza et al., 2006). This wind has a
significant effect on the landscape and the lives of the basin’s inhabitants. Eolian erosional
and depositional landforms dominate much of the desert basin and drifting sand has been a
principal natural determinant in changing irrigation patterns and the location of
agricultural endeavours.
The position of the summer low pressure (monsoon) system over the mountains in
Pakistan is the principal reason that why high pressure air is drawn into Sistan from the
Caspian Sea region (Ganji, 1968; Kendrew, 1961). Sivall (1977) compilation of pressure
data in Afghanistan, however, shows that a significant heat low develops over the Dasht-i
Margo (fig 2.2) independent of the heat low centered over western Pakistan near the town
of Sibi, in the Indus plain. The position of this heat low over the basin explains the pattern
and direction of dunes in the basin. Wind stream lines, as observed on Landsat images of
south-western Afghanistan, curve in a counter clockwise motion from the Sar-o-Tar area
to the Registan (Fig 2.2). Low, and isolated mountains along the southern edge of the
basin cannot alone account for such a massive wind deflection. Thus, the wind direction is
a direct consequence of the Dasht-i Margo thermal low. In a strict sense, the “Wind of 120
Days” is a trade wind that is accelerated and deflected by a local heat low before the dry,
originally polar, air can reach the Intertropical Convergence Zone (ICZ), which is located

40
over the north-south-striking Sulaiman Mountains of Pakistan (Whitney, 2006). The
Sulaiman mountains, and the mountains along the Makran coast, also serve as a southern
barrier to the moisture-bearing monsoons. Occasionally, monsoons do invade the high
mountainous areas of eastern Afghanistan and cause summer floods (Sivall, 1977). Some
of this precipitation may enter Sistan from eastern tributaries of the Helmand River. The
“Wind of 120 Days” or Levar is stronger in the Sistan region than over the rest of the
Sistan Basin. Stronger winds are concentrated along the western edge of the basin because
the wind accelerates along a long, narrow corridor between the mountains of Iran and
Afghanistan. The “Levar” is felt further south in Baluchistan. However, its intensity is not
as great. The maximum monthly mean wind speed at Nok Kundi, Pakistan, is about 4 m.s-
1 (Takahashi and Arakawa, 1981).
According to the members of the Sistan Arbitration Commission who have lived in
Sistan from 1903 to 1905, the “Wind of 120 Days” blows almost constantly day and night
during the hottest months of the year. Sustained, hurricane-force winds of 29 to 36 m.s-1
are frequently experienced. One storm in 1905 recorded an average velocity of 39.3 m.s-1
for a 16-hour period. During that storm, a maximum velocity of 53.6 m.s-1
was recorded
(McMahon, 1906). The pebbles, sand, dust and debris carried by the wind, plus its
continual noise, make living conditions particularly uncomfortable during summer months
The approach of a windstorm is the same in summer as in winter. The days
preceding the arrival of the storm become slightly, but detectably warmer and the air
become still, or a slight breeze may blow from the southeast. Less than a day before the
gale arrives, small cirrus clouds usually appear in the northwest. Strong winds may arrive
suddenly, over a time interval of only a few minutes, or the winds may build strength over
half a day. A marked rise in temperature normally accompanies the wind. However, when
the strong winds abate, normally after several days, the air temperature is noticeably
cooler. Calm days then begin to become more frequent and the temperature begins to rise
again, seemingly initiating the next windstorm cycle (Whitney, 2006).
In the summer, daily winds blow on average at speeds of about 9 to 11 m.s-1
(20 to
25 miles per hour), with gusts up to 18 to 22 ms-1
(40–50 miles per hour) (U.S. Agency for
International Development, 1976). Evidence that these strong winds existed in historical
times is attested to by dated deposits of eolian sand and by the standing remains of

41
windmills that are found both in and outside the delta region. The most commonly found
windmills were built in the 14th to 15
th centuries and were used to grind grain (Whitney
and Trousdale, 1982, 1984).
The synoptic weather conditions are a consequence of the Indian thermal low that
develops over the whole of south Asia during the summer monsoon, and which have a
direct impact on the intensity of the winds over the region, which are as high as 12 ms-1
on
a monthly mean basis during June and July (Fig. 2.9b), with gusts often above 20 to 25
ms-1
. In contrast, during late autumn and winter the wind speed is limited to ~3 to 4 ms-1
.
Figure 2.7 shows wind roses for Zabol during the period 1963 to 2010. In all seasons, the
northwestern flow clearly dominates, being more apparent in summer, while the high
percentages for intense winds are also associated with the northwestern direction. In
contrast, the possibility for intense winds blowing from other directions is very low. The
summer winds are much stronger with ~27% of the wind speeds being above 11 ms-1
,
while calm conditions are limited to 2.9% for summer against 8.0, 18.8% and 19.6% for
Spring, autumn and winter, respectively. The higher frequency and intensity of the
northwestern winds is the reason for frequent dust storms affecting Zabol that is located in
the downwind direction of the dust storms that originates from the Hamoun lakes.
Figure 2.7: Wind roses of the seasonal wind speed and direction in Zabol during the period 1963 to 2010. The percentage of calm events is shown at the bottom of each wind rose. The thickest bar represents wind speeds in excess of 11 ms
-1).

42
The annual cycle of monthly average wind speed exhibits fairly large seasonal
variation, with maximum values in summer (June to August) and minimum values during
winter (December to February) (Fig 2.8). Continuance of the Levar wind in September
also causes a high average wind speed for autumn. The diurnal cycle of the wind speed is
high at 12 ms-1
at noon and then decreases to a minimum of 7ms-1
in the evening.
Figure 2.8: Diurnal cycle and seasonal variability in wind speed at Zabol.
Fig. 2.9a presents the annual mean variation of mean Temperature, Relative
Humidity (RH) and atmospheric pressure over Zabol for the period 1963-2010. The
monthly mean tempreture exhibits a clear annual pattern with low values in winter (9-12
oC) and high (~35
oC) in summer following the common pattern found in the northern
Mid-latitudes. During the summer period the maximum tempreture often goes up to 46-48
oC causing an extremely large diurnal variation, characteristic of the desert environment.
RH illustrates an inverse annual variation with larger values in winter (50-57%) and very
low values in summer (~25%), which are about 10-15% during daytime. In Sistan, the
atmospheric pressure presents generally high values in winter (1020-1024 hPa) and is
above the mean sea level value of 1013.25 hPa during the period October to April, before
starting to decrease during summer (June to August) season (~ 996 hPa in July). There is a
considerable gradient between the low pressure system over Pakistan and the high
pressure region over the Himalayas (Zawar reza et al., 2006), with flow directed towards

43
Jan Feb MarAprMay Jun Jul Aug Sep Oct Nov Dec5
10
15
20
25
30
35
40
45
50
55
60
Temperature
RH
Pressure
Month
Tem
pera
ture (
oC
), R
H (
%)
996
1000
1004
1008
1012
1016
1020
1024
Pressu
re (h
Pa)
the Sistan basin. The gradient over the Sistan region itself is shallow. The geopotential
height distribution over Sistan points to a generally northerly flow.
The annual variation of visibility follows an inverse pattern to that of wind speed
(Fig. 2.9b), with large values in winter, usually above 10 km, and very low in summer (<4
km, on average). A decreasing curve relation associated with 93% of the variance holds
between wind speed and visibility. This inverse relation indicates that the wind speed does
not act as a ventilation mechanism over Zabol, as usually occurs in coastal urban
environments with local sea-breeze cells (Adamopoulos et al., 2007), but rather as a factor
responsible for the deterioration of visibility, since the intense Levar winds are the genetic
cause for the dust outbreaks over Sistan.
Figure 2.9. Monthly mean variation of air temperature, Relative Humidity (RH) and atmospheric pressure (a), and Visibility and wind speed (b) at Zabol over the period 1963 to 2010. R
2 is
determination coefficient of linear regression between Visibility and wind speed.
Although the visibility exhibits a clear annual pattern (Fig. 2.9a), long-term data
series over Zabol show that it also presents considerable year-to-year variations (Fig.
2.10b). Focusing on recent years, the days with visibility <= 2 km havingdramatically
increased from about 20 during 1995 to 1999 to >100 in 2000 to 2001, following a severe
drought period that dried the largest part of the Hamoun wetlands and favored alluvial
uplift, the frequency and mass intensity of dust storms that affected the visibility over
Sistan. In the 2000s, days with very low visibility seem to have decreased, but remaining
above the standards of the climatological mean. Furthermore, except for the intensity, the
duration of dust storms over Zabol exhibit a clear annual pattern with a higher duration in
Jan Feb Mar Apr May Jun Jul Aug Sep Oct Nov Dec2
3
4
5
6
7
8
9
10
11
Vis=26.67xWD-0.81
, R2=0.93
visibility
wind speed
Month
Vis
ibil
ity
(k
m)
2
3
4
5
6
7
8
9
10
11
12
13
14
Win
d sp
eed
(ms
-1)

44
June (about 50 hours on average) (Fig. 2.10a). In further contrast, during the period
October to April dust storms are characterized by a low frequency and duration, below 5
hours, although in some cases they may still be intense.
Figure 2.10: (a) Annual variation of the average duration of dust storms (in hours) over the period
1999 to 2010, and (b) year-to-year variation of the visibility recorded at Zabol
2.6 Temporal changes of Hamoun dry lake beds and dust storms
The water levels in the Hamoun lakes change considerably from year to year as has
been discussed above. Table 2.1 summarizes the percentage of water surface in July in the
Hamoun lakes, as well as the annual precipitation and number of dusty days during the
period 1985-2005. Yearly variations of Hamoun lakes water surface identified four
periods from 1985 to 2005: (UNEP, 2006):
1. A low-water period from 1985 to 1988: the Hamoun dried out or shrunk to a very small
size almost every year, but there was some inflow every year.
2. A high-water period from 1989 to 1993: there was considerable inflow for five years,
during which time the Hamoun only shrunk below the previous period's maximum levels
for a very short time.
3. A medium-water period from 1994 to 1999: a dynamic balance of inflow and outflow
maintained a reasonably high minimum water volume every year.
4. A dry period from 2000 to present: the inflow ceased and a catastrophic drought ensued
except for a flood in 2005 that immediately dried up before 2006.

45
Table 2.1: Yearly variability of percentage of water surface in Hamoun lakes in July, annual
precipitation and dusty days (visibility <= 2km) over Sistan region
Year Baringak Saberi Hirmand Puzak precipitation Dusty days
1985 0 30 7 35 25.6 88
1986 35 65 12 53 72.8 30
1987 25 40 2 53 8.7 91
1988 15 50 6 50 69.5 62
1989 90 92 60 54 26.1 38
1990 90 98 70 72 96.1 37
1991 80 95 90 80 85.8 41
1992 80 98 80 93 80.9 33
1993 75 95 70 60 52.4 46
1994 43 60 20 60 116.6 39
1995 48 66 7 62 76.2 21
1996 62 90 47 70 84.3 18
1997 60 85 25 60 76.4 23
1998 80 100 73 60 61.4 22
1999 72 90 25 60 87.7 28
2000 0 12 0 0 26.8 116
2001 0 0 0 0 7.2 110
2002 0 5 0 0 37.5 88
2003 0 0 0 0 32.3 92
2004 0 0 0 0 51.1 80
2005 80 90 18 32 129.5 41
The analysis (Table 2.2) shows that precipitation has a direct effect on water levels
(correlation coefficient (r) =0.63 for Hamoun Saberi). That is, in years with high
precipitation the lakes had high water surface. Hamoun Saberi is also affected by the Farah
river that has a closer watershed, but this correlation is low for both Hamoun Hirmand and
Hamoun Puzak (r = 0.35 and r =0.54 respectively). The correlation between dusty days
and percentage of dried Hamoun beds (100-percent of water surface) (fig 2.11) shows high
correlation coefficient values regarding Hamoun Saberi and Baringak (r =0.88 and r =0.82
respectively) and lower correlation for Hamoun Hirmand (r = 0.63). The high correlation
for the Hamoun Saberi and Baringak indicates that Sistan dust storms are directly affected
by the north and northwestern winds flowing through the Saberi.

46
Table 2.2: Correlations between percentage of Hamoun dried beds in July and number of dusty
days (1985 to 2005).
Hamoun Lakes Baringak Hamoun
Saberi
Hamoun
Hirmand
Hamoun
Puzak
Precipit
ation
Dusty
days
Baringak 1
Hamoun Saberi 0.96** 1
Hamoun Hirmand 0.84** 0.80** 1
Hamoun Puzak 0.80** 0.89** 0.74** 1
Precipitation -0.59** -0.63** -0.35 -0.54 1
Dusty days 0.82** 0.88** 0.60** 0.81** -0.730** 1
**. Correlation is significant at the 0.01 level
1984 1986 1988 1990 1992 1994 1996 1998 2000 2002 2004 2006
20
40
60
80
100
120
Dusty days
Baringak
Hamoun Saberi
Year
Du
sty
days
0
20
40
60
80
100
Dri
ed
bed
(%
)Figure 2.11: Yearly variability of the dusty days (visibility <= 2km) over Sistan region with
association to percentage of Hamoun dried beds (1985 to 2005). The lower coverage of the Hamoun Basin by water (high percentage of dried beds) corresponds to higher number of dusty
days over Sistan region.
Recommended