Chapter 2Displaying and Summarizing Categorical Data
D. Raffle
5/19/2015
Chapter 2 http://stat.wvu.edu/~draffle/111/week1/ch2/ch2.h...
1 of 23 05/21/2015 10:59 AM

Intro
Recall from Chapter 1 that categorical variables divide our data into groups (orcategories).
Consider a data set containing descriptions of the 1313 passengers aboard TheTitanic. The data looks like this:
Which variables are categorical?
## Name PClass Age Sex Survived## 1 Allen, Miss Elisabeth Walton 1st adult female alive## 2 Allison, Miss Helen Loraine 1st child female dead## 3 Allison, Mr Hudson Joshua Creighton 1st adult male dead## 4 Allison, Mrs Hudson JC 1st adult female dead## 5 Allison, Master Hudson Trevor 1st child male alive## 6 Anderson, Mr Harry 1st adult male alive
2/23
Chapter 2 http://stat.wvu.edu/~draffle/111/week1/ch2/ch2.h...
2 of 23 05/21/2015 10:59 AM

2.1 Summarizing a Single Categorical Variable
The problem with looking at the raw data is that we can't see what's going on.
The goal of summarizing the data is to see how the levels of the variables aredistributed across our observations.
The distribution of the variables can help us answer questions about our data.
Were first class passengers more or less likely to die than the other classes?
Was "women and children first" really followed on The Titanic?
Is there a relationship between class and gender when it came to surviving(e.g., were first class women more likely to survive than third class women)?
·
·
·
3/23
Chapter 2 http://stat.wvu.edu/~draffle/111/week1/ch2/ch2.h...
3 of 23 05/21/2015 10:59 AM

Frequency Tables
The simplest way to summarize a single categorical variable is by counting thelevels. We call tables of counts frequency tables.
Frequency tables for class:
Class Frequency
1st
2nd
3rd
Total
322
280
711
1313
4/23
Chapter 2 http://stat.wvu.edu/~draffle/111/week1/ch2/ch2.h...
4 of 23 05/21/2015 10:59 AM

Relative Frequencies
Another option is to look at the sample proportion or relative frequency ofobservations with a particular label. A table of these proportions is called arelative frequency table.
Let represent our count, represent our number of individuals, and represent the sample proportion. Any given sample proportion can be calculatedas:
So, for example, the proportion of first class passenger is found as:
x n p̂
=p̂x
n
= = 0.245p̂3221313
5/23
Chapter 2 http://stat.wvu.edu/~draffle/111/week1/ch2/ch2.h...
5 of 23 05/21/2015 10:59 AM

Relative Frequency Tables
If we calculate the proportions of all of the levels of a variable, we can create arelative frequency table. For the passenger classes:
Class Relative Frequency
1st
2nd
3rd
Total
Note that within a variable, all relative frequencies must add up to exactly onebecause every individual needs to have a label.
0.245
0.213
0.542
1
6/23
Chapter 2 http://stat.wvu.edu/~draffle/111/week1/ch2/ch2.h...
6 of 23 05/21/2015 10:59 AM

Percentages
We can also represent these proportions as percentages by multiplying each oneby 100.
Class Percentage
1st
2nd
3rd
Total
In this case, all percentages must add up to 100.
24.5
21.3
54.2
100
7/23
Chapter 2 http://stat.wvu.edu/~draffle/111/week1/ch2/ch2.h...
7 of 23 05/21/2015 10:59 AM

Contingency Tables
To find relationships between variables, we compare the distribution of onevariable within each of the levels of another variable. We call this conditioning avariable.
For example, we can look at the relationship between Survived and PClass:
Class/Survived 1st 2nd 3rd
Dead 129 161 573
Alive 193 119 138
Does this say anything about the relationship between the passengers' class andtheir chances for survival?
8/23
Chapter 2 http://stat.wvu.edu/~draffle/111/week1/ch2/ch2.h...
8 of 23 05/21/2015 10:59 AM

Visualizing Categorical Data
There are many types of graphs for displaying categorical variables, but we willfocus on two of them:
In either case, the graph should be a quick way of visualizing our variables andseeing the distribution.
No matter what graph we choose, the visual representation should follow thearea principle:
Bar Charts
Pie Charts
·
·
The area a visual representation takes up on the graph should correspond tothe magnitude (size) of the value it represents.
·
9/23
Chapter 2 http://stat.wvu.edu/~draffle/111/week1/ch2/ch2.h...
9 of 23 05/21/2015 10:59 AM

Bar Charts
In a bar chart:
Bar charts can have a vertical or horizontal layout, but the basic structureremains the same.
Whether we plot frequencies or relative frequencies, the graph looks basicallythe same. The only difference is the scale of the axis.
We can also stack multiple categories on top of or next to each other to findrelationships between variables.
The categories are on one axis and the frequencies (or relative frequencies) onthe other
Bars are drawn perpendicular to the category axis
The heights of the bars correspond to the frequencies
·
·
·
10/23
Chapter 2 http://stat.wvu.edu/~draffle/111/week1/ch2/ch2.h...
10 of 23 05/21/2015 10:59 AM

11/23
Chapter 2 http://stat.wvu.edu/~draffle/111/week1/ch2/ch2.h...
11 of 23 05/21/2015 10:59 AM

12/23
Chapter 2 http://stat.wvu.edu/~draffle/111/week1/ch2/ch2.h...
12 of 23 05/21/2015 10:59 AM

13/23
Chapter 2 http://stat.wvu.edu/~draffle/111/week1/ch2/ch2.h...
13 of 23 05/21/2015 10:59 AM
14/23
Chapter 2 http://stat.wvu.edu/~draffle/111/week1/ch2/ch2.h...
14 of 23 05/21/2015 10:59 AM

15/23
Chapter 2 http://stat.wvu.edu/~draffle/111/week1/ch2/ch2.h...
15 of 23 05/21/2015 10:59 AM

Pie Charts
Pie charts visualize categorical variables by graphing them as sections of a circle
Downsides:
The area of the "pie slice" is proportional to the relative frequency (eitherproportions or percentages)
The areas of the pie slices must add up to 1 (or 100%)
Each observation must fit into exactly one category
·
·
·
Humans are extraordinarily bad perceiving smaller differences in the areas
It's hard to translate from areas of a slice to percentages, proportions, orcounts without explicit labels.
Comparing groups means multiple charts
·
·
·
16/23
Chapter 2 http://stat.wvu.edu/~draffle/111/week1/ch2/ch2.h...
16 of 23 05/21/2015 10:59 AM

17/23
Chapter 2 http://stat.wvu.edu/~draffle/111/week1/ch2/ch2.h...
17 of 23 05/21/2015 10:59 AM

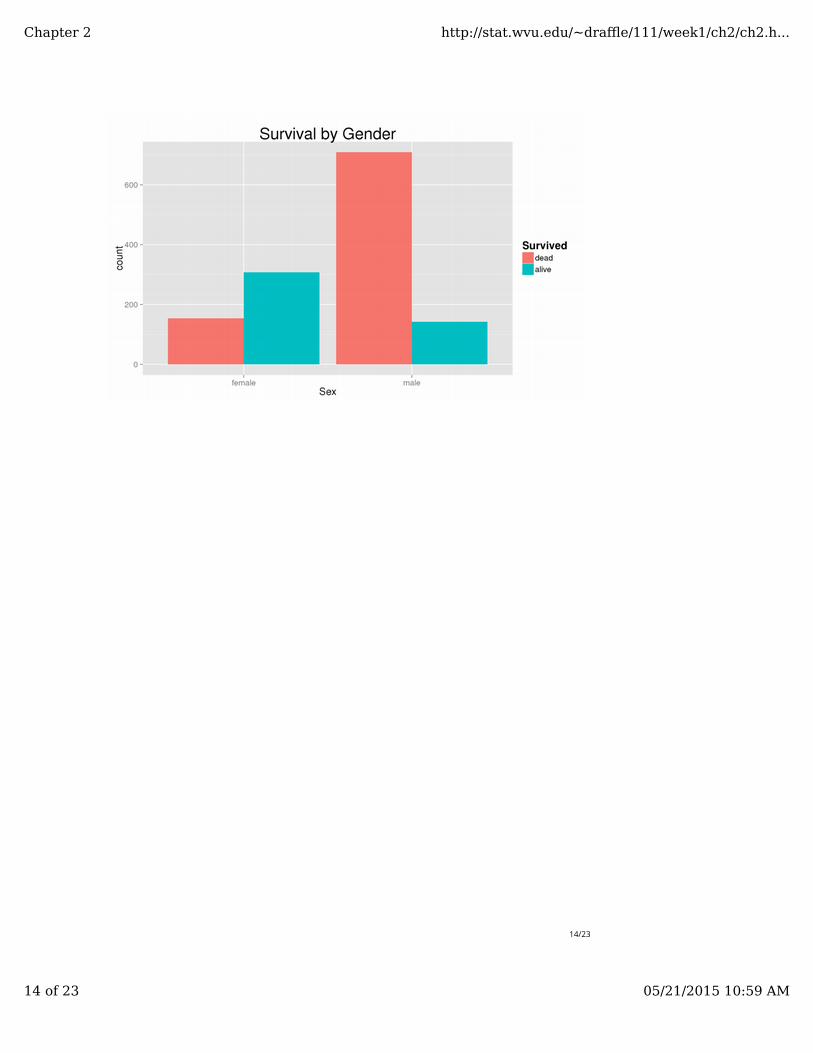
Comparing Sex and Survival
18/23
Chapter 2 http://stat.wvu.edu/~draffle/111/week1/ch2/ch2.h...
18 of 23 05/21/2015 10:59 AM

Notice:
We can't really compare the genders of the survivors or the dead
I.e., there were many more men, so there may still be more male survivorsthan female.
The only way to know for sure would be to look at the counts, or invert thechart and graph the percentages of gender within alive and dead.
·
·
·
19/23
Chapter 2 http://stat.wvu.edu/~draffle/111/week1/ch2/ch2.h...
19 of 23 05/21/2015 10:59 AM

Comparing Sex and Survival (V2)
20/23
Chapter 2 http://stat.wvu.edu/~draffle/111/week1/ch2/ch2.h...
20 of 23 05/21/2015 10:59 AM

Practice
In a group of thirty-one students twenty have brown eyes, eight have blue eyes,and three have hazel eyes find:
Solutions:
The frequency of students with hazel eyes
The relative frequency of students with brown eyes
The percentage of students with blue eyes
· ( )xh
· ( )p̂br
· (100 × )p̂bl
· = 3xh
· = = = 0.645p̂brxbr
n2031
· 100 × = 100 × = 100 × = 100 × 0.258 = 25.8%p̂blxbl
n3
31
21/23
Chapter 2 http://stat.wvu.edu/~draffle/111/week1/ch2/ch2.h...
21 of 23 05/21/2015 10:59 AM

Practice (Cont.)
Using the same data as before, the summary tables are:
Eye Color Frequency Rel. Freq Percentage
Brown
Blue
Hazel
Total
Graph in Statcrunch
20 0.645 64.5%
8 0.258 25.8%
3 0.097 9.7%
n = 31 1 100%
22/23
Chapter 2 http://stat.wvu.edu/~draffle/111/week1/ch2/ch2.h...
22 of 23 05/21/2015 10:59 AM

Summary
Numerical summaries for categorical variables include:
Visual Summaries (graphs) include:
Frequencies/Counts
Relative Frequencies/Proportions
Percentages
·
·
·
Bar Graphs
Pie Charts
·
·
23/23
Chapter 2 http://stat.wvu.edu/~draffle/111/week1/ch2/ch2.h...
23 of 23 05/21/2015 10:59 AM
Recommended