Chapter 2
Accounting Information, Regression Analysis
ByCheng Few LeeJoseph Finnerty
John LeeAlice C Lee
Donald Wort
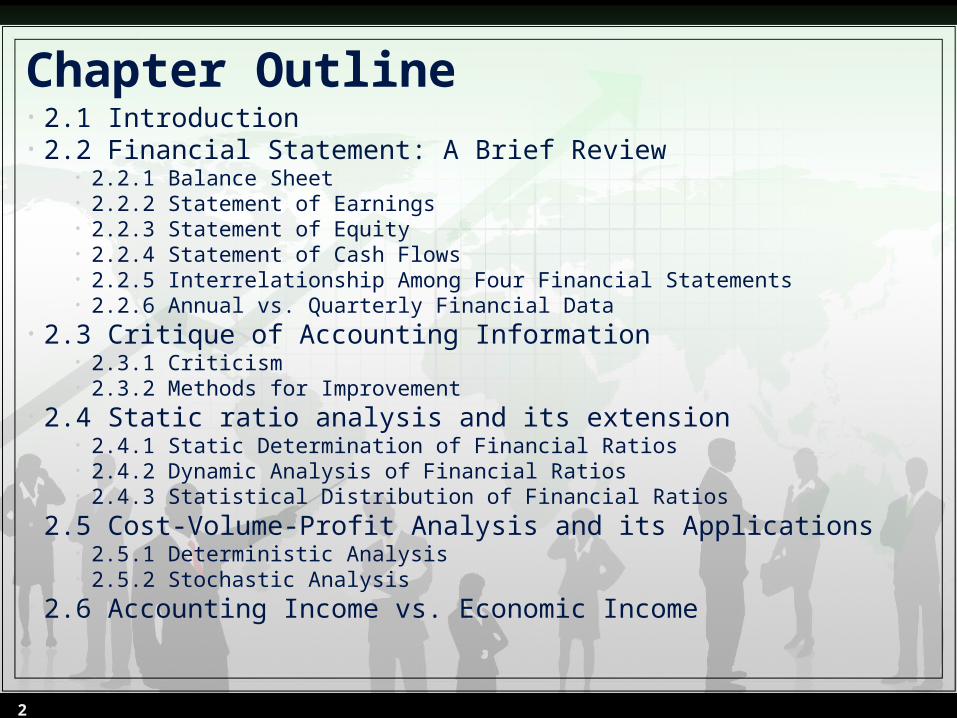
Chapter Outline• 2.1 Introduction• 2.2 Financial Statement: A Brief Review
• 2.2.1 Balance Sheet• 2.2.2 Statement of Earnings• 2.2.3 Statement of Equity• 2.2.4 Statement of Cash Flows• 2.2.5 Interrelationship Among Four Financial Statements• 2.2.6 Annual vs. Quarterly Financial Data
• 2.3 Critique of Accounting Information • 2.3.1 Criticism• 2.3.2 Methods for Improvement
• 2.4 Static ratio analysis and its extension• 2.4.1 Static Determination of Financial Ratios• 2.4.2 Dynamic Analysis of Financial Ratios• 2.4.3 Statistical Distribution of Financial Ratios
• 2.5 Cost-Volume-Profit Analysis and its Applications• 2.5.1 Deterministic Analysis• 2.5.2 Stochastic Analysis
• 2.6 Accounting Income vs. Economic Income
2
2.2 Financial statement: A brief review
• Balance sheet• Income statement• Cash flow statement• Equity statement• Annual vs. quarterly financial data
3

2.2.1 Balance SheetTable 2-1 Consolidated Balance Sheets of Johnson & Johnson Inc & Consolidated Subsidiaries (2004–2009)
(Dollars in Millions)Assets 2004 2005 2006 2007 2008 2009Current Assets Cash and Cash Equivalent ($) 9,203 16,055 4,083 7,770 10,768 15,810Marketable Securities 3,681 83 1 1,545 2,041 3,615Account Receivable 6,831 7,010 8,712 9,444 9,719 9,646Inventory 3,744 3,959 4,889 5,110 5,052 5,180Deferred Taxes on Income 1,737 1,845 2,094 2,609 3,430 2,793Prepaid Expenses and Other Receivable 2,124 2,442 3,196 3,467 3,367 2,497Total Current Assets 27,320 31,394 22,975 29,945 34,377 39,541 Marketable Securities — Non-current 46 20 16 2 - -Property, Plant and Equipment, Net 10,436 10,830 13,044 14,185 14,365 14,759Intangible Assets, Net 11,842 12,175 28,688 28,763 27,695 31,185Deferred Taxes on Income 551 385 3,210 4,889 5,841 5,507Other Assets 3,122 3,221 2,623 3,170 2,634 3,690Total Assets 53,317 58,025 70,556 80,954 84,912 94,682 Liabilities and Shareholder’s Equity Current Liabilities Loans and Notes Payable 280 668 4,579 2,463 3,732 6,318Account Payable 5,227 4,315 5,691 6,909 7,503 5,541Accrued Liabilities 3,523 3,529 4,587 6,412 5,531 5,796Accrued Rebates, Returns, and Promotion 2,297 2,017 2,189 2,318 2,237 2,028Accrued Salaries, Wages, and Commissions 1,094 1,166 1,391 1,512 1,432 1,606Taxes on Income 1,506 940 724 223 417 442Total Current Liabilities 13,927 12,635 19,161 19,837 20,852 21,731 Long-term Debt 2,565 2,017 2,014 7,074 8,120 8,223Deferred Tax liability 403 211 1,319 1,493 1,432 1,424Employee Related Obligations 2,631 3,065 5,584 5,402 7,791 6,769Other Liabilities 1,978 2,226 3,160 3,829 4,206 5,947
4

2.2.1 Balance Sheet
Table 2-1 Consolidated Balance Sheets of Johnson & Johnson Inc & Consolidated Subsidiaries (2004–2009)(continued)
Shareowners’ Equity Preferred Stock-without Par Value — — — — — — Common Stock-Par Value $1.00 3,120 3,120 3,120 3,120 3,120 3,120Net Receivable from Employee Stock Plan −11 — — — — — Accumulated Other Comprehensive Income −515 −755 −2,118 −693 −4,955 −3,058Retained Earnings 35,223 41,471 49,290 55,280 63,379 70,306Less: Common Stock Held in Treasury 6,004 5,965 10,974 14,388 19,033 19,780Total Shareowners’ Equity 31,813 37,871 39,318 43,319 42,511 50,588 Total Liabilities and Shareholders’ Equity 53,317 58,025 70556 80954 84912 94682
5

2.2.2 Income StatementTable 2-2 Consolidated Statements of Earnings of JNJ Inc. & Subsidiaries (2004-09)
(dollars in millions)
(Dollars in Millions Except Per Share Figures)
2004 2005 2006 2007 2008 2009
Sales to Customers ($) 47,348 50,514 53,324 61,095 63,747 61,897
Cost of Products Sold 13,422 13,954 15,057 17,751 18,511 18,447
Gross Profit 33,926 36,560 38,267 43,344 45,236 43,450
Selling, Marketing and administrative expenses 15,860 16,877 17,433 20,451 21,490 19,801
Research Expense 5,203 6,312 7,125 7,680 7,577 6,986
Purchased in-process research and development
18 362 559 807 181 —
Interest Income −195 −487 −829 −452 −361 90Interest Expense, net of portion capitalized 187 54 63 296 435 451
Other (income) expense, Net 15 −214 −671 1,279 −1,015 547
21,088 22,904 23,680 30,061 26,307 27,695
Earnings before Provision for Taxes on Income
12,838 13,656 14,587 13,283 16,929 15,755
Provision for Taxes on Income 4,329 3,245 3,534 2,707 3,980 3,489
Net Earnings 8,509 10,411 11,053 10,576 12,949 12,266
Basic Net Earnings per Share ($) 2.87 3.5 3.76 3.67 4.62 4.45
Diluted Net Earnings per Share ($) 2.84 3.46 3.73 3.63 4.57 4.4
6

2.2.3 Statement of Equity
7

2.2.3 Statement of Equity
8

2.2.3 Statement of Equity
9

2.2.4 Statement of Cash Flows
10

2.2.4 Statement of Cash Flows
11

2.3 Critique of accounting information
• Criticism
• Methods for improvement
a) Use of Alternative Information
b) Statistical Adjustments
c) Application of Finance and Economic Theories
12
2.4 Static ratio analysis and its extension
• Static determination of financial ratios• Dynamic analysis of financial ratios• Statistical distribution of financial ratios
13

Static determination of financial ratiosTable 2.5: Company ratios period 2003-2004
sliabilitieCurrent
assetCurrent
sliabilitieCurrent
CAotherinventoryCA
assetTotal
debtTotal
equityTotal
debtTotal
equityTotal
assetTotal
ensesInterest
EBIT
exp
Ratio Classification Formula J&J Industry
2008 2009 2008 2009
Liquidity Ratio
Current Ratio 1.65 1.82 2.18 2.06
Quick Ratio 0.61 0.89 1.61 1.51
Leverage Ratio
Debt-to-Asset 0.48 0.45 0.48 0.49
Debt-to-Equity 0.96 0.84 1.02 1.04
Equity Multiplier 2.00 1.87 2.10 2.12
Times Interest Paid 27.78 30.39 26.49 27.16
14
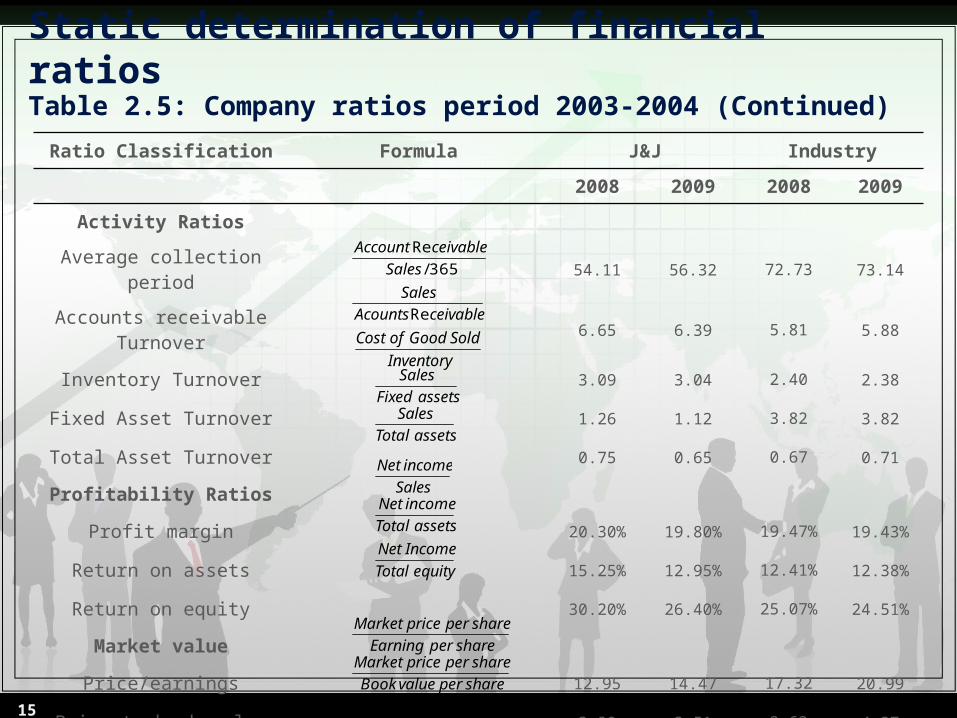
Static determination of financial ratios
Table 2.5: Company ratios period 2003-2004 (Continued)
365/
Re
Sales
ceivableAccount
ceivableAcounts
Sales
Re
Inventory
SoldGoodofCost
assetsFixed
Sales
assetsTotal
Sales
Sales
incomeNet
assetsTotal
incomeNet
equityTotal
IncomeNet
shareperEarning
shareperpriceMarket
sharepervalueBook
shareperpriceMarket
Ratio Classification Formula J&J Industry
2008 2009 2008 2009
Activity Ratios
Average collection period 54.11 56.32 72.73 73.14
Accounts receivable Turnover 6.65 6.39 5.81 5.88
Inventory Turnover 3.09 3.04 2.40 2.38
Fixed Asset Turnover 1.26 1.12 3.82 3.82
Total Asset Turnover 0.75 0.65 0.67 0.71
Profitability Ratios
Profit margin 20.30% 19.80% 19.47% 19.43%
Return on assets 15.25% 12.95% 12.41% 12.38%
Return on equity 30.20% 26.40% 25.07% 24.51%
Market value
Price/earnings 12.95 14.47 17.32 20.99
Price-to-book-value 3.90 3.51 3.63 4.27
15

Yj,t=Yj,t-1+δj(Yj,t*-Yj,t-1) (2.1)
where 0≤δj≤1, and
δj = A partial adjustment coefficient;
Yj,t = Firm’s jth financial ratio period t;
Yj,t-1 = Firm’s jth financial ratio period t-1; and
Y*j,t = Firm’s jth financial ratio target in period t,
Basic Model
Dynamic Analysis of Financial Ratios
16
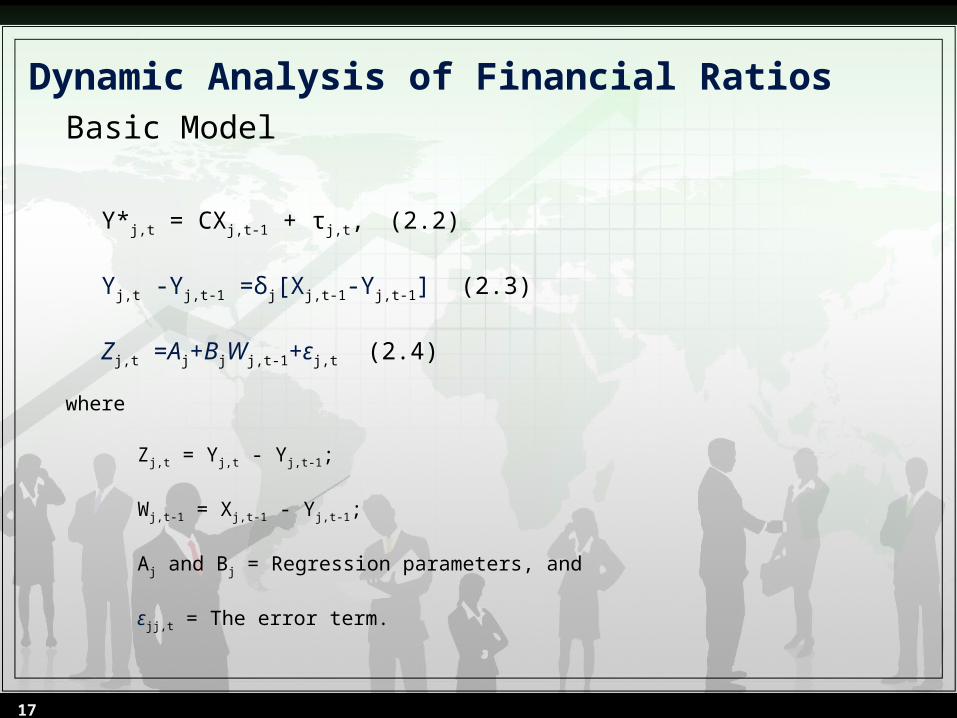
Y*j,t = CXj,t-1 + τj,t, (2.2)
Yj,t -Yj,t-1 =δj[Xj,t-1-Yj,t-1] (2.3)
Zj,t =Aj+BjWj,t-1+εj,t (2.4)
where
Zj,t = Yj,t - Yj,t-1;
Wj,t-1 = Xj,t-1 - Yj,t-1;
Aj and Bj = Regression parameters, and
εjj,t = The error term.
Basic Model
Dynamic Analysis of Financial Ratios
17

Z′j,t = A′j + B′jW′j,t-1 + εj′j,t, (2.5)
where
Z′j,t = log (Yj,t) - log (Yj,t-1);
W′j,t-1 = log (Xj,t-1) - log (Yj,t-1); and
εj′j,t = The Error term.
Extensions of Basic Model
Dynamic Analysis of Financial Ratios
18

Extension of Basic Model
Dynamic Analysis of Financial Ratios
, , 1
, 1 , 1
j,t , 1
j,t-1 , 1
log( / )
log( / )% change in [Y / ]
(2.6)% change in [X / ]
j t j tj
j t j t
j t
j t
Y YB
X YY
Y
*j,t , 1Y (2.7)j tCX
, 1 , 1 2 , 1 ,ˆ ˆ ˆ (2.8)j t j t j t j tY A B X B Y
19

Table 2.6: Dynamic adjustment ratio regression results
Variable Current Ratio Leverage Ratio
Mean Z 0.0075 -0.03083
Mean W -0.14583 0.361666667
Var(Z) 0.013039 0.006099
Cov(Z,W) 0.074 0.009
Bj` 0.810* 0.259
t-Statistics [3.53] [1.06]
Aj` 0.032 -0.042
* Partial adjustment coefficient significant at 95% level
Empirical Data
Dynamic Analysis of Financial Ratios
20

Table 2.7: Ratio correlation coefficient matrix
CR AT GPM LR
CR1.0
AT-0.443841 1.0
GPM0.363273 0.381393 1.0
LR-0.51175 0.21961 -0.05028 1.0
Empirical Data
Dynamic Analysis of Financial Ratios
21

Z1,t = A0 +A1Z2,t + A2W1 + εj1,t, (2.9a)
Z2,t = B0 + B1Z1,t + B2W2 + εj2,t. (2.9b)where
Ai, Bi (i = 0, 1, 2) are coefficients, εj1 and εj2 are error terms, and Z1,t = Individual firm’s current ratio in period t -
individual firm’s current ratio in period t-1; Z2,t = Individual firm’s leverage ratio in period t -
individual firm’s leverage ratio period t-1; W1,t = Industry average current ratio in period t-1 -
individual firm’s current ratio period t-1; W2,t = Industry average leverage ratio in period t-1 -
individual firm’s leverage ratio in period t-1.
Empirical DataDynamic Analysis of Financial Ratios
22

Table 2.8: Johnson & Johnson empirical results for the simultaneous equation system
A0(B0) A1(B1) A2(B2)
(2.9a) -0.071[-1.80]
-0.378[-5.52]
0.080[1.20]
(2.9b) -0.0577[-1.59]
-0.842[-6.07]
0.074[0.91]
Empirical Data
Dynamic Analysis of Financial Ratios
23

Statistical Distribution of Financial Ratios2 2( ) / 21
[ ] ( X ), (2.10)2
XF X e
where μ and σ2 are the population mean and variance, respectively, and e and π are given constants; that is, π= 3.14159 and e = 2.71828.
24

Statistical Distribution of Financial Ratios
There is a direct relationship between the normal distribution and the log-normal distribution. If Y is log-normally distributed, then X = log Y is normally distributed. Following this definition, the mean and the variance of Y can be defined as:
where exp represents an exponential with base e.
2
2 2 2
1exp( ), (2.11a)
2exp(2 )(exp( ) 1), (2.11b)
Y x x
Y x x x
25
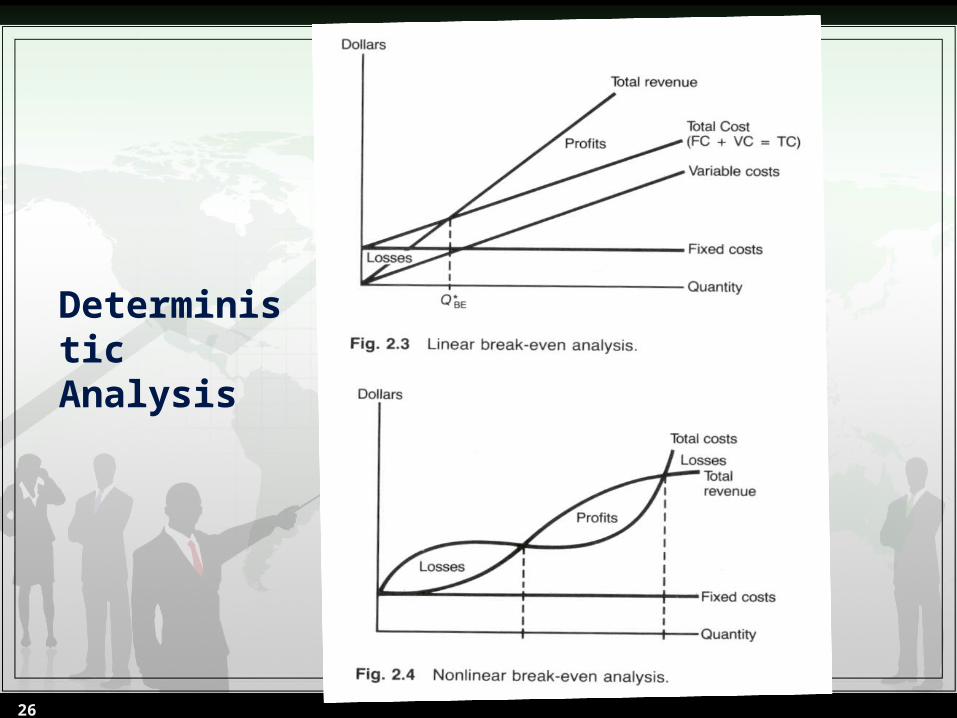
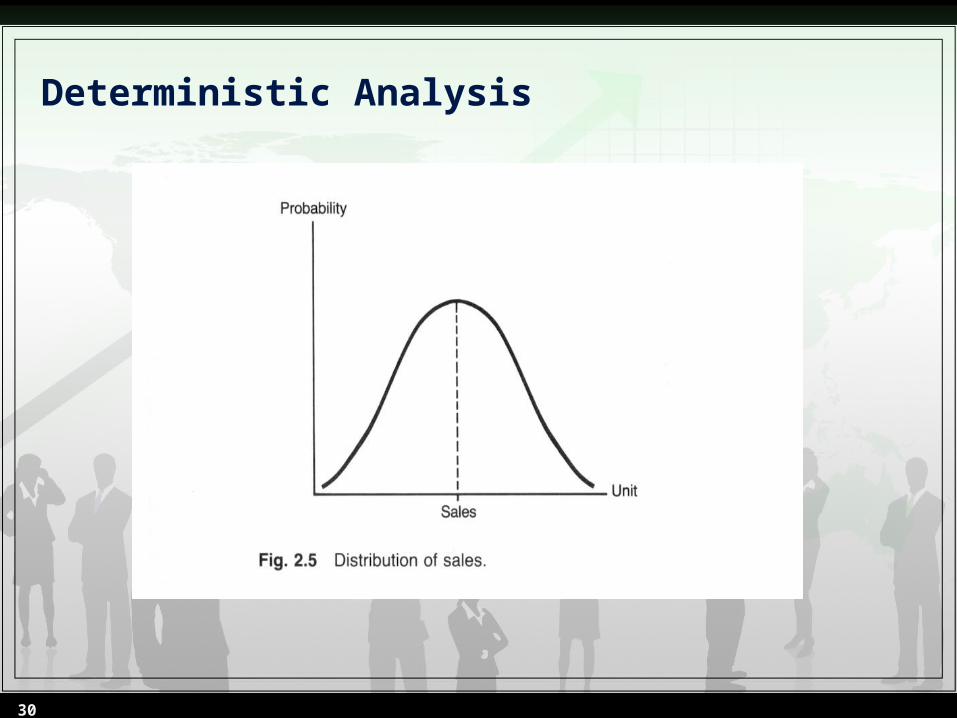
Deterministic Analysis
26

2.5 COST-VOLUME-PROFIT ANALYSIS AND ITS APPLICATIONS
• Deterministic analysis• Stochastic analysis
27

Deterministic Analysis
Operating Profit = EBIT = Q(P - V) - F, (2.12)
where
Q = Quantity of goods sold;
P = Price per unit sold;
V = Variable cost per unit sold;
F = Total amount of fixed costs; and
P - V = Contribution margin.
28

Deterministic Analysis
* (2.13)( )
FQ
P V
% Change in profits ( ) Fixed CostsDOL =1 (2.14)
% Change in sales ( ) Profits
Q P V
Q P V F
*
1. (2.15)
[1 ( / )]DOL
Q Q
Operating profit = EBIT = Qπ(Pπ - Vπ) - F. (2.16)
29
Deterministic Analysis
30

2.6 ACCOUNTING INCOME VS. ECONOMIC INCOME
Et = At + Pt, (2.17)
where
Et = Economic income,
At = Accounting earnings,
and
Pt = Proxy errors.
31
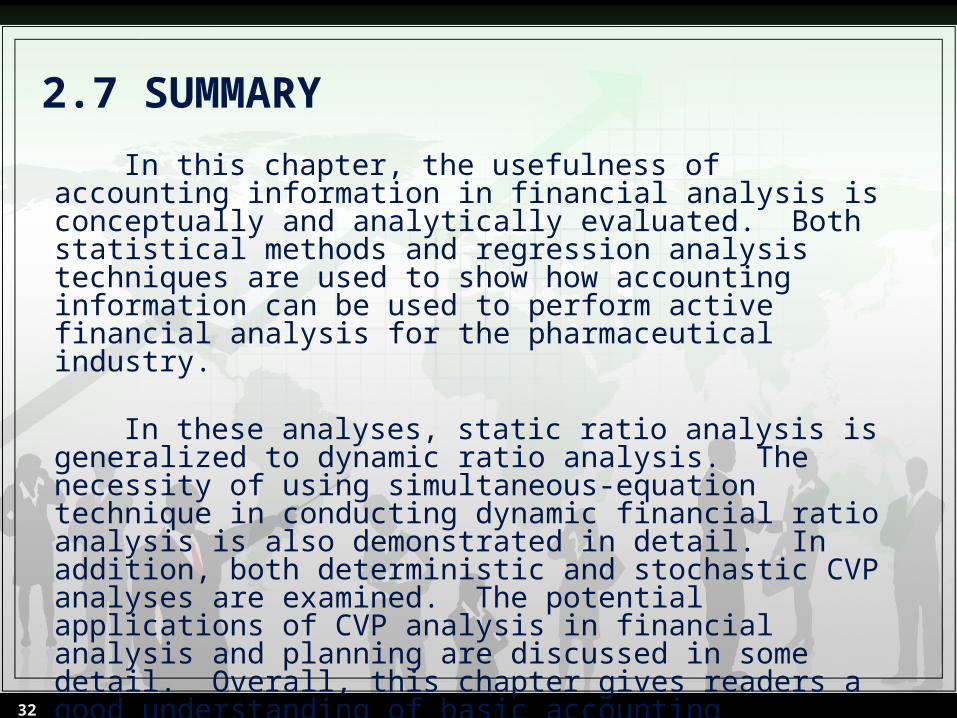
2.7 SUMMARY
In this chapter, the usefulness of accounting information in financial analysis is conceptually and analytically evaluated. Both statistical methods and regression analysis techniques are used to show how accounting information can be used to perform active financial analysis for the pharmaceutical industry.
In these analyses, static ratio analysis is generalized to dynamic ratio
analysis. The necessity of using simultaneous-equation technique in conducting dynamic financial ratio analysis is also demonstrated in detail. In addition, both deterministic and stochastic CVP analyses are examined. The potential applications of CVP analysis in financial analysis and planning are discussed in some detail. Overall, this chapter gives readers a good understanding of basic accounting information and econometric methods, which are needed for financial analysis and planning.
32
Recommended