COMMUNICATION SYSTEM EECB353
Chapter 1
INTRODUCTION TO COMMUNICATION SYSTEMS
Dept of Electronic & Communications Engineering
Universiti Tenaga Nasional
2
INTRODUCTION TO COMMUNICATION SYSTEMS
Chapter Outline:
1.1 The Block Diagram of Communication System
- Definition
- Main Components
- Mode of Communication
1.2 SNR, Bandwidth & Rate of Communication
1.3 The Electromagnetic Frequency Spectrum
1.4 Modulation
- Continuous-wave Modulation
- Pulse Modulation
Reference:
Frenzel, Chapter 1
3
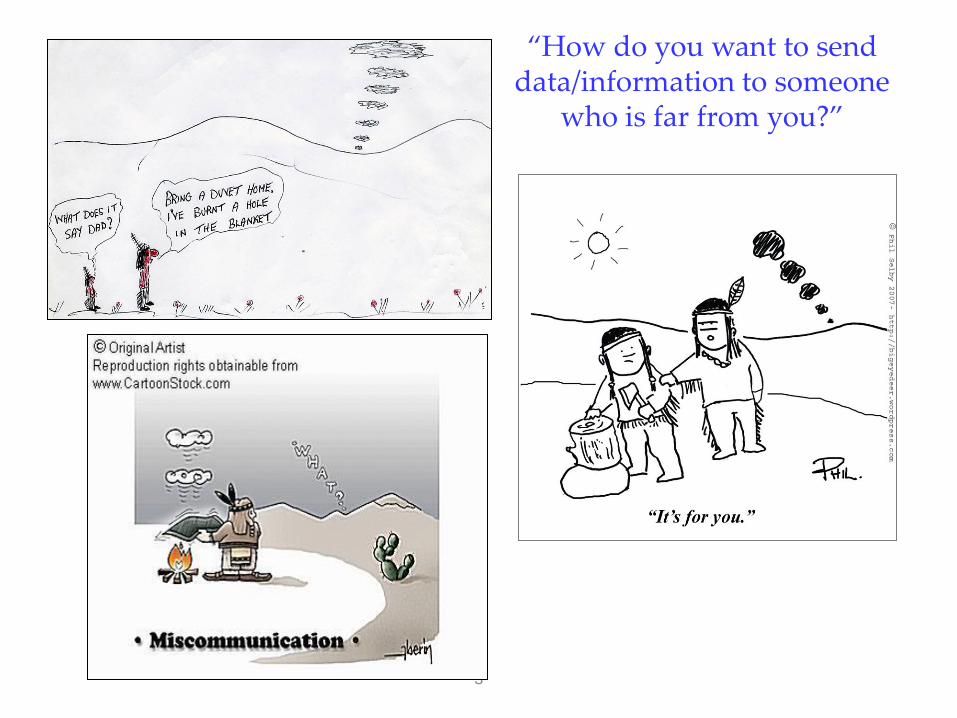
“How do you want to send data/information to someone
who is far from you?”
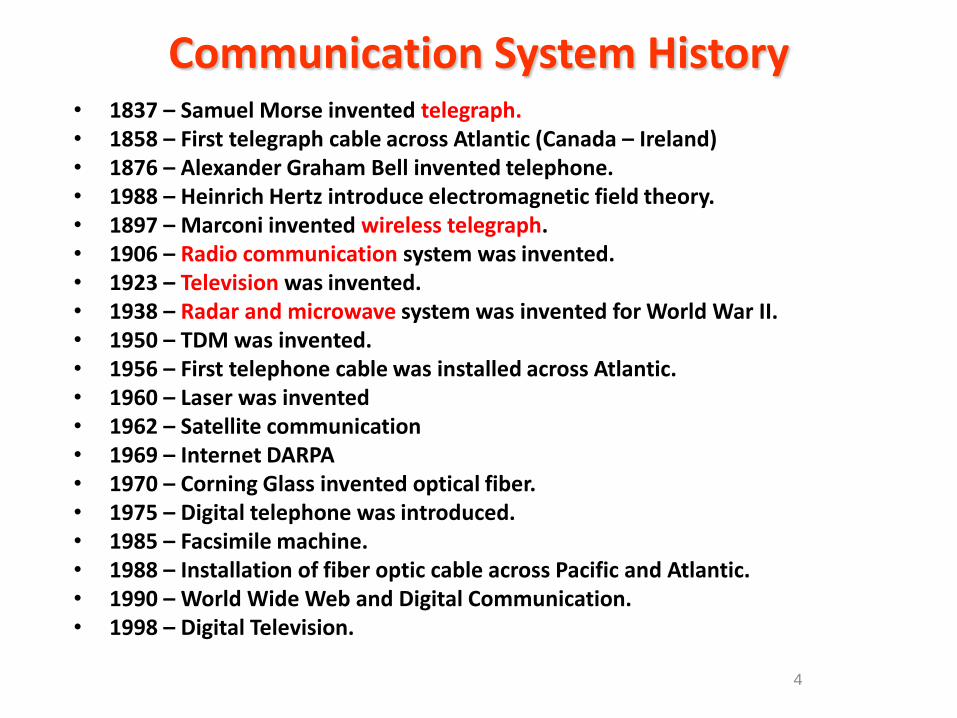
Communication System History • 1837 – Samuel Morse invented telegraph. • 1858 – First telegraph cable across Atlantic (Canada – Ireland) • 1876 – Alexander Graham Bell invented telephone. • 1988 – Heinrich Hertz introduce electromagnetic field theory. • 1897 – Marconi invented wireless telegraph. • 1906 – Radio communication system was invented. • 1923 – Television was invented. • 1938 – Radar and microwave system was invented for World War II. • 1950 – TDM was invented. • 1956 – First telephone cable was installed across Atlantic. • 1960 – Laser was invented • 1962 – Satellite communication • 1969 – Internet DARPA • 1970 – Corning Glass invented optical fiber. • 1975 – Digital telephone was introduced. • 1985 – Facsimile machine. • 1988 – Installation of fiber optic cable across Pacific and Atlantic. • 1990 – World Wide Web and Digital Communication. • 1998 – Digital Television.
4
5
6
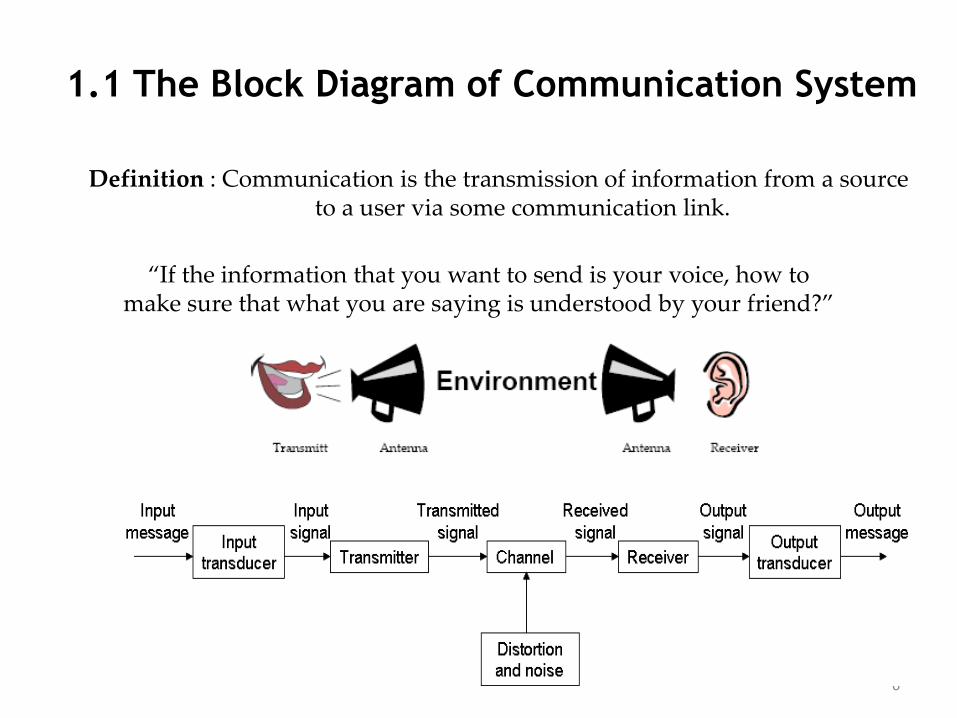
1.1 The Block Diagram of Communication System
Definition : Communication is the transmission of information from a source to a user via some communication link.
“If the information that you want to send is your voice, how to make sure that what you are saying is understood by your friend?”
7
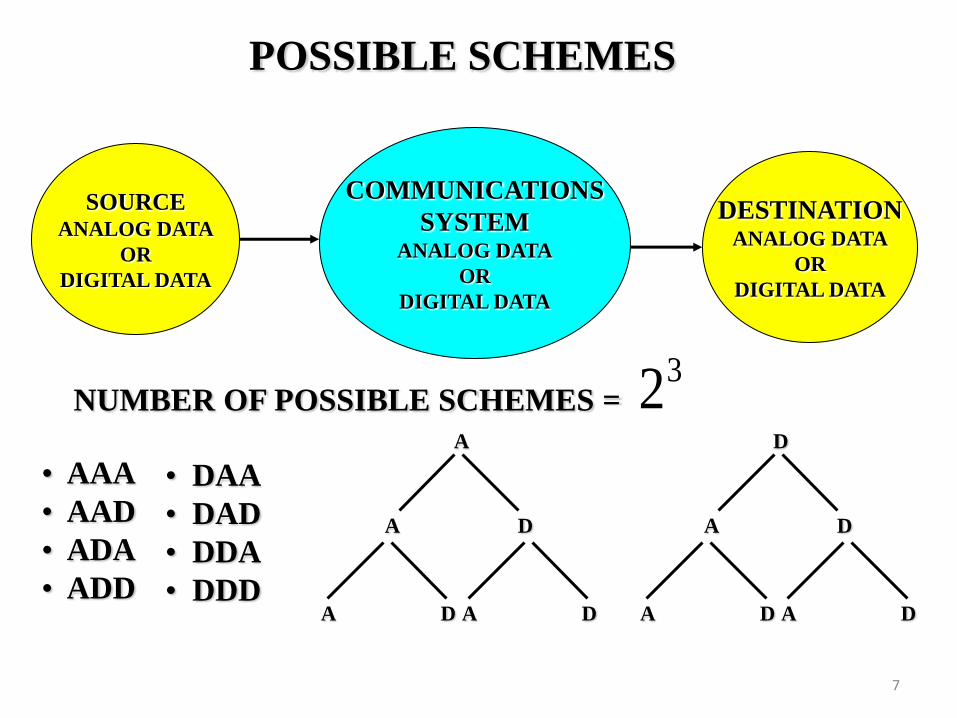
POSSIBLE SCHEMES
SOURCE ANALOG DATA
OR
DIGITAL DATA
COMMUNICATIONS
SYSTEM ANALOG DATA
OR
DIGITAL DATA
DESTINATION ANALOG DATA
OR
DIGITAL DATA
NUMBER OF POSSIBLE SCHEMES = 32
• AAA
• AAD
• ADA
• ADD
A
A D
A D A D
D
A D
A D A D
• DAA
• DAD
• DDA
• DDD
8
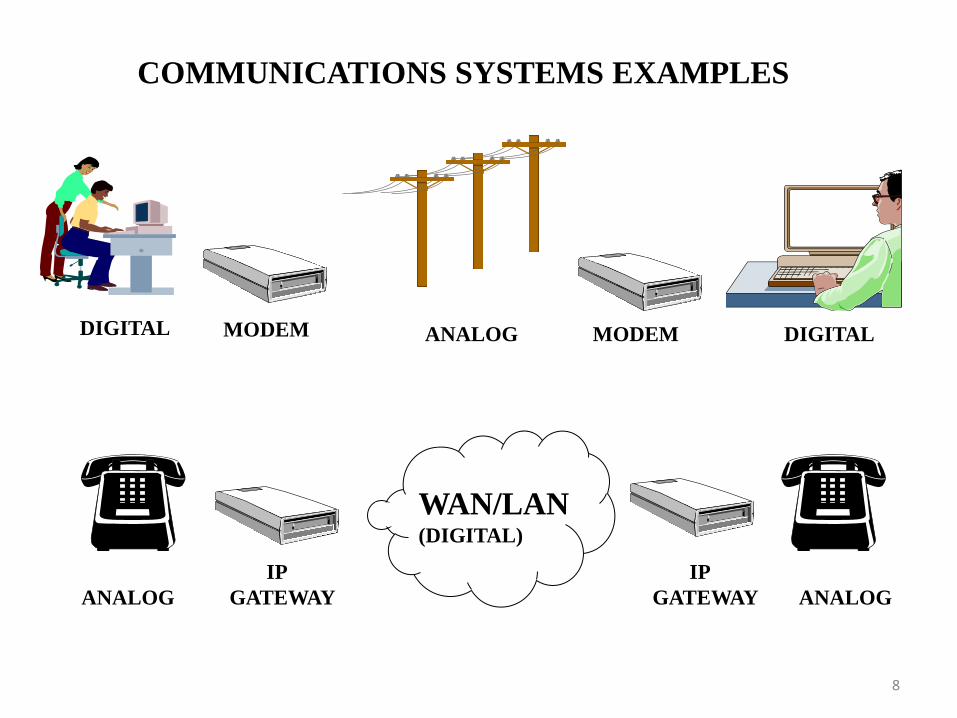
COMMUNICATIONS SYSTEMS EXAMPLES
MODEM MODEM DIGITAL DIGITAL ANALOG
ANALOG ANALOG
IP
GATEWAY
IP
GATEWAY
WAN/LAN (DIGITAL)
9
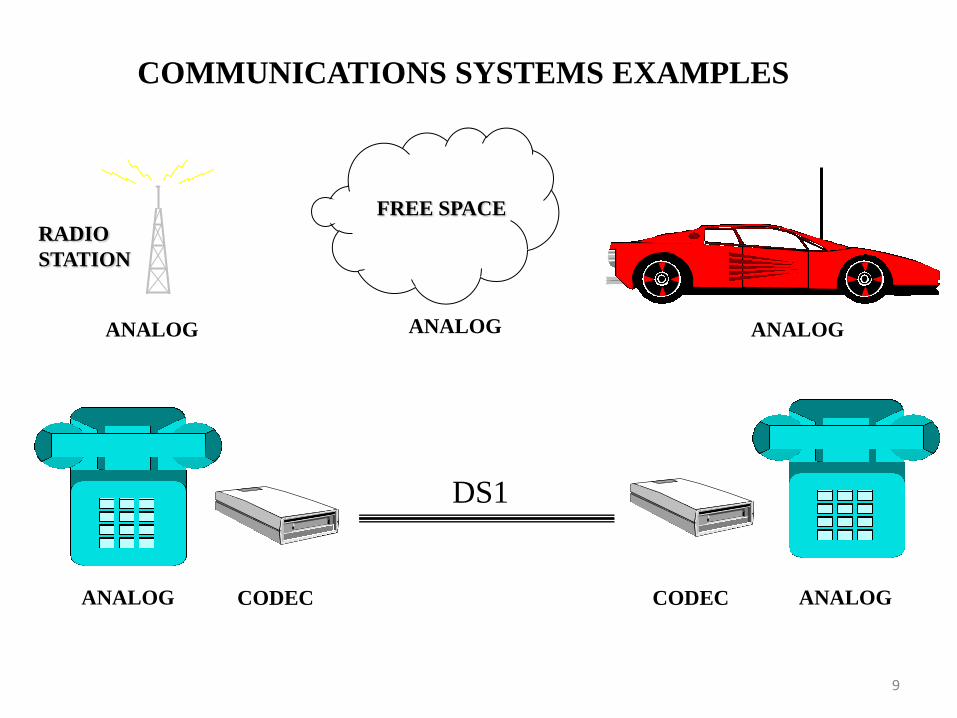
ANALOG ANALOG ANALOG
RADIO
STATION
AAAIR FREE SPACE
COMMUNICATIONS SYSTEMS EXAMPLES
ANALOG ANALOG CODEC CODEC
DS1
10
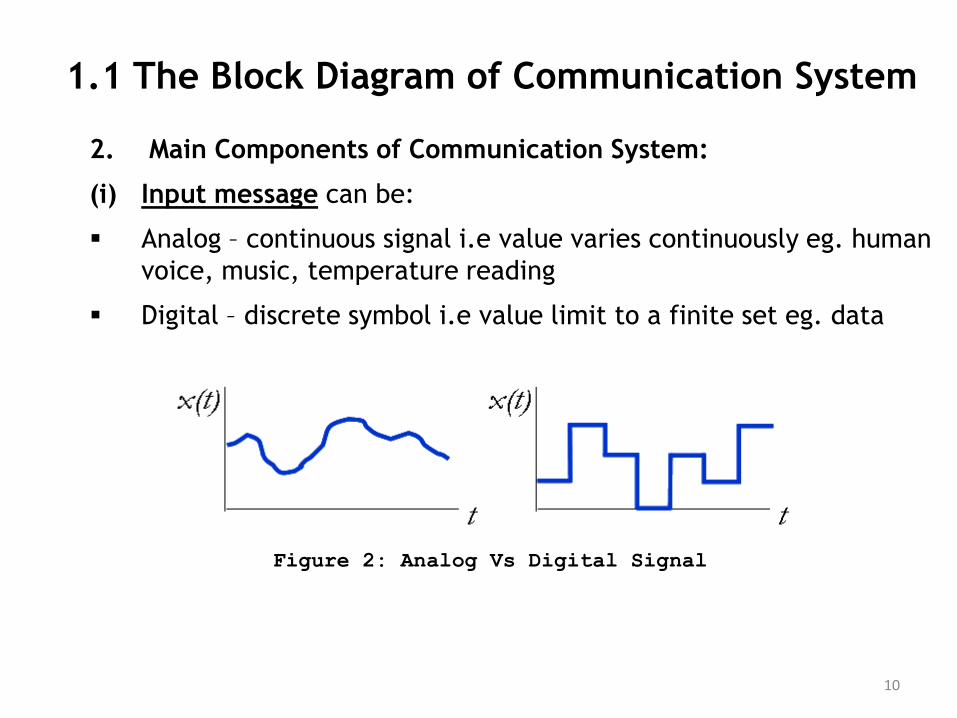
2. Main Components of Communication System:
(i) Input message can be:
Analog – continuous signal i.e value varies continuously eg. human
voice, music, temperature reading
Digital – discrete symbol i.e value limit to a finite set eg. data
Figure 2: Analog Vs Digital Signal
1.1 The Block Diagram of Communication System
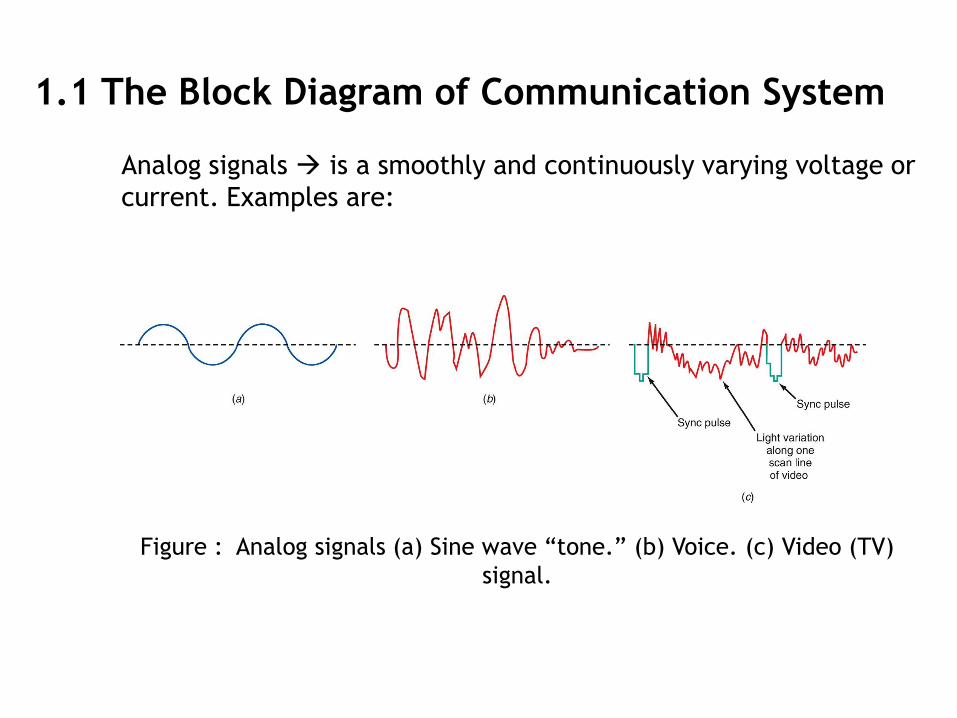
Figure : Analog signals (a) Sine wave “tone.” (b) Voice. (c) Video (TV)
signal.
1.1 The Block Diagram of Communication System
Analog signals is a smoothly and continuously varying voltage or
current. Examples are:
1.1 The Block Diagram of Communication System
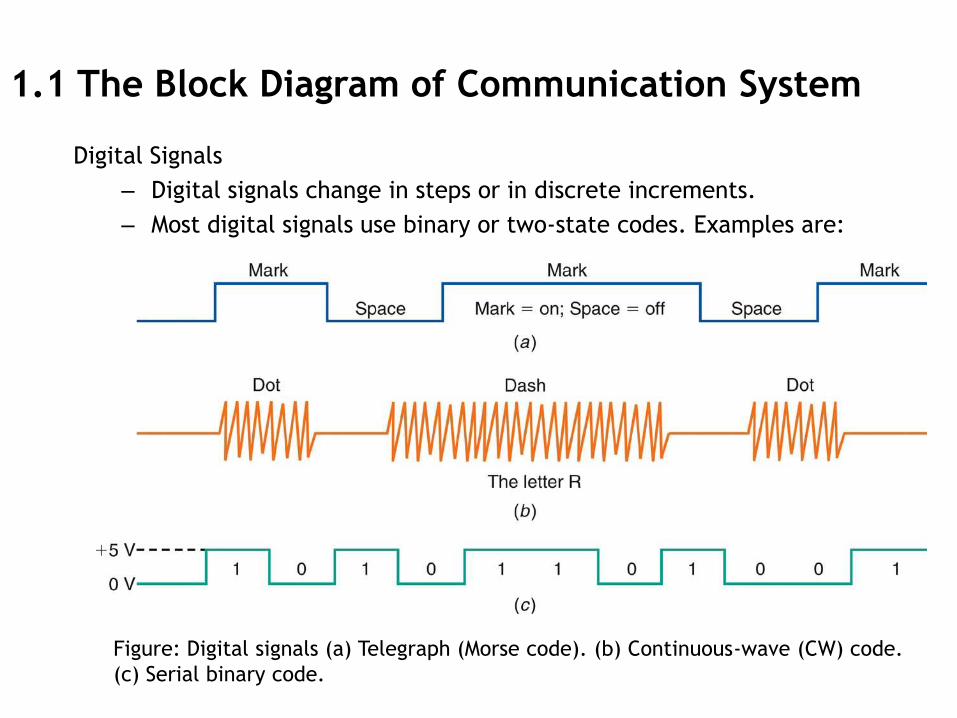
Digital Signals
– Digital signals change in steps or in discrete increments.
– Most digital signals use binary or two-state codes. Examples are:
Figure: Digital signals (a) Telegraph (Morse code). (b) Continuous-wave (CW) code.
(c) Serial binary code.
13
(ii) Input Transducer:
A device that converts energy from one form to another.
Convert an input signal into an electrical waveform.
Example: microphone converts human voice into electrical signal
referred to as the baseband signal or message signal.
1.1 The Block Diagram of Communication System
WHAT IS BASEBAND ?
•Without any shift in the range of frequencies of the signal
•The signal is in its original form, not changed by modulation.
•Baseband is the original information that is to be sent.
14
(iii) Transmitter (Tx):
Modifies or converts the baseband signal into format appropriate for
efficient channel of transmission.
Example: If the channel is fiber optic cable, the transmitter converts the
baseband signal into light frequency and the transmitted signal is light.
Transmitter also use to reformat/reshape the signal so that the channel
will not much distorted.
Modulation takes place in the transmitter.
Modulation is a process of putting information onto high frequency
carrier for transmission.
1.1 The Block Diagram of Communication System
15
(iv) Channel:
Physical medium through which the transmitter output is sent.
Divided into 2 basic groups:
• Guided Electromagnetic Wave Channel – eg. wire, coaxial cable,
optical fiber
• Electromagnetic Wave Propagation Channel – eg. Wireless broadcast
channel, mobile radio channel, satellite etc.
In the channel, transmitted signal is attenuated and distorted due to
distortion, noise and interference etc.
Signal attenuation increase along with the length/distance of channel.
This results in corrupted transmitted signal received by receiver, Rx
1.1 The Block Diagram of Communication System
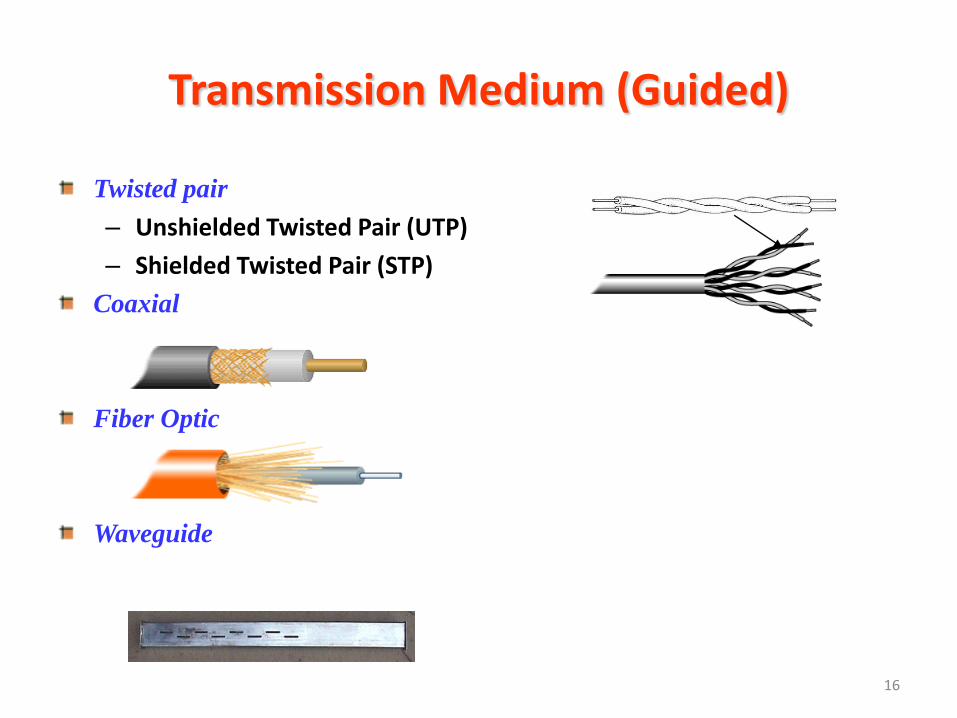
Transmission Medium (Guided)
Twisted pair
– Unshielded Twisted Pair (UTP)
– Shielded Twisted Pair (STP)
Coaxial
Fiber Optic
Waveguide
16
17
(v) Receiver
Receiver decodes the received signal back to message signal – i.e it
attempts to translate the received signal back into the original message
signal sent by the source.
Reprocess the signal received from the channel by undoing the signal
modification made by transmitter and the channel.
Extract the desired signal from the received signal and convert it to a
form that suitable for the output transducer.
Demodulation takes place in the receiver, to remove the high frequency
carrier and to recover the baseband signal.
(vi) Output transducer
Convert electrical signals to its original waveform.
1.1 The Block Diagram of Communication System
18
1.1 The Block Diagram of Communication System
Transceivers
A transceiver is an electronic unit that incorporates circuits that both send and receive signals.
Examples are:
• Telephones
• Fax machines
• Handheld CB radios
• Cell phones
• Computer modems
19
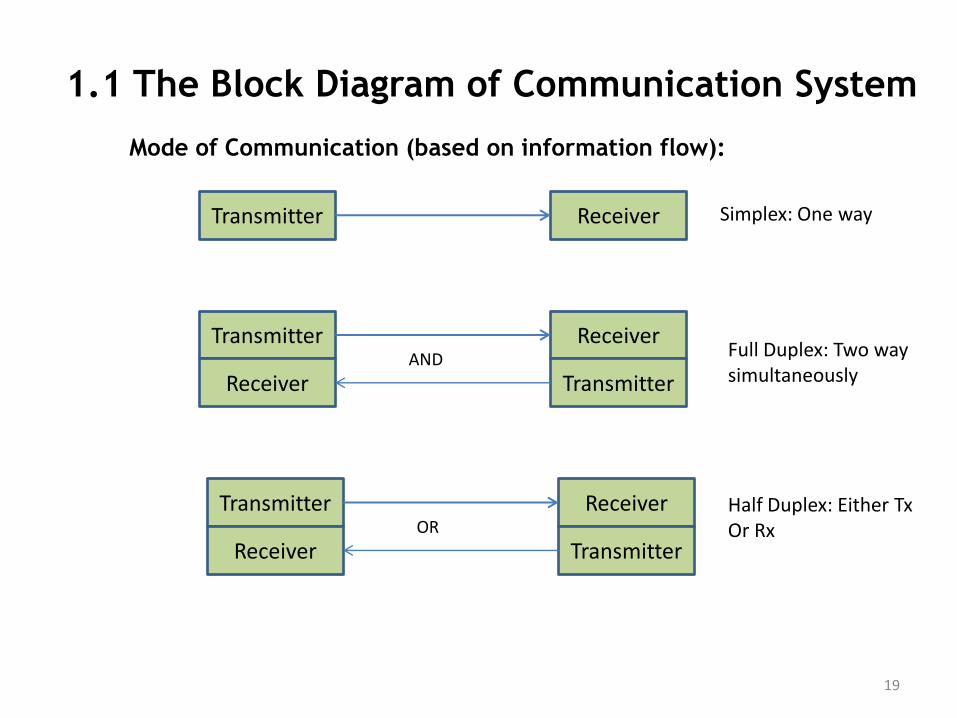
Mode of Communication (based on information flow):
1.1 The Block Diagram of Communication System
Transmitter Receiver
Transmitter
Receiver
Receiver
Transmitter
Transmitter
Receiver
Receiver
Transmitter
AND
OR
Simplex: One way
Full Duplex: Two way simultaneously
Half Duplex: Either Tx Or Rx
20
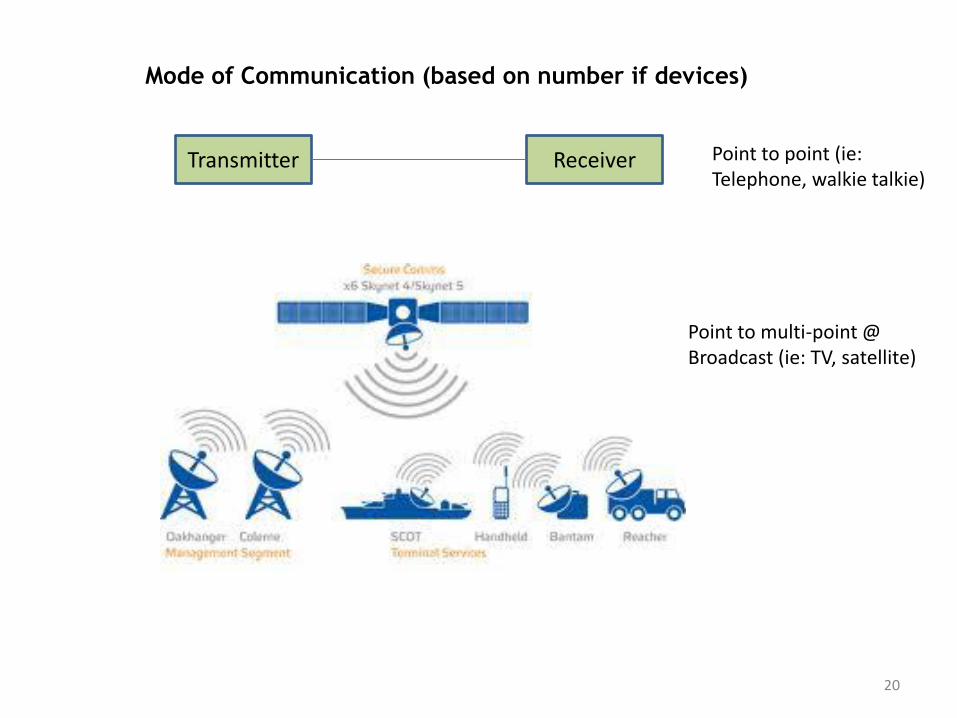
Mode of Communication (based on number if devices)
Transmitter Receiver Point to point (ie: Telephone, walkie talkie)
Point to multi-point @ Broadcast (ie: TV, satellite)
21
1.2 SNR, Bandwidth & Data Rate
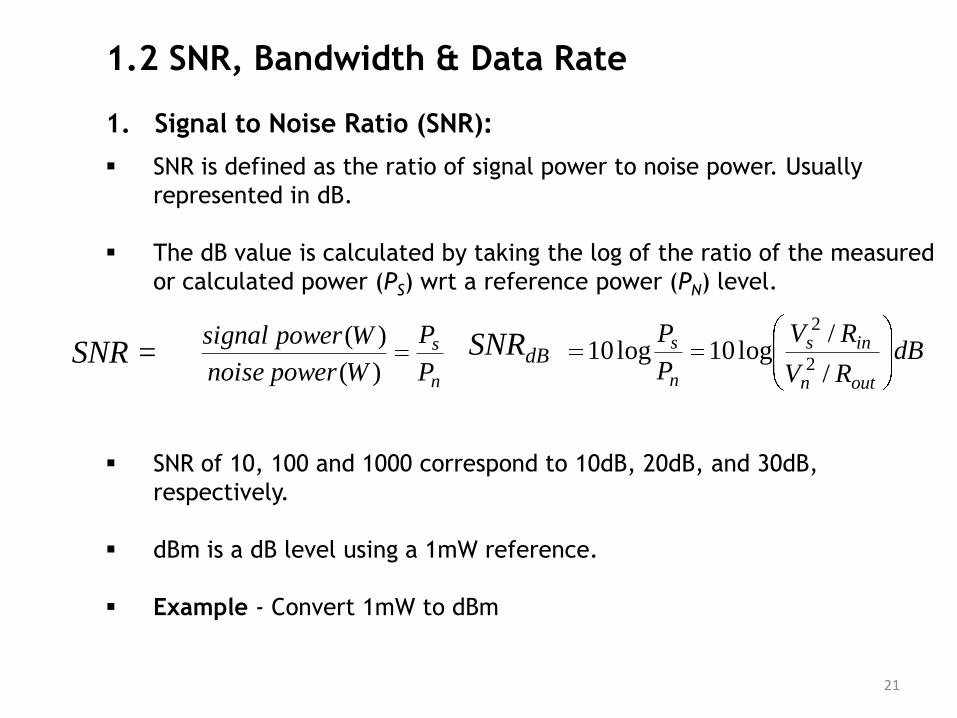
1. Signal to Noise Ratio (SNR):
SNR is defined as the ratio of signal power to noise power. Usually
represented in dB.
The dB value is calculated by taking the log of the ratio of the measured
or calculated power (PS) wrt a reference power (PN) level.
SNR of 10, 100 and 1000 correspond to 10dB, 20dB, and 30dB,
respectively.
dBm is a dB level using a 1mW reference.
Example - Convert 1mW to dBm
n
s
P
P
Wpowernoise
Wpowersignal
)(
)(dB
RV
RV
P
P
outn
ins
n
s
/
/log10log10
2
2
SNR = SNRdB
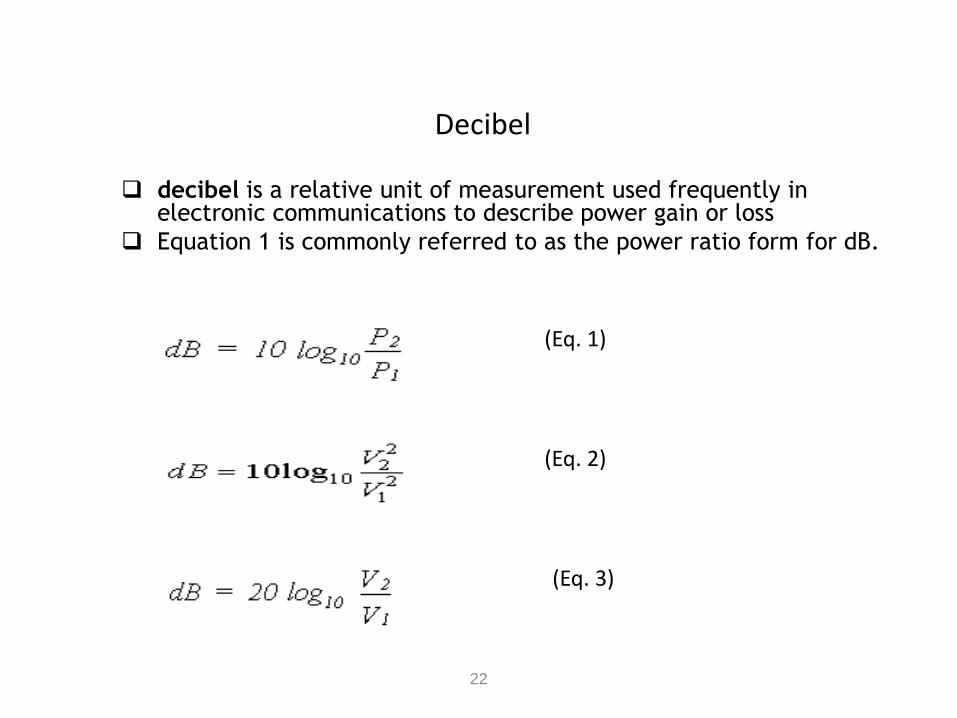
Decibel
decibel is a relative unit of measurement used frequently in electronic communications to describe power gain or loss
Equation 1 is commonly referred to as the power ratio form for dB.
22
(Eq. 2)
(Eq. 1)
(Eq. 3)
Recommended