Ontario Health Technology Assessment Series; Vol. 15: No. 9, pp. 1–58, March 2015
Caesarean Delivery Rate Review: An Evidence-Based Analysis N DEGANI, N SIKICH
MARCH 2015

Ontario Health Technology Assessment Series; Vol. 15: No. 9, pp. 1–58, March 2015 2
Suggested Citation This report should be cited as follows: Degani N, Sikich N. Caesarean delivery rate review: an evidence-based analysis. Ont Health Technol Assess Ser [Internet]. 2015 March;15(9):1–58. Available from: http://www.hqontario.ca/evidence/publications-and-ohtac-recommendations/ontario-health-technology-
assessment-series/caesarean-delivery-rate-review. Permission Requests All inquiries regarding permission to reproduce any content in the Ontario Health Technology Assessment Series should be directed to [email protected].
How to Obtain Issues in the Ontario Health Technology Assessment Series All reports in the Ontario Health Technology Assessment Series are freely available in PDF format at the following URL: http://www.hqontario.ca/evidence/publications-and-ohtac-recommendations/ontario-health-technology-assessment-series.
Conflict of Interest Statement The authors at Health Quality Ontario are impartial. There are no competing interests or conflicts of interest to declare.
Indexing The Ontario Health Technology Assessment Series is currently indexed in MEDLINE/PubMed, Excerpta Medica/Embase, and the Centre for Reviews and Dissemination database.
Peer Review All reports in the Ontario Health Technology Assessment Series are subject to external expert peer review. Additionally, Health Quality Ontario posts draft reports and recommendations on its website for public comment prior to publication. For more information, please visit: http://www.hqontario.ca/en/mas/ohtac_public_engage_overview.html.

Ontario Health Technology Assessment Series; Vol. 15: No. 9, pp. 1–58, March 2015 3
About Health Quality Ontario Health Quality Ontario is the provincial advisor on the quality of health care in Ontario, evaluating the effectiveness of health care technologies and services, providing evidence-based recommendations, reporting to the public on the quality of the health system, and supporting the spread of quality improvement throughout the system. Health Quality Ontario’s research is published as part of the Ontario Health Technology Assessment Series, which is indexed in MEDLINE/PubMed, Excerpta Medica/Embase, and the Centre for Reviews and Dissemination database. Corresponding Ontario Health Technology Advisory Committee recommendations and other associated reports are also published on the Health Quality Ontario website. Visit http://www.hqontario.ca for more information.
About the Ontario Health Technology Assessment Series To conduct its comprehensive analyses, Health Quality Ontario and its research partners review the available scientific literature, making every effort to consider all relevant national and international research; collaborate with partners across relevant government branches; consult with expert advisory panels, clinical and other external experts, and developers of health technologies; and solicit any necessary supplemental information. In addition, Health Quality Ontario collects and analyzes information about how a health intervention fits within current practice and existing treatment alternatives. Details about the diffusion of the intervention into current health care practices in Ontario add an important dimension to the review. The Ontario Health Technology Advisory Committee uses a unique decision determinants framework when making recommendations to the Health Quality Ontario Board. The framework takes into account clinical benefits, value for money, societal and ethical considerations, and the economic feasibility of the health care intervention in Ontario. Draft Ontario Health Technology Advisory Committee recommendations and evidence-based reviews are posted for 21 days on the Health Quality Ontario website, giving individuals and organizations an opportunity to provide comments prior to publication. For more information, please visit: http://www.hqontario.ca/evidence/evidence-process/evidence-review-process/professional-and-public-engagement-and-consultation.
Disclaimer This report was prepared by Health Quality Ontario or one of its research partners for the Ontario Health Technology Advisory Committee and was developed from analysis, interpretation, and comparison of scientific research. It also incorporates, when available, Ontario data and information provided by experts and applicants to HQO. The analysis may not have captured every relevant publication and relevant scientific findings may have been reported since the development of this recommendation. This report may be superseded by an updated publication on the same topic. Please check the Health Quality Ontario website for a list of all publications: http://www.hqontario.ca/evidence/publications-and-ohtac-recommendations.
Ontario Health Technology Assessment Series; Vol. 15: No. 9, pp. 1–58, March 2015 4
ABSTRACT
Background
In 2007, caesarean deliveries comprised 28% of all hospital deliveries in Ontario. Provincial caesarean delivery rates increased with maternal age and varied by Local Health Integration Network. However, the accepted rate of caesarean delivery in a low-risk maternal population remains unclear.
Objectives
To review the literature to assess factors that affect the likelihood of experiencing a caesarean delivery, and to examine Ontario caesarean delivery rates to determine whether there is rate variation across the province.
Data Sources
Data sources included publications from OVID MEDLINE, OVID MEDLINE In-Process and Other Non-Indexed Citations, OVID Embase, EBSCO Cumulative Index to Nursing & Allied Health Literature (CINAHL), and EBM Reviews, as well as data from the Canadian Institute for Health Information Discharge Abstracts Database and the Better Outcomes and Registry Network.
Review Methods
A mixed-methods approach was used, which included a systematic review of the literature to delineate factors associated with the likelihood of caesarean delivery and an analysis of administrative and clinical data on hospital deliveries in Ontario to determine provincial caesarean delivery rates, variation in rates, and reasons for variation.
Results
Fourteen systematic reviews assessed 14 factors affecting the likelihood of caesarean delivery; 7 factors were associated with an increased likelihood of caesarean delivery, and 2 factors were associated with a decreased likelihood. Five factors had no influence. One factor provided moderate-quality evidence supporting elective induction policies in low-risk women. The overall Ontario caesarean delivery rate in a very-low-risk population was 17%, but varied significantly across Ontario hospitals.
Limitations
The literature review included a 5-year period and used only systematic reviews. The determination of Robson class for women is based on care received in hospital only, and the low-risk population may have included data from women with obstetrical conditions that warranted a caesarean delivery.
Conclusions
There is moderate-quality evidence that—compared with expectant management—an induction policy is associated with a decrease in caesarean delivery rates in low-risk women. There is significant caesarean delivery rate variation among Ontario hospitals.
Ontario Health Technology Assessment Series; Vol. 15: No. 9, pp. 1–58, March 2015 5
PLAIN LANGUAGE SUMMARY
A caesarean delivery is a surgical procedure to deliver 1 or more babies. It can be done when a vaginal delivery would be risky for the mother or baby. There are concerns that the mother and/or the baby may have serious complications from a caesarean delivery. It is important to know what factors increase the chance of having a caesarean delivery. It is also important to know how many caesarean deliveries are done in Ontario. This review found 14 factors, of which 9 were associated with either an increased or decreased chance of having a caesarean delivery. Of these, a policy of inducing labour lowered the rate of having a caesarean delivery compared with a policy of expectant management in low-risk women. An analysis of a registry for Ontario hospital births found a caesarean delivery rate of about 17% among women at very-low risk for complications. This rate varies among Ontario hospitals.
Ontario Health Technology Assessment Series; Vol. 15: No. 9, pp. 1–58, March 2015 6
TABLE OF CONTENTS
LIST OF TABLES ...................................................................................................................... 7
LIST OF FIGURES .................................................................................................................... 8
LIST OF ABBREVIATIONS ....................................................................................................... 9
BACKGROUND ........................................................................................................................10
Objective of Analysis ................................................................................................................................... 10
Clinical Need and Target Population .......................................................................................................... 10
Technology/Technique ................................................................................................................................ 10
Impact on the System ......................................................................................................................... 11
Global Rates and Trends .................................................................................................................... 11
Canadian Rates and Trends ............................................................................................................... 11
Ontario Rates and Trends ................................................................................................................... 11
EVIDENCE-BASED ANALYSIS ...............................................................................................13
Research Questions .................................................................................................................................... 13
Research Methods ...................................................................................................................................... 13
Expert Panel ................................................................................................................................................ 13
Systematic Review ...................................................................................................................................... 14
Research Methods .............................................................................................................................. 14
Quality of Evidence ............................................................................................................................. 14
Results of Systematic Review ............................................................................................................. 15
Summary ............................................................................................................................................. 27
Provincial Rate Review ............................................................................................................................... 28
Research Methods .............................................................................................................................. 28
Results of Provincial Rate Review ...................................................................................................... 29
Panel Recommendations ............................................................................................................................ 38
CONCLUSIONS .......................................................................................................................39
EXISTING GUIDELINES FOR TECHNOLOGY ........................................................................40
ACKNOWLEDGEMENTS .........................................................................................................41
APPENDICES...........................................................................................................................43
Appendix 1: Literature Search Strategies ................................................................................................... 43
Appendix 2: Evidence Quality Assessment ................................................................................................ 47
Appendix 3: Forest Plot ............................................................................................................................... 52
REFERENCES .........................................................................................................................53
Ontario Health Technology Assessment Series; Vol. 15: No. 9, pp. 1–58, March 2015 7
LIST OF TABLES
Table 1: Body of Evidence Examined According to Study Design .............................................17 Table 2: Labour Induction Policy in Low-Risk Women at or Beyond Term Compared With
Expectant Management .................................................................................................18 Table 3: Epidural Analgesia Compared With Non-Epidural Analgesia or No Analgesia .............19 Table 4: Any Type of Forceps Compared With Any Type of Ventouse for Assisted Vaginal
Delivery .........................................................................................................................19 Table 5: CTG Compared With Intermittent Auscultation on Admission to the Labour Ward in
Low-Risk Women ..........................................................................................................20 Table 6: Partogram Compared With No Partogram During Labour in Women With
Spontaneous Term Pregnancies ...................................................................................21 Table 7: Package of Care for Active Management in Labour Compared With Routine Care in
Low-Risk Women ..........................................................................................................21 Table 8: Oxytocin to Augment Labour in Low-Risk Women .......................................................22 Table 9: Gestational Diabetes Mellitus and Caesarean Delivery ...............................................23 Table 10: Tight-Moderate Glycemic Control Compared With Loose Glycemic Control in Low-
Risk Women With Pre-existing Type 1 or 2 Diabetes .....................................................23 Table 11: Maternal Age and Caesarean Delivery ......................................................................24 Table 12: Women’s Preference for a Caesarean Delivery Compared With a Vaginal Delivery ..25 Table 13: Maternal BMI as a Risk Factor for Caesarean Delivery in Low-Risk Women .............25 Table 14: Women Who Had an IVF/ICSI-Assisted Pregnancy Compared With Women Who
Had Spontaneous Conception Pregnancies ..................................................................26 Table 15: Group Prenatal Care Compared With Individual Prenatal Care in Low-Risk Women .27 Table 16: Summary of Factors Affecting the Likelihood of Caesarean Delivery in Low-Risk
Women ..........................................................................................................................27 Table 17: Caesarean Delivery Rates Among Ontario Women Who Delivered in Hospital, by
Age and Calendar Year .................................................................................................30 Table 18: Caesarean Delivery Rates Among Ontario Women Who Delivered in Hospital, by
Robson Group (1, 2a, 2b, and Combined) and Fiscal Year ............................................30 Table 19: Caesarean Delivery Rates for Robson Groups 1 and 2a by Maternal
Characteristics (2011/2012) ...........................................................................................31 Table 20: Caesarean Delivery Rates for Robson Groups 1 and 2a by LHIN (2007/2008–
2011/2012) ....................................................................................................................32 Table 21: Caesarean Delivery Rates for Robson Groups 1 and 2a in a Very-Low-Risk
Cohorta by LHIN (2007/2008–2011/2012) ......................................................................33 Table 22: Caesarean Delivery Rates for Robson Groups 1 and 2a in a Very-Low-Risk
Cohorta by PCMCH Level of Care (2007/2008–2011/2012) ...........................................34 Table 23: Caesarean Delivery Rates for Robson Groups 1 and 2a in a Very-Low-Risk
Cohorta by Birth Volume (2007/2008–2011/2012) ..........................................................34 Table 24: Factors Affecting the Likelihood of Having a Caesarean Delivery in Low-Risk
Women—NICE Literature Review .................................................................................40 Table A1: AMSTAR, Scores of Included Systematic Reviews ...................................................47 Table A2: GRADE Evidence Profile for Labour Induction Policy ................................................48 Table A3: GRADE Evidence Profile for Group Prenatal Care ....................................................49 Table A4: Risk of Bias Among Randomized Controlled Trials for Induction Policy ....................50 Table A5: Risk of Bias Among Randomized Controlled Trials for Group Prenatal Care .............51
Ontario Health Technology Assessment Series; Vol. 15: No. 9, pp. 1–58, March 2015 8
LIST OF FIGURES
Figure 1: Citation Flow Chart .....................................................................................................16 Figure 2: Caesarean Delivery Rate for a Very-Low-Risk Cohort of Ontario Women Who
Delivered in Hospital, by Hospital and PCMCH Level of Care (2007/2008–2011/2012) .36 Figure 3: Caesarean Delivery Rate for a Very-Low-Risk Cohort of Ontario Women Who
Delivered in Hospital, by Hospital and Birth Volume (2007/2008–2011/2012) ...............37 Figure A1: Group Prenatal Care Compared With Individual Prenatal Care ................................52

Ontario Health Technology Assessment Series; Vol. 15: No. 9, pp. 1–58, March 2015 9
LIST OF ABBREVIATIONS
AMSTAR Assessment of Multiple Systematic Reviews
BORN Better Outcomes & Registry Network
CI Confidence interval(s)
CTG Cardiotocography
GDM Gestational diabetes mellitus
GRADE Grading of Recommendations Assessment, Development, and Evaluation
IADPSG International Association of the Diabetes in Pregnancy Study Group
ICES Institute for Clinical Evaluative Sciences
ICSI Intracytoplasmic sperm injection
IVF In vitro fertilization
LHIN Local health integration network
MOMBABY Mother-Baby Linked Database
NICE National Institute for Health and Clinical Excellence
OECD Organisation for Economic Co-operation and Development
PCMCH Provincial Centre for Maternal and Child Health
RCT Randomized controlled trial
RR Relative risk
WHO World Health Organization
Ontario Health Technology Assessment Series; Vol. 15: No. 9, pp. 1–58, March 2015 10
BACKGROUND
Objective of Analysis
The objective of this analysis was to review the literature to assess factors that affect the likelihood of experiencing a caesarean delivery, and to examine Ontario caesarean delivery rates to determine whether there is rate variation across the province.
Clinical Need and Target Population
A caesarean delivery is a surgical procedure to deliver 1 or more babies. In most cases, a caesarean delivery is performed when a vaginal delivery would put the baby’s or mother’s life or health at risk. Accepted indications for caesarean delivery include but are not limited to difficult or non-progressing labour, breech or other abnormal fetal position or size, non-reassuring fetal heart rate, and/or previous caesarean delivery, (1;2) but the benefits of a caesarean delivery compared with a vaginal delivery for a low-risk population continues to be debated. (3) In 2008, the Society of Obstetricians and Gynaecologists of Canada and other related Canadian professional organizations released a joint policy statement advocating for normal childbirth in a low-risk population. (4) According to these recommendations, as well as guidelines from the American (1) and British medical organizations, (5) caesarean deliveries should be offered only when vaginal delivery poses an increased risk to either the mother or the baby. These guidelines lack specificity, however, due to debate around indications for caesarean deliveries and appropriate rates at the population level. The accepted rate of caesarean delivery in a low-risk maternal population remains unclear. Maternal, infant, and obstetrical factors have all been cited as affecting the likelihood of having a caesarean delivery. (6) Maternal factors may include but are not limited to age, pre-existing health conditions (such as diabetes), obesity, hypertension, previous caesarean delivery, pregnancy-related health conditions (including gestational diabetes), pre-eclampsia, eclampsia, and maternal preference. Infant factors include antenatal problems preceding the intrapartum period (such as fetal anomalies and/or intrauterine growth restriction), and suspected macrosomia, malposition, or multiple births. Obstetrical factors are conditions brought about by the presence of the current intrauterine pregnancy, such as placental abruption, placenta accreta, placenta previa, prolapsed cord, and non-reassuring fetal heart tracing.
Technology/Technique
Rates of caesarean delivery as a percentage of all live births have increased in all Organisation for Economic Co-operation and Development (OECD) countries in recent decades. (7;8) Caesarean delivery rates now exceed 30% in several industrialized countries, including Canada, the United States, and Australia. (7;8) Studies have reported concerns about increased maternal and infant mortality after caesarean delivery, as well as maternal morbidity in deliveries subsequent to the primary caesarean procedure. (3;9) These concerns, combined with the greater financial cost of a caesarean birth, (10;11) raise the challenging question of the appropriate rate for caesarean delivery. The World Health Organization (WHO) has proposed a rate guideline of 10% to 15% for low-risk, singleton, vertex, full-term pregnancies, and the United States Public Service has proposed a guideline of 10.5%, (7) but these have been criticized for not adjusting for changing obstetrical practices and attitudes among both health care providers and patients. Reflecting these issues, the U.S. Healthy People 2020 initiative revised its recommended rates from 15% of all births in 2000 to a new target of 23.9% among
Ontario Health Technology Assessment Series; Vol. 15: No. 9, pp. 1–58, March 2015 11
nulliparous, singleton, vertex, full-term pregnancies with no previous caesarean delivery; this is a 10% decrease from the 2007 baseline rate of 26.5%. (12)
Impact on the System
Of every $10 (Cdn) spent on inpatient care in Canada, $1 (Cdn) is spent on childbirth and newborn care. (11) Compared to vaginal births, caesarean deliveries cost hospitals twice as much in obstetrical care for both mothers and babies. (11) The average hospital inpatient cost per delivery for typical patients is $4,930 (Cdn), and national estimates suggest that a primary caesarean delivery costs approximately $2,265 (Cdn) more than a typical vaginal delivery with no other interventions. (11) In 2008/2009, the total costs for all primary caesarean hospitalizations were estimated to be $292 million (Cdn). (11) However, health care providers are currently operating without an agreed-upon benchmark for caesarean delivery rates. Manitoba has the lowest primary caesarean delivery rate among the provinces, at 14% of all deliveries in 2008/2009. (11)
Global Rates and Trends
Across OECD countries, caesarean delivery rates increased from 14% of all births in 1990 to nearly 26% in 2009. (10) Rates were highest in Turkey and Mexico, at over 40% of all deliveries, and lowest in the Netherlands (14%) and Nordic countries (including Finland, Iceland, Norway, and Sweden). In the Netherlands, home births are a common option for women with low-risk pregnancies; 30% of all births occurred at home in 2004. (13) The observed increase in caesarean delivery rates temporarily slowed during the 1990s in some OECD countries such as Canada and the United States as a result of changes in obstetrical practice, including a trial of normal labour and delivery after previous caesarean delivery to reduce the number of repeat procedures. (14) However, caesarean rates soon increased, in part due to reports of complications from trial of labour and continued changes in patient preferences. (15) Other trends, such as increases in first births among older women and the rise in multiple births resulting from assisted reproductive therapy, also contributed to the global increase in caesarean deliveries. Rate increases since 2000 have been particularly rapid in Denmark, the Czech Republic, Poland, and the Slovak Republic. (10) Finland and Iceland are the only 2 OECD countries that have slightly reversed the trend of rising caesarean delivery rates since 2000. (10) The continued rise in caesarean deliveries is only partly related to changes in medical indications. A recent study of caesarean delivery rates found that even after adjusting for maternal and medical factors, women who had a preference for a caesarean delivery were almost twice as likely to have one compared with women who preferred a vaginal delivery. (16)
Canadian Rates and Trends
Caesarean rates have increased steadily in Canada since 1995, stabilizing in the last decade, (17) but they vary substantially from region to region. In 2008/2009, primary (first delivery) caesarean rates ranged from 23% of deliveries in Newfoundland and Labrador to 5% in Nunavut. (11) As noted above, Manitoba had the lowest provincial rate, at 14%. (11)
Ontario Rates and Trends
In 2007, caesarean deliveries comprised 28% of all hospital deliveries in Ontario. (18) Among women who had full-term, singleton, vertex presentations, 23% had caesarean deliveries.

Ontario Health Technology Assessment Series; Vol. 15: No. 9, pp. 1–58, March 2015 12
Provincial caesarean delivery rates increased with maternal age and varied by local health integration network (LHIN), but did not vary by neighbourhood income or neighbourhood educational attainment of the mother.
Ontario Health Technology Assessment Series; Vol. 15: No. 9, pp. 1–58, March 2015 13
EVIDENCE-BASED ANALYSIS
Research Questions
This report addressed 3 research questions:
What are the factors affecting the likelihood of having a caesarean delivery in a low-risk obstetrical population?
What is the Ontario provincial caesarean delivery rate for a low-risk obstetrical population, and does this rate vary within the province?
What are the likely reasons for caesarean delivery rate variation in Ontario, if it exists?
Research Methods
A mixed-methods approach was used, which included a systematic review of the literature to delineate factors associated with the likelihood of caesarean delivery. Then, an analysis of administrative and clinical data on hospital deliveries in Ontario was used to determine provincial caesarean delivery rates, variation in rates, and reasons for variation. Details of each methodology are reported in their respective sections.
Expert Panel
In January 2013, an Expert Advisory Panel on Caesarean Delivery Rate Review was struck. Members of the panel included physicians, nurses, midwives, childbirth educators, obstetrical anesthetists, hospital administrators, and personnel from the Ministry of Health and Long-Term Care. The role of the Expert Advisory Panel on Caesarean Delivery Rate Review was to contextualize the evidence produced by Health Quality Ontario and provide advice on the relevant issues pertaining to caesarean delivery rates in Ontario. However, the statements, conclusions, and views expressed in this report do not necessarily represent the views of Expert Advisory Panel members.
Ontario Health Technology Assessment Series; Vol. 15: No. 9, pp. 1–58, March 2015 14
Systematic Review
Research Methods
Literature Search Search Strategy A literature search was performed on February 4, 2013, using OVID MEDLINE, OVID MEDLINE In-Process and Other Non-Indexed Citations, OVID Embase, EBSCO Cumulative Index to Nursing & Allied Health Literature (CINAHL), and EBM Reviews for studies published from January 1, 2008, to February 4, 2013. (Appendix 1 provides details of the search strategies.) Abstracts were reviewed by a single reviewer and, for those studies meeting the eligibility criteria, full-text articles were obtained. Reference lists were also examined for any additional relevant studies not identified through the search.
Inclusion Criteria English-language full-text publications
published between January 1, 2008, and February 4, 2013
systematic reviews with meta-analysis of randomized controlled trials (RCTs) and/or observational data
maternal, obstetrical, fetal, or service-delivery factors
comparator was accepted routine care or no treatment
low-risk population
When more than 1 systematic review for a particular factor met the inclusion criteria, the most current review (i.e., the one with the most up-to-date literature search) was included.
Exclusion Criteria individual observational studies or RCTs
comparisons of different techniques for a given intervention (i.e., early versus late administration of epidural)
systematic reviews whose body of evidence was included in an updated systematic review answering the same research question
Outcomes of Interest caesarean delivery or preference for caesarean delivery
Quality of Evidence
The Assessment of Multiple Systematic Reviews (AMSTAR) measurement tool was used to assess the methodological quality of systematic reviews. (19) The quality of the body of evidence for each outcome was examined according to the Grading of Recommendations Assessment, Development, and Evaluation (GRADE) Working Group criteria. (20) The overall quality was determined to be high, moderate, low, or very low using a step-wise, structural methodology.
Ontario Health Technology Assessment Series; Vol. 15: No. 9, pp. 1–58, March 2015 15
Study design was the first consideration; the starting assumption was that RCTs are high quality, whereas observational studies are low quality. Five additional factors—risk of bias, inconsistency, indirectness, imprecision, and publication bias—were then taken into account. Limitations in these areas resulted in downgrading the quality of evidence. Finally, 3 main factors that may raise the quality of evidence were considered: the large magnitude of effect, the dose response gradient, and any residual confounding factors. (20) For more detailed information, please refer to the latest series of GRADE articles. (20) As stated by the GRADE Working Group, the final quality score can be interpreted using the following definitions: High High confidence in the effect estimate—the true effect lies close to the
estimate of the effect
Moderate Moderate confidence in the effect estimate—the true effect is likely to be close to the estimate of the effect, but may be substantially different
Low Low confidence in the effect estimate—the true effect may be substantially different from the estimate of the effect
Very Low Very low confidence in the effect estimate—the true effect is likely to be substantially different from the estimate of effect
Results of Systematic Review
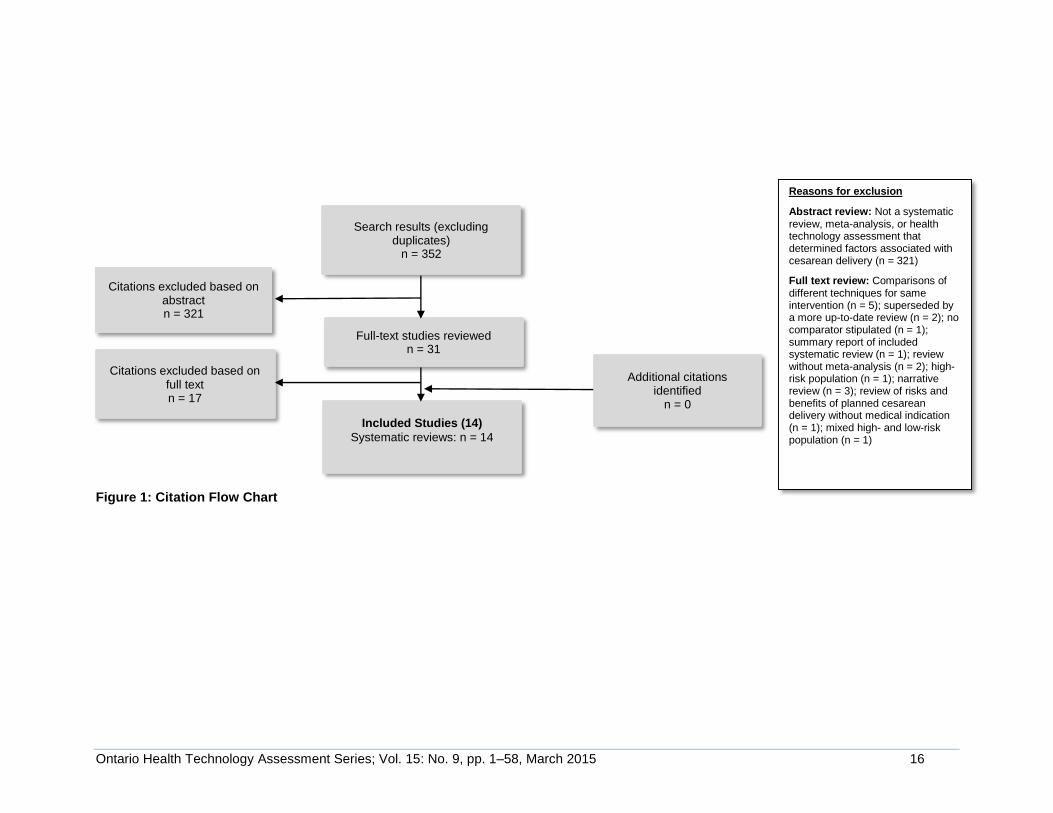
The database search yielded 352 citations published between January 1, 2008, and February 4, 2013 (with duplicates removed). Articles were excluded based on information in the title and abstract. The full texts of potentially relevant articles were obtained for further assessment. Figure 1 shows the breakdown of when and for what reason citations were excluded from the analysis. Fourteen systematic reviews met the inclusion criteria. (21-34) The reference lists of the included studies were hand-searched to identify other relevant studies, but no additional citations were included.
Ontario Health Technology Assessment Series; Vol. 15: No. 9, pp. 1–58, March 2015 16
Figure 1: Citation Flow Chart
Search results (excluding duplicates)
n = 352
Full-text studies reviewed n = 31
Included Studies (14)
Systematic reviews: n = 14
Citations excluded based on abstract n = 321
Citations excluded based on full text n = 17
Additional citations identified
n = 0
Reasons for exclusion
Abstract review: Not a systematic review, meta-analysis, or health technology assessment that determined factors associated with cesarean delivery (n = 321)
Full text review: Comparisons of different techniques for same intervention (n = 5); superseded by a more up-to-date review (n = 2); no comparator stipulated (n = 1); summary report of included systematic review (n = 1); review without meta-analysis (n = 2); high-risk population (n = 1); narrative review (n = 3); review of risks and benefits of planned cesarean delivery without medical indication (n = 1); mixed high- and low-risk population (n = 1)
Ontario Health Technology Assessment Series; Vol. 15: No. 9, pp. 1–58, March 2015 17
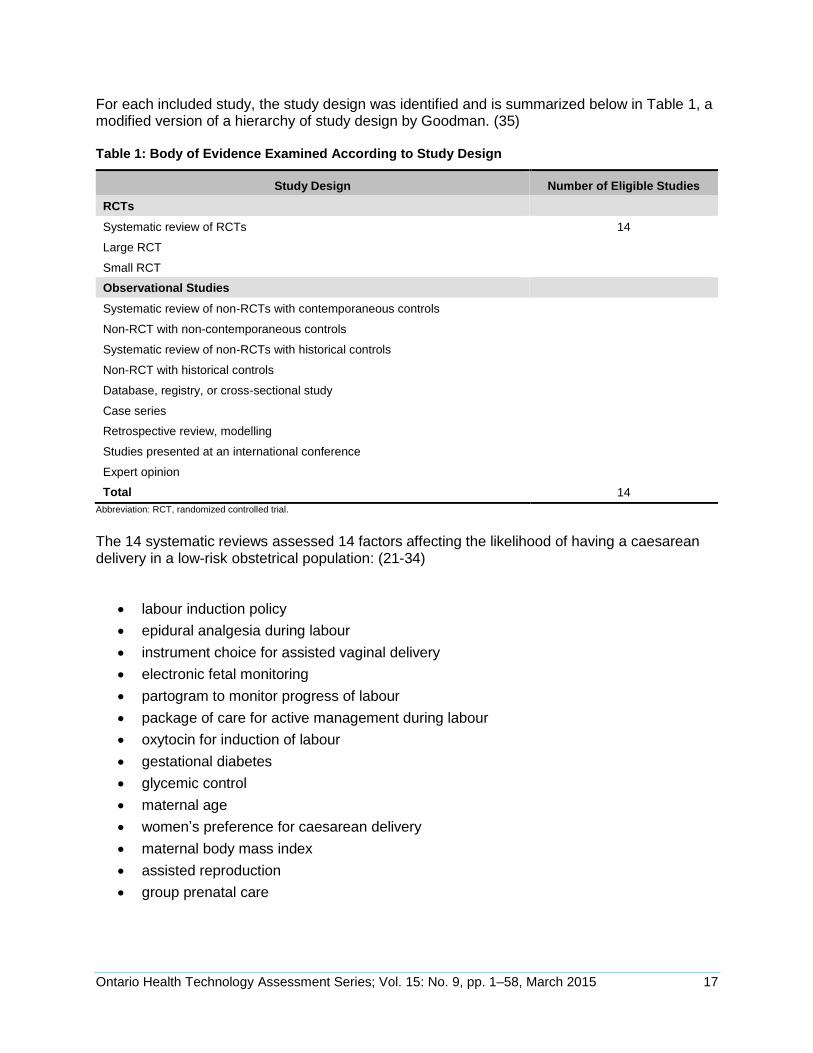
For each included study, the study design was identified and is summarized below in Table 1, a modified version of a hierarchy of study design by Goodman. (35) Table 1: Body of Evidence Examined According to Study Design
Study Design Number of Eligible Studies
RCTs
Systematic review of RCTs 14
Large RCT
Small RCT
Observational Studies
Systematic review of non-RCTs with contemporaneous controls
Non-RCT with non-contemporaneous controls
Systematic review of non-RCTs with historical controls
Non-RCT with historical controls
Database, registry, or cross-sectional study
Case series
Retrospective review, modelling
Studies presented at an international conference
Expert opinion
Total 14
Abbreviation: RCT, randomized controlled trial.
The 14 systematic reviews assessed 14 factors affecting the likelihood of having a caesarean delivery in a low-risk obstetrical population: (21-34)
labour induction policy
epidural analgesia during labour
instrument choice for assisted vaginal delivery
electronic fetal monitoring
partogram to monitor progress of labour
package of care for active management during labour
oxytocin for induction of labour
gestational diabetes
glycemic control
maternal age
women’s preference for caesarean delivery
maternal body mass index
assisted reproduction
group prenatal care
Ontario Health Technology Assessment Series; Vol. 15: No. 9, pp. 1–58, March 2015 18
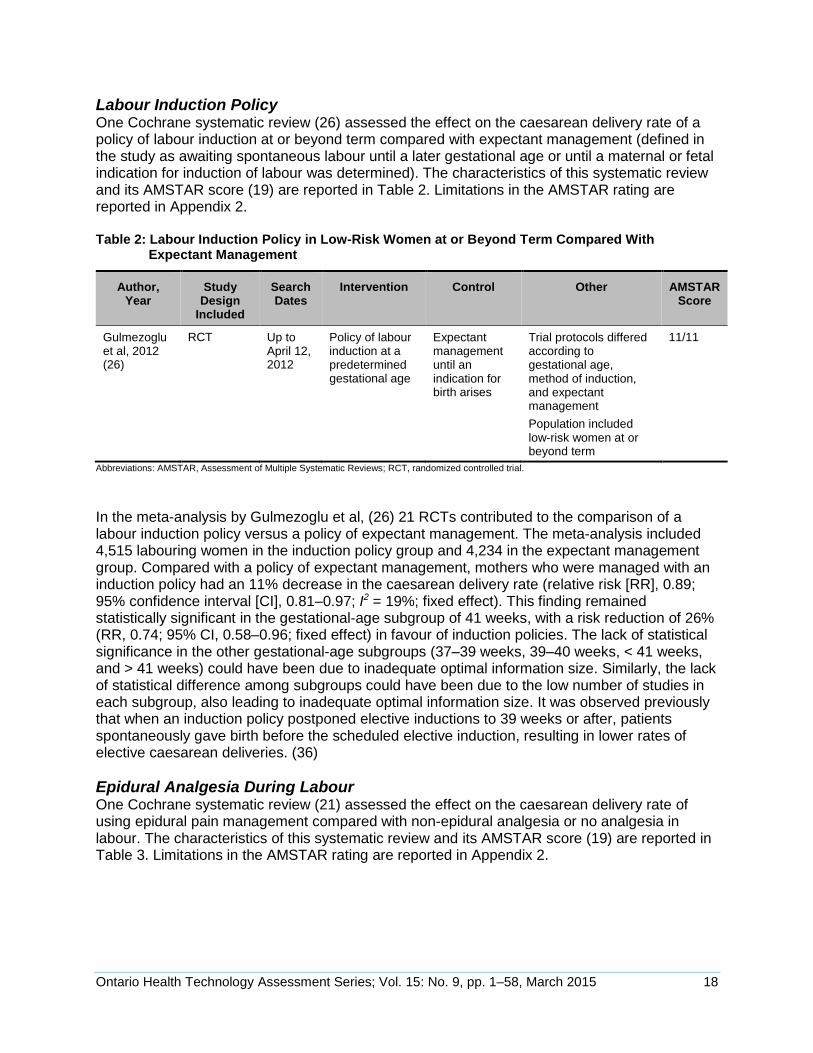
Labour Induction Policy One Cochrane systematic review (26) assessed the effect on the caesarean delivery rate of a policy of labour induction at or beyond term compared with expectant management (defined in the study as awaiting spontaneous labour until a later gestational age or until a maternal or fetal indication for induction of labour was determined). The characteristics of this systematic review and its AMSTAR score (19) are reported in Table 2. Limitations in the AMSTAR rating are reported in Appendix 2. Table 2: Labour Induction Policy in Low-Risk Women at or Beyond Term Compared With
Expectant Management
Author, Year
Study Design
Included
Search Dates
Intervention Control Other AMSTAR Score
Gulmezoglu et al, 2012 (26)
RCT Up to April 12, 2012
Policy of labour induction at a predetermined gestational age
Expectant management until an indication for birth arises
Trial protocols differed according to gestational age, method of induction, and expectant management
Population included low-risk women at or beyond term
11/11
Abbreviations: AMSTAR, Assessment of Multiple Systematic Reviews; RCT, randomized controlled trial.
In the meta-analysis by Gulmezoglu et al, (26) 21 RCTs contributed to the comparison of a labour induction policy versus a policy of expectant management. The meta-analysis included 4,515 labouring women in the induction policy group and 4,234 in the expectant management group. Compared with a policy of expectant management, mothers who were managed with an induction policy had an 11% decrease in the caesarean delivery rate (relative risk [RR], 0.89; 95% confidence interval [CI], 0.81–0.97; I2 = 19%; fixed effect). This finding remained statistically significant in the gestational-age subgroup of 41 weeks, with a risk reduction of 26% (RR, 0.74; 95% CI, 0.58–0.96; fixed effect) in favour of induction policies. The lack of statistical significance in the other gestational-age subgroups (37–39 weeks, 39–40 weeks, < 41 weeks, and > 41 weeks) could have been due to inadequate optimal information size. Similarly, the lack of statistical difference among subgroups could have been due to the low number of studies in each subgroup, also leading to inadequate optimal information size. It was observed previously that when an induction policy postponed elective inductions to 39 weeks or after, patients spontaneously gave birth before the scheduled elective induction, resulting in lower rates of elective caesarean deliveries. (36)
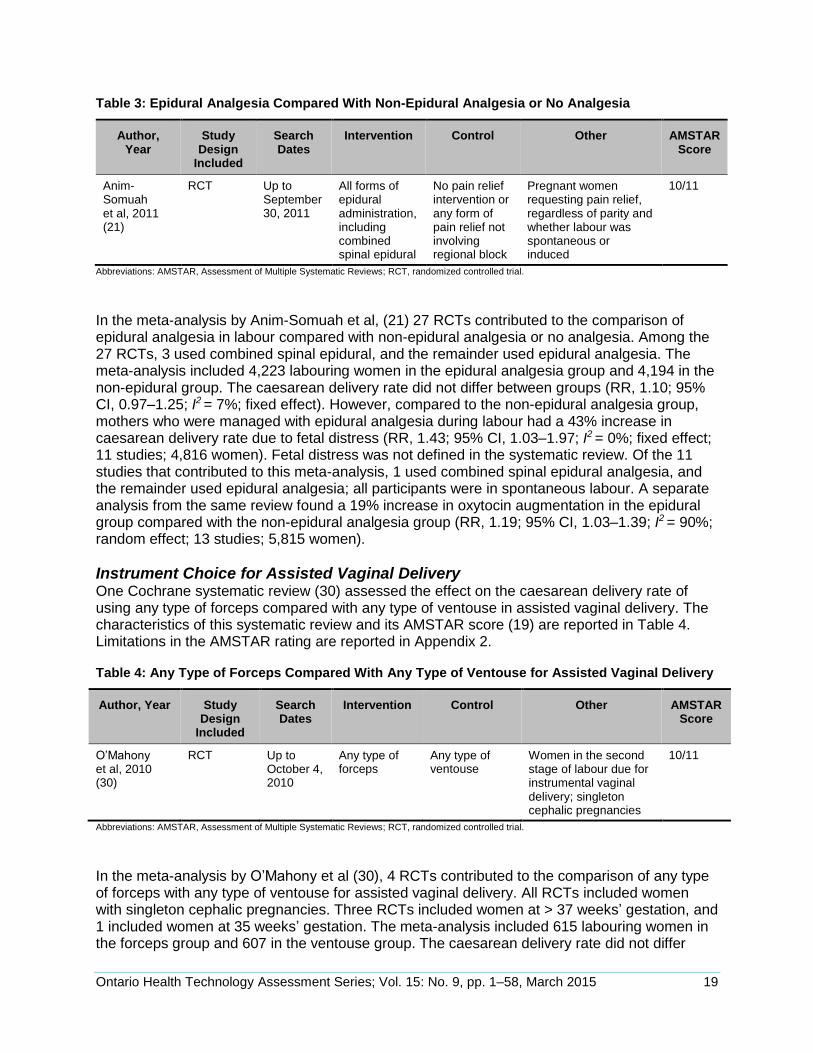
Epidural Analgesia During Labour One Cochrane systematic review (21) assessed the effect on the caesarean delivery rate of using epidural pain management compared with non-epidural analgesia or no analgesia in labour. The characteristics of this systematic review and its AMSTAR score (19) are reported in Table 3. Limitations in the AMSTAR rating are reported in Appendix 2.
Ontario Health Technology Assessment Series; Vol. 15: No. 9, pp. 1–58, March 2015 19
Table 3: Epidural Analgesia Compared With Non-Epidural Analgesia or No Analgesia
Author, Year
Study Design
Included
Search Dates
Intervention Control Other AMSTAR Score
Anim-Somuah et al, 2011 (21)
RCT Up to September 30, 2011
All forms of epidural administration, including combined spinal epidural
No pain relief intervention or any form of pain relief not involving regional block
Pregnant women requesting pain relief, regardless of parity and whether labour was spontaneous or induced
10/11
Abbreviations: AMSTAR, Assessment of Multiple Systematic Reviews; RCT, randomized controlled trial.
In the meta-analysis by Anim-Somuah et al, (21) 27 RCTs contributed to the comparison of epidural analgesia in labour compared with non-epidural analgesia or no analgesia. Among the 27 RCTs, 3 used combined spinal epidural, and the remainder used epidural analgesia. The meta-analysis included 4,223 labouring women in the epidural analgesia group and 4,194 in the non-epidural group. The caesarean delivery rate did not differ between groups (RR, 1.10; 95% CI, 0.97–1.25; I2 = 7%; fixed effect). However, compared to the non-epidural analgesia group, mothers who were managed with epidural analgesia during labour had a 43% increase in caesarean delivery rate due to fetal distress (RR, 1.43; 95% CI, 1.03–1.97; I2 = 0%; fixed effect; 11 studies; 4,816 women). Fetal distress was not defined in the systematic review. Of the 11 studies that contributed to this meta-analysis, 1 used combined spinal epidural analgesia, and the remainder used epidural analgesia; all participants were in spontaneous labour. A separate analysis from the same review found a 19% increase in oxytocin augmentation in the epidural group compared with the non-epidural analgesia group (RR, 1.19; 95% CI, 1.03–1.39; I2 = 90%; random effect; 13 studies; 5,815 women).
Instrument Choice for Assisted Vaginal Delivery One Cochrane systematic review (30) assessed the effect on the caesarean delivery rate of using any type of forceps compared with any type of ventouse in assisted vaginal delivery. The characteristics of this systematic review and its AMSTAR score (19) are reported in Table 4. Limitations in the AMSTAR rating are reported in Appendix 2. Table 4: Any Type of Forceps Compared With Any Type of Ventouse for Assisted Vaginal Delivery
Author, Year Study Design
Included
Search Dates
Intervention Control Other AMSTAR Score
O’Mahony et al, 2010 (30)
RCT Up to October 4, 2010
Any type of forceps
Any type of ventouse
Women in the second stage of labour due for instrumental vaginal delivery; singleton cephalic pregnancies
10/11
Abbreviations: AMSTAR, Assessment of Multiple Systematic Reviews; RCT, randomized controlled trial.
In the meta-analysis by O’Mahony et al (30), 4 RCTs contributed to the comparison of any type of forceps with any type of ventouse for assisted vaginal delivery. All RCTs included women with singleton cephalic pregnancies. Three RCTs included women at > 37 weeks’ gestation, and 1 included women at 35 weeks’ gestation. The meta-analysis included 615 labouring women in the forceps group and 607 in the ventouse group. The caesarean delivery rate did not differ
Ontario Health Technology Assessment Series; Vol. 15: No. 9, pp. 1–58, March 2015 20
between groups (RR, 1.76; 95% CI, 0.95–3.23; I2 = 0%; fixed effect). The systematic review also compared different types of forceps and ventouse instruments, but that comparison was outside the scope of this review. The systematic review did not complete a subgroup analysis of operator experience.
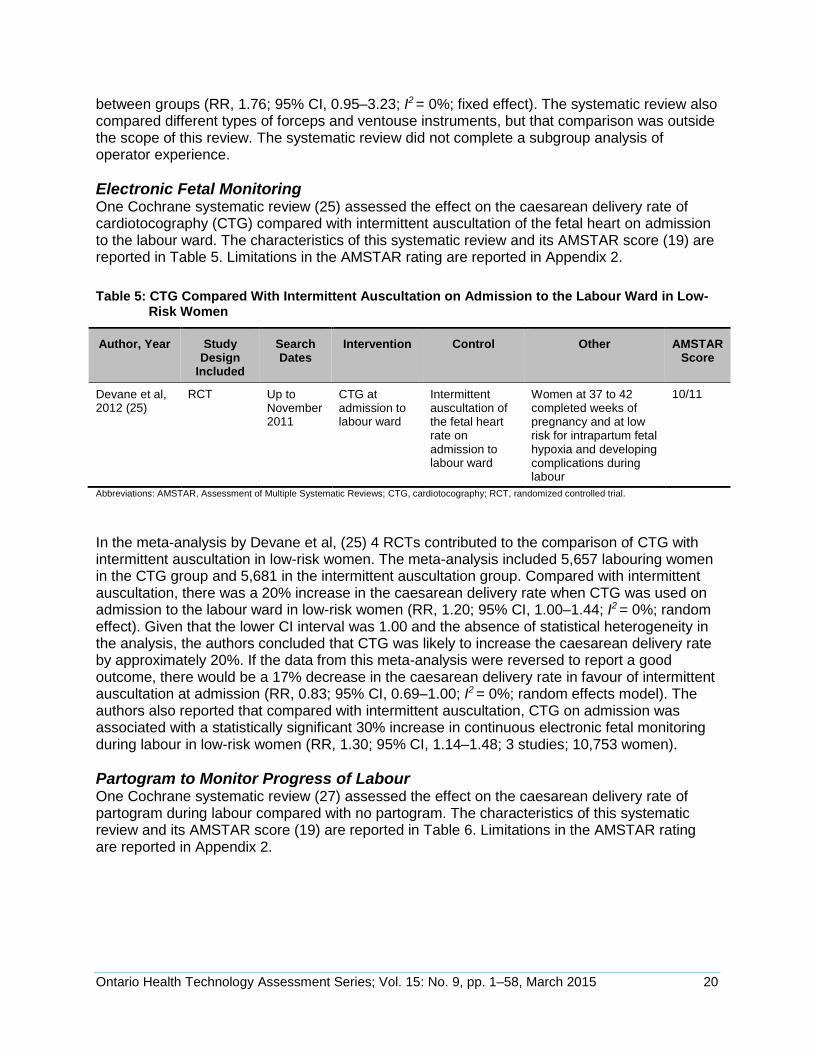
Electronic Fetal Monitoring One Cochrane systematic review (25) assessed the effect on the caesarean delivery rate of cardiotocography (CTG) compared with intermittent auscultation of the fetal heart on admission to the labour ward. The characteristics of this systematic review and its AMSTAR score (19) are reported in Table 5. Limitations in the AMSTAR rating are reported in Appendix 2.
Table 5: CTG Compared With Intermittent Auscultation on Admission to the Labour Ward in Low-Risk Women
Author, Year Study Design
Included
Search Dates
Intervention Control Other AMSTAR Score
Devane et al, 2012 (25)
RCT Up to November 2011
CTG at admission to labour ward
Intermittent auscultation of the fetal heart rate on admission to labour ward
Women at 37 to 42 completed weeks of pregnancy and at low risk for intrapartum fetal hypoxia and developing complications during labour
10/11
Abbreviations: AMSTAR, Assessment of Multiple Systematic Reviews; CTG, cardiotocography; RCT, randomized controlled trial.
In the meta-analysis by Devane et al, (25) 4 RCTs contributed to the comparison of CTG with intermittent auscultation in low-risk women. The meta-analysis included 5,657 labouring women in the CTG group and 5,681 in the intermittent auscultation group. Compared with intermittent auscultation, there was a 20% increase in the caesarean delivery rate when CTG was used on admission to the labour ward in low-risk women (RR, 1.20; 95% CI, 1.00–1.44; I2 = 0%; random effect). Given that the lower CI interval was 1.00 and the absence of statistical heterogeneity in the analysis, the authors concluded that CTG was likely to increase the caesarean delivery rate by approximately 20%. If the data from this meta-analysis were reversed to report a good outcome, there would be a 17% decrease in the caesarean delivery rate in favour of intermittent auscultation at admission (RR, 0.83; 95% CI, 0.69–1.00; I2 = 0%; random effects model). The authors also reported that compared with intermittent auscultation, CTG on admission was associated with a statistically significant 30% increase in continuous electronic fetal monitoring during labour in low-risk women (RR, 1.30; 95% CI, 1.14–1.48; 3 studies; 10,753 women).
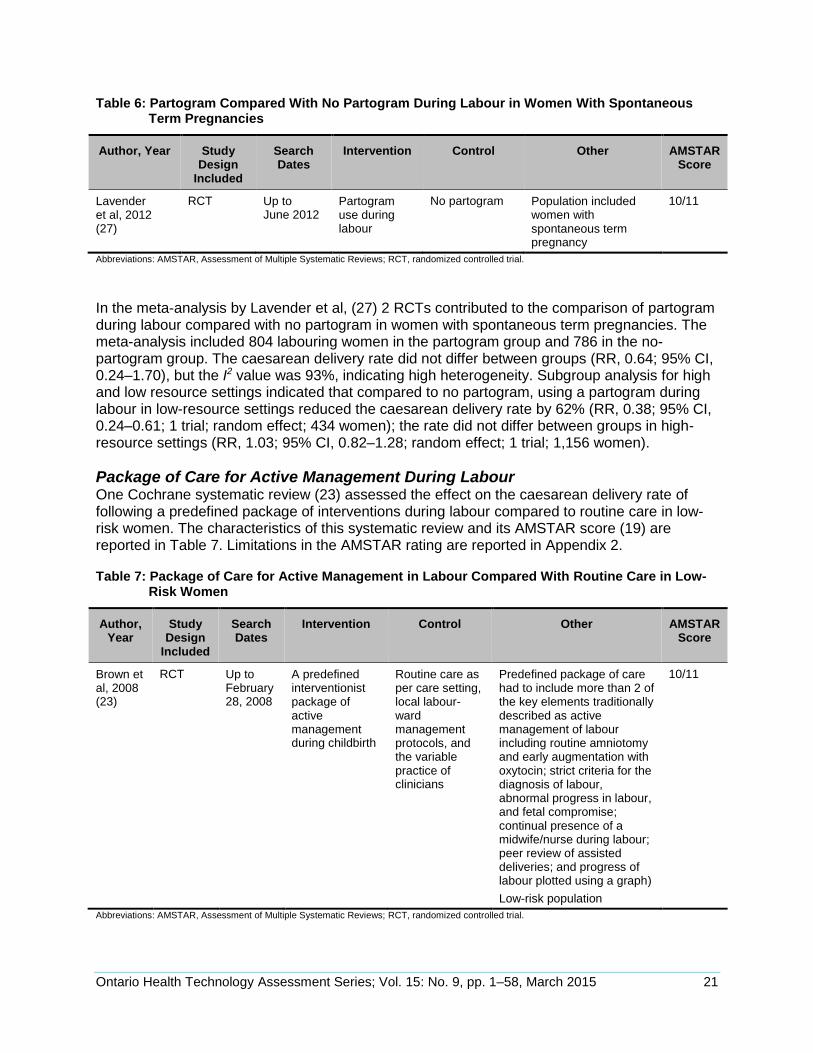
Partogram to Monitor Progress of Labour One Cochrane systematic review (27) assessed the effect on the caesarean delivery rate of partogram during labour compared with no partogram. The characteristics of this systematic review and its AMSTAR score (19) are reported in Table 6. Limitations in the AMSTAR rating are reported in Appendix 2.
Ontario Health Technology Assessment Series; Vol. 15: No. 9, pp. 1–58, March 2015 21
Table 6: Partogram Compared With No Partogram During Labour in Women With Spontaneous Term Pregnancies
Author, Year Study Design
Included
Search Dates
Intervention Control Other AMSTAR Score
Lavender et al, 2012 (27)
RCT Up to June 2012
Partogram use during labour
No partogram Population included women with spontaneous term pregnancy
10/11
Abbreviations: AMSTAR, Assessment of Multiple Systematic Reviews; RCT, randomized controlled trial.
In the meta-analysis by Lavender et al, (27) 2 RCTs contributed to the comparison of partogram during labour compared with no partogram in women with spontaneous term pregnancies. The meta-analysis included 804 labouring women in the partogram group and 786 in the no-partogram group. The caesarean delivery rate did not differ between groups (RR, 0.64; 95% CI, 0.24–1.70), but the I2 value was 93%, indicating high heterogeneity. Subgroup analysis for high and low resource settings indicated that compared to no partogram, using a partogram during labour in low-resource settings reduced the caesarean delivery rate by 62% (RR, 0.38; 95% CI, 0.24–0.61; 1 trial; random effect; 434 women); the rate did not differ between groups in high-resource settings (RR, 1.03; 95% CI, 0.82–1.28; random effect; 1 trial; 1,156 women).
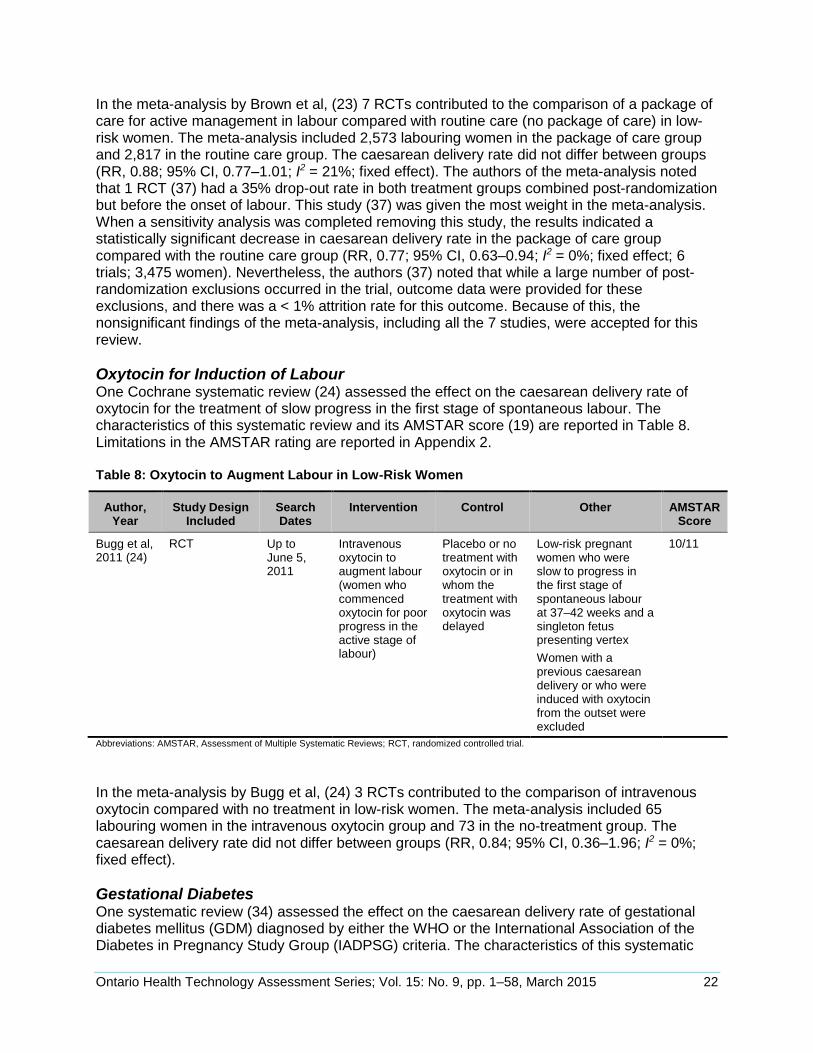
Package of Care for Active Management During Labour One Cochrane systematic review (23) assessed the effect on the caesarean delivery rate of following a predefined package of interventions during labour compared to routine care in low-risk women. The characteristics of this systematic review and its AMSTAR score (19) are reported in Table 7. Limitations in the AMSTAR rating are reported in Appendix 2. Table 7: Package of Care for Active Management in Labour Compared With Routine Care in Low-
Risk Women
Author, Year
Study Design
Included
Search Dates
Intervention Control Other AMSTAR Score
Brown et al, 2008 (23)
RCT Up to February 28, 2008
A predefined interventionist package of active management during childbirth
Routine care as per care setting, local labour-ward management protocols, and the variable practice of clinicians
Predefined package of care had to include more than 2 of the key elements traditionally described as active management of labour including routine amniotomy and early augmentation with oxytocin; strict criteria for the diagnosis of labour, abnormal progress in labour, and fetal compromise; continual presence of a midwife/nurse during labour; peer review of assisted deliveries; and progress of labour plotted using a graph)
Low-risk population
10/11
Abbreviations: AMSTAR, Assessment of Multiple Systematic Reviews; RCT, randomized controlled trial.
Ontario Health Technology Assessment Series; Vol. 15: No. 9, pp. 1–58, March 2015 22
In the meta-analysis by Brown et al, (23) 7 RCTs contributed to the comparison of a package of care for active management in labour compared with routine care (no package of care) in low-risk women. The meta-analysis included 2,573 labouring women in the package of care group and 2,817 in the routine care group. The caesarean delivery rate did not differ between groups (RR, 0.88; 95% CI, 0.77–1.01; I2 = 21%; fixed effect). The authors of the meta-analysis noted that 1 RCT (37) had a 35% drop-out rate in both treatment groups combined post-randomization but before the onset of labour. This study (37) was given the most weight in the meta-analysis. When a sensitivity analysis was completed removing this study, the results indicated a statistically significant decrease in caesarean delivery rate in the package of care group compared with the routine care group (RR, 0.77; 95% CI, 0.63–0.94; I2 = 0%; fixed effect; 6 trials; 3,475 women). Nevertheless, the authors (37) noted that while a large number of post-randomization exclusions occurred in the trial, outcome data were provided for these exclusions, and there was a < 1% attrition rate for this outcome. Because of this, the nonsignificant findings of the meta-analysis, including all the 7 studies, were accepted for this review.
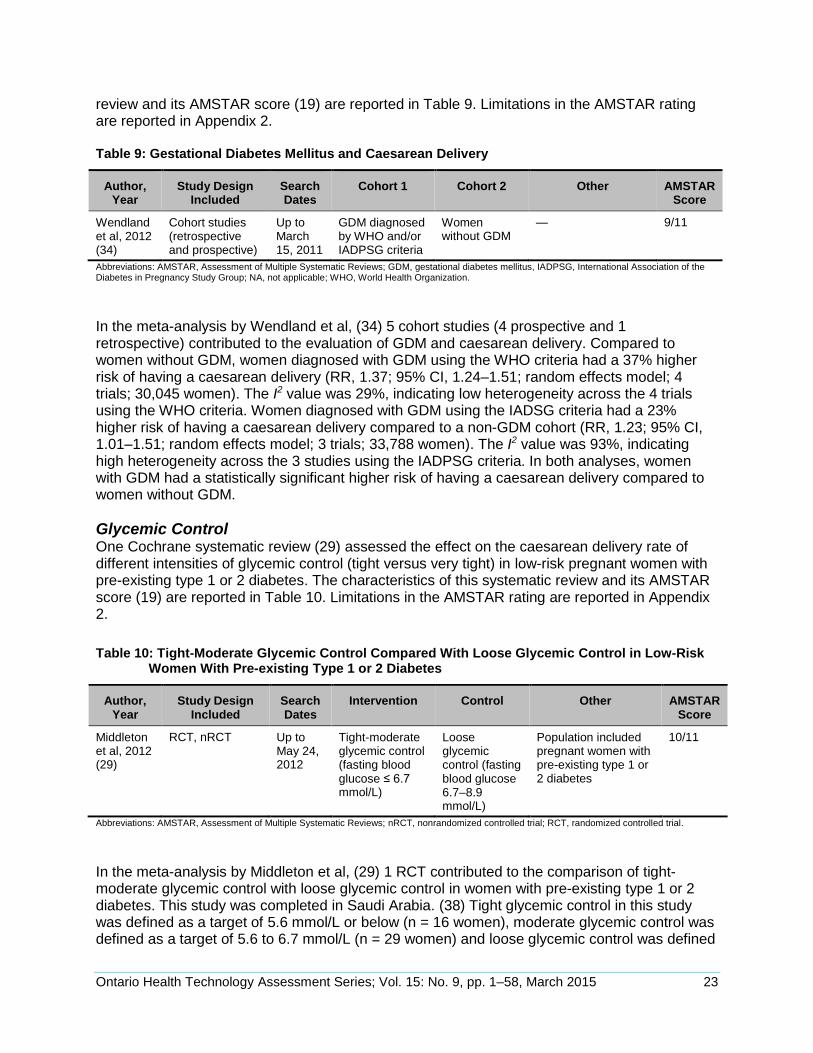
Oxytocin for Induction of Labour One Cochrane systematic review (24) assessed the effect on the caesarean delivery rate of oxytocin for the treatment of slow progress in the first stage of spontaneous labour. The characteristics of this systematic review and its AMSTAR score (19) are reported in Table 8. Limitations in the AMSTAR rating are reported in Appendix 2. Table 8: Oxytocin to Augment Labour in Low-Risk Women
Author, Year
Study Design Included
Search Dates
Intervention Control Other AMSTAR Score
Bugg et al, 2011 (24)
RCT Up to June 5, 2011
Intravenous oxytocin to augment labour (women who commenced oxytocin for poor progress in the active stage of labour)
Placebo or no treatment with oxytocin or in whom the treatment with oxytocin was delayed
Low-risk pregnant women who were slow to progress in the first stage of spontaneous labour at 37–42 weeks and a singleton fetus presenting vertex
Women with a previous caesarean delivery or who were induced with oxytocin from the outset were excluded
10/11
Abbreviations: AMSTAR, Assessment of Multiple Systematic Reviews; RCT, randomized controlled trial.
In the meta-analysis by Bugg et al, (24) 3 RCTs contributed to the comparison of intravenous oxytocin compared with no treatment in low-risk women. The meta-analysis included 65 labouring women in the intravenous oxytocin group and 73 in the no-treatment group. The caesarean delivery rate did not differ between groups (RR, 0.84; 95% CI, 0.36–1.96; I2 = 0%; fixed effect).
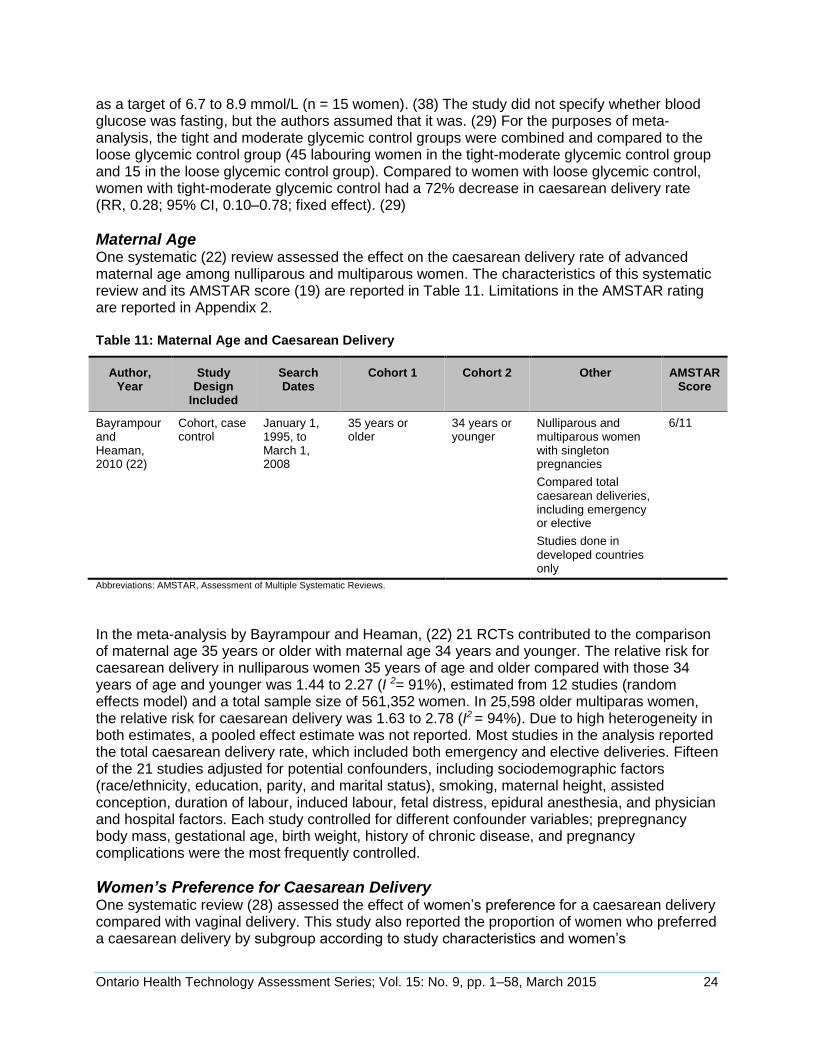
Gestational Diabetes One systematic review (34) assessed the effect on the caesarean delivery rate of gestational diabetes mellitus (GDM) diagnosed by either the WHO or the International Association of the Diabetes in Pregnancy Study Group (IADPSG) criteria. The characteristics of this systematic
Ontario Health Technology Assessment Series; Vol. 15: No. 9, pp. 1–58, March 2015 23
review and its AMSTAR score (19) are reported in Table 9. Limitations in the AMSTAR rating are reported in Appendix 2. Table 9: Gestational Diabetes Mellitus and Caesarean Delivery
Author, Year
Study Design Included
Search Dates
Cohort 1 Cohort 2 Other AMSTAR Score
Wendland et al, 2012 (34)
Cohort studies (retrospective and prospective)
Up to March 15, 2011
GDM diagnosed by WHO and/or IADPSG criteria
Women without GDM
— 9/11
Abbreviations: AMSTAR, Assessment of Multiple Systematic Reviews; GDM, gestational diabetes mellitus, IADPSG, International Association of the Diabetes in Pregnancy Study Group; NA, not applicable; WHO, World Health Organization.
In the meta-analysis by Wendland et al, (34) 5 cohort studies (4 prospective and 1 retrospective) contributed to the evaluation of GDM and caesarean delivery. Compared to women without GDM, women diagnosed with GDM using the WHO criteria had a 37% higher risk of having a caesarean delivery (RR, 1.37; 95% CI, 1.24–1.51; random effects model; 4 trials; 30,045 women). The I2 value was 29%, indicating low heterogeneity across the 4 trials using the WHO criteria. Women diagnosed with GDM using the IADSG criteria had a 23% higher risk of having a caesarean delivery compared to a non-GDM cohort (RR, 1.23; 95% CI, 1.01–1.51; random effects model; 3 trials; 33,788 women). The I2 value was 93%, indicating high heterogeneity across the 3 studies using the IADPSG criteria. In both analyses, women with GDM had a statistically significant higher risk of having a caesarean delivery compared to women without GDM.
Glycemic Control One Cochrane systematic review (29) assessed the effect on the caesarean delivery rate of different intensities of glycemic control (tight versus very tight) in low-risk pregnant women with pre-existing type 1 or 2 diabetes. The characteristics of this systematic review and its AMSTAR score (19) are reported in Table 10. Limitations in the AMSTAR rating are reported in Appendix 2.
Table 10: Tight-Moderate Glycemic Control Compared With Loose Glycemic Control in Low-Risk Women With Pre-existing Type 1 or 2 Diabetes
Author, Year
Study Design Included
Search Dates
Intervention Control Other AMSTAR Score
Middleton et al, 2012 (29)
RCT, nRCT Up to May 24, 2012
Tight-moderate glycemic control (fasting blood glucose ≤ 6.7 mmol/L)
Loose glycemic control (fasting blood glucose 6.7–8.9 mmol/L)
Population included pregnant women with pre-existing type 1 or 2 diabetes
10/11
Abbreviations: AMSTAR, Assessment of Multiple Systematic Reviews; nRCT, nonrandomized controlled trial; RCT, randomized controlled trial.
In the meta-analysis by Middleton et al, (29) 1 RCT contributed to the comparison of tight-moderate glycemic control with loose glycemic control in women with pre-existing type 1 or 2 diabetes. This study was completed in Saudi Arabia. (38) Tight glycemic control in this study was defined as a target of 5.6 mmol/L or below (n = 16 women), moderate glycemic control was defined as a target of 5.6 to 6.7 mmol/L (n = 29 women) and loose glycemic control was defined
Ontario Health Technology Assessment Series; Vol. 15: No. 9, pp. 1–58, March 2015 24
as a target of 6.7 to 8.9 mmol/L (n = 15 women). (38) The study did not specify whether blood glucose was fasting, but the authors assumed that it was. (29) For the purposes of meta-analysis, the tight and moderate glycemic control groups were combined and compared to the loose glycemic control group (45 labouring women in the tight-moderate glycemic control group and 15 in the loose glycemic control group). Compared to women with loose glycemic control, women with tight-moderate glycemic control had a 72% decrease in caesarean delivery rate (RR, 0.28; 95% CI, 0.10–0.78; fixed effect). (29)
Maternal Age One systematic (22) review assessed the effect on the caesarean delivery rate of advanced maternal age among nulliparous and multiparous women. The characteristics of this systematic review and its AMSTAR score (19) are reported in Table 11. Limitations in the AMSTAR rating are reported in Appendix 2. Table 11: Maternal Age and Caesarean Delivery
Author, Year
Study Design
Included
Search Dates
Cohort 1 Cohort 2 Other AMSTAR Score
Bayrampour and Heaman, 2010 (22)
Cohort, case control
January 1, 1995, to March 1, 2008
35 years or older
34 years or younger
Nulliparous and multiparous women with singleton pregnancies
Compared total caesarean deliveries, including emergency or elective
Studies done in developed countries only
6/11
Abbreviations: AMSTAR, Assessment of Multiple Systematic Reviews.
In the meta-analysis by Bayrampour and Heaman, (22) 21 RCTs contributed to the comparison of maternal age 35 years or older with maternal age 34 years and younger. The relative risk for caesarean delivery in nulliparous women 35 years of age and older compared with those 34 years of age and younger was 1.44 to 2.27 (I 2= 91%), estimated from 12 studies (random effects model) and a total sample size of 561,352 women. In 25,598 older multiparas women, the relative risk for caesarean delivery was 1.63 to 2.78 (I2 = 94%). Due to high heterogeneity in both estimates, a pooled effect estimate was not reported. Most studies in the analysis reported the total caesarean delivery rate, which included both emergency and elective deliveries. Fifteen of the 21 studies adjusted for potential confounders, including sociodemographic factors (race/ethnicity, education, parity, and marital status), smoking, maternal height, assisted conception, duration of labour, induced labour, fetal distress, epidural anesthesia, and physician and hospital factors. Each study controlled for different confounder variables; prepregnancy body mass, gestational age, birth weight, history of chronic disease, and pregnancy complications were the most frequently controlled.
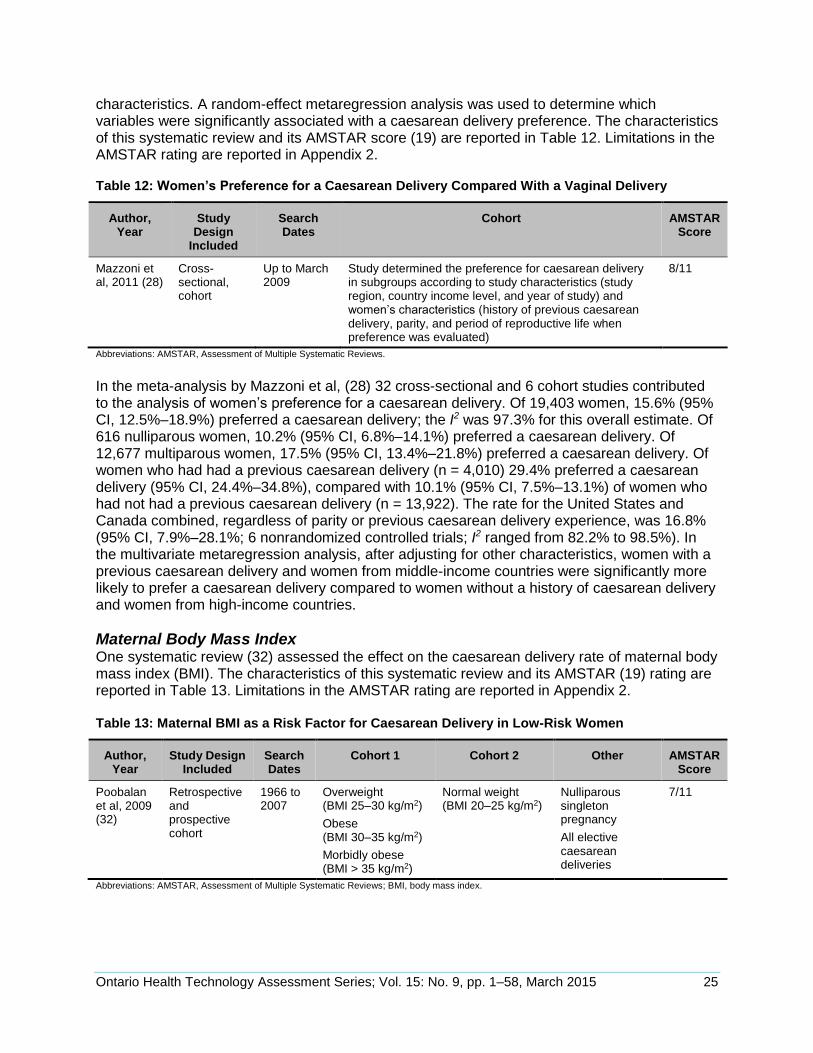
Women’s Preference for Caesarean Delivery One systematic review (28) assessed the effect of women’s preference for a caesarean delivery compared with vaginal delivery. This study also reported the proportion of women who preferred a caesarean delivery by subgroup according to study characteristics and women’s
Ontario Health Technology Assessment Series; Vol. 15: No. 9, pp. 1–58, March 2015 25
characteristics. A random-effect metaregression analysis was used to determine which variables were significantly associated with a caesarean delivery preference. The characteristics of this systematic review and its AMSTAR score (19) are reported in Table 12. Limitations in the AMSTAR rating are reported in Appendix 2. Table 12: Women’s Preference for a Caesarean Delivery Compared With a Vaginal Delivery
Author, Year
Study Design
Included
Search Dates
Cohort AMSTAR Score
Mazzoni et al, 2011 (28)
Cross-sectional, cohort
Up to March 2009
Study determined the preference for caesarean delivery in subgroups according to study characteristics (study region, country income level, and year of study) and women’s characteristics (history of previous caesarean delivery, parity, and period of reproductive life when preference was evaluated)
8/11
Abbreviations: AMSTAR, Assessment of Multiple Systematic Reviews.
In the meta-analysis by Mazzoni et al, (28) 32 cross-sectional and 6 cohort studies contributed to the analysis of women’s preference for a caesarean delivery. Of 19,403 women, 15.6% (95% CI, 12.5%–18.9%) preferred a caesarean delivery; the I2 was 97.3% for this overall estimate. Of 616 nulliparous women, 10.2% (95% CI, 6.8%–14.1%) preferred a caesarean delivery. Of 12,677 multiparous women, 17.5% (95% CI, 13.4%–21.8%) preferred a caesarean delivery. Of women who had had a previous caesarean delivery (n = 4,010) 29.4% preferred a caesarean delivery (95% CI, 24.4%–34.8%), compared with 10.1% (95% CI, 7.5%–13.1%) of women who had not had a previous caesarean delivery (n = 13,922). The rate for the United States and Canada combined, regardless of parity or previous caesarean delivery experience, was 16.8% (95% CI, 7.9%–28.1%; 6 nonrandomized controlled trials; I2 ranged from 82.2% to 98.5%). In the multivariate metaregression analysis, after adjusting for other characteristics, women with a previous caesarean delivery and women from middle-income countries were significantly more likely to prefer a caesarean delivery compared to women without a history of caesarean delivery and women from high-income countries.
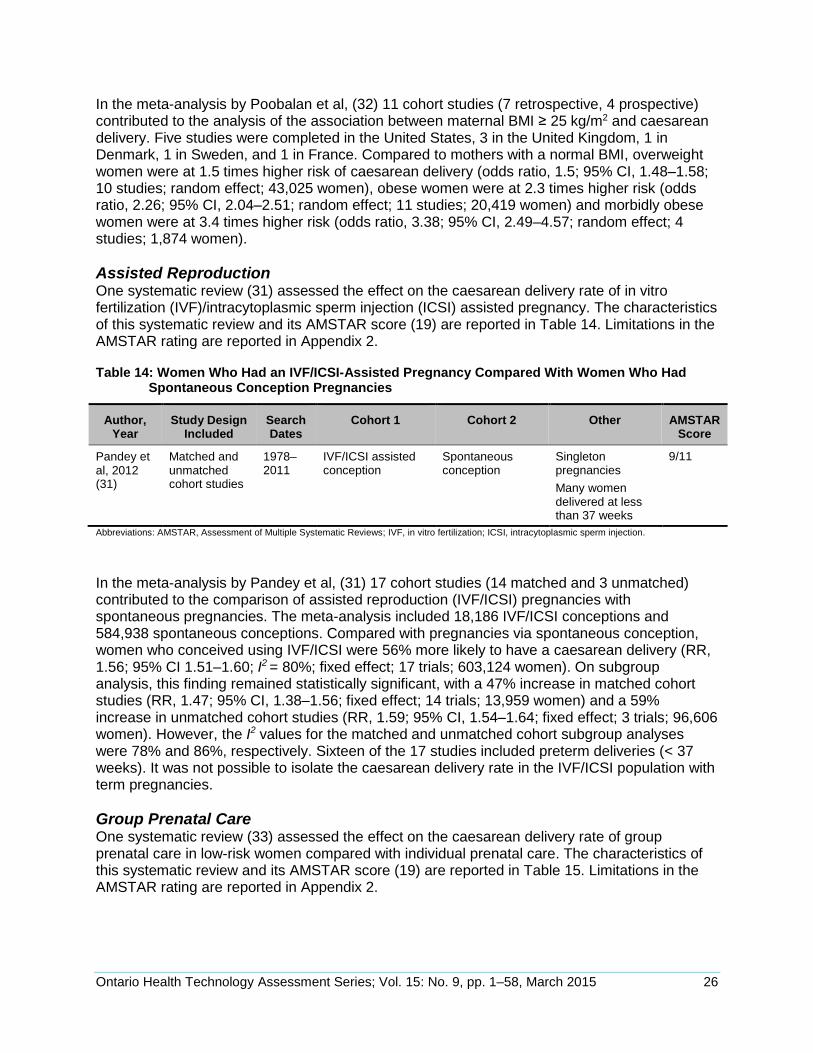
Maternal Body Mass Index One systematic review (32) assessed the effect on the caesarean delivery rate of maternal body mass index (BMI). The characteristics of this systematic review and its AMSTAR (19) rating are reported in Table 13. Limitations in the AMSTAR rating are reported in Appendix 2. Table 13: Maternal BMI as a Risk Factor for Caesarean Delivery in Low-Risk Women
Author, Year
Study Design Included
Search Dates
Cohort 1 Cohort 2 Other AMSTAR Score
Poobalan et al, 2009 (32)
Retrospective and prospective cohort
1966 to 2007
Overweight (BMI 25–30 kg/m2)
Obese (BMI 30–35 kg/m2)
Morbidly obese (BMI > 35 kg/m2)
Normal weight (BMI 20–25 kg/m2)
Nulliparous singleton pregnancy
All elective caesarean deliveries
7/11
Abbreviations: AMSTAR, Assessment of Multiple Systematic Reviews; BMI, body mass index.
Ontario Health Technology Assessment Series; Vol. 15: No. 9, pp. 1–58, March 2015 26
In the meta-analysis by Poobalan et al, (32) 11 cohort studies (7 retrospective, 4 prospective) contributed to the analysis of the association between maternal BMI ≥ 25 kg/m2 and caesarean delivery. Five studies were completed in the United States, 3 in the United Kingdom, 1 in Denmark, 1 in Sweden, and 1 in France. Compared to mothers with a normal BMI, overweight women were at 1.5 times higher risk of caesarean delivery (odds ratio, 1.5; 95% CI, 1.48–1.58; 10 studies; random effect; 43,025 women), obese women were at 2.3 times higher risk (odds ratio, 2.26; 95% CI, 2.04–2.51; random effect; 11 studies; 20,419 women) and morbidly obese women were at 3.4 times higher risk (odds ratio, 3.38; 95% CI, 2.49–4.57; random effect; 4 studies; 1,874 women).
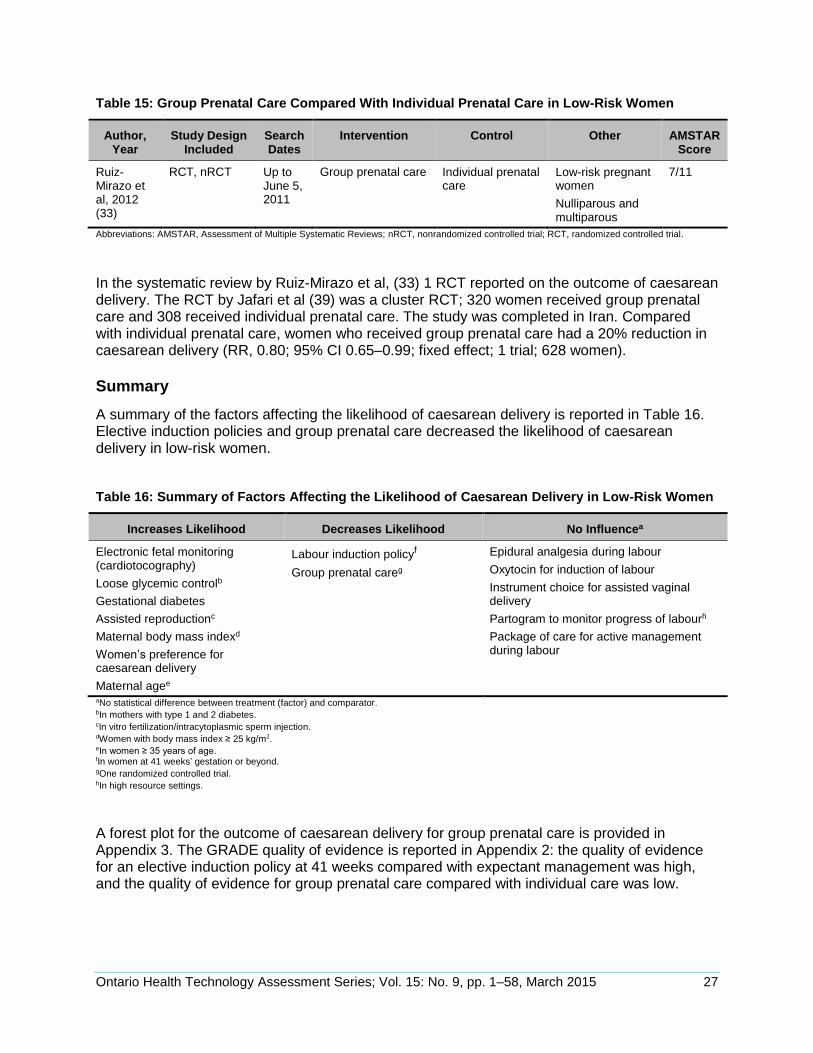
Assisted Reproduction One systematic review (31) assessed the effect on the caesarean delivery rate of in vitro fertilization (IVF)/intracytoplasmic sperm injection (ICSI) assisted pregnancy. The characteristics of this systematic review and its AMSTAR score (19) are reported in Table 14. Limitations in the AMSTAR rating are reported in Appendix 2. Table 14: Women Who Had an IVF/ICSI-Assisted Pregnancy Compared With Women Who Had
Spontaneous Conception Pregnancies
Author, Year
Study Design Included
Search Dates
Cohort 1 Cohort 2 Other AMSTAR Score
Pandey et al, 2012 (31)
Matched and unmatched cohort studies
1978–2011
IVF/ICSI assisted conception
Spontaneous conception
Singleton pregnancies
Many women delivered at less than 37 weeks
9/11
Abbreviations: AMSTAR, Assessment of Multiple Systematic Reviews; IVF, in vitro fertilization; ICSI, intracytoplasmic sperm injection.
In the meta-analysis by Pandey et al, (31) 17 cohort studies (14 matched and 3 unmatched) contributed to the comparison of assisted reproduction (IVF/ICSI) pregnancies with spontaneous pregnancies. The meta-analysis included 18,186 IVF/ICSI conceptions and 584,938 spontaneous conceptions. Compared with pregnancies via spontaneous conception, women who conceived using IVF/ICSI were 56% more likely to have a caesarean delivery (RR, 1.56; 95% CI 1.51–1.60; I2 = 80%; fixed effect; 17 trials; 603,124 women). On subgroup analysis, this finding remained statistically significant, with a 47% increase in matched cohort studies (RR, 1.47; 95% CI, 1.38–1.56; fixed effect; 14 trials; 13,959 women) and a 59% increase in unmatched cohort studies (RR, 1.59; 95% CI, 1.54–1.64; fixed effect; 3 trials; 96,606 women). However, the I2 values for the matched and unmatched cohort subgroup analyses were 78% and 86%, respectively. Sixteen of the 17 studies included preterm deliveries (< 37 weeks). It was not possible to isolate the caesarean delivery rate in the IVF/ICSI population with term pregnancies.
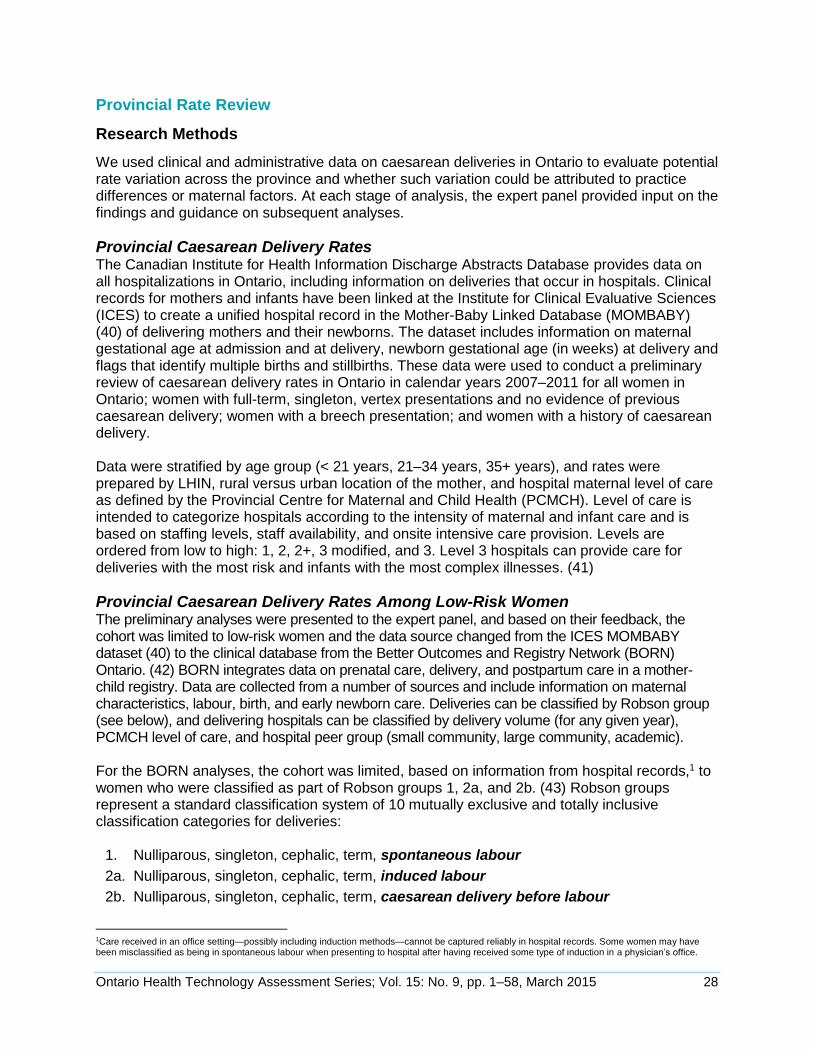
Group Prenatal Care One systematic review (33) assessed the effect on the caesarean delivery rate of group prenatal care in low-risk women compared with individual prenatal care. The characteristics of this systematic review and its AMSTAR score (19) are reported in Table 15. Limitations in the AMSTAR rating are reported in Appendix 2.
Ontario Health Technology Assessment Series; Vol. 15: No. 9, pp. 1–58, March 2015 27
Table 15: Group Prenatal Care Compared With Individual Prenatal Care in Low-Risk Women
Author, Year
Study Design Included
Search Dates
Intervention Control Other AMSTAR Score
Ruiz-Mirazo et al, 2012 (33)
RCT, nRCT Up to June 5, 2011
Group prenatal care Individual prenatal care
Low-risk pregnant women
Nulliparous and multiparous
7/11
Abbreviations: AMSTAR, Assessment of Multiple Systematic Reviews; nRCT, nonrandomized controlled trial; RCT, randomized controlled trial.
In the systematic review by Ruiz-Mirazo et al, (33) 1 RCT reported on the outcome of caesarean delivery. The RCT by Jafari et al (39) was a cluster RCT; 320 women received group prenatal care and 308 received individual prenatal care. The study was completed in Iran. Compared with individual prenatal care, women who received group prenatal care had a 20% reduction in caesarean delivery (RR, 0.80; 95% CI 0.65–0.99; fixed effect; 1 trial; 628 women).
Summary
A summary of the factors affecting the likelihood of caesarean delivery is reported in Table 16. Elective induction policies and group prenatal care decreased the likelihood of caesarean delivery in low-risk women.
Table 16: Summary of Factors Affecting the Likelihood of Caesarean Delivery in Low-Risk Women
Increases Likelihood Decreases Likelihood No Influencea
Electronic fetal monitoring (cardiotocography)
Loose glycemic controlb
Gestational diabetes
Assisted reproductionc
Maternal body mass indexd
Women’s preference for caesarean delivery
Maternal agee
Labour induction policyf
Group prenatal careg
Epidural analgesia during labour
Oxytocin for induction of labour
Instrument choice for assisted vaginal delivery
Partogram to monitor progress of labourh
Package of care for active management during labour
aNo statistical difference between treatment (factor) and comparator. bIn mothers with type 1 and 2 diabetes.
cIn vitro fertilization/intracytoplasmic sperm injection. dWomen with body mass index ≥ 25 kg/m2. eIn women ≥ 35 years of age. fIn women at 41 weeks’ gestation or beyond. gOne randomized controlled trial. hIn high resource settings.
A forest plot for the outcome of caesarean delivery for group prenatal care is provided in Appendix 3. The GRADE quality of evidence is reported in Appendix 2: the quality of evidence for an elective induction policy at 41 weeks compared with expectant management was high, and the quality of evidence for group prenatal care compared with individual care was low.
Ontario Health Technology Assessment Series; Vol. 15: No. 9, pp. 1–58, March 2015 28
Provincial Rate Review
Research Methods
We used clinical and administrative data on caesarean deliveries in Ontario to evaluate potential rate variation across the province and whether such variation could be attributed to practice differences or maternal factors. At each stage of analysis, the expert panel provided input on the findings and guidance on subsequent analyses.
Provincial Caesarean Delivery Rates The Canadian Institute for Health Information Discharge Abstracts Database provides data on all hospitalizations in Ontario, including information on deliveries that occur in hospitals. Clinical records for mothers and infants have been linked at the Institute for Clinical Evaluative Sciences (ICES) to create a unified hospital record in the Mother-Baby Linked Database (MOMBABY) (40) of delivering mothers and their newborns. The dataset includes information on maternal gestational age at admission and at delivery, newborn gestational age (in weeks) at delivery and flags that identify multiple births and stillbirths. These data were used to conduct a preliminary review of caesarean delivery rates in Ontario in calendar years 2007–2011 for all women in Ontario; women with full-term, singleton, vertex presentations and no evidence of previous caesarean delivery; women with a breech presentation; and women with a history of caesarean delivery. Data were stratified by age group (< 21 years, 21–34 years, 35+ years), and rates were prepared by LHIN, rural versus urban location of the mother, and hospital maternal level of care as defined by the Provincial Centre for Maternal and Child Health (PCMCH). Level of care is intended to categorize hospitals according to the intensity of maternal and infant care and is based on staffing levels, staff availability, and onsite intensive care provision. Levels are ordered from low to high: 1, 2, 2+, 3 modified, and 3. Level 3 hospitals can provide care for deliveries with the most risk and infants with the most complex illnesses. (41)
Provincial Caesarean Delivery Rates Among Low-Risk Women The preliminary analyses were presented to the expert panel, and based on their feedback, the cohort was limited to low-risk women and the data source changed from the ICES MOMBABY dataset (40) to the clinical database from the Better Outcomes and Registry Network (BORN) Ontario. (42) BORN integrates data on prenatal care, delivery, and postpartum care in a mother-child registry. Data are collected from a number of sources and include information on maternal characteristics, labour, birth, and early newborn care. Deliveries can be classified by Robson group (see below), and delivering hospitals can be classified by delivery volume (for any given year), PCMCH level of care, and hospital peer group (small community, large community, academic). For the BORN analyses, the cohort was limited, based on information from hospital records,1 to women who were classified as part of Robson groups 1, 2a, and 2b. (43) Robson groups represent a standard classification system of 10 mutually exclusive and totally inclusive classification categories for deliveries:
1. Nulliparous, singleton, cephalic, term, spontaneous labour
2a. Nulliparous, singleton, cephalic, term, induced labour
2b. Nulliparous, singleton, cephalic, term, caesarean delivery before labour
1Care received in an office setting—possibly including induction methods—cannot be captured reliably in hospital records. Some women may have been misclassified as being in spontaneous labour when presenting to hospital after having received some type of induction in a physician’s office.
Ontario Health Technology Assessment Series; Vol. 15: No. 9, pp. 1–58, March 2015 29
Caesarean delivery rates for 5 fiscal years were prepared by Robson group and reported by fiscal year (2007/2008 to 2011/2012) at the provincial and LHIN levels. Rates were also compared across a set of maternal characteristics (maternal age, neighbourhood income quintile, neighbourhood educational attainment, rural/urban status, and primary language).
Provincial Caesarean Delivery Rates Among a Very-Low-Risk Subgroup of Women Based on the findings of the second set of analyses, the expert panel recommended a follow-up analysis. Caesarean delivery rates in a further refined subgroup of women were compared at the provincial, LHIN, and hospital levels. Five years of cumulative data (fiscal years 2007/2008 to 2011/2012) on caesarean delivery rates among women who delivered in hospital were prepared for a more homogeneous group of women:
Robson 1, 2a, and 2b
aged 20 to 34 years
no maternal medical problems
no obstetrical complications
Women with the following indications for caesarean delivery were excluded: cord prolapse, diabetes, fetal anomaly, placental abruption, placenta previa, pre-eclampsia, other fetal health problem, other maternal health problem. The objective of creating a very low-risk cohort was to eliminate a number of indications for caesarean delivery, thereby reducing or limiting potential clinical reasons for variation in rates. The following 5 indications for caesarean delivery were not incorporated as cohort exclusions: failure of descent/progress (dystocia); intrauterine growth restriction or small for gestational age; large for gestational age; non-reassuring fetal status; and premature rupture of membranes. Rates were prepared by LHIN; hospital PCMCH level of care (1, 2, 2+, modified 3, 3); hospital birth volume in 2011/2012 (≤ 100, 101–250, 251–500, 501–1,000, 1,001–2,499, 2,500–4,000, >4,000); and by hospital, with rates grouped by PCMCH level of care and birth volume.
Results of Provincial Rate Review
Provincial Caesarean Delivery Rates
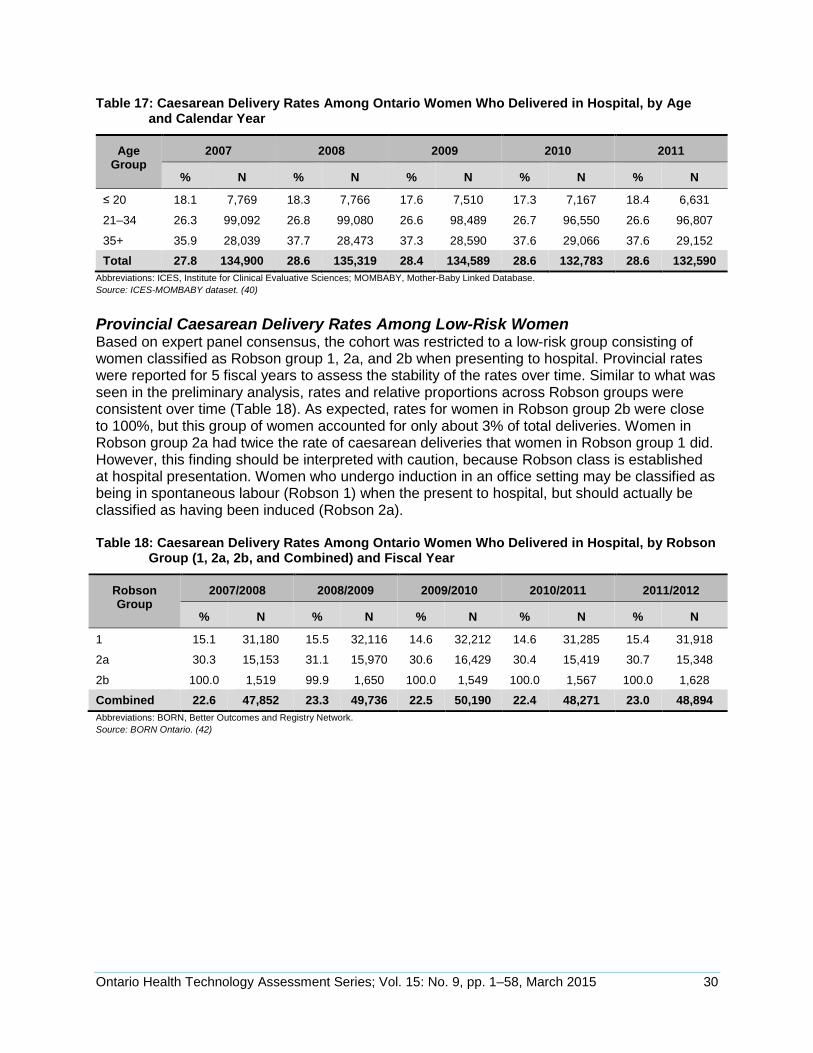
Caesarean delivery rates in Ontario for all women who deliver in hospital were stable over time for the overall population and within age strata. Rates were lowest in women under age 20; women aged 35 and older had approximately twice the caesarean delivery rate as the youngest age group. The overall provincial caesarean delivery rate for 2007 to 2011 hovered around 28% (Table 17). The expert panel felt there was little evidence of clinically important variation in caesarean delivery rates by LHIN or over time.
Ontario Health Technology Assessment Series; Vol. 15: No. 9, pp. 1–58, March 2015 30
Table 17: Caesarean Delivery Rates Among Ontario Women Who Delivered in Hospital, by Age and Calendar Year
Age Group
2007 2008 2009 2010 2011
% N % N % N % N % N
≤ 20 18.1 7,769 18.3 7,766 17.6 7,510 17.3 7,167 18.4 6,631
21–34 26.3 99,092 26.8 99,080 26.6 98,489 26.7 96,550 26.6 96,807
35+ 35.9 28,039 37.7 28,473 37.3 28,590 37.6 29,066 37.6 29,152
Total 27.8 134,900 28.6 135,319 28.4 134,589 28.6 132,783 28.6 132,590
Abbreviations: ICES, Institute for Clinical Evaluative Sciences; MOMBABY, Mother-Baby Linked Database.
Source: ICES-MOMBABY dataset. (40)
Provincial Caesarean Delivery Rates Among Low-Risk Women Based on expert panel consensus, the cohort was restricted to a low-risk group consisting of women classified as Robson group 1, 2a, and 2b when presenting to hospital. Provincial rates were reported for 5 fiscal years to assess the stability of the rates over time. Similar to what was seen in the preliminary analysis, rates and relative proportions across Robson groups were consistent over time (Table 18). As expected, rates for women in Robson group 2b were close to 100%, but this group of women accounted for only about 3% of total deliveries. Women in Robson group 2a had twice the rate of caesarean deliveries that women in Robson group 1 did. However, this finding should be interpreted with caution, because Robson class is established at hospital presentation. Women who undergo induction in an office setting may be classified as being in spontaneous labour (Robson 1) when the present to hospital, but should actually be classified as having been induced (Robson 2a). Table 18: Caesarean Delivery Rates Among Ontario Women Who Delivered in Hospital, by Robson
Group (1, 2a, 2b, and Combined) and Fiscal Year
Robson Group
2007/2008 2008/2009 2009/2010 2010/2011 2011/2012
% N % N % N % N % N
1 15.1 31,180 15.5 32,116 14.6 32,212 14.6 31,285 15.4 31,918
2a 30.3 15,153 31.1 15,970 30.6 16,429 30.4 15,419 30.7 15,348
2b 100.0 1,519 99.9 1,650 100.0 1,549 100.0 1,567 100.0 1,628
Combined 22.6 47,852 23.3 49,736 22.5 50,190 22.4 48,271 23.0 48,894
Abbreviations: BORN, Better Outcomes and Registry Network.
Source: BORN Ontario. (42)
Ontario Health Technology Assessment Series; Vol. 15: No. 9, pp. 1–58, March 2015 31
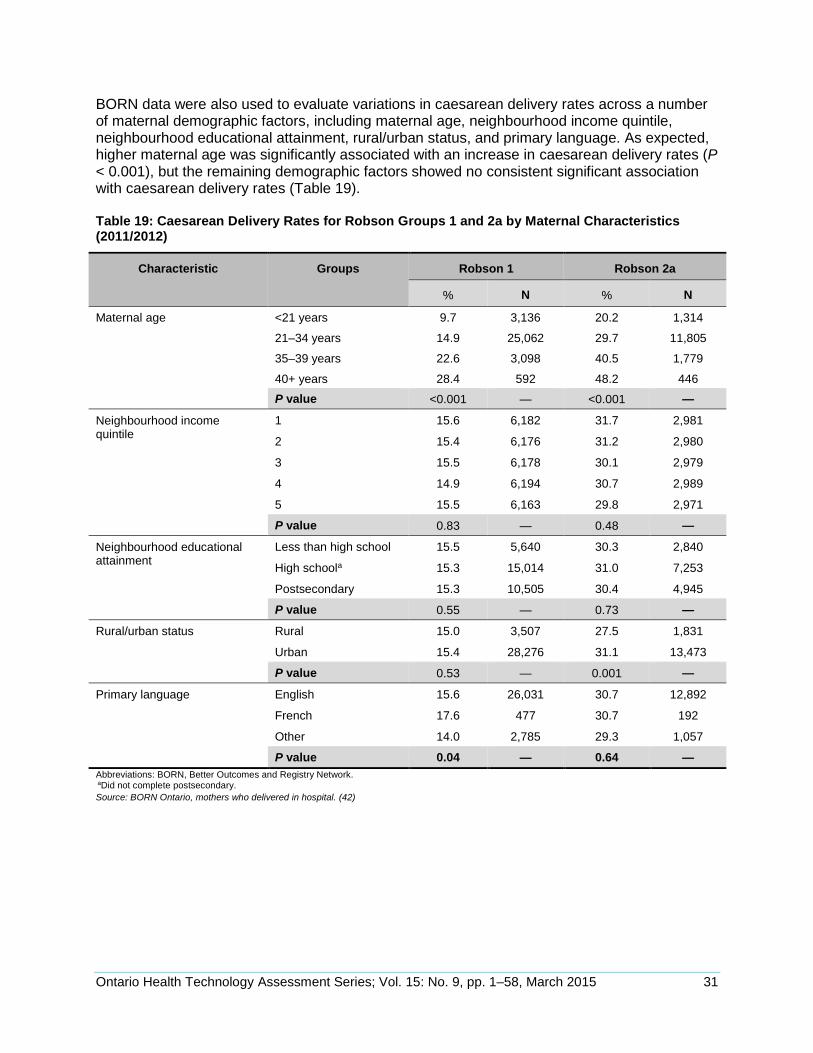
BORN data were also used to evaluate variations in caesarean delivery rates across a number of maternal demographic factors, including maternal age, neighbourhood income quintile, neighbourhood educational attainment, rural/urban status, and primary language. As expected, higher maternal age was significantly associated with an increase in caesarean delivery rates (P < 0.001), but the remaining demographic factors showed no consistent significant association with caesarean delivery rates (Table 19). Table 19: Caesarean Delivery Rates for Robson Groups 1 and 2a by Maternal Characteristics (2011/2012)
Characteristic Groups Robson 1 Robson 2a
% N % N
Maternal age <21 years 9.7 3,136 20.2 1,314
21–34 years 14.9 25,062 29.7 11,805
35–39 years 22.6 3,098 40.5 1,779
40+ years 28.4 592 48.2 446
P value <0.001 — <0.001 —
Neighbourhood income quintile
1 15.6 6,182 31.7 2,981
2 15.4 6,176 31.2 2,980
3 15.5 6,178 30.1 2,979
4 14.9 6,194 30.7 2,989
5 15.5 6,163 29.8 2,971
P value 0.83 — 0.48 —
Neighbourhood educational attainment
Less than high school 15.5 5,640 30.3 2,840
High schoola 15.3 15,014 31.0 7,253
Postsecondary 15.3 10,505 30.4 4,945
P value 0.55 — 0.73 —
Rural/urban status Rural 15.0 3,507 27.5 1,831
Urban 15.4 28,276 31.1 13,473
P value 0.53 — 0.001 —
Primary language English 15.6 26,031 30.7 12,892
French 17.6 477 30.7 192
Other 14.0 2,785 29.3 1,057
P value 0.04 — 0.64 —
Abbreviations: BORN, Better Outcomes and Registry Network. aDid not complete postsecondary.
Source: BORN Ontario, mothers who delivered in hospital. (42)
Ontario Health Technology Assessment Series; Vol. 15: No. 9, pp. 1–58, March 2015 32
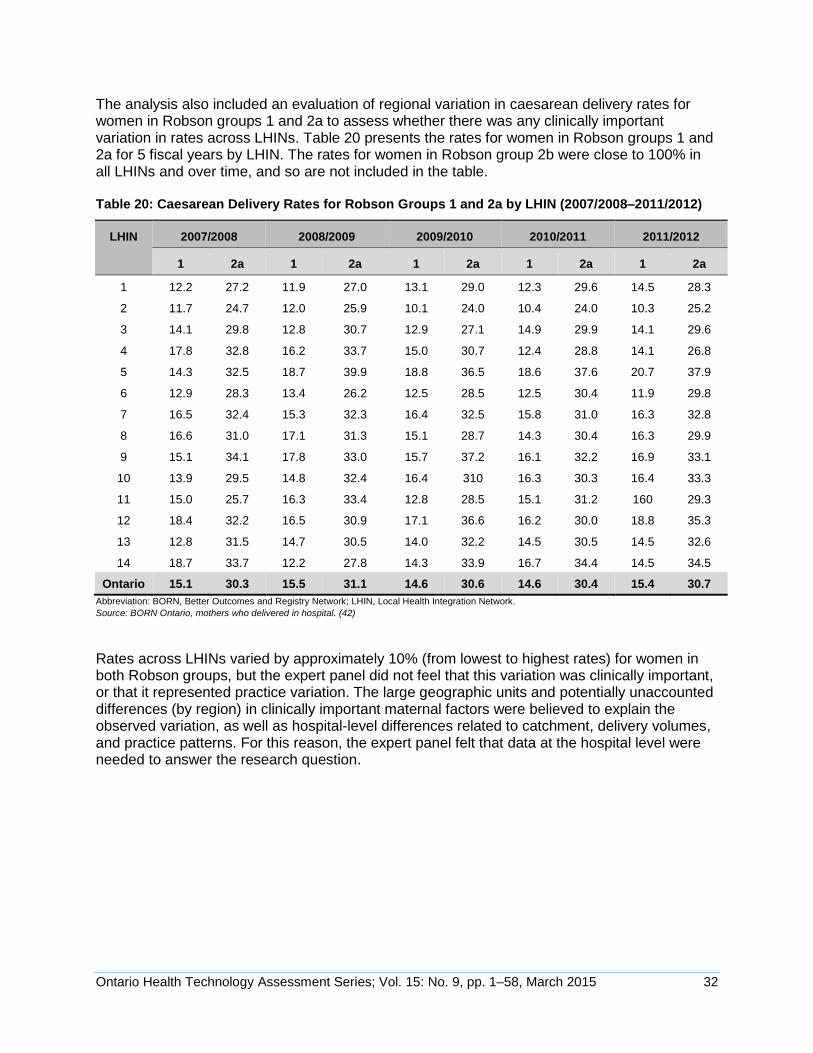
The analysis also included an evaluation of regional variation in caesarean delivery rates for women in Robson groups 1 and 2a to assess whether there was any clinically important variation in rates across LHINs. Table 20 presents the rates for women in Robson groups 1 and 2a for 5 fiscal years by LHIN. The rates for women in Robson group 2b were close to 100% in all LHINs and over time, and so are not included in the table. Table 20: Caesarean Delivery Rates for Robson Groups 1 and 2a by LHIN (2007/2008–2011/2012)
LHIN 2007/2008 2008/2009 2009/2010 2010/2011 2011/2012
1 2a 1 2a 1 2a 1 2a 1 2a
1 12.2 27.2 11.9 27.0 13.1 29.0 12.3 29.6 14.5 28.3
2 11.7 24.7 12.0 25.9 10.1 24.0 10.4 24.0 10.3 25.2
3 14.1 29.8 12.8 30.7 12.9 27.1 14.9 29.9 14.1 29.6
4 17.8 32.8 16.2 33.7 15.0 30.7 12.4 28.8 14.1 26.8
5 14.3 32.5 18.7 39.9 18.8 36.5 18.6 37.6 20.7 37.9
6 12.9 28.3 13.4 26.2 12.5 28.5 12.5 30.4 11.9 29.8
7 16.5 32.4 15.3 32.3 16.4 32.5 15.8 31.0 16.3 32.8
8 16.6 31.0 17.1 31.3 15.1 28.7 14.3 30.4 16.3 29.9
9 15.1 34.1 17.8 33.0 15.7 37.2 16.1 32.2 16.9 33.1
10 13.9 29.5 14.8 32.4 16.4 310 16.3 30.3 16.4 33.3
11 15.0 25.7 16.3 33.4 12.8 28.5 15.1 31.2 160 29.3
12 18.4 32.2 16.5 30.9 17.1 36.6 16.2 30.0 18.8 35.3
13 12.8 31.5 14.7 30.5 14.0 32.2 14.5 30.5 14.5 32.6
14 18.7 33.7 12.2 27.8 14.3 33.9 16.7 34.4 14.5 34.5
Ontario 15.1 30.3 15.5 31.1 14.6 30.6 14.6 30.4 15.4 30.7
Abbreviation: BORN, Better Outcomes and Registry Network; LHIN, Local Health Integration Network.
Source: BORN Ontario, mothers who delivered in hospital. (42)
Rates across LHINs varied by approximately 10% (from lowest to highest rates) for women in both Robson groups, but the expert panel did not feel that this variation was clinically important, or that it represented practice variation. The large geographic units and potentially unaccounted differences (by region) in clinically important maternal factors were believed to explain the observed variation, as well as hospital-level differences related to catchment, delivery volumes, and practice patterns. For this reason, the expert panel felt that data at the hospital level were needed to answer the research question.
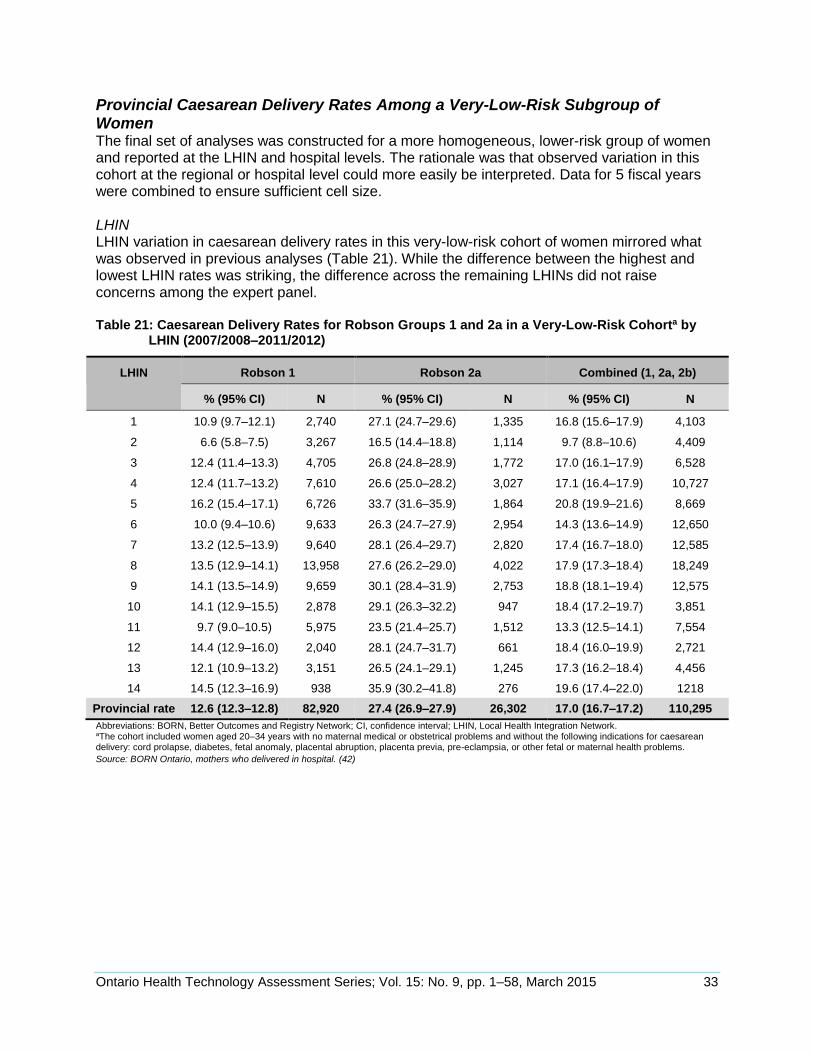
Ontario Health Technology Assessment Series; Vol. 15: No. 9, pp. 1–58, March 2015 33
Provincial Caesarean Delivery Rates Among a Very-Low-Risk Subgroup of Women The final set of analyses was constructed for a more homogeneous, lower-risk group of women and reported at the LHIN and hospital levels. The rationale was that observed variation in this cohort at the regional or hospital level could more easily be interpreted. Data for 5 fiscal years were combined to ensure sufficient cell size. LHIN LHIN variation in caesarean delivery rates in this very-low-risk cohort of women mirrored what was observed in previous analyses (Table 21). While the difference between the highest and lowest LHIN rates was striking, the difference across the remaining LHINs did not raise concerns among the expert panel. Table 21: Caesarean Delivery Rates for Robson Groups 1 and 2a in a Very-Low-Risk Cohorta by
LHIN (2007/2008–2011/2012)
LHIN Robson 1 Robson 2a Combined (1, 2a, 2b)
% (95% CI) N % (95% CI) N % (95% CI) N
1 10.9 (9.7–12.1) 2,740 27.1 (24.7–29.6) 1,335 16.8 (15.6–17.9) 4,103
2 6.6 (5.8–7.5) 3,267 16.5 (14.4–18.8) 1,114 9.7 (8.8–10.6) 4,409
3 12.4 (11.4–13.3) 4,705 26.8 (24.8–28.9) 1,772 17.0 (16.1–17.9) 6,528
4 12.4 (11.7–13.2) 7,610 26.6 (25.0–28.2) 3,027 17.1 (16.4–17.9) 10,727
5 16.2 (15.4–17.1) 6,726 33.7 (31.6–35.9) 1,864 20.8 (19.9–21.6) 8,669
6 10.0 (9.4–10.6) 9,633 26.3 (24.7–27.9) 2,954 14.3 (13.6–14.9) 12,650
7 13.2 (12.5–13.9) 9,640 28.1 (26.4–29.7) 2,820 17.4 (16.7–18.0) 12,585
8 13.5 (12.9–14.1) 13,958 27.6 (26.2–29.0) 4,022 17.9 (17.3–18.4) 18,249
9 14.1 (13.5–14.9) 9,659 30.1 (28.4–31.9) 2,753 18.8 (18.1–19.4) 12,575
10 14.1 (12.9–15.5) 2,878 29.1 (26.3–32.2) 947 18.4 (17.2–19.7) 3,851
11 9.7 (9.0–10.5) 5,975 23.5 (21.4–25.7) 1,512 13.3 (12.5–14.1) 7,554
12 14.4 (12.9–16.0) 2,040 28.1 (24.7–31.7) 661 18.4 (16.0–19.9) 2,721
13 12.1 (10.9–13.2) 3,151 26.5 (24.1–29.1) 1,245 17.3 (16.2–18.4) 4,456
14 14.5 (12.3–16.9) 938 35.9 (30.2–41.8) 276 19.6 (17.4–22.0) 1218
Provincial rate 12.6 (12.3–12.8) 82,920 27.4 (26.9–27.9) 26,302 17.0 (16.7–17.2) 110,295
Abbreviations: BORN, Better Outcomes and Registry Network; CI, confidence interval; LHIN, Local Health Integration Network. aThe cohort included women aged 20–34 years with no maternal medical or obstetrical problems and without the following indications for caesarean delivery: cord prolapse, diabetes, fetal anomaly, placental abruption, placenta previa, pre-eclampsia, or other fetal or maternal health problems.
Source: BORN Ontario, mothers who delivered in hospital. (42)
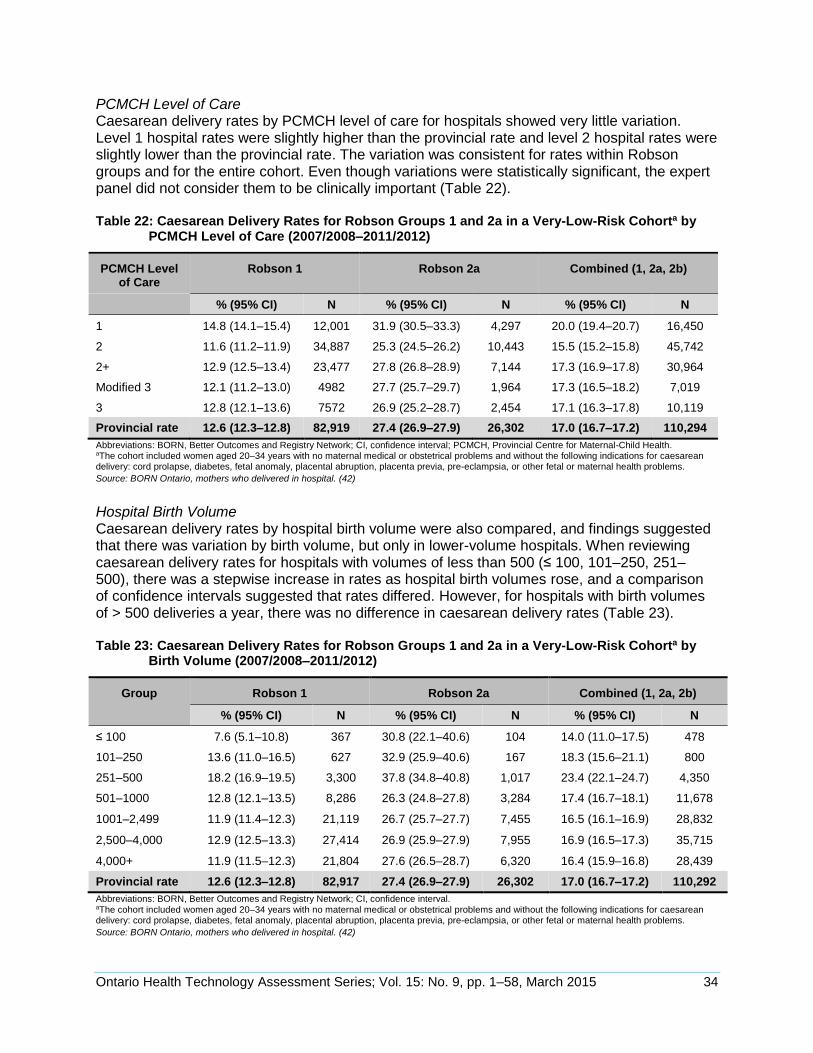
Ontario Health Technology Assessment Series; Vol. 15: No. 9, pp. 1–58, March 2015 34
PCMCH Level of Care Caesarean delivery rates by PCMCH level of care for hospitals showed very little variation. Level 1 hospital rates were slightly higher than the provincial rate and level 2 hospital rates were slightly lower than the provincial rate. The variation was consistent for rates within Robson groups and for the entire cohort. Even though variations were statistically significant, the expert panel did not consider them to be clinically important (Table 22). Table 22: Caesarean Delivery Rates for Robson Groups 1 and 2a in a Very-Low-Risk Cohorta by
PCMCH Level of Care (2007/2008–2011/2012)
PCMCH Level of Care
Robson 1 Robson 2a Combined (1, 2a, 2b)
% (95% CI) N % (95% CI) N % (95% CI) N
1 14.8 (14.1–15.4) 12,001 31.9 (30.5–33.3) 4,297 20.0 (19.4–20.7) 16,450
2 11.6 (11.2–11.9) 34,887 25.3 (24.5–26.2) 10,443 15.5 (15.2–15.8) 45,742
2+ 12.9 (12.5–13.4) 23,477 27.8 (26.8–28.9) 7,144 17.3 (16.9–17.8) 30,964
Modified 3 12.1 (11.2–13.0) 4982 27.7 (25.7–29.7) 1,964 17.3 (16.5–18.2) 7,019
3 12.8 (12.1–13.6) 7572 26.9 (25.2–28.7) 2,454 17.1 (16.3–17.8) 10,119
Provincial rate 12.6 (12.3–12.8) 82,919 27.4 (26.9–27.9) 26,302 17.0 (16.7–17.2) 110,294
Abbreviations: BORN, Better Outcomes and Registry Network; CI, confidence interval; PCMCH, Provincial Centre for Maternal-Child Health. aThe cohort included women aged 20–34 years with no maternal medical or obstetrical problems and without the following indications for caesarean delivery: cord prolapse, diabetes, fetal anomaly, placental abruption, placenta previa, pre-eclampsia, or other fetal or maternal health problems.
Source: BORN Ontario, mothers who delivered in hospital. (42)
Hospital Birth Volume Caesarean delivery rates by hospital birth volume were also compared, and findings suggested that there was variation by birth volume, but only in lower-volume hospitals. When reviewing caesarean delivery rates for hospitals with volumes of less than 500 (≤ 100, 101–250, 251–500), there was a stepwise increase in rates as hospital birth volumes rose, and a comparison of confidence intervals suggested that rates differed. However, for hospitals with birth volumes of > 500 deliveries a year, there was no difference in caesarean delivery rates (Table 23). Table 23: Caesarean Delivery Rates for Robson Groups 1 and 2a in a Very-Low-Risk Cohorta by
Birth Volume (2007/2008–2011/2012)
Group Robson 1 Robson 2a Combined (1, 2a, 2b)
% (95% CI) N % (95% CI) N % (95% CI) N
≤ 100 7.6 (5.1–10.8) 367 30.8 (22.1–40.6) 104 14.0 (11.0–17.5) 478
101–250 13.6 (11.0–16.5) 627 32.9 (25.9–40.6) 167 18.3 (15.6–21.1) 800
251–500 18.2 (16.9–19.5) 3,300 37.8 (34.8–40.8) 1,017 23.4 (22.1–24.7) 4,350
501–1000 12.8 (12.1–13.5) 8,286 26.3 (24.8–27.8) 3,284 17.4 (16.7–18.1) 11,678
1001–2,499 11.9 (11.4–12.3) 21,119 26.7 (25.7–27.7) 7,455 16.5 (16.1–16.9) 28,832
2,500–4,000 12.9 (12.5–13.3) 27,414 26.9 (25.9–27.9) 7,955 16.9 (16.5–17.3) 35,715
4,000+ 11.9 (11.5–12.3) 21,804 27.6 (26.5–28.7) 6,320 16.4 (15.9–16.8) 28,439
Provincial rate 12.6 (12.3–12.8) 82,917 27.4 (26.9–27.9) 26,302 17.0 (16.7–17.2) 110,292
Abbreviations: BORN, Better Outcomes and Registry Network; CI, confidence interval. aThe cohort included women aged 20–34 years with no maternal medical or obstetrical problems and without the following indications for caesarean delivery: cord prolapse, diabetes, fetal anomaly, placental abruption, placenta previa, pre-eclampsia, or other fetal or maternal health problems.
Source: BORN Ontario, mothers who delivered in hospital. (42)
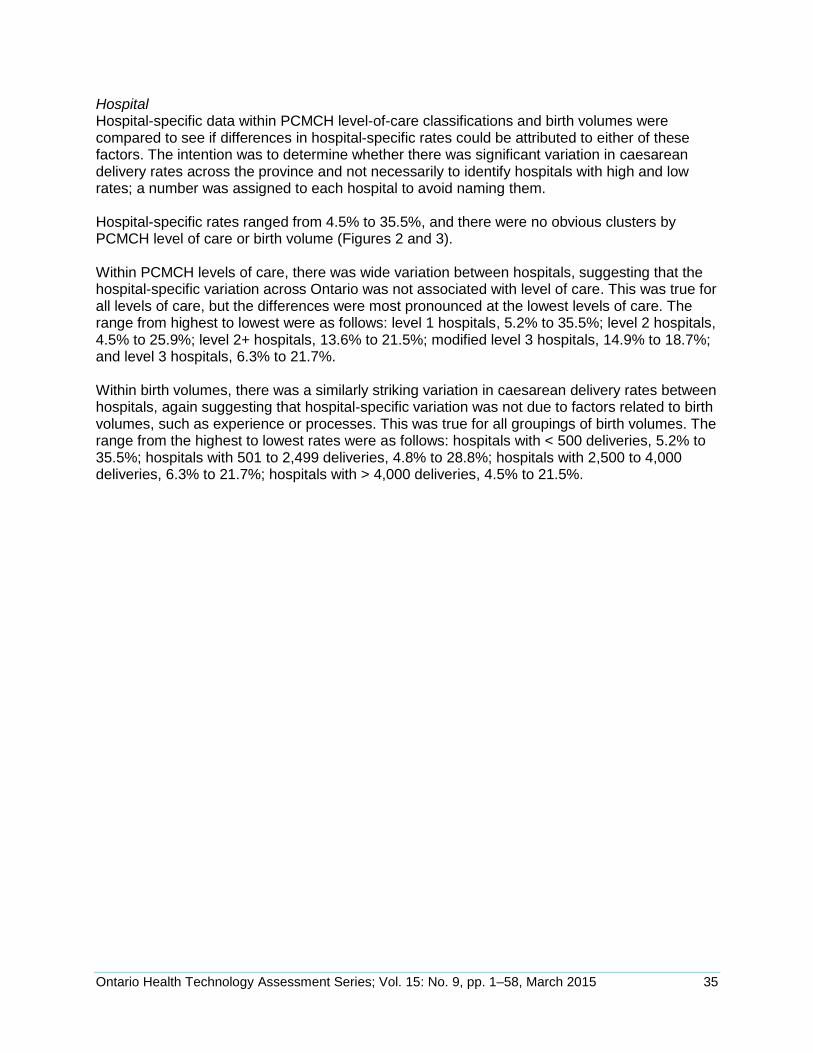
Ontario Health Technology Assessment Series; Vol. 15: No. 9, pp. 1–58, March 2015 35
Hospital Hospital-specific data within PCMCH level-of-care classifications and birth volumes were compared to see if differences in hospital-specific rates could be attributed to either of these factors. The intention was to determine whether there was significant variation in caesarean delivery rates across the province and not necessarily to identify hospitals with high and low rates; a number was assigned to each hospital to avoid naming them. Hospital-specific rates ranged from 4.5% to 35.5%, and there were no obvious clusters by PCMCH level of care or birth volume (Figures 2 and 3). Within PCMCH levels of care, there was wide variation between hospitals, suggesting that the hospital-specific variation across Ontario was not associated with level of care. This was true for all levels of care, but the differences were most pronounced at the lowest levels of care. The range from highest to lowest were as follows: level 1 hospitals, 5.2% to 35.5%; level 2 hospitals, 4.5% to 25.9%; level 2+ hospitals, 13.6% to 21.5%; modified level 3 hospitals, 14.9% to 18.7%; and level 3 hospitals, 6.3% to 21.7%. Within birth volumes, there was a similarly striking variation in caesarean delivery rates between hospitals, again suggesting that hospital-specific variation was not due to factors related to birth volumes, such as experience or processes. This was true for all groupings of birth volumes. The range from the highest to lowest rates were as follows: hospitals with < 500 deliveries, 5.2% to 35.5%; hospitals with 501 to 2,499 deliveries, 4.8% to 28.8%; hospitals with 2,500 to 4,000 deliveries, 6.3% to 21.7%; hospitals with > 4,000 deliveries, 4.5% to 21.5%.
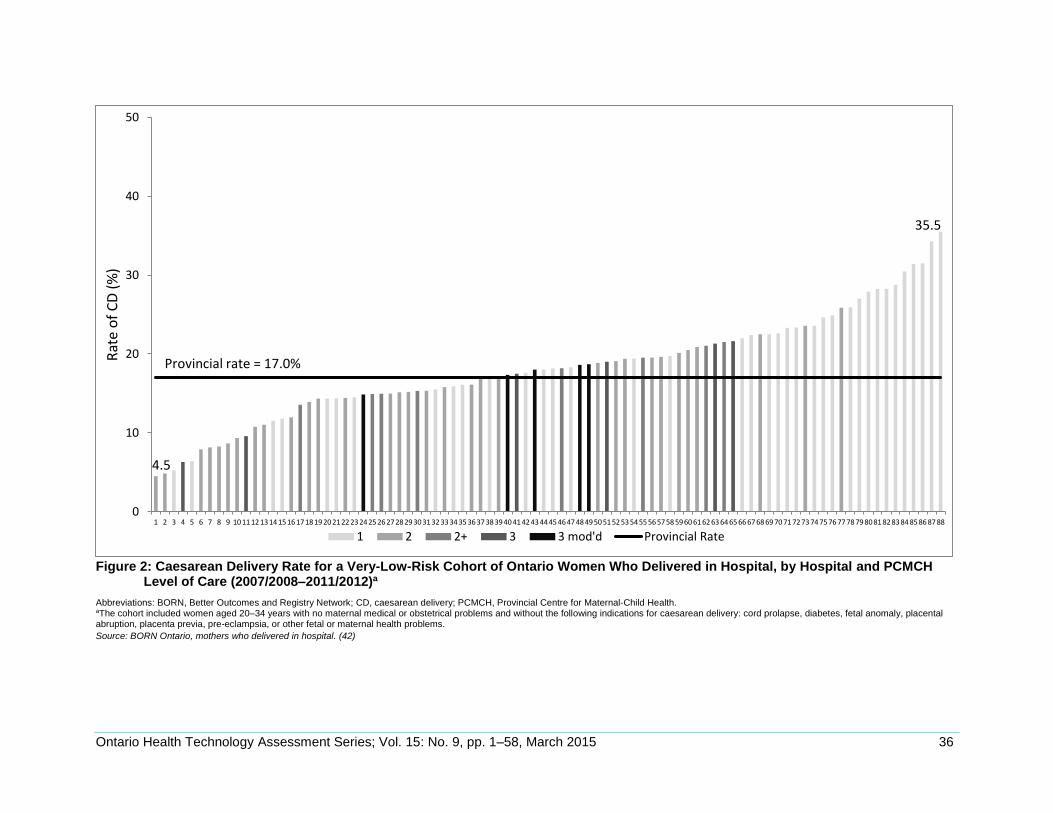
Ontario Health Technology Assessment Series; Vol. 15: No. 9, pp. 1–58, March 2015 36
Figure 2: Caesarean Delivery Rate for a Very-Low-Risk Cohort of Ontario Women Who Delivered in Hospital, by Hospital and PCMCH Level of Care (2007/2008–2011/2012)a
Abbreviations: BORN, Better Outcomes and Registry Network; CD, caesarean delivery; PCMCH, Provincial Centre for Maternal-Child Health. aThe cohort included women aged 20–34 years with no maternal medical or obstetrical problems and without the following indications for caesarean delivery: cord prolapse, diabetes, fetal anomaly, placental abruption, placenta previa, pre-eclampsia, or other fetal or maternal health problems.
Source: BORN Ontario, mothers who delivered in hospital. (42)
0
10
20
30
40
50
1 2 3 4 5 6 7 8 9 10 11 12 13 14 15 16 17 18 19 20 21 22 23 24 25 26 27 28 29 30 31 32 33 34 35 36 37 38 39 40 41 42 43 44 45 46 47 48 49 50 51 52 53 54 55 56 57 58 59 60 61 62 63 64 65 66 67 68 69 70 71 72 73 74 75 76 77 78 79 80 81 82 83 84 85 86 87 88
Rat
e o
f C
D (
%)
1 2 2+ 3 3 mod'd Provincial Rate
Provincial rate = 17.0%
4.5
35.5
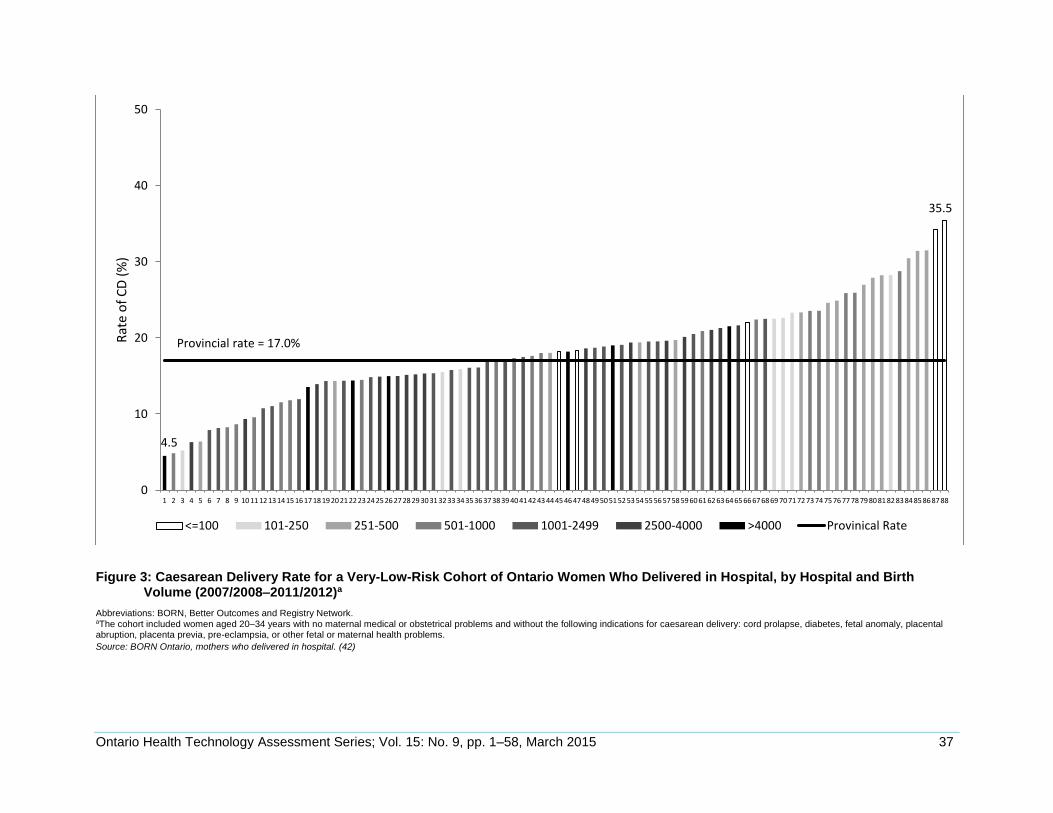
Ontario Health Technology Assessment Series; Vol. 15: No. 9, pp. 1–58, March 2015 37
Figure 3: Caesarean Delivery Rate for a Very-Low-Risk Cohort of Ontario Women Who Delivered in Hospital, by Hospital and Birth Volume (2007/2008–2011/2012)a
Abbreviations: BORN, Better Outcomes and Registry Network. aThe cohort included women aged 20–34 years with no maternal medical or obstetrical problems and without the following indications for caesarean delivery: cord prolapse, diabetes, fetal anomaly, placental abruption, placenta previa, pre-eclampsia, or other fetal or maternal health problems.
Source: BORN Ontario, mothers who delivered in hospital. (42)
0
10
20
30
40
50
1 2 3 4 5 6 7 8 9 10 11 12 1314 15 16 17 18 19 20 21 2223 24 25 26 27 28 29 30 3132 33 34 35 36 37 38 39 40 4142 43 44 45 46 47 48 49 5051 52 53 54 55 56 57 58 5960 61 62 63 64 65 66 67 6869 70 71 72 73 74 75 76 77 78 79 80 81 82 83 84 85 86 87 88
Rat
e o
f C
D (
%)
<=100 101-250 251-500 501-1000 1001-2499 2500-4000 >4000 Provinical Rate
4.5
35.5
Provincial rate = 17.0%
Ontario Health Technology Assessment Series; Vol. 15: No. 9, pp. 1–58, March 2015 38
Panel Recommendations
After considering the evidence, the Expert Advisory Panel on Rate Variation in Caesarean Sections Across Ontario proposed the following recommendations for the consideration of the Ontario Health Technology Advisory Committee (OHTAC):
1. Health Quality Ontario, along with key partners, ought to develop and standardize a provincial elective induction policy for low-risk women.
2. The province should adopt a provincial standard in the caesarean delivery rate for low-risk women equal to a 20% relative decrease in the current provincial rate of 17.0%.
3. Data from the BORN registry ought to be available to hospitals for audit and quality-improvement initiatives to achieve the planned provincial standard rate for caesarean delivery in low-risk populations.
4. BORN, along with PCMCH, ought to provide audit and feedback to hospitals regarding their low-risk obstetrical population to support quality improvement in maternal-infant care.
5. LHINs ought to establish perinatal networks to support the management of labour and delivery in low-risk populations.
6. As part of its public reporting function, Health Quality Ontario ought to report annually on key performance indicators, including caesarean delivery and induction rates in low-risk women.
Ontario Health Technology Assessment Series; Vol. 15: No. 9, pp. 1–58, March 2015 39
CONCLUSIONS
Nine factors were significantly associated with either an increased or decreased likelihood of having a caesarean delivery, and 5 factors had no influence. Moderate-quality evidence supported the finding that in a low-risk population, an elective induction policy would significantly reduce the rate of caesarean deliveries compared with a policy of expectant management.
The provincial caesarean delivery rate for a very-low-risk population was 17.0%. However, rates varied among Ontario hospitals (4.5% to 35.5%) and were independent of PCMCH level-of-care classifications or birth volumes (based on data for 2011/2012).
An evaluation of an Ontario administrative database suggested that variation in caesarean delivery rates may be due to maternal age and/or obstetrical practice variation. There was no clinically or statistically significant variation in rates associated with neighbourhood income quintile, neighbourhood educational attainment, rural or urban status, or primary language.
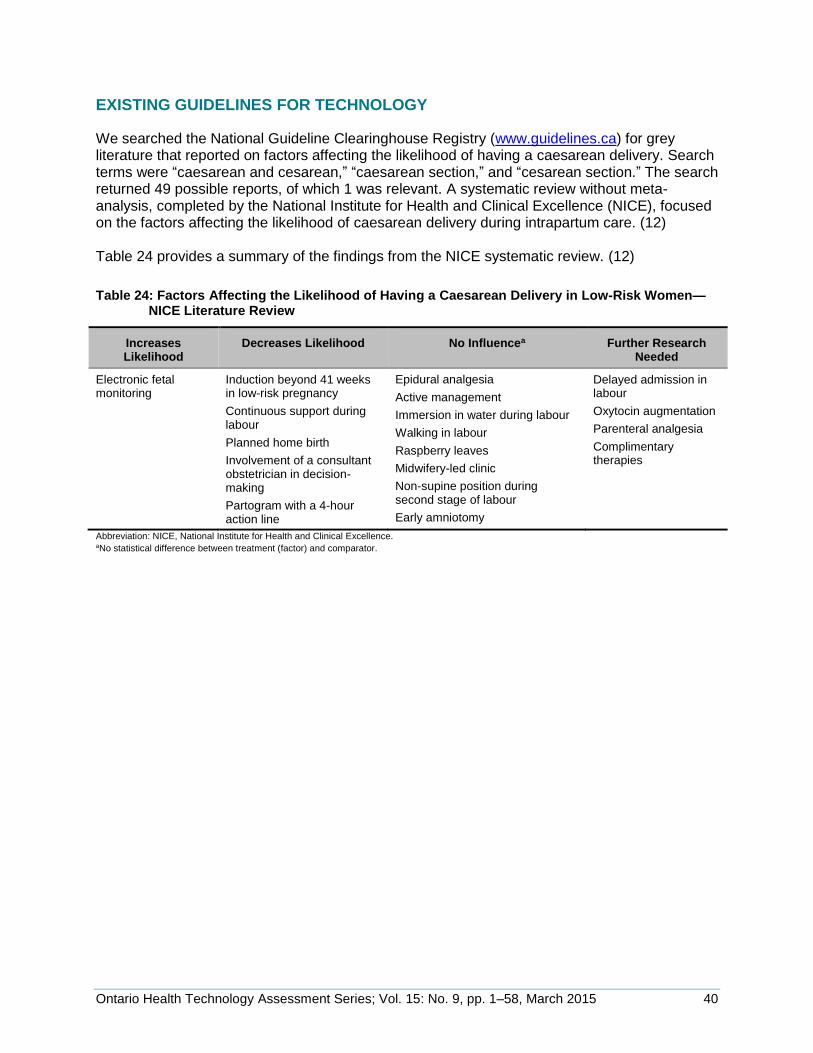
Ontario Health Technology Assessment Series; Vol. 15: No. 9, pp. 1–58, March 2015 40
EXISTING GUIDELINES FOR TECHNOLOGY
We searched the National Guideline Clearinghouse Registry (www.guidelines.ca) for grey literature that reported on factors affecting the likelihood of having a caesarean delivery. Search terms were “caesarean and cesarean,” “caesarean section,” and “cesarean section.” The search returned 49 possible reports, of which 1 was relevant. A systematic review without meta-analysis, completed by the National Institute for Health and Clinical Excellence (NICE), focused on the factors affecting the likelihood of caesarean delivery during intrapartum care. (12) Table 24 provides a summary of the findings from the NICE systematic review. (12)
Table 24: Factors Affecting the Likelihood of Having a Caesarean Delivery in Low-Risk Women—NICE Literature Review
Increases Likelihood
Decreases Likelihood No Influencea Further Research Needed
Electronic fetal monitoring
Induction beyond 41 weeks in low-risk pregnancy
Continuous support during labour
Planned home birth
Involvement of a consultant obstetrician in decision-making
Partogram with a 4-hour action line
Epidural analgesia
Active management
Immersion in water during labour
Walking in labour
Raspberry leaves
Midwifery-led clinic
Non-supine position during second stage of labour
Early amniotomy
Delayed admission in labour
Oxytocin augmentation
Parenteral analgesia
Complimentary therapies
Abbreviation: NICE, National Institute for Health and Clinical Excellence. aNo statistical difference between treatment (factor) and comparator.
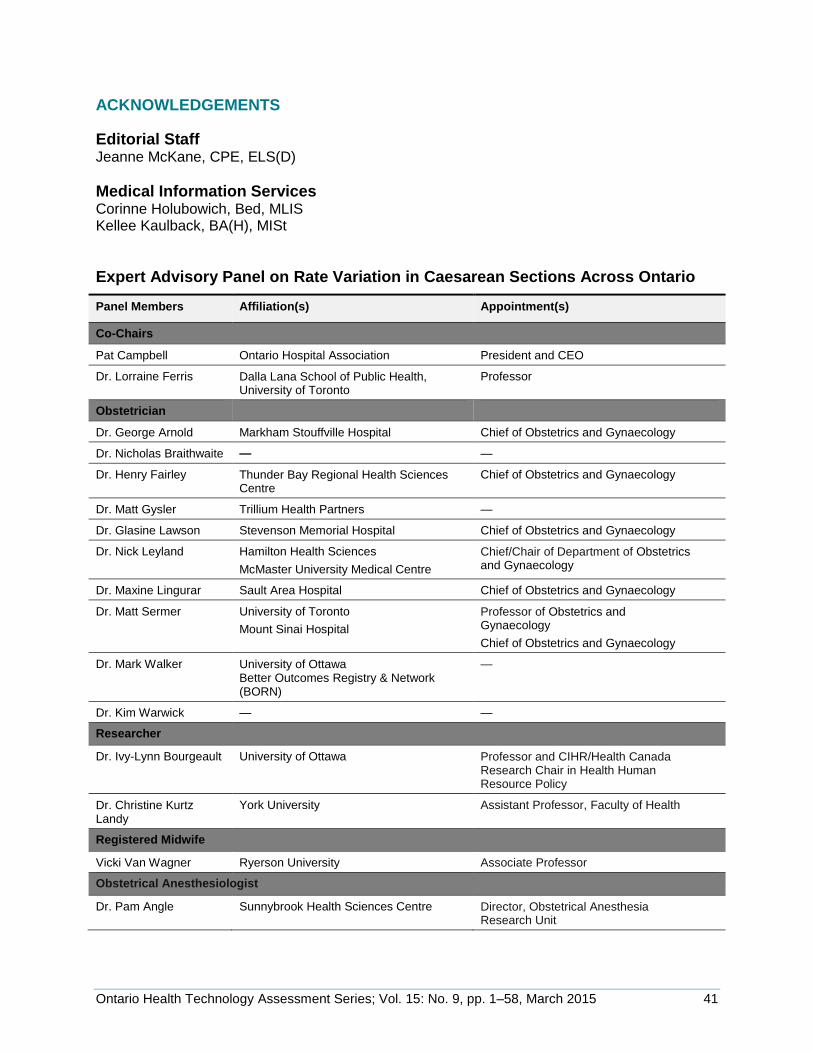
Ontario Health Technology Assessment Series; Vol. 15: No. 9, pp. 1–58, March 2015 41
ACKNOWLEDGEMENTS
Editorial Staff Jeanne McKane, CPE, ELS(D)
Medical Information Services Corinne Holubowich, Bed, MLIS Kellee Kaulback, BA(H), MISt
Expert Advisory Panel on Rate Variation in Caesarean Sections Across Ontario
Panel Members Affiliation(s) Appointment(s)
Co-Chairs
Pat Campbell Ontario Hospital Association President and CEO
Dr. Lorraine Ferris Dalla Lana School of Public Health, University of Toronto
Professor
Obstetrician
Dr. George Arnold Markham Stouffville Hospital Chief of Obstetrics and Gynaecology
Dr. Nicholas Braithwaite — —
Dr. Henry Fairley Thunder Bay Regional Health Sciences Centre
Chief of Obstetrics and Gynaecology
Dr. Matt Gysler Trillium Health Partners —
Dr. Glasine Lawson Stevenson Memorial Hospital Chief of Obstetrics and Gynaecology
Dr. Nick Leyland Hamilton Health Sciences
McMaster University Medical Centre
Chief/Chair of Department of Obstetrics and Gynaecology
Dr. Maxine Lingurar Sault Area Hospital Chief of Obstetrics and Gynaecology
Dr. Matt Sermer University of Toronto
Mount Sinai Hospital
Professor of Obstetrics and Gynaecology
Chief of Obstetrics and Gynaecology
Dr. Mark Walker University of Ottawa Better Outcomes Registry & Network (BORN)
—
Dr. Kim Warwick — —
Researcher
Dr. Ivy-Lynn Bourgeault University of Ottawa Professor and CIHR/Health Canada Research Chair in Health Human Resource Policy
Dr. Christine Kurtz Landy
York University Assistant Professor, Faculty of Health
Registered Midwife
Vicki Van Wagner Ryerson University Associate Professor
Obstetrical Anesthesiologist
Dr. Pam Angle Sunnybrook Health Sciences Centre Director, Obstetrical Anesthesia Research Unit
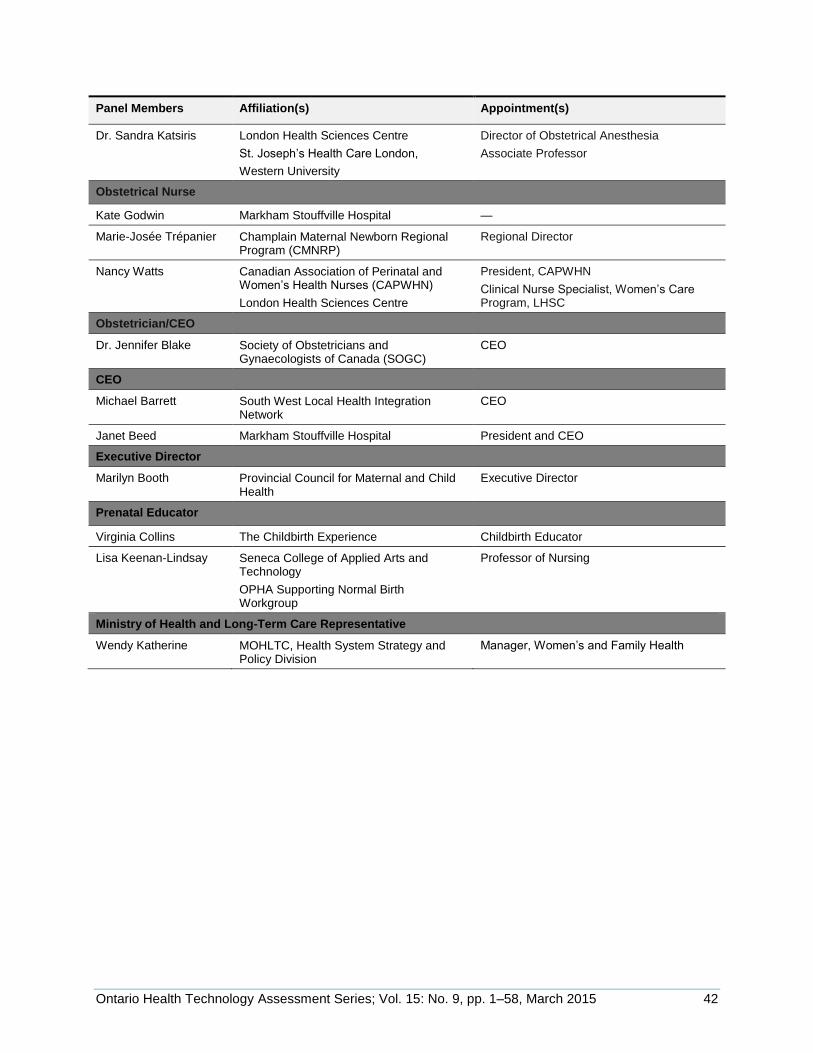
Ontario Health Technology Assessment Series; Vol. 15: No. 9, pp. 1–58, March 2015 42
Panel Members Affiliation(s) Appointment(s)
Dr. Sandra Katsiris London Health Sciences Centre
St. Joseph’s Health Care London,
Western University
Director of Obstetrical Anesthesia
Associate Professor
Obstetrical Nurse
Kate Godwin Markham Stouffville Hospital —
Marie-Josée Trépanier Champlain Maternal Newborn Regional Program (CMNRP)
Regional Director
Nancy Watts Canadian Association of Perinatal and Women’s Health Nurses (CAPWHN)
London Health Sciences Centre
President, CAPWHN
Clinical Nurse Specialist, Women’s Care Program, LHSC
Obstetrician/CEO
Dr. Jennifer Blake Society of Obstetricians and Gynaecologists of Canada (SOGC)
CEO
CEO
Michael Barrett South West Local Health Integration Network
CEO
Janet Beed Markham Stouffville Hospital President and CEO
Executive Director
Marilyn Booth Provincial Council for Maternal and Child Health
Executive Director
Prenatal Educator
Virginia Collins The Childbirth Experience Childbirth Educator
Lisa Keenan-Lindsay Seneca College of Applied Arts and Technology
OPHA Supporting Normal Birth Workgroup
Professor of Nursing
Ministry of Health and Long-Term Care Representative
Wendy Katherine MOHLTC, Health System Strategy and Policy Division
Manager, Women’s and Family Health

Ontario Health Technology Assessment Series; Vol. 15: No. 9, pp. 1–58, March 2015 43
APPENDICES
Appendix 1: Literature Search Strategies
Search date: February 4, 2013 Databases searched: OVID MEDLINE, MEDLINE In-Process and Other Non-Indexed Citations, EMBASE; CINAHL; Cochrane Library; CRD Q: What are the factors associated with Caesarean section procedures? Limits: 2008-current; English Filters: Case reports, editorials, letters, comments, conference abstracts Database: Ovid MEDLINE(R) <1946 to January Week 4 2013>, Ovid MEDLINE(R) In-Process & Other Non-Indexed Citations <February 1, 2013>, Embase <1980 to 2013 Week 05> Search Strategy:
# Searches Results
1 exp Cesarean Section/ 87437
2 (c?esarean section* or c?section* or c section* or abdominal deliver*).ti,ab. 68893
3 or/1-2 109225
4 exp Patient Satisfaction/ 131833
5 exp Consumer Satisfaction/ use mesz 71057
6 exp patient attitude/ use emez 224440
7 exp consumer attitude/ use emez 1040
8 exp Attitude to Health/ 340481
9 exp Decision Making/ 234421
10 exp "Health Services Needs and Demand"/ use mesz 43429
11 exp Motivation/ 180799
12 exp "Patient Acceptance of Health Care"/ use mesz 148557
13 ((prefer* or satisf* or request*) adj4 (Wom?n or patient* or matern* or mother*)).ti,ab. 147336
14 ((birth* or deliver* or c?esarean or c-section* or maternal) adj3 prefer*).ti,ab. 2875
15 exp risk factors/ use mesz or exp risk factor/ use emez 1059539
16 exp Unnecessary Procedures/ use mesz or exp unnecessary procedure/ use emez 4474
17 (risk* adj4 (factor* or relativ* or assess* or ratio*)).ti,ab. 963104
18 or/4-17 2555623
19 3 and 18 17683
20 Meta Analysis.pt. 36886
21 Meta Analysis/ use emez 68767
22 Systematic Review/ use emez 57104
23 exp Technology Assessment, Biomedical/ use mesz 8789
24 Biomedical Technology Assessment/ use emez 11437
25 (meta analy* or metaanaly* or pooled analysis or (systematic* adj2 review*) or published studies or published literature or medline or embase or data synthesis or data extraction or cochrane).ti,ab.
301403
26 ((health technolog* or biomedical technolog*) adj2 assess*).ti,ab. 3938
27 or/20-26 361998
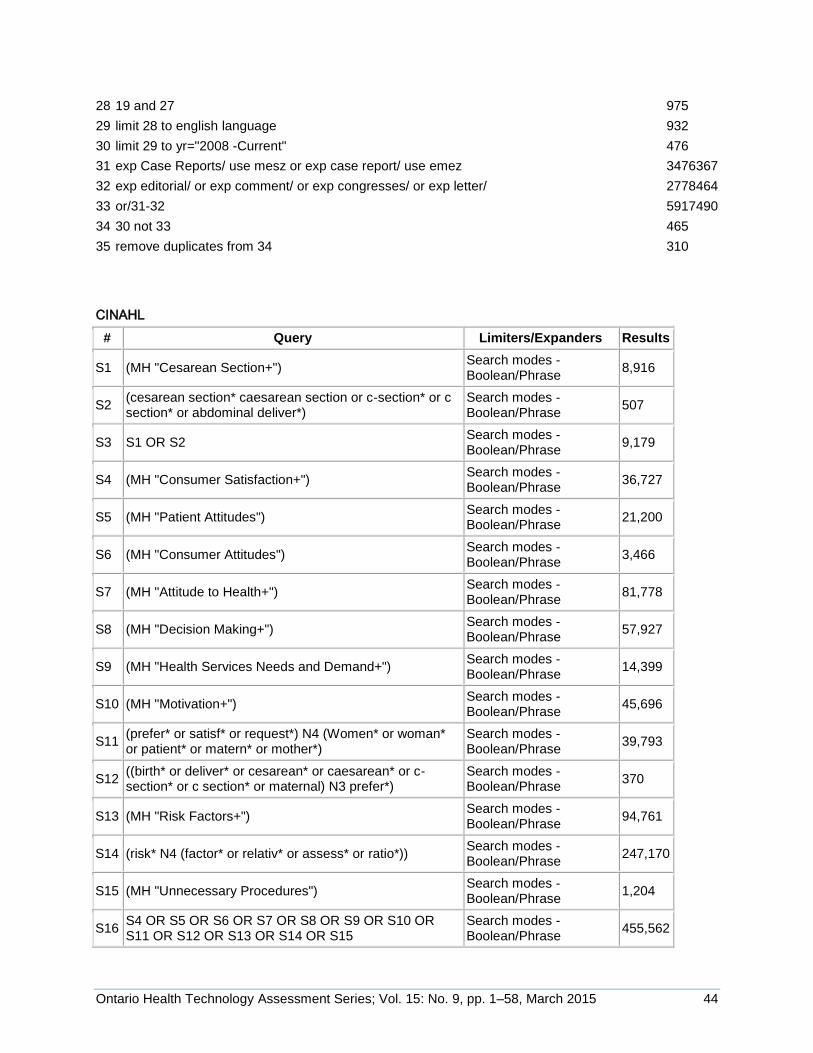
Ontario Health Technology Assessment Series; Vol. 15: No. 9, pp. 1–58, March 2015 44
28 19 and 27 975
29 limit 28 to english language 932
30 limit 29 to yr="2008 -Current" 476
31 exp Case Reports/ use mesz or exp case report/ use emez 3476367
32 exp editorial/ or exp comment/ or exp congresses/ or exp letter/ 2778464
33 or/31-32 5917490
34 30 not 33 465
35 remove duplicates from 34 310
CINAHL
# Query Limiters/Expanders Results
S1 (MH "Cesarean Section+") Search modes - Boolean/Phrase
8,916
S2 (cesarean section* caesarean section or c-section* or c section* or abdominal deliver*)
Search modes - Boolean/Phrase
507
S3 S1 OR S2 Search modes - Boolean/Phrase
9,179
S4 (MH "Consumer Satisfaction+") Search modes - Boolean/Phrase
36,727
S5 (MH "Patient Attitudes") Search modes - Boolean/Phrase
21,200
S6 (MH "Consumer Attitudes") Search modes - Boolean/Phrase
3,466
S7 (MH "Attitude to Health+") Search modes - Boolean/Phrase
81,778
S8 (MH "Decision Making+") Search modes - Boolean/Phrase
57,927
S9 (MH "Health Services Needs and Demand+") Search modes - Boolean/Phrase
14,399
S10 (MH "Motivation+") Search modes - Boolean/Phrase
45,696
S11 (prefer* or satisf* or request*) N4 (Women* or woman* or patient* or matern* or mother*)
Search modes - Boolean/Phrase
39,793
S12 ((birth* or deliver* or cesarean* or caesarean* or c-section* or c section* or maternal) N3 prefer*)
Search modes - Boolean/Phrase
370
S13 (MH "Risk Factors+") Search modes - Boolean/Phrase
94,761
S14 (risk* N4 (factor* or relativ* or assess* or ratio*)) Search modes - Boolean/Phrase
247,170
S15 (MH "Unnecessary Procedures") Search modes - Boolean/Phrase
1,204
S16 S4 OR S5 OR S6 OR S7 OR S8 OR S9 OR S10 OR S11 OR S12 OR S13 OR S14 OR S15
Search modes - Boolean/Phrase
455,562
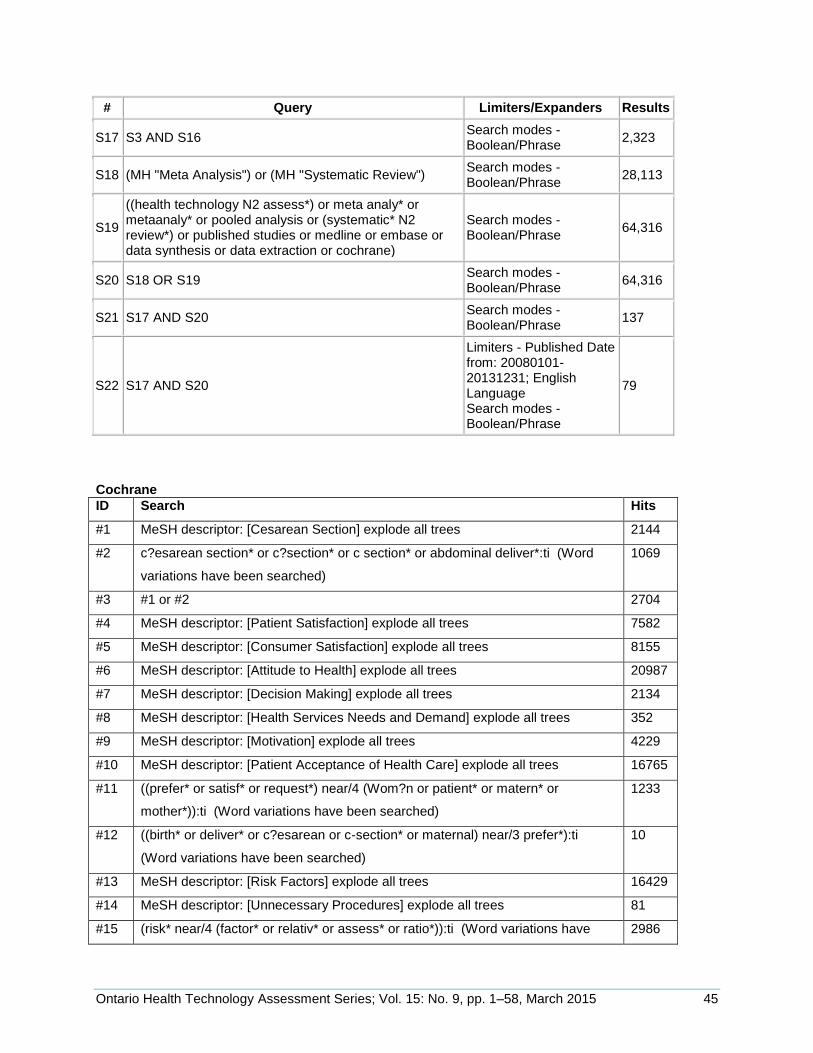
Ontario Health Technology Assessment Series; Vol. 15: No. 9, pp. 1–58, March 2015 45
# Query Limiters/Expanders Results
S17 S3 AND S16 Search modes - Boolean/Phrase
2,323
S18 (MH "Meta Analysis") or (MH "Systematic Review") Search modes - Boolean/Phrase
28,113
S19
((health technology N2 assess*) or meta analy* or metaanaly* or pooled analysis or (systematic* N2 review*) or published studies or medline or embase or data synthesis or data extraction or cochrane)
Search modes - Boolean/Phrase
64,316
S20 S18 OR S19 Search modes - Boolean/Phrase
64,316
S21 S17 AND S20 Search modes - Boolean/Phrase
137
S22 S17 AND S20
Limiters - Published Date from: 20080101-20131231; English Language Search modes - Boolean/Phrase
79
Cochrane
ID Search Hits
#1 MeSH descriptor: [Cesarean Section] explode all trees 2144
#2 c?esarean section* or c?section* or c section* or abdominal deliver*:ti (Word
variations have been searched)
1069
#3 #1 or #2 2704
#4 MeSH descriptor: [Patient Satisfaction] explode all trees 7582
#5 MeSH descriptor: [Consumer Satisfaction] explode all trees 8155
#6 MeSH descriptor: [Attitude to Health] explode all trees 20987
#7 MeSH descriptor: [Decision Making] explode all trees 2134
#8 MeSH descriptor: [Health Services Needs and Demand] explode all trees 352
#9 MeSH descriptor: [Motivation] explode all trees 4229
#10 MeSH descriptor: [Patient Acceptance of Health Care] explode all trees 16765
#11 ((prefer* or satisf* or request*) near/4 (Wom?n or patient* or matern* or
mother*)):ti (Word variations have been searched)
1233
#12 ((birth* or deliver* or c?esarean or c-section* or maternal) near/3 prefer*):ti
(Word variations have been searched)
10
#13 MeSH descriptor: [Risk Factors] explode all trees 16429
#14 MeSH descriptor: [Unnecessary Procedures] explode all trees 81
#15 (risk* near/4 (factor* or relativ* or assess* or ratio*)):ti (Word variations have 2986

Ontario Health Technology Assessment Series; Vol. 15: No. 9, pp. 1–58, March 2015 46
ID Search Hits
been searched)
#16 #4 or #5 or #6 or #7 or #8 or #9 or #10 or #11 or #12 or #13 or #14 or #15 43506
#17 #3 and #16 from 2008 to 2013 64
CRD Line Search Hits
1 MeSH DESCRIPTOR Cesarean Section EXPLODE ALL TREES 145
2 (c?esarean section* or c?section* or c section* or abdominal deliver*):TI 94
3 #1 OR #2 205
4 MeSH DESCRIPTOR Patient Satisfaction EXPLODE ALL TREES 623
5 MeSH DESCRIPTOR Consumer Satisfaction EXPLODE ALL TREES 645
6 MeSH DESCRIPTOR Attitude to Health EXPLODE ALL TREES 1524
7 MeSH DESCRIPTOR Decision Making EXPLODE ALL TREES 254
8 MeSH DESCRIPTOR Health Services Needs and Demand EXPLODE ALL TREES 92
9 MeSH DESCRIPTOR Motivation EXPLODE ALL TREES 110
10 MeSH DESCRIPTOR Patient Acceptance of Health Care EXPLODE ALL TREES 1217
11 ((prefer* or satisf* or request*) adj4 (Wom?n or patient* or matern* or mother*)):TI 6
12 ((birth* or deliver* or c?esarean or c-section* or maternal) adj3 prefer*):TI 0
13 MeSH DESCRIPTOR risk factors EXPLODE ALL TREES 2020
14 MeSH DESCRIPTOR unnecessary procedures EXPLODE ALL TREES 16
15 (risk* adj4 (factor* or relativ* or assess* or ratio*)):TI 159
16 #4 OR #5 OR #6 OR #7 OR #8 OR #9 OR #10 OR #11 OR #12 OR #13 OR #14 OR #15 3890
17 #3 AND #16 37
18 (#17):TI FROM 2008 TO 2013 13
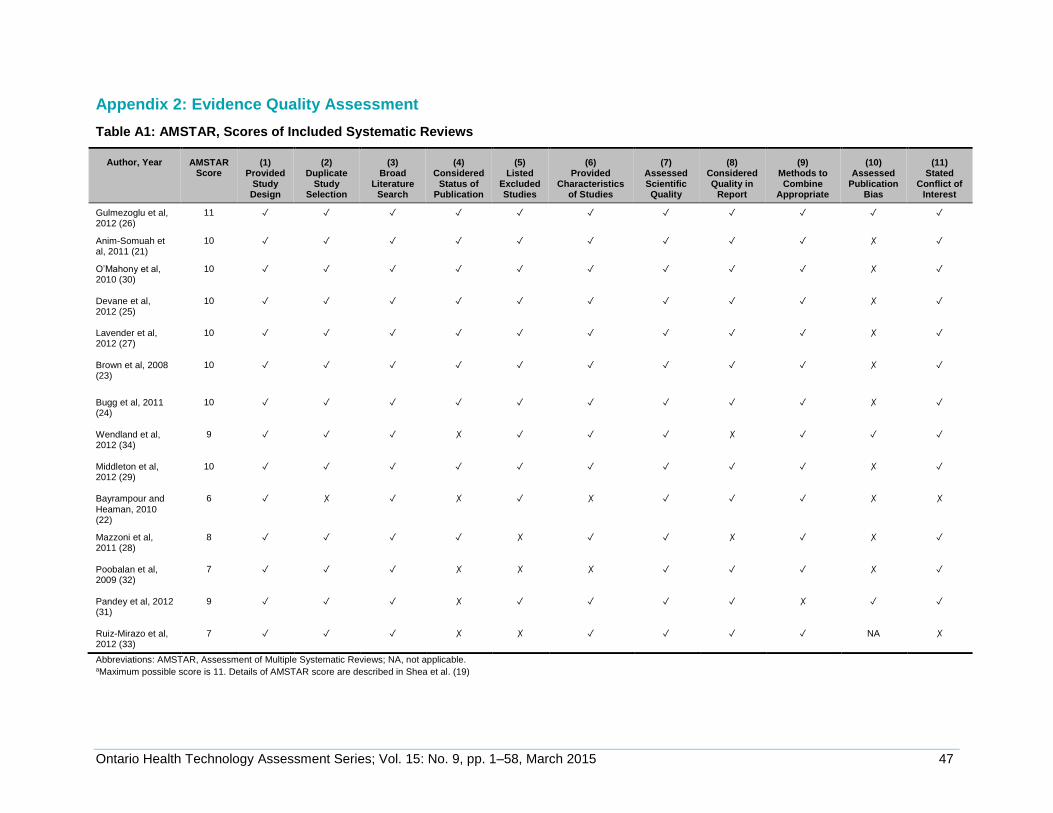
Ontario Health Technology Assessment Series; Vol. 15: No. 9, pp. 1–58, March 2015 47
Appendix 2: Evidence Quality Assessment
Table A1: AMSTAR, Scores of Included Systematic Reviews
Author, Year AMSTAR Score
(1) Provided
Study Design
(2) Duplicate
Study Selection
(3) Broad
Literature Search
(4) Considered
Status of Publication
(5) Listed
Excluded Studies
(6) Provided
Characteristics of Studies
(7) Assessed Scientific Quality
(8) Considered Quality in
Report
(9) Methods to Combine
Appropriate
(10) Assessed
Publication Bias
(11) Stated
Conflict of Interest
Gulmezoglu et al, 2012 (26)
11 ✓ ✓ ✓ ✓ ✓ ✓ ✓ ✓ ✓ ✓ ✓
Anim-Somuah et al, 2011 (21)
10 ✓ ✓ ✓ ✓ ✓ ✓ ✓ ✓ ✓ ✗ ✓
O’Mahony et al, 2010 (30)
10
✓ ✓ ✓ ✓ ✓ ✓ ✓ ✓ ✓ ✗ ✓
Devane et al, 2012 (25)
10
✓ ✓ ✓ ✓ ✓ ✓ ✓ ✓ ✓ ✗ ✓
Lavender et al, 2012 (27)
10
✓ ✓ ✓ ✓ ✓ ✓ ✓ ✓ ✓ ✗ ✓
Brown et al, 2008 (23)
10
✓ ✓ ✓ ✓ ✓ ✓ ✓ ✓ ✓ ✗ ✓
Bugg et al, 2011 (24)
10
✓ ✓ ✓ ✓ ✓ ✓ ✓ ✓ ✓ ✗ ✓
Wendland et al, 2012 (34)
9
✓ ✓ ✓ ✗ ✓ ✓ ✓ ✗ ✓ ✓ ✓
Middleton et al, 2012 (29)
10
✓ ✓ ✓ ✓ ✓ ✓ ✓ ✓ ✓ ✗ ✓
Bayrampour and Heaman, 2010 (22)
6
✓ ✗ ✓ ✗ ✓ ✗ ✓ ✓ ✓ ✗ ✗
Mazzoni et al, 2011 (28)
8
✓ ✓ ✓ ✓ ✗ ✓ ✓ ✗ ✓ ✗ ✓
Poobalan et al, 2009 (32)
7
✓ ✓ ✓ ✗ ✗ ✗ ✓ ✓ ✓ ✗ ✓
Pandey et al, 2012 (31)
9
✓ ✓ ✓ ✗ ✓ ✓ ✓ ✓ ✗ ✓ ✓
Ruiz-Mirazo et al, 2012 (33)
7 ✓ ✓ ✓ ✗ ✗ ✓ ✓ ✓ ✓ NA ✗
Abbreviations: AMSTAR, Assessment of Multiple Systematic Reviews; NA, not applicable. aMaximum possible score is 11. Details of AMSTAR score are described in Shea et al. (19)
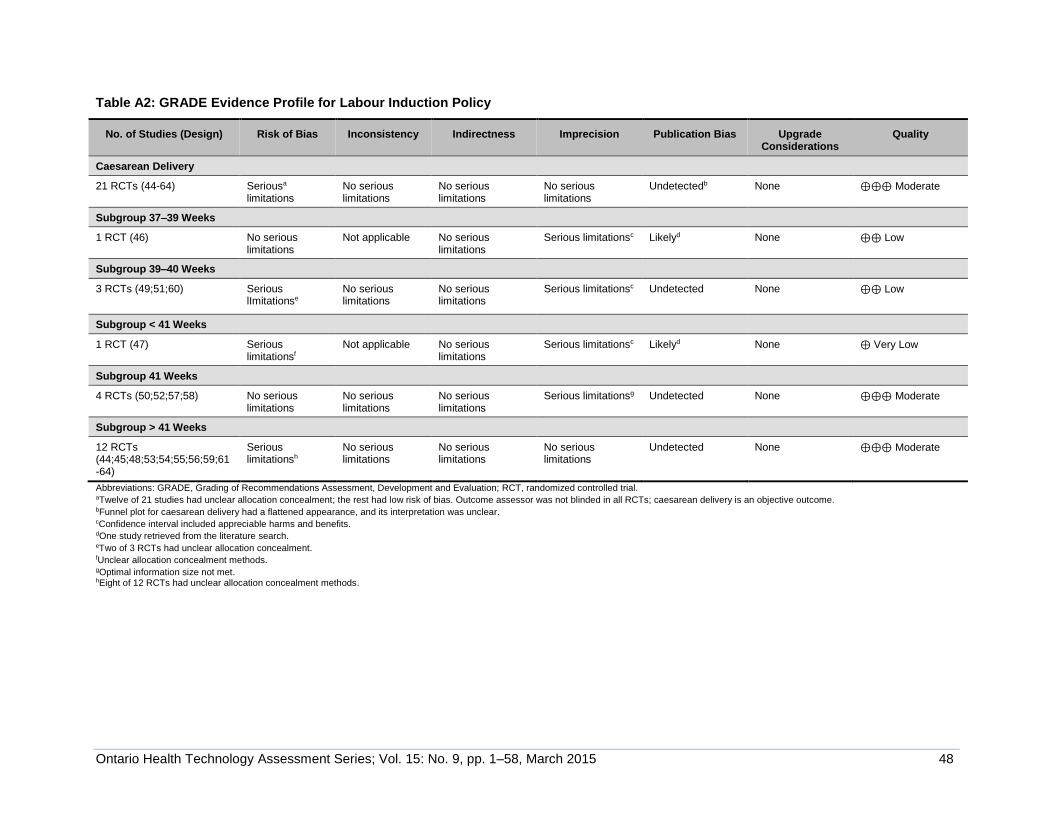
Ontario Health Technology Assessment Series; Vol. 15: No. 9, pp. 1–58, March 2015 48
Table A2: GRADE Evidence Profile for Labour Induction Policy
No. of Studies (Design) Risk of Bias Inconsistency Indirectness Imprecision Publication Bias Upgrade Considerations
Quality
Caesarean Delivery
21 RCTs (44-64) Seriousa
limitations No serious limitations
No serious limitations
No serious limitations
Undetectedb None ⊕⊕⊕ Moderate
Subgroup 37–39 Weeks
1 RCT (46) No serious limitations
Not applicable No serious limitations
Serious limitationsc Likelyd None ⊕⊕ Low
Subgroup 39–40 Weeks
3 RCTs (49;51;60) Serious lImitationse
No serious limitations
No serious limitations
Serious limitationsc Undetected None ⊕⊕ Low
Subgroup < 41 Weeks
1 RCT (47) Serious limitationsf
Not applicable No serious limitations
Serious limitationsc Likelyd None ⊕ Very Low
Subgroup 41 Weeks
4 RCTs (50;52;57;58) No serious limitations
No serious limitations
No serious limitations
Serious limitationsg Undetected None ⊕⊕⊕ Moderate
Subgroup > 41 Weeks
12 RCTs (44;45;48;53;54;55;56;59;61-64)
Serious limitationsh
No serious limitations
No serious limitations
No serious limitations
Undetected None ⊕⊕⊕ Moderate
Abbreviations: GRADE, Grading of Recommendations Assessment, Development and Evaluation; RCT, randomized controlled trial. aTwelve of 21 studies had unclear allocation concealment; the rest had low risk of bias. Outcome assessor was not blinded in all RCTs; caesarean delivery is an objective outcome. bFunnel plot for caesarean delivery had a flattened appearance, and its interpretation was unclear. cConfidence interval included appreciable harms and benefits. dOne study retrieved from the literature search. eTwo of 3 RCTs had unclear allocation concealment. fUnclear allocation concealment methods. gOptimal information size not met. hEight of 12 RCTs had unclear allocation concealment methods.
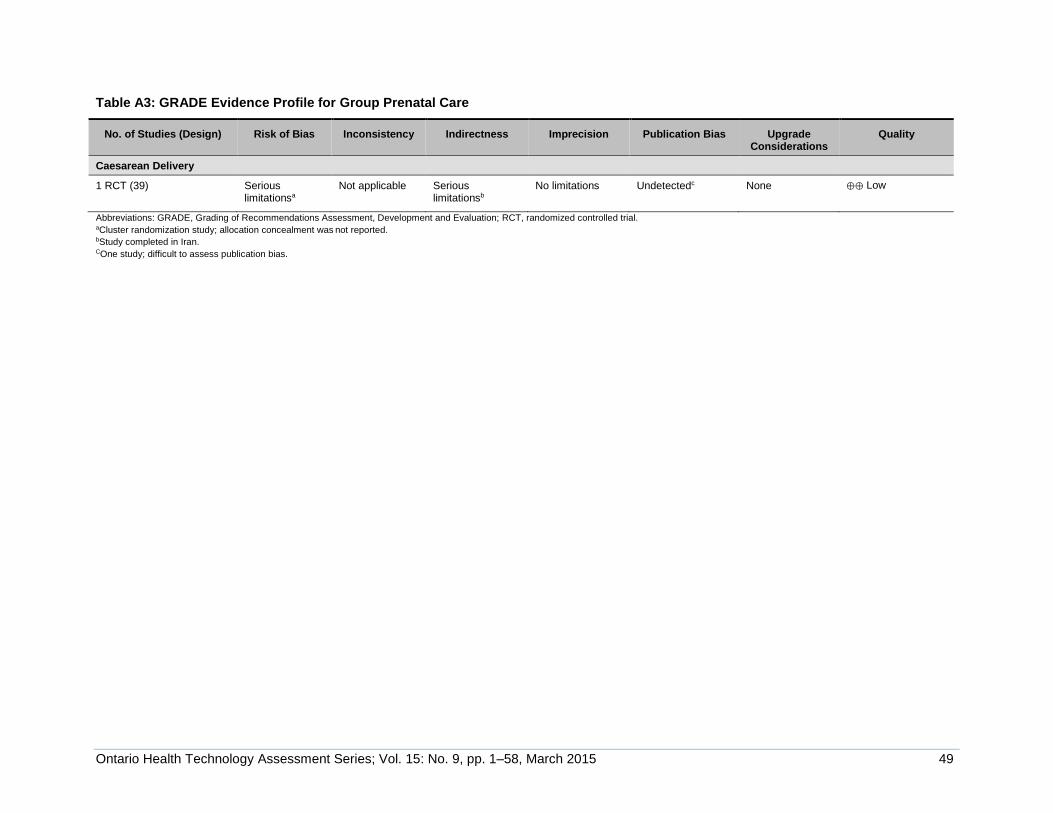
Ontario Health Technology Assessment Series; Vol. 15: No. 9, pp. 1–58, March 2015 49
Table A3: GRADE Evidence Profile for Group Prenatal Care
No. of Studies (Design) Risk of Bias Inconsistency Indirectness Imprecision Publication Bias Upgrade Considerations
Quality
Caesarean Delivery
1 RCT (39) Serious limitationsa
Not applicable Serious limitationsb
No limitations Undetectedc None ⊕⊕ Low
Abbreviations: GRADE, Grading of Recommendations Assessment, Development and Evaluation; RCT, randomized controlled trial. aCluster randomization study; allocation concealment was not reported. bStudy completed in Iran. COne study; difficult to assess publication bias.
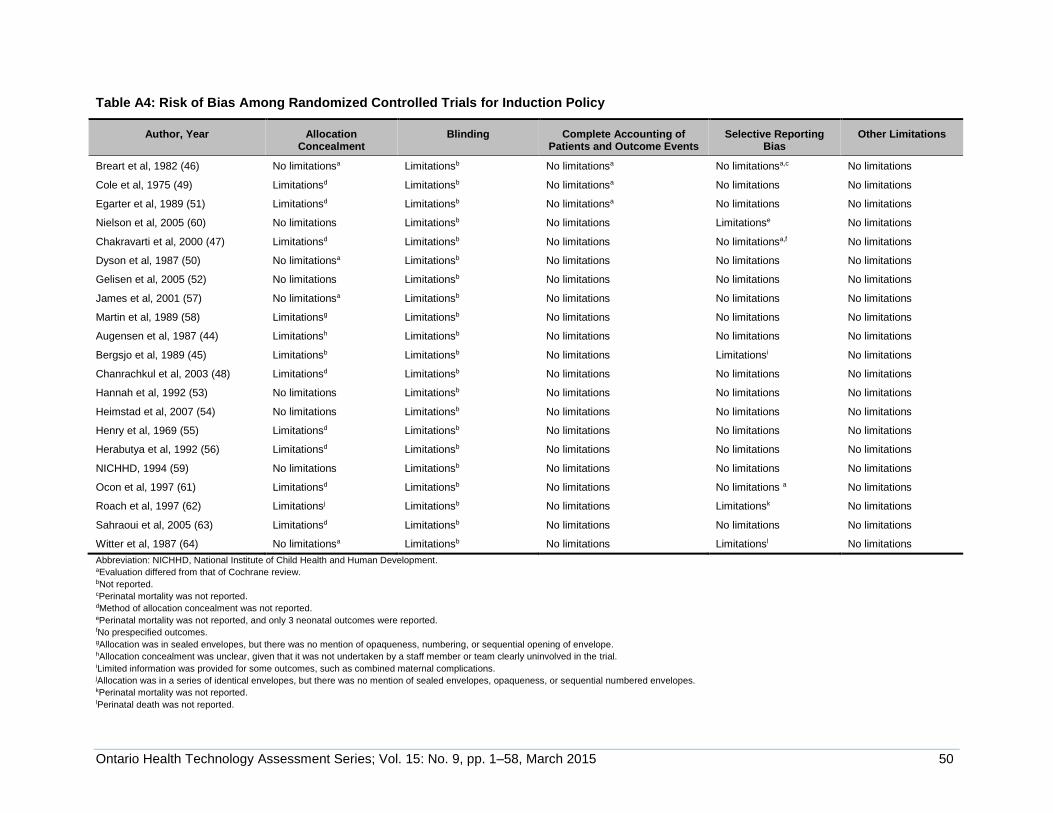
Ontario Health Technology Assessment Series; Vol. 15: No. 9, pp. 1–58, March 2015 50
Table A4: Risk of Bias Among Randomized Controlled Trials for Induction Policy
Author, Year Allocation Concealment
Blinding Complete Accounting of Patients and Outcome Events
Selective Reporting Bias
Other Limitations
Breart et al, 1982 (46) No limitationsa Limitationsb No limitationsa No limitationsa,c No limitations
Cole et al, 1975 (49) Limitationsd Limitationsb No limitationsa No limitations No limitations
Egarter et al, 1989 (51) Limitationsd Limitationsb No limitationsa No limitations No limitations
Nielson et al, 2005 (60) No limitations Limitationsb No limitations Limitationse No limitations
Chakravarti et al, 2000 (47) Limitationsd Limitationsb No limitations No limitationsa,f No limitations
Dyson et al, 1987 (50) No limitationsa Limitationsb No limitations No limitations No limitations
Gelisen et al, 2005 (52) No limitations Limitationsb No limitations No limitations No limitations
James et al, 2001 (57) No limitationsa Limitationsb No limitations No limitations No limitations
Martin et al, 1989 (58) Limitationsg Limitationsb No limitations No limitations No limitations
Augensen et al, 1987 (44) Limitationsh Limitationsb No limitations No limitations No limitations
Bergsjo et al, 1989 (45) Limitationsb Limitationsb No limitations Limitationsi No limitations
Chanrachkul et al, 2003 (48) Limitationsd Limitationsb No limitations No limitations No limitations
Hannah et al, 1992 (53) No limitations Limitationsb No limitations No limitations No limitations
Heimstad et al, 2007 (54) No limitations Limitationsb No limitations No limitations No limitations
Henry et al, 1969 (55) Limitationsd Limitationsb No limitations No limitations No limitations
Herabutya et al, 1992 (56) Limitationsd Limitationsb No limitations No limitations No limitations
NICHHD, 1994 (59) No limitations Limitationsb No limitations No limitations No limitations
Ocon et al, 1997 (61) Limitationsd Limitationsb No limitations No limitations a No limitations
Roach et al, 1997 (62) Limitationsj Limitationsb No limitations Limitationsk No limitations
Sahraoui et al, 2005 (63) Limitationsd Limitationsb No limitations No limitations No limitations
Witter et al, 1987 (64) No limitationsa Limitationsb No limitations Limitationsl No limitations
Abbreviation: NICHHD, National Institute of Child Health and Human Development. aEvaluation differed from that of Cochrane review. bNot reported. cPerinatal mortality was not reported. dMethod of allocation concealment was not reported. ePerinatal mortality was not reported, and only 3 neonatal outcomes were reported. fNo prespecified outcomes. gAllocation was in sealed envelopes, but there was no mention of opaqueness, numbering, or sequential opening of envelope. hAllocation concealment was unclear, given that it was not undertaken by a staff member or team clearly uninvolved in the trial. iLimited information was provided for some outcomes, such as combined maternal complications. jAllocation was in a series of identical envelopes, but there was no mention of sealed envelopes, opaqueness, or sequential numbered envelopes. kPerinatal mortality was not reported. lPerinatal death was not reported.
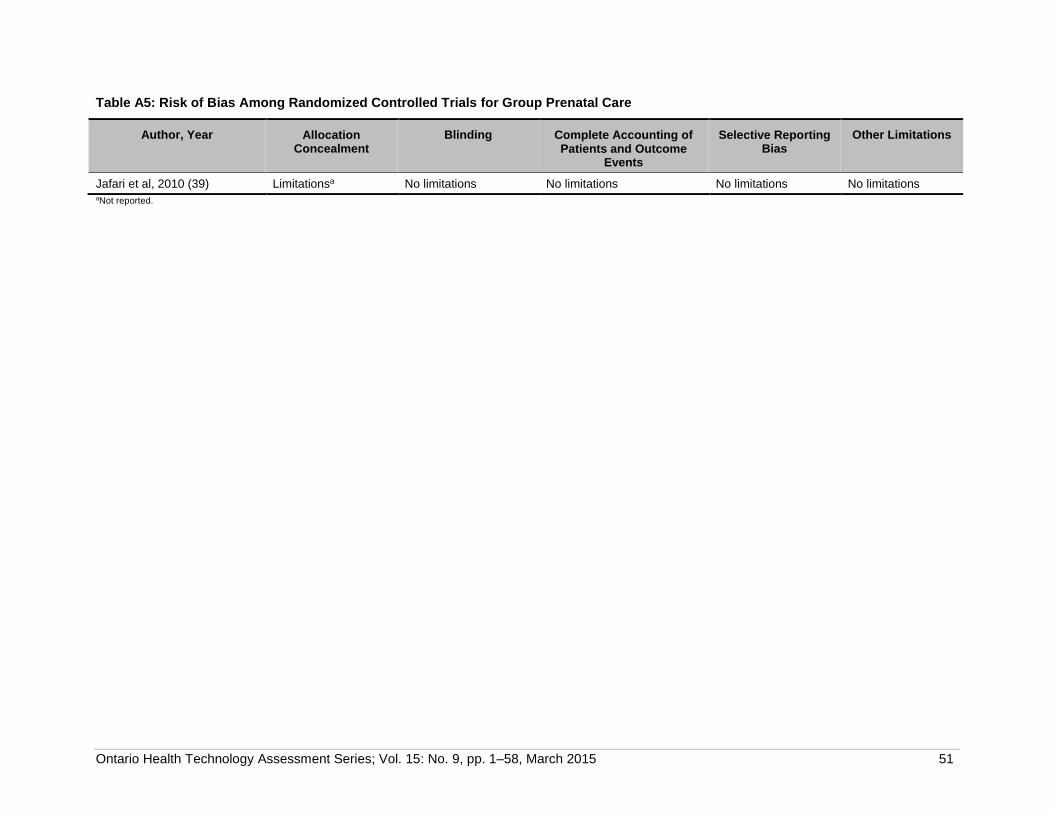
Ontario Health Technology Assessment Series; Vol. 15: No. 9, pp. 1–58, March 2015 51
Table A5: Risk of Bias Among Randomized Controlled Trials for Group Prenatal Care
Author, Year Allocation Concealment
Blinding Complete Accounting of Patients and Outcome
Events
Selective Reporting Bias
Other Limitations
Jafari et al, 2010 (39) Limitationsa No limitations No limitations No limitations No limitations aNot reported.
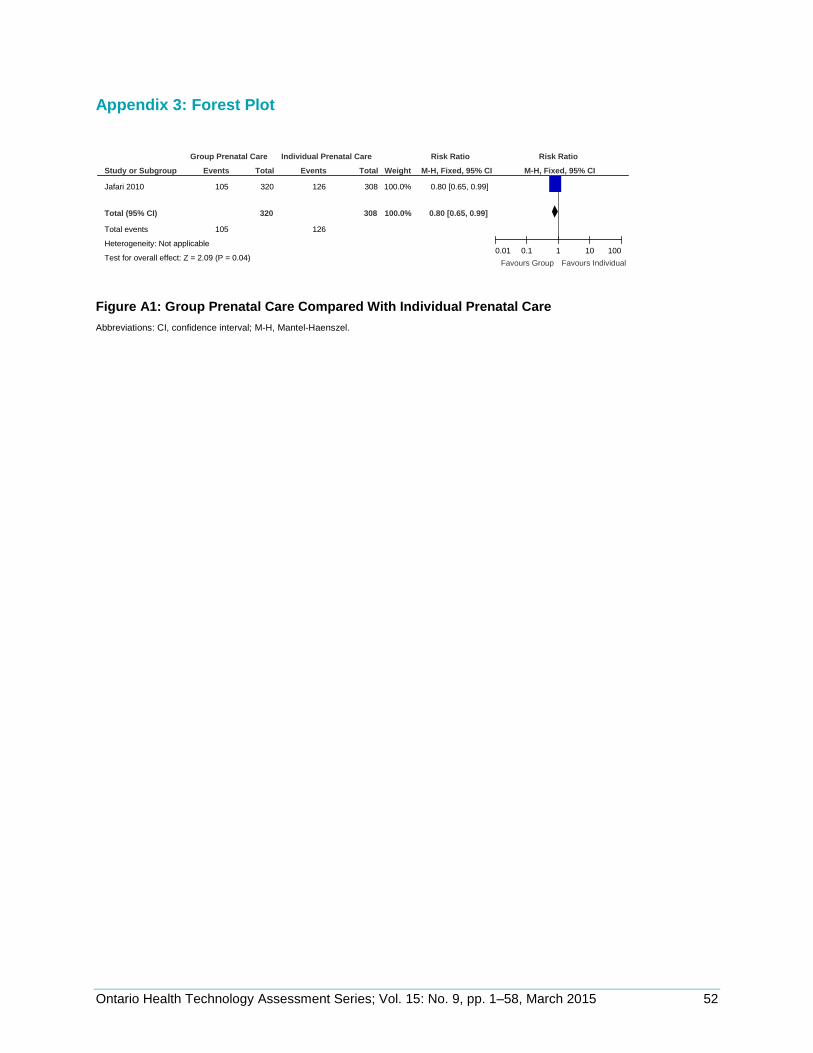
Ontario Health Technology Assessment Series; Vol. 15: No. 9, pp. 1–58, March 2015 52
Appendix 3: Forest Plot
Figure A1: Group Prenatal Care Compared With Individual Prenatal Care
Abbreviations: CI, confidence interval; M-H, Mantel-Haenszel.
Study or Subgroup
Jafari 2010
Total (95% CI)
Total events
Heterogeneity: Not applicable
Test for overall effect: Z = 2.09 (P = 0.04)
Events
105
105
Total
320
320
Events
126
126
Total
308
308
Weight
100.0%
100.0%
M-H, Fixed, 95% CI
0.80 [0.65, 0.99]
0.80 [0.65, 0.99]
Group Prenatal Care Individual Prenatal Care Risk Ratio Risk Ratio
M-H, Fixed, 95% CI
0.01 0.1 1 10 100
Favours Group Favours Individual
Ontario Health Technology Assessment Series; Vol. 15: No. 9, pp. 1–58, March 2015 53
REFERENCES
(1) American College of Obstetricians and Gynecologists. Vaginal birth after previous
cesarean delivery. Practice bulletin No 115. Obstet Gynecol. 2010 Aug;116:450-63.
(2) Hanley GE, Janssen PA, Greyson D. Regional variation in the cesarean delivery and assisted vaginal delivery rates. Obstet Gynecol. 2010 Jun;115(6):1201-8.
(3) Liu S, Liston RM, Joseph KS, Heaman M, Sauve R, Kramer MS et al. Maternal mortality and severe morbidity associated with low-risk planned cesarean delivery versus planned vaginal delivery at term. Can Med Assoc J. 2007 Feb 13;176(4):455-60.
(4) Society of Obstetricians and Gynaecologists of Canada. Joint policy statement on normal childbirth [Internet]. Ottawa (ON): SOGC; [updated 2008 Dec 3; cited 2014 May 1]. 3 p. Available from: http://sogc.org/guidelines/joint-policy-statement-on-normal-childbirth-policy-statement/
(5) National Collaborating Centre for Women's and Children's Health. Caesarean section [Internet]. London, (UK): Royal College of Obstetricians and Gynecologists Press; [updated 2011 Nov; cited 2014 May 1]. Available from: http://www.nice.org.uk/nicemedia/live/13620/57162/57162.pdf
(6) Barber EL, Lundsberg LS, Belanger K, Pettker CM, Funai EF, Illuzzi JL. Indications contributing to the increasing cesarean delivery rate. Obstet Gynecol. 2011 Jul;118(1):29-38.
(7) Declercq E, Young R, Cabral H, Ecker J. Is a rising cesarean delivery rate inevitable? Trends in industrialized countries, 1987 to 2007. Birth. 2011 Jun;38(2):99-104.
(8) MacDorman MF, Menacker F, Declercq E. Cesarean birth in the United States: epidemiology, trends, and outcomes. Clin Perinatol. 2008 Jun;35(2):293-307, v.
(9) Villar J, Valladares E, Wojdyla D, Zavaleta N, Carroli G, Velazco A et al. Caesarean delivery rates and pregnancy outcomes: the 2005 WHO global survey on maternal and perinatal health in Latin America. Lancet. 2006 Jun 3;367(9525):1819-29.
(10) Organisation for Economic Co-operation and Development (OECD). Caesarean sections in health at a glance 2011: OECD indicators. Paris: OECD Publishing; 2011 Jan 1. 97 p.
(11) Canadian Institute for Health Information. Health care in Canada 2010. Ottawa (ON): CIHI; 2010. 115 p.
(12) Centers for Disease Control and Prevention. Reduce cesarean births among low-risk women with no prior cesarean births [Internet]. [updated 2014; cited 2014 May 1]. Available from: http://www.healthypeople.gov/2020/topicsobjectives2020/TechSpecs.aspx?hp2020id=MICH-7.1
(13) Euro-Peristat Project. European perinatal health report. Brussels: Euro-Peristat; 2008. 280 p.
Ontario Health Technology Assessment Series; Vol. 15: No. 9, pp. 1–58, March 2015 54
(14) Lagrew DC, Jr., Adashek JA. Lowering the cesarean section rate in a private hospital: comparison of individual physicians' rates, risk factors, and outcomes. Am J Obstet Gynecol. 1998 Jun;178(6):1207-14.
(15) Sachs BP, Kobelin C, CAstro MA, Frigoletto F. The risks of lowering the cesarean-delivery rate. N Engl J Med. 1999;340:54-7.
(16) Fuglenes D, Aas E, Botten G, Oian P, Kristiansen IS. Maternal preference for cesarean delivery: do women get what they want? Obstet Gynecol. 2012 Aug;120(2 Pt 1):252-60.
(17) Public Health Agency of Canada. Canadian perinatal health report: 2008 edition. Ottawa (ON): PHAC; 2008. 335 p.
(18) Dunn S, Wise MR, Johnson LM, Anderson G, Ferris LE, Yeritsyan N, et al. Reproductive and gynecological health. In: Bierman AS, editor. Project for an Ontario women's health evidence-based report: volume 2. Toronto: POWER study; 2011. 164 p.
(19) Shea BJ, Grimshaw JM, Wells GA, Boers M, Andersson N, Hamel C et al. Development of AMSTAR: a measurement tool to assess the methodological quality of systematic reviews. BMC Med Res Methodol. 2007;7:10.
(20) Guyatt GH, Oxman AD, Schunemann HJ, Tugwell P, Knottnerus A. GRADE guidelines: a new series of articles in the Journal of Clinical Epidemiology. J Clin Epidemiol. 2011 Apr;64(4):380-2.
(21) Anim-Somuah M, Smyth RM, Jones L. Epidural versus non-epidural or no analgesia in labour. Cochrane Database Sys Rev. 2011;(12):CD000331.
(22) Bayrampour H, Heaman M. Advanced maternal age and the risk of cesarean birth: a systematic review. Birth. 2010;37(3):219-26.
(23) Brown HC, Paranjothy S, Dowswell T, Thomas J. Package of care for active management in labour for reducing caesarean section rates in low-risk women. Cochrane Database Sys Rev. 2008;(4):CD004907.
(24) Bugg GJ, Siddiqui F, Thornton JG. Oxytocin versus no treatment or delayed treatment for slow progress in the first stage of spontaneous labour. Cochrane Database Sys Rev. 2011;(7):CD007123.
(25) Devane D, Lalor JG, Daly S, McGuire W, Smith V. Cardiotocography versus intermittent auscultation of fetal heart on admission to labour ward for assessment of fetal wellbeing. Cochrane Database Sys Rev. 2012;2:CD005122.
(26) Gulmezoglu AM, Crowther CA, Middleton P, Heatley E. Induction of labour for improving birth outcomes for women at or beyond term. Cochrane Database Sys Rev. 2012;6:CD004945.
(27) Lavender T, Hart A, Smyth RM. Effect of partogram use on outcomes for women in spontaneous labour at term. Cochrane Database Sys Rev. 2012;8:CD005461.
Ontario Health Technology Assessment Series; Vol. 15: No. 9, pp. 1–58, March 2015 55
(28) Mazzoni A, Althabe F, Liu NH, Bonotti AM, Gibbons L, Sanchez AJ et al. Women's preference for caesarean section: a systematic review and meta-analysis of observational studies. BJOG. 2011;(4):391-9.
(29) Middleton P, Crowther CA, Simmonds L. Different intensities of glycaemic control for pregnant women with pre-existing diabetes. Cochrane Database Sys Rev. 2012;(8):CD008540.
(30) O'Mahony F, Hofmeyr GJ, Menon V. Choice of instruments for assisted vaginal delivery. Cochrane Database Sys Rev. 2010;11:CD005455.
(31) Pandey S, Shetty A, Hamilton M, Bhattacharya S, Maheshwari A. Obstetric and perinatal outcomes in singleton pregnancies resulting from ivf/icsi: a systematic review and meta-analysis. Hum Reprod Update. 2012;18(5):485-503.
(32) Poobalan AS, Aucott LS, Gurung T, Smith WCS, Bhattacharya S. Obesity as an independent risk factor for elective and emergency caesarean delivery in nulliparous women - systematic review and meta-analysis of cohort studies. Obes Rev. 2009;10(1):28-35.
(33) Ruiz-Mirazo E, Lopez-Yarto M, McDonald SD. Group prenatal care versus individual prenatal care: a systematic review and meta-analyses. J Obstet Gyn Can. 2012;34(3):223-9.
(34) Wendland EM, Torloni MR, Falavigna M, Trujillo J, Dode MA, Campos MA et al. Gestational diabetes and pregnancy outcomes - a systematic review of the World Health Organization (WHO) and the International Association of Diabetes in Pregnancy Study Groups (IADPSG) diagnostic criteria. BMC Preg Child. 2012;12(23):1-13.
(35) Goodman, C. Literature searching and evidence interpretation for assessing health care practices. Stockholm, Sweden: Swedish Council on Technology Assessment in Health Care; 1996. [cited 2012 May 22]. 81 p. SBU Report No. 119E.
(36) Akinsipe DC, Villalobos LE, Ridley RT. A systematic review of implementing an elective labor induction policy. J Obst Gyn Neonat Nurs. 2012;41(1):5-16.
(37) Frigoletto FD, Jr., Lieberman E, Lang JM, Cohen A, Barss V, Ringer S et al. A clinical trial of active management of labor. N Engl J Med. 1995 Sep 21;333(12):745-50.
(38) Farrag OA. Prospective study of 3 metabolic regimens in pregnant diabetics. Aust N Z J Obstet Gynaecol. 1987 Feb;27(1):6-9.
(39) Jafari F, Eftekhar H, Fotouhi A, Mohammad K, Hantoushzadeh S. Comparison of maternal and neonatal outcomes of group versus individual prenatal care: a new experience in Iran. Health Care Women Int. 2010 Jul;31(7):571-84.
(40) Institute for Clinical Evaluative Sciences. MOMBABY derived cohorts 1988-March 2013 [Internet]. Toronto: Institute for Clinical Evaluative Sciences; [updated 2014; cited 20013 Mar]. Available from: https://datadictionary.ices.on.ca/Applications/DataDictionary/Default.aspx?viewmode=DataServices
Ontario Health Technology Assessment Series; Vol. 15: No. 9, pp. 1–58, March 2015 56
(41) Provincial Council for Maternal and Child Health. Standardized maternal and newborn levels of care definitions [Internet]. Toronto: PCMCH; [updated 2013 Jan 8; cited 2014 May 1]. 13 p. Available from: http://pcmch.on.ca/sites/default/files/Level%20of%20Care%20Guidelines%202011%20Updated%20August1%202013.pdf
(42) Better Outcomes Registry and Network. BORN Information System [Internet]. Ottawa (ON): BORN Ontario; [updated 2014; cited 2013 Mar]. Available from: https://www.bornontario.ca/en/born-information-system/?q=3
(43) Robson MS. Can we reduce the caesarean section rate? Best Pract Res Clin Obstet Gynaecol. 2001 Jan 1;15(1):179-94.
(44) Augensen K, Bergsjo P, Eikeland T, Askvik K, Carlsen J. Randomised comparison of early versus late induction of labour in post-term pregnancy. Br Med J (Clin Res Ed). 1987 May 9;294(6581):1192-5.
(45) Bergsjo P, Huang GD, Yu SQ, Gao Z, Bakkereig LS. Comparison of induced vs non-induced labor in post-term pregnancy. Acta Obstet Gynecol Scand. 1989;68:683-7.
(46) Breart G, Goujard J, Maillard F, Chavigny C, Rumeau-Rouquette C, Sureau C. Comparison of 2 obstetrical attitudes vis-a-vis inducing labor at term. Randomized study. J Gynecol Obstet Biol Reprod. 1982;11(1):107-12.
(47) Chakravarti S, Goenka B. Conservative policy of induction of labour in uncomplicated postdated pregnancies. Int J Gynecol Obstet. 2000;70(Suppl 3): C62.
(48) Chanrachkul B, Herabutya Y. Postterm with favorable cervix: is induction necessary? Obst Gynecol Reprod Biol. 2003;106:154-7.
(49) Cole RA, Howie PW, Macnaughton MC. Elective induction of labour. A randomised prospective trial. Lancet. 1975 Apr 5;1(7910):767-70.
(50) Dyson DC, Miller PD, Armstrong MA. Management of prolonged pregnancy: induction of labor versus antepartum fetal testing. Am J Obstet Gynecol. 1987 Apr;156(4):928-34.
(51) Egarter CH, Kofler E, Fitz R, Husslein P. Is induction of labour indicated in prolonged pregnancy? Results of a prospective randomised trial. Gynecol and Obstet. 1989;27:6-9.
(52) Gelisen O, Caliskan E, Dilbaz S, Ozdas E, Dilbaz B, Ozdas E et al. Induction of labor with three different techniques at 41 weeks of gestation or spontaneous follow-up until 42 weeks in women with definitely unfavorable cervical scores. Eur J Obstet Gynecol Reprod Biol. 2005 Jun 1;120(2):164-9.
(53) Hannah ME, Hannah WJ, Hellman J, Hewson S, Milner R, Willan A. Induction of labour as compared with serial antenatal monitoring in post-term pregnancy. N Engl J Med. 1992;326:1587-92.
(54) Heimstad R, Skogvoll E, Mattsson LA, Johansen OJ, Eik-Nes SH, Salvesen KA. Induction of labor or serial antenatal fetal monitoring in postterm pregnancy: a randomized controlled trial. Obstet Gynecol. 2007 Mar;109(3):609-17.

Ontario Health Technology Assessment Series; Vol. 15: No. 9, pp. 1–58, March 2015 57
(55) Henry GR. A controlled trial of surgical induction of labour and amnioscopy in the management of prolonged pregnancy. J Obstet Gynaecol Br Commonw. 1969 Sep;76(9):795-8.
(56) Herabutya Y, Prasertsawat PO, Tongyai T, Isarangura Na AN. Prolonged pregnancy: the management dilemma. Int J Gynaecol Obstet. 1992 Apr;37(4):253-8.
(57) James C, George SS, Gaunekar N, Seshadri L. Management of prolonged pregnancy: a randomized trial of induction of labour and antepartum foetal monitoring. Natl Med J India. 2001 Sep;14(5):270-3.
(58) Martin JN, Jr., Sessums JK, Howard P, Martin RW, Morrison JC. Alternative approaches to the management of gravidas with prolonged-postterm-postdate pregnancies. J Miss State Med Assoc. 1989 Apr;30(4):105-11.
(59) National Institute of Child Health and Human Development Network of Maternal-Fetal Medicine Units. A clinical trial of induction of labour versus expectant management in postterm pregnancy. Obstet Gynecol. 1994;170:716-23.
(60) Nielsen PE, Howard BC, Hill CC, Larson PL, Holland RH, Smith PN. Comparison of elective induction of labor with favorable Bishop scores versus expectant management: a randomized clinical trial. J Matern Fetal Neonatal Med. 2005 Jul;18(1):59-64.
(61) Ocon L, Hurtado R, Coteron JJ, Zubiria A, Ramiriz O, Garcia JA. Prolonged pregnancy:procedure guidelines. Progresos de Obstetricia y Ginecologia. 1997;40:101-6.
(62) Roach VJ, Rogers MS. Pregnancy outcome beyond 41 weeks gestation. Int J Gynaecol Obstet. 1997 Oct;59(1):19-24.
(63) Sahraoui W, Hajji S, Bibi M, Nouira M, Essaidi H, Khairi H. Management of pregnancies beyond forty-one week's gestation with an unfavorable cervix. J Gynecol Obstet Biol Reprod. 2005 Sep;34(5):454-62.
(64) Witter FR, Weitz CM. A randomized trial of induction at 42 weeks gestation versus expectant management for postdates pregnancies. Am J Perinatol. 1987 Jul;4(3):206-11.
(65) Neilson JP. Fetal electrocardiogram (ECG) for fetal monitoring during labour. Cochrane Database Sys Rev. 2012;4:CD000116.

Ontario Health Technology Assessment Series; Vol. 15: No. 9, pp. 1–58, March 2015 58
Health Quality Ontario 130 Bloor Street West, 10th Floor
Toronto, Ontario M5S 1N5
Tel: 416-323-6868 Toll Free: 1-866-623-6868
Fax: 416-323-9261 Email: [email protected]
www.hqontario.ca
ISSN 1915-7398 (online) ISBN 978-1-4606-3517-9 (PDF)
© Queen’s Printer for Ontario, 2015
Recommended