Central Bank Transparency and Independence:Updates and New Measures∗
N. Nergiz Dincera and Barry Eichengreenb
aTED University, Ankara, TurkeybUniversity of California, Berkeley
This paper reports updated measures of transparency andindependence for more than 100 central banks. The indicesshow that there has been steady movement in the direction ofgreater transparency and independence over time. In addition,we show that outcomes such as the variability of inflation aresignificantly affected by both central bank transparency andindependence. Disentangling the impact of the two dimensionsof central bank arrangements remains difficult, however.
JEL Codes: E0, E4, F0.
1. Introduction
In early 2012 the Federal Open Market Committee (FOMC) madeknown a decision to further increase the transparency of its monetarypolicy decisions.1 It announced a plan to publish the predictions ofmembers of the Board of Governors and Reserve Bank presidents ofthe level of short-term interest rates as well as having them describetheir views of the evolution of the Federal Reserve’s investment port-folio. The Federal Reserve already published their forecasts of infla-tion, unemployment, and growth. In taking this additional step, itwas following the central banks of New Zealand, Norway, and Swe-den, which have been publishing interest rate forecasts for years.More broadly, this decision to release interest rate forecasts and port-folio outlooks was another step in the trend toward greater central
∗The first author gratefully acknowledges financial support of TUBITAK(The Scientific and Technological Research Council of Turkey) under TUBITAK-BIDEP fellowship.
1The decision was contained in the minutes of the FOMC for December 2011,released on January 3, 2012.
189
190 International Journal of Central Banking March 2014
bank transparency that has not been limited to this small handfulof countries but has been under way globally for some years now.
This trend toward heightened transparency is a departure fromlong-standing central bank practice which valued confidentiality.Early central banks engaged in commercial banking business; theycloaked their lending decisions in secrecy in order to maintain anadvantage over their competitors and out of respect to their clients.As bankers to the government, they sought to avoid releasing embar-rassing information about the public finances. As they becamelenders of last resort, they sought to avoid undermining confidencein distressed financial institutions by husbanding information abouttheir emergency operations.
The rise of central bank transparency can be understood in anumber of related ways. First, it is part of a broader trend, respond-ing to popular pressure, to make government more responsive tothe public. In New Zealand, for example, the increase in centralbank transparency associated with the Reserve Bank Act of 1989,a parliamentary act that required the rationale for monetary policydecisions to be publicly disclosed, was part of a broader movementassociated with the Official Information Act of 1982 and effort of theLabour Government elected in 1984 to enhance the transparency andefficiency of government operations generally.
Second, transparency is seen as a key element of accountabil-ity in an era of central bank independence. As central banks havebecome more independent and freer to choose their tactics, trans-parency has come to be seen as a mechanism enabling the publicto assess whether the actions of central bankers are consistent withtheir mandate. Central bank independence is widely advocated asa means of insulating monetary from short-term political pressures;it is seen as an efficient means of addressing the time-consistencyproblems that plague discretionary policy.2 But “with independence,
2On these two arguments see Blinder (1998) and Rogoff (1985), respectively.Walsh (2003) emphasizes the importance of distinguishing two aspects of indepen-dence: insulation from politics when it comes to defining the objectives of mon-etary policy, and the independence to freely implement policy once those goalshave been defined. Grilli, Masciandaro, and Tabellini (1991), in an early, influ-ential article on this subject, called them political and economic independence,respectively. Debelle and Fischer (1994) refer to them as goal and instrumentindependence.
Vol. 10 No. 1 Central Bank Transparency and Independence 191
comes . . . responsibility,” as Siklos (2011, p. 929) puts it. “Democra-tic accountability for unelected officials and arm’s length institutionsnecessitates behavior that demonstrates sensitivity for the public’sneed to understand how policy is made.”3 Pressure for transparencyis more intense insofar as the mandate of central banks extendsbeyond the pursuit of easily quantifiable, independently verifiabletargets like the rate of inflation to encompass emergency lending,securities market intervention, and related financial operations. Inthe United States, for example, calls to audit the Federal Reservehave intensified as the central bank has come to rely more exten-sively on unconventional policies and expanded the range of its inter-ventions in securities markets. The FOMC’s decision to make moreinformation publicly available can thus be understood as an effort toreconcile the increased complexity of its operations with the desireto maintain and defend its independence.
Third, central bank transparency is seen as a way of enablingmarkets to respond more smoothly to policy decisions. When a cen-tral bank is more transparent about its economic outlook and abouthow that outlook is related to its policy stance, monetary policy deci-sions are less likely to come as a surprise. Investors are less likelyto be caught unawares by policy actions. Policy changes are lesslikely to cause sharp movements in asset prices that cause financialdistress.4
Fourth, transparency is a means of enhancing the credibility ofthe central bank’s commitments. A commitment to ensuring low
3There is also an argument that more independent central banks have greaterincentive to clearly communicate their policies (they will want to be more trans-parent) simply because they have more control over their own policies (Croweand Meade 2008).
4There is also the criticism that excessive transparency and informationends up confusing the markets. Clare and Cortenay (2001) argued that minutesrecounting contentious discussions among board members can heighten asset-price volatility and end up confusing investors. This is presumably why the Fed-eral Reserve trims officials’ forecasts before publishing them. It is presumablyone reason why the European Central Bank (ECB) continues to refuse to pub-lish its minutes and the votes and forecasts of board members. Mishkin (2004)similarly warns that a high degree of transparency could disrupt communicationwith the public, which might not easily understand that forecasts for the policyinstrument are conditional and which might misinterpret changes in the forecast(or deviations between forecast and realized rates) as the central bank renegingon its commitments.
192 International Journal of Central Banking March 2014
and stable inflation will be more convincing when the central bankexplains in detail how and why its policies are supposed to producethe desired inflation rate. In turn, that more credible commitmentgives the central bank more leeway to deviate from typical policysettings when atypical conditions arise, since it will be clear to thepublic that the deviation is temporary and not inconsistent withthe longer-run pursuit of the monetary policy target. Transparencyenhances not just policy credibility, in other words, but also policyflexibility.
It follows that transparency about policy is a way to manageexpectations, which can matter importantly for the effectiveness ofpolicy, in general but especially under exceptional conditions. Whilethe central bank sets certain short-term interest rates, the long-termrates on which, inter alia, fixed investment decisions depend are afunction of not just current short-term rates but also expected futureshort-term rates. Releasing forecasts of future rates, along with fore-casts of future economic conditions to make those future-rate fore-casts credible, is a way for the central bank to influence long-termrates and associated private-sector decisions. Announcements thatcreate expectations about future policy can be especially importantin periods when current policy is constrained. Thus, the FederalReserve, having cut current short-term interest rates to near zero,must now attempt to affect economic activity by creating expec-tations of low future short-term rates—by announcing that short-term rates will remain at current near-zero levels for some num-ber of quarters or years—thereby influencing the long-term rateson which the costs of borrowing for home purchases and corporatefixed investment depend. Publishing forecasts of future interest ratesand, more generally, providing more information about likely futurestance—becoming more transparent, in other words—is a means tothis end.
Understanding the extent of the trend, its motivations, and itsimplications requires measures of the transparency of central banks.In previous papers (Dincer and Eichengreen 2008, 2010) we have pro-vided estimates of the extent of transparency for central banks from1998 through 2006. Here we update those measures through 2010.We use the updated data to ask whether the trend toward greatercentral bank transparency has continued or instead plateaued, as
Vol. 10 No. 1 Central Bank Transparency and Independence 193
some have argued.5 This also allows us to ask how the global financialcrisis and central bank response affected the trend toward greatercentral bank transparency. The Federal Reserve’s response, as dis-cussed above, would suggest that the trend toward greater trans-parency should have been reinforced insofar as the crisis caused cen-tral banks to take unconventional and unprecedented actions. Butwhether the trend toward greater transparency is in fact general isan empirical question. We attempt to answer it below.
In this paper we also provide new measures of transparency fortwenty central banks, mainly those of emerging markets and devel-oped countries that we were not able to consider previously. Thisspeaks further to the question of whether the trend toward increasedcentral bank transparency is general. It helps to address the asser-tion, sometimes heard, that the trend toward greater transparencyis primarily an advanced-country phenomenon that is not equallyevident among central banks in developing economies.6
We also supplement our database with new measures of centralbank independence, building on the earlier empirical literature onthis subject. Transparency and independence are likely to be relatedattributes of central banks, as explained above. We consider theirrelationship in the analysis below.
Finally, with these new measures in hand, we reconsider thedeterminants of central bank transparency and its effects on, interalia, the dynamics of inflation.
2. Literature
An early landmark in the literature on central bank transparencyis Fry et al. (2000). A strength of the Fry et al. analysis is itswide country coverage, based on a Bank of England-administeredsurvey of ninety-four central banks. A limitation is its relativelycoarse definition of transparency. Fry et al. measured central banktransparency as an equally weighted average of three sub-indicators:whether the central bank provides prompt public explanations of itspolicy decisions; the frequency and form of forward-looking analysis
5See inter alia Siklos (2011).6 See the Crowe and Meade (2008) paper discussed below.
194 International Journal of Central Banking March 2014
provided to the public; and the frequency of bulletins, speeches, andresearch papers. Siklos (2002) then provided similar measures fortwenty OECD countries but again for only one point in time, thelate 1990s.
Eijffinger and Geraats (2006) distinguish more aspects of trans-parency and consider more than one point in time. Their indices, onwhich we build, distinguish political transparency (openness aboutpolicy objectives), economic transparency (openness about data,models, and forecasts), procedural transparency (openness aboutthe way decisions are made, achieved mainly through the release ofminutes and votes), policy transparency (openness about the policyimplications, achieved through prompt announcement and explana-tion of decisions), and operational transparency (openness aboutthe implementation of those decisions—in other words, about con-trol errors and macroeconomic disturbances affecting their magni-tude). They distinguish three sub-categories within each of these fivedimensions. Their overall index sums values across these five dimen-sions, each of which is in turn an equally weighted average of itssub-dimensions. The strength of this approach is its comprehensive,multi-dimensional definition of transparency; its limitation is thatEijffinger and Geraats construct it for just nine central banks—theReserve Bank of Australia, Bank of Canada, ECB, Bank of Japan,Reserve Bank of New Zealand, Swedish Riksbank, Swiss NationalBank, Bank of England, and Federal Reserve—and for five years(1998–2002).7 Their results point to sharp differences between moreand less transparent central banks, with the Reserve Bank of NewZealand, the Bank of England, and the Swedish Riksbank at the topin terms of transparency, and the Reserve Bank of Australia, theBank of Japan, and the Swiss National Bank at the bottom.8
7The index covers the period 1998–2002.8A related study is Bini-Smaghi and Gros (2001), who (like Eijffinger-Geraats)
consider fifteen aspects of central bank transparency. They implement their indexfor four central banks: the Federal Reserve, the Bank of England, the Bank ofJapan, and the ECB. De Haan, Amtembrink, and Waller (2004) develop a sim-ilar index for six countries. In an unpublished companion paper (De Haan andAmtembrink 2002), two of the authors apply a similar methodology to fifteencountries.
Vol. 10 No. 1 Central Bank Transparency and Independence 195
In the paper closest to ours, Crowe and Meade (2008) con-struct indices of both the transparency and independence of centralbanks. They report transparency in 1998 and 2006 using criteriasimilar to ours.9 Their measures of transparency cover thirty-sevencentral banks. Only among advanced countries do they find thattransparency rose significantly. There is no evidence of a systematicchange in emerging markets.10
To measure central bank independence, Crowe and Meade applythe criteria developed by Cukierman, Webb, and Neyapti (1992).First, a central bank is categorized as more independent if its head(the chief executive) is appointed by the board of the central bankand not by the prime minister or minister of finance, is not subjectto dismissal, and has a long term in office. These features of theappointment process are important for insulating the head of thecentral bank from political pressures. Second, independence is takenas greater when policy decisions are made without direct governmentinvolvement. Third, a central bank is classified as more independentif its charter states that price stability is the sole or primary goalof monetary policy. Finally, independence is greater when there arelimits on the ability of the government to borrow from the centralbank. The authors combine these four aspects into a single index ofindependence.
Crowe and Meade use information on central bank laws from adatabase held by the International Monetary Fund (IMF) to updatethe Cukierman et al. index. Their measure covering ninety-ninecountries in 2003 suggests that independence increased significantlyin the 1990s and continued to do so since the turn of the century.For developing and emerging economies, all components of the inde-pendence index rise significantly. In the advanced countries, how-ever, this is true only of the components capturing disputes withthe executive and lending to the government.11 Their regressionssuggest that the change in independence between the two periods is
9In some country cases, it would appear, their series end in years slightlyearlier than 2006 as a function of data availability.
10However, their data for the two years may not be directly comparable: whilethe 1998 data are self-reported—they come from the Bank of England surveyreported in Fry et al. (2000)—the 2006 data are constructed on the basis ofinformation gleaned from central bank publications and websites.
196 International Journal of Central Banking March 2014
a function of initial independence (with a negative coefficient, indi-cating that central banks that were already relatively independenthad less room for further improvement) and democracy (more checksand balances make society more amenable to delegation within thepolitical system). They find a larger increase in independence incountries with less flexible exchange rate regimes (a pegged exchangerate being an alternative to central bank independence as a way oflimiting political interference in the day-to-day conduct of monetarypolicy).
Crowe and Meade then regress the level of transparency in 2006on the level of central bank independence and a vector of controls.They find that independence affects transparency positively, as dothe flexibility of the exchange rate regime and measures of institu-tional quality.12
In Dincer and Eichengreen (2008, 2010) we provide indices oftransparency for 100 central banks from 1998 to 2005 and 2006,respectively. Siklos (2011) then updates these same transparencyindices through 2009. While finding that the degree of central banktransparency continued to rise outside the advanced countries andin Central and Eastern Europe in particular, we find little sign offurther increases in the Group of Seven countries and only a mod-est increase among developing and Asian countries. Siklos finds noimpact of the global financial crisis on trends in transparency inthese regions.
3. Trends and Determinants of Transparency
We draw our data from information on central banks’ websitesand statutes, annual reports, and other published documents.13 We
11This may reflect the fact that the other components relating to the appoint-ment of the central bank head and existence of a codified objective for monetarypolicy were already at high levels, having increased previously.
12An explanation for the exchange rate result is that flexible exchange ratestend to be associated with more transparent monetary policy strategies like infla-tion targeting. The positive association of transparency with independence plau-sibly reflects the role of the former as an accountability mechanism for centralbanks otherwise insulated from the political system.
13We draw our data in this manner rather than sending a survey instrument tothe central banks themselves and relying on the subjectivity of responding staff.
Vol. 10 No. 1 Central Bank Transparency and Independence 197
gather this information for as large a number of central banks aspossible and for every year from 1998 through 2010. Where therewas a change in some aspect of transparency over the course of acalendar year, we take the value that prevailed for the largest portionof the year.
We were able to assemble information on transparency for 120central banks. Most of the omissions are central banks of micro-states: our sample includes the central banks of all large, systemicallysignificant countries. New central banks considered here, in additionto those covered in our previous study, are those of Angola, Azer-baijan, Bosnia and Herzegovina, Botswana, Cambodia, the CaymanIslands, Curacao, Iran, Lebanon, Macao, Macedonia, Mozambique,Samoa, Seychelles, Tanzania, Tonga, Venezuela, Laos, the Maldives,and Syria.
Since we have discussed the criteria used in constructing theseindices in a series of earlier papers, we do not repeat that discussionhere. Readers can find the relevant details in appendix 1.
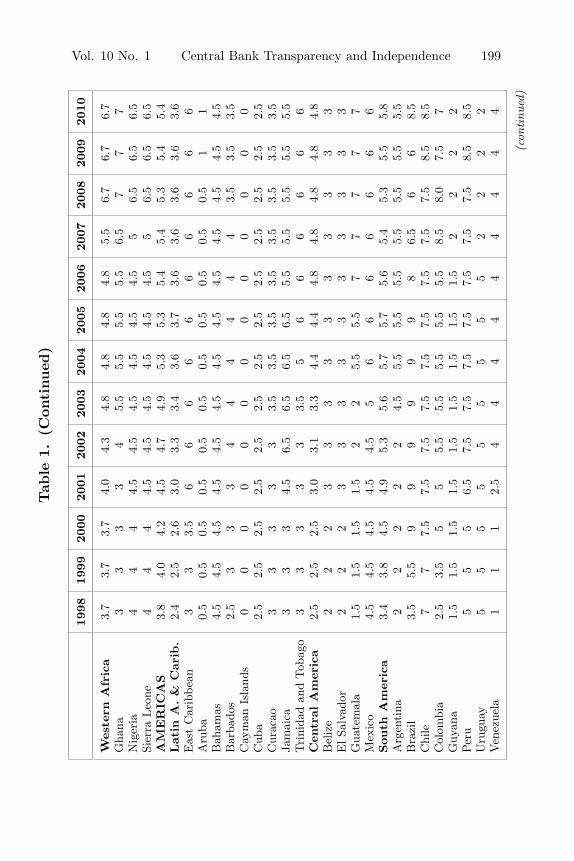
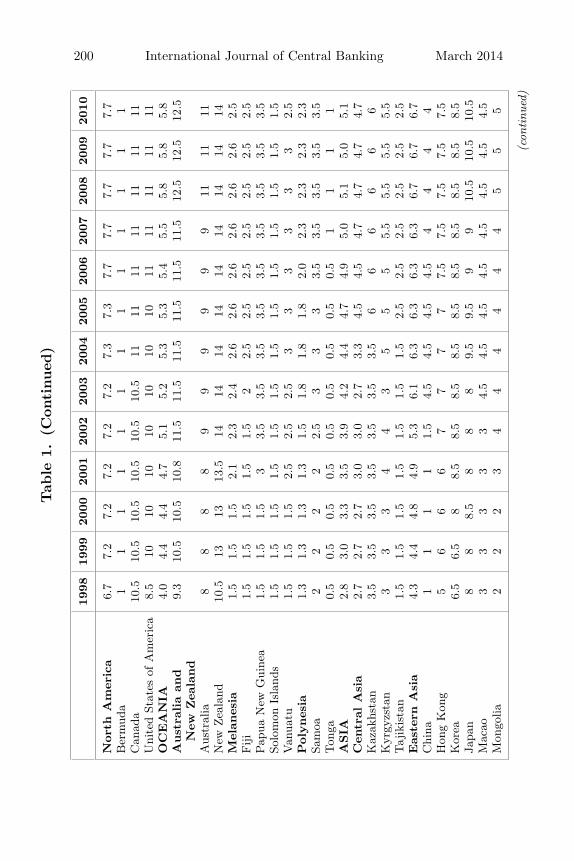
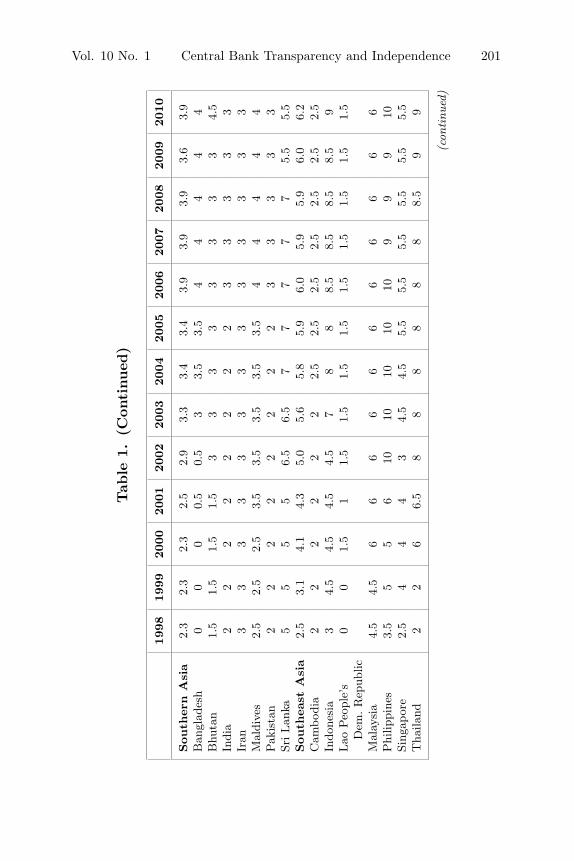
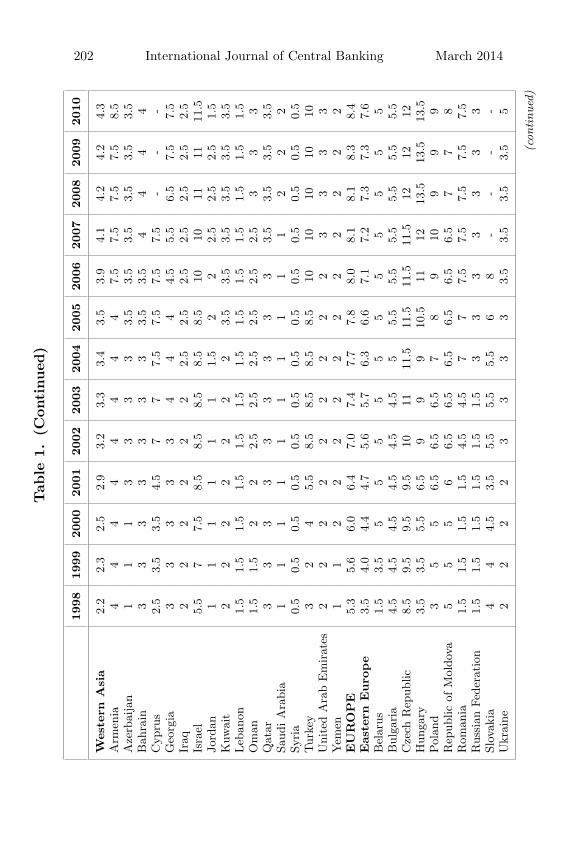
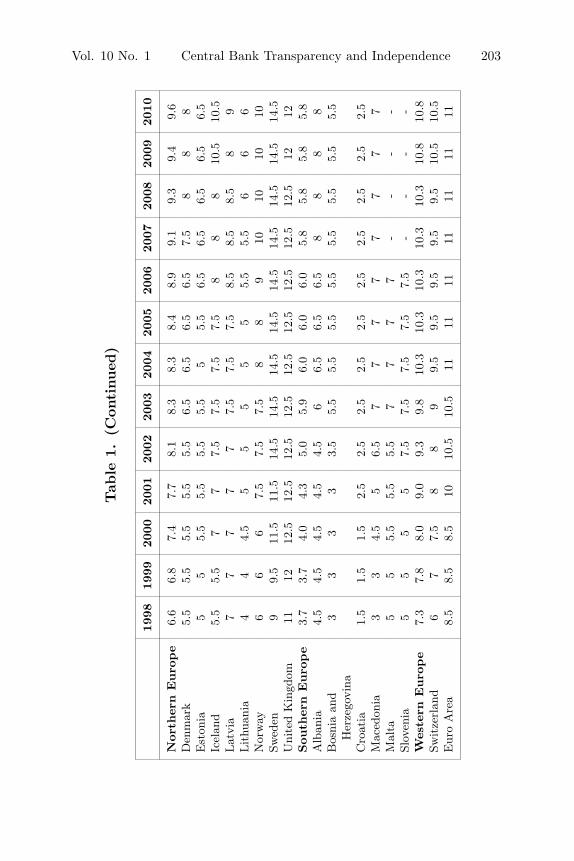
Table 1 shows the indices by country and region.14 The mosttransparent central banks in 2010 are the Swedish Riksbank, theReserve Bank of New Zealand, the Central Bank of Hungary, theCzech National Bank, the Bank of England, and the Bank of Israel.We see here a number of central banks that received high marksfor transparency in past studies (those of Sweden, New Zealand, theUnited Kingdom, and Canada) but also others that did not makethe top-ten list previously. This is a reminder of the advantages ofbroad country coverage and of the fact that a number of countrieshave been moving in the direction of greater transparency.
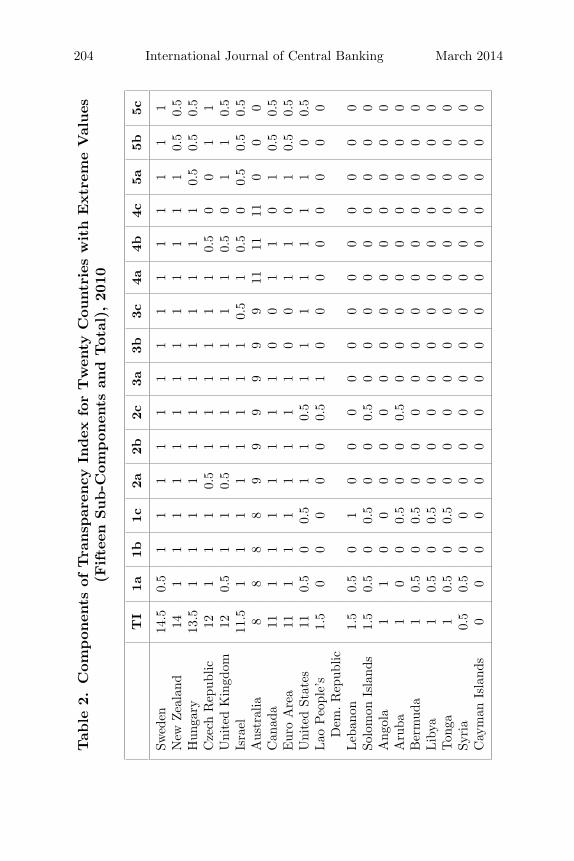
The six least transparent central banks in 2010 were those ofAngola, Aruba, Bermuda, the Cayman Islands, Libya, Syria, andTonga. In 2006, by comparison, the six least transparent bankswere those of Aruba, Bermuda, Ethiopia, Libya, Saudi Arabia, andYemen. While some of the names have changed, the categoriesremain the same; that is to say, many of the least transparent cen-tral banks remain those of offshore financial centers and autocraticregimes in North Africa and the Middle East (see table 2).15
14Regions are constructed using United Nations classifications.15It will be interesting to see what impact recent efforts to combat money
laundering and, in addition, the advent of the Arab Spring have on these patterns.
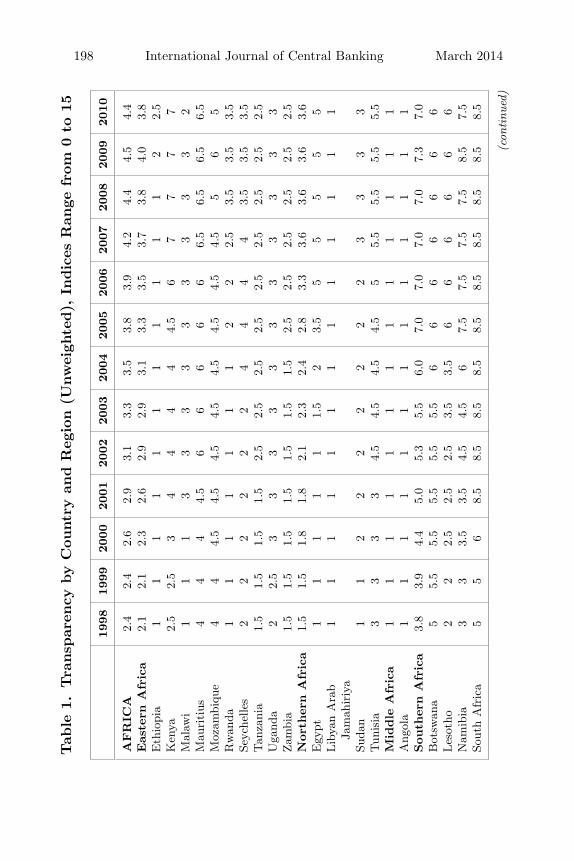
198 International Journal of Central Banking March 2014Tab
le1.
Tra
nsp
aren
cyby
Cou
ntr
yan
dR
egio
n(U
nw
eigh
ted),
Indic
esR
ange
from
0to
15
1998
1999
2000
2001
2002
2003
2004
2005
2006
2007
2008
2009
2010
AFR
ICA
2.4
2.4
2.6
2.9
3.1
3.3
3.5
3.8
3.9
4.2
4.4
4.5
4.4
Eas
tern
Afr
ica
2.1
2.1
2.3
2.6
2.9
2.9
3.1
3.3
3.5
3.7
3.8
4.0
3.8
Eth
iopi
a1
11
11
11
11
11
22.
5K
enya
2.5
2.5
34
44
44.
56
77
77
Mal
awi
11
13
33
33
33
33
2M
auri
tius
44
44.
56
66
66
6.5
6.5
6.5
6.5
Moz
ambi
que
44
4.5
4.5
4.5
4.5
4.5
4.5
4.5
4.5
56
5R
wan
da1
11
11
11
22
2.5
3.5
3.5
3.5
Seyc
helle
s2
22
22
24
44
43.
53.
53.
5Tan
zani
a1.
51.
51.
51.
52.
52.
52.
52.
52.
52.
52.
52.
52.
5U
gand
a2
2.5
33
33
33
33
33
3Zam
bia
1.5
1.5
1.5
1.5
1.5
1.5
1.5
2.5
2.5
2.5
2.5
2.5
2.5
Nor
ther
nA
fric
a1.
51.
51.
81.
82.
12.
32.
42.
83.
33.
63.
63.
63.
6E
gypt
11
11
11.
52
3.5
55
55
5Lib
yan
Ara
b1
11
11
11
11
11
11
Jam
ahir
iya
Suda
n1
12
22
22
22
33
33
Tun
isia
33
33
4.5
4.5
4.5
4.5
55.
55.
55.
55.
5M
iddle
Afr
ica
11
11
11
11
11
11
1A
ngol
a1
11
11
11
11
11
11
Sou
ther
nA
fric
a3.
83.
94.
45.
05.
35.
56.
07.
07.
07.
07.
07.
37.
0B
otsw
ana
55.
55.
55.
55.
55.
56
66
66
66
Les
otho
22
2.5
2.5
2.5
3.5
3.5
66
66
66
Nam
ibia
33
3.5
3.5
4.5
4.5
67.
57.
57.
57.
58.
57.
5So
uth
Afr
ica
55
68.
58.
58.
58.
58.
58.
58.
58.
58.
58.
5
(con
tinu
ed)
Vol. 10 No. 1 Central Bank Transparency and Independence 199Tab
le1.
(Con
tinued
)
1998
1999
2000
2001
2002
2003
2004
2005
2006
2007
2008
2009
2010
Wes
tern
Afr
ica
3.7
3.7
3.7
4.0
4.3
4.8
4.8
4.8
4.8
5.5
6.7
6.7
6.7
Gha
na3
33
34
5.5
5.5
5.5
5.5
6.5
77
7N
iger
ia4
44
4.5
4.5
4.5
4.5
4.5
4.5
56.
56.
56.
5Si
erra
Leo
ne4
44
4.5
4.5
4.5
4.5
4.5
4.5
56.
56.
56.
5A
MER
ICA
S3.
84.
04.
24.
54.
74.
95.
35.
35.
45.
45.
35.
45.
4Lat
inA
.&
Car
ib.
2.4
2.5
2.6
3.0
3.3
3.4
3.6
3.7
3.6
3.6
3.6
3.6
3.6
Eas
tC
arib
bean
33
3.5
66
66
66
66
66
Aru
ba0.
50.
50.
50.
50.
50.
50.
50.
50.
50.
50.
51
1B
aham
as4.
54.
54.
54.
54.
54.
54.
54.
54.
54.
54.
54.
54.
5B
arba
dos
2.5
33
34
44
44
43.
53.
53.
5C
aym
anIs
land
s0
00
00
00
00
00
00
Cub
a2.
52.
52.
52.
52.
52.
52.
52.
52.
52.
52.
52.
52.
5C
urac
ao3
33
33
3.5
3.5
3.5
3.5
3.5
3.5
3.5
3.5
Jam
aica
33
34.
56.
56.
56.
56.
55.
55.
55.
55.
55.
5Tri
nida
dan
dTob
ago
33
33
33.
55
66
66
66
Cen
tral
Am
eric
a2.
52.
52.
53.
03.
13.
34.
44.
44.
84.
84.
84.
84.
8B
eliz
e2
22
33
33
33
33
33
ElSa
lvad
or2
22
33
33
33
33
33
Gua
tem
ala
1.5
1.5
1.5
1.5
22
5.5
5.5
77
77
7M
exic
o4.
54.
54.
54.
54.
55
66
66
66
6Sou
thA
mer
ica
3.4
3.8
4.5
4.9
5.3
5.6
5.7
5.7
5.6
5.4
5.3
5.5
5.8
Arg
enti
na2
22
22
4.5
5.5
5.5
5.5
5.5
5.5
5.5
5.5
Bra
zil
3.5
5.5
99
99
99
86.
56
68.
5C
hile
77
7.5
7.5
7.5
7.5
7.5
7.5
7.5
7.5
7.5
8.5
8.5
Col
ombi
a2.
53.
55
55.
55.
55.
55.
55.
58.
58.
07.
57
Guy
ana
1.5
1.5
1.5
1.5
1.5
1.5
1.5
1.5
1.5
22
22
Per
u5
55
6.5
7.5
7.5
7.5
7.5
7.5
7.5
7.5
8.5
8.5
Uru
guay
55
55
55
55
52
22
2V
enez
uela
11
12.
54
44
44
44
44
(con
tinu
ed)
200 International Journal of Central Banking March 2014Tab
le1.
(Con
tinued
)
1998
1999
2000
2001
2002
2003
2004
2005
2006
2007
2008
2009
2010
Nor
thA
mer
ica
6.7
7.2
7.2
7.2
7.2
7.2
7.3
7.3
7.7
7.7
7.7
7.7
7.7
Ber
mud
a1
11
11
11
11
11
11
Can
ada
10.5
10.5
10.5
10.5
10.5
10.5
1111
1111
1111
11U
nite
dSt
ates
ofA
mer
ica
8.5
1010
1010
1010
1011
1111
1111
OC
EA
NIA
4.0
4.4
4.4
4.7
5.1
5.2
5.3
5.3
5.4
5.5
5.8
5.8
5.8
Aust
ralia
and
9.3
10.5
10.5
10.8
11.5
11.5
11.5
11.5
11.5
11.5
12.5
12.5
12.5
New
Zea
land
Aus
tral
ia8
88
89
99
99
911
1111
New
Zea
land
10.5
1313
13.5
1414
1414
1414
1414
14M
elan
esia
1.5
1.5
1.5
2.1
2.3
2.4
2.6
2.6
2.6
2.6
2.6
2.6
2.5
Fiji
1.5
1.5
1.5
1.5
1.5
22.
52.
52.
52.
52.
52.
52.
5Pap
uaN
ewG
uine
a1.
51.
51.
53
3.5
3.5
3.5
3.5
3.5
3.5
3.5
3.5
3.5
Solo
mon
Isla
nds
1.5
1.5
1.5
1.5
1.5
1.5
1.5
1.5
1.5
1.5
1.5
1.5
1.5
Van
uatu
1.5
1.5
1.5
2.5
2.5
2.5
33
33
33
2.5
Pol
ynes
ia1.
31.
31.
31.
31.
51.
81.
81.
82.
02.
32.
32.
32.
3Sa
moa
22
22
2.5
33
33.
53.
53.
53.
53.
5Ton
ga0.
50.
50.
50.
50.
50.
50.
50.
50.
51
11
1A
SIA
2.8
3.0
3.3
3.5
3.9
4.2
4.4
4.7
4.9
5.0
5.1
5.0
5.1
Cen
tral
Asi
a2.
72.
72.
73.
03.
02.
73.
34.
54.
54.
74.
74.
74.
7K
azak
hsta
n3.
53.
53.
53.
53.
53.
53.
56
66
66
6K
yrgy
zsta
n3
33
44
35
55
5.5
5.5
5.5
5.5
Taj
ikis
tan
1.5
1.5
1.5
1.5
1.5
1.5
1.5
2.5
2.5
2.5
2.5
2.5
2.5
Eas
tern
Asi
a4.
34.
44.
84.
95.
36.
16.
36.
36.
36.
36.
76.
76.
7C
hina
11
11
1.5
4.5
4.5
4.5
4.5
44
44
Hon
gK
ong
56
66
77
77
7.5
7.5
7.5
7.5
7.5
Kor
ea6.
56.
58
8.5
8.5
8.5
8.5
8.5
8.5
8.5
8.5
8.5
8.5
Japa
n8
88.
58
88
9.5
9.5
99
10.5
10.5
10.5
Mac
ao3
33
33
4.5
4.5
4.5
4.5
4.5
4.5
4.5
4.5
Mon
golia
22
23
44
44
44
55
5
(con
tinu
ed)
Vol. 10 No. 1 Central Bank Transparency and Independence 201
Tab
le1.
(Con
tinued
)
1998
1999
2000
2001
2002
2003
2004
2005
2006
2007
2008
2009
2010
Sou
ther
nA
sia
2.3
2.3
2.3
2.5
2.9
3.3
3.4
3.4
3.9
3.9
3.9
3.6
3.9
Ban
glad
esh
00
00.
50.
53
3.5
3.5
44
44
4B
huta
n1.
51.
51.
51.
53
33
33
33
34.
5In
dia
22
22
22
22
33
33
3Ir
an3
33
33
33
33
33
33
Mal
dive
s2.
52.
52.
53.
53.
53.
53.
53.
54
44
44
Pak
ista
n2
22
22
22
23
33
33
SriLan
ka5
55
56.
56.
57
77
77
5.5
5.5
Sou
thea
stA
sia
2.5
3.1
4.1
4.3
5.0
5.6
5.8
5.9
6.0
5.9
5.9
6.0
6.2
Cam
bodi
a2
22
22
22.
52.
52.
52.
52.
52.
52.
5In
done
sia
34.
54.
54.
54.
57
88
8.5
8.5
8.5
8.5
9Lao
Peo
ple’
s0
01.
51
1.5
1.5
1.5
1.5
1.5
1.5
1.5
1.5
1.5
Dem
.R
epub
licM
alay
sia
4.5
4.5
66
66
66
66
66
6P
hilip
pine
s3.
55
56
1010
1010
109
99
10Si
ngap
ore
2.5
44
43
4.5
4.5
5.5
5.5
5.5
5.5
5.5
5.5
Tha
iland
22
66.
58
88
88
88.
59
9
(con
tinu
ed)
202 International Journal of Central Banking March 2014Tab
le1.
(Con
tinued
)
1998
1999
2000
2001
2002
2003
2004
2005
2006
2007
2008
2009
2010
Wes
tern
Asi
a2.
22.
32.
52.
93.
23.
33.
43.
53.
94.
14.
24.
24.
3A
rmen
ia4
44
44
44
47.
57.
57.
57.
58.
5A
zerb
aija
n1
11
33
33
3.5
3.5
3.5
3.5
3.5
3.5
Bah
rain
33
33
33
33.
53.
54
44
4C
ypru
s2.
53.
53.
54.
57
77.
57.
57.
57.
5-
--
Geo
rgia
33
33
34
44
4.5
5.5
6.5
7.5
7.5
Iraq
22
22
22
2.5
2.5
2.5
2.5
2.5
2.5
2.5
Isra
el5.
57
7.5
8.5
8.5
8.5
8.5
8.5
1010
1111
11.5
Jord
an1
11
11
11.
52
22.
52.
52.
51.
5K
uwai
t2
22
22
22
3.5
3.5
3.5
3.5
3.5
3.5
Leb
anon
1.5
1.5
1.5
1.5
1.5
1.5
1.5
1.5
1.5
1.5
1.5
1.5
1.5
Om
an1.
51.
52
22.
52.
52.
52.
52.
52.
53
33
Qat
ar3
33
33
33
33
3.5
3.5
3.5
3.5
Saud
iA
rabi
a1
11
11
11
11
12
22
Syri
a0.
50.
50.
50.
50.
50.
50.
50.
50.
50.
50.
50.
50.
5Tur
key
32
45.
58.
58.
58.
58.
510
1010
1010
Uni
ted
Ara
bE
mir
ates
22
22
22
22
23
33
3Y
emen
11
22
22
22
22
22
2EU
RO
PE
5.3
5.6
6.0
6.4
7.0
7.4
7.7
7.8
8.0
8.1
8.1
8.3
8.4
Eas
tern
Euro
pe
3.5
4.0
4.4
4.7
5.6
5.7
6.3
6.6
7.1
7.2
7.3
7.3
7.6
Bel
arus
1.5
3.5
55
55
55
55
55
5B
ulga
ria
4.5
4.5
4.5
4.5
4.5
4.5
55.
55.
55.
55.
55.
55.
5C
zech
Rep
ublic
8.5
9.5
9.5
9.5
1011
11.5
11.5
11.5
11.5
1212
12H
unga
ry3.
53.
55.
56.
59
99
10.5
1112
13.5
13.5
13.5
Pol
and
35
56.
56.
56.
57
89
109
99
Rep
ublic
ofM
oldo
va5
55
66.
56.
56.
56.
56.
56.
57
78
Rom
ania
1.5
1.5
1.5
1.5
4.5
4.5
77
7.5
7.5
7.5
7.5
7.5
Rus
sian
Fede
rati
on1.
51.
51.
51.
51.
51.
53
33
33
33
Slov
akia
44
4.5
3.5
5.5
5.5
5.5
68
--
--
Ukr
aine
22
22
33
33
3.5
3.5
3.5
3.5
5
(con
tinu
ed)
Vol. 10 No. 1 Central Bank Transparency and Independence 203
Tab
le1.
(Con
tinued
)
1998
1999
2000
2001
2002
2003
2004
2005
2006
2007
2008
2009
2010
Nor
ther
nEuro
pe
6.6
6.8
7.4
7.7
8.1
8.3
8.3
8.4
8.9
9.1
9.3
9.4
9.6
Den
mar
k5.
55.
55.
55.
55.
56.
56.
56.
56.
57.
58
88
Est
onia
55
5.5
5.5
5.5
5.5
55.
56.
56.
56.
56.
56.
5Ic
elan
d5.
55.
57
77.
57.
57.
57.
58
88
10.5
10.5
Lat
via
77
77
77.
57.
57.
58.
58.
58.
58
9Lit
huan
ia4
44.
55
55
55
5.5
5.5
66
6N
orw
ay6
66
7.5
7.5
7.5
88
910
1010
10Sw
eden
99.
511
.511
.514
.514
.514
.514
.514
.514
.514
.514
.514
.5U
nite
dK
ingd
om11
1212
.512
.512
.512
.512
.512
.512
.512
.512
.512
12Sou
ther
nEuro
pe
3.7
3.7
4.0
4.3
5.0
5.9
6.0
6.0
6.0
5.8
5.8
5.8
5.8
Alb
ania
4.5
4.5
4.5
4.5
4.5
66.
56.
56.
58
88
8B
osni
aan
d3
33
33.
55.
55.
55.
55.
55.
55.
55.
55.
5H
erze
govi
naC
roat
ia1.
51.
51.
52.
52.
52.
52.
52.
52.
52.
52.
52.
52.
5M
aced
onia
33
4.5
56.
57
77
77
77
7M
alta
55
5.5
5.5
5.5
77
77
--
--
Slov
enia
55
55
7.5
7.5
7.5
7.5
7.5
--
--
Wes
tern
Euro
pe
7.3
7.8
8.0
9.0
9.3
9.8
10.3
10.3
10.3
10.3
10.3
10.8
10.8
Swit
zerl
and
67
7.5
88
99.
59.
59.
59.
59.
510
.510
.5E
uro
Are
a8.
58.
58.
510
10.5
10.5
1111
1111
1111
11
204 International Journal of Central Banking March 2014
Tab
le2.
Com
pon
ents
ofTra
nsp
aren
cyIn
dex
for
Tw
enty
Cou
ntr
ies
with
Extr
eme
Val
ues
(Fifte
enSub-C
ompon
ents
and
Tot
al),
2010
TI
1a1b
1c2a
2b2c
3a3b
3c4a
4b4c
5a5b
5c
Swed
en14
.50.
51
11
11
11
11
11
11
1N
ewZea
land
141
11
11
11
11
11
11
0.5
0.5
Hun
gary
13.5
11
11
11
11
11
11
0.5
0.5
0.5
Cze
chR
epub
lic12
11
10.
51
11
11
10.
50
01
1U
nite
dK
ingd
om12
0.5
11
0.5
11
11
11
0.5
01
10.
5Is
rael
11.5
11
11
11
11
0.5
10.
50
0.5
0.5
0.5
Aus
tral
ia8
88
89
99
99
911
1111
00
0C
anad
a11
11
11
11
10
01
10
10.
50.
5E
uro
Are
a11
11
11
11
10
01
10
10.
50.
5U
nite
dSt
ates
110.
50
0.5
11
0.5
11
11
11
10
0.5
Lao
Peo
ple’
s1.
50
00
00
0.5
10
00
00
00
0D
em.R
epub
licLeb
anon
1.5
0.5
01
00
00
00
00
00
00
Solo
mon
Isla
nds
1.5
0.5
00.
50
00.
50
00
00
00
00
Ang
ola
11
00
00
00
00
00
00
00
Aru
ba1
00
0.5
00
0.5
00
00
00
00
0B
erm
uda
10.
50
0.5
00
00
00
00
00
00
Lib
ya1
0.5
00.
50
00
00
00
00
00
0Ton
ga1
0.5
00.
50
00
00
00
00
00
0Sy
ria
0.5
0.5
00
00
00
00
00
00
00
Cay
man
Isla
nds
00
00
00
00
00
00
00
00
Vol. 10 No. 1 Central Bank Transparency and Independence 205
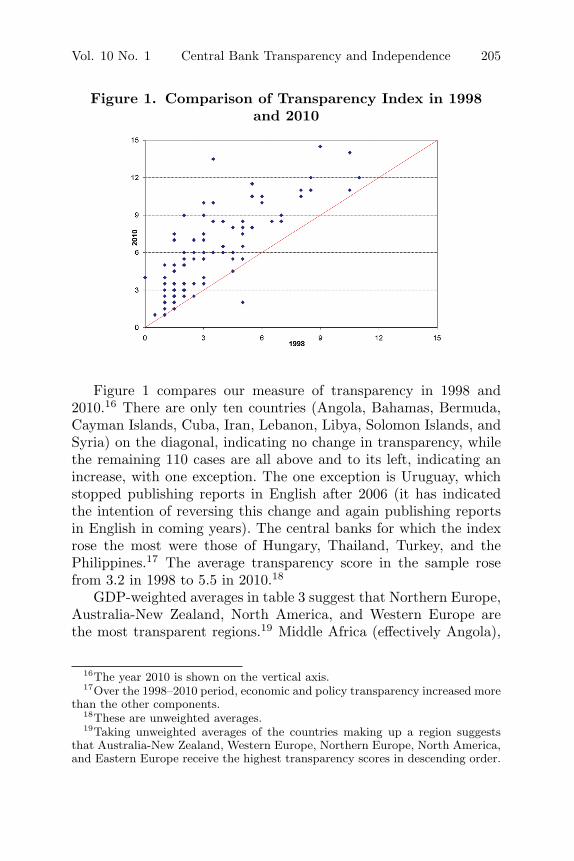
Figure 1. Comparison of Transparency Index in 1998and 2010
Figure 1 compares our measure of transparency in 1998 and2010.16 There are only ten countries (Angola, Bahamas, Bermuda,Cayman Islands, Cuba, Iran, Lebanon, Libya, Solomon Islands, andSyria) on the diagonal, indicating no change in transparency, whilethe remaining 110 cases are all above and to its left, indicating anincrease, with one exception. The one exception is Uruguay, whichstopped publishing reports in English after 2006 (it has indicatedthe intention of reversing this change and again publishing reportsin English in coming years). The central banks for which the indexrose the most were those of Hungary, Thailand, Turkey, and thePhilippines.17 The average transparency score in the sample rosefrom 3.2 in 1998 to 5.5 in 2010.18
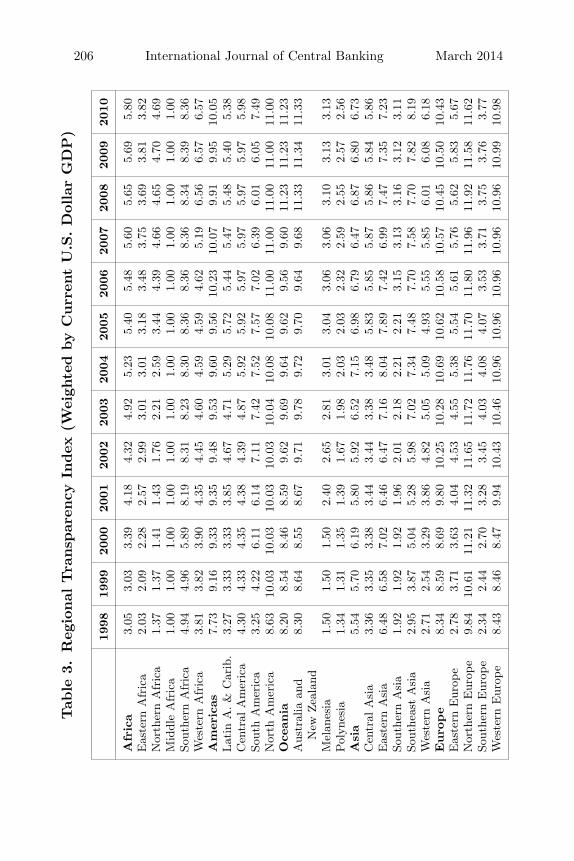
GDP-weighted averages in table 3 suggest that Northern Europe,Australia-New Zealand, North America, and Western Europe arethe most transparent regions.19 Middle Africa (effectively Angola),
16The year 2010 is shown on the vertical axis.17Over the 1998–2010 period, economic and policy transparency increased more
than the other components.18These are unweighted averages.19Taking unweighted averages of the countries making up a region suggests
that Australia-New Zealand, Western Europe, Northern Europe, North America,and Eastern Europe receive the highest transparency scores in descending order.
206 International Journal of Central Banking March 2014Tab
le3.
Reg
ional
Tra
nsp
aren
cyIn
dex
(Wei
ghte
dby
Curr
ent
U.S
.D
olla
rG
DP
)
1998
1999
2000
2001
2002
2003
2004
2005
2006
2007
2008
2009
2010
Afr
ica
3.05
3.03
3.39
4.18
4.32
4.92
5.23
5.40
5.48
5.60
5.65
5.69
5.80
Eas
tern
Afr
ica
2.03
2.09
2.28
2.57
2.99
3.01
3.01
3.18
3.48
3.75
3.69
3.81
3.82
Nor
ther
nA
fric
a1.
371.
371.
411.
431.
762.
212.
593.
444.
394.
664.
654.
704.
69M
iddl
eA
fric
a1.
001.
001.
001.
001.
001.
001.
001.
001.
001.
001.
001.
001.
00So
uthe
rnA
fric
a4.
944.
965.
898.
198.
318.
238.
308.
368.
368.
368.
348.
398.
36W
este
rnA
fric
a3.
813.
823.
904.
354.
454.
604.
594.
594.
625.
196.
566.
576.
57A
mer
icas
7.73
9.16
9.33
9.35
9.48
9.53
9.60
9.56
10.2
310
.07
9.91
9.95
10.0
5Lat
inA
.&
Car
ib.
3.27
3.33
3.33
3.85
4.67
4.71
5.29
5.72
5.44
5.47
5.48
5.40
5.38
Cen
tral
Am
eric
a4.
304.
334.
354.
384.
394.
875.
925.
925.
975.
975.
975.
975.
98So
uth
Am
eric
a3.
254.
226.
116.
147.
117.
427.
527.
577.
026.
396.
016.
057.
49N
orth
Am
eric
a8.
6310
.03
10.0
310
.03
10.0
310
.04
10.0
810
.08
11.0
011
.00
11.0
011
.00
11.0
0O
cean
ia8.
208.
548.
468.
599.
629.
699.
649.
629.
569.
6011
.23
11.2
311
.23
Aus
tral
iaan
d8.
308.
648.
558.
679.
719.
789.
729.
709.
649.
6811
.33
11.3
411
.33
New
Zea
land
Mel
anes
ia1.
501.
501.
502.
402.
652.
813.
013.
043.
063.
063.
103.
133.
13Pol
ynes
ia1.
341.
311.
351.
391.
671.
982.
032.
032.
322.
592.
552.
572.
56A
sia
5.54
5.70
6.19
5.80
5.92
6.52
7.15
6.98
6.79
6.47
6.87
6.80
6.73
Cen
tral
Asi
a3.
363.
353.
383.
443.
443.
383.
485.
835.
855.
875.
865.
845.
86E
aste
rnA
sia
6.48
6.58
7.02
6.46
6.47
7.16
8.04
7.89
7.42
6.99
7.47
7.35
7.23
Sout
hern
Asi
a1.
921.
921.
921.
962.
012.
182.
212.
213.
153.
133.
163.
123.
11So
uthe
ast
Asi
a2.
953.
875.
045.
285.
987.
027.
347.
487.
707.
587.
707.
828.
19W
este
rnA
sia
2.71
2.54
3.29
3.86
4.82
5.05
5.09
4.93
5.55
5.85
6.01
6.08
6.18
Euro
pe
8.34
8.59
8.69
9.80
10.2
510
.28
10.6
910
.62
10.5
810
.57
10.4
510
.50
10.4
3E
aste
rnE
urop
e2.
783.
713.
634.
044.
534.
555.
385.
545.
615.
765.
625.
835.
67N
orth
ern
Eur
ope
9.84
10.6
111
.21
11.3
211
.65
11.7
211
.76
11.7
011
.80
11.9
611
.92
11.5
811
.62
Sout
hern
Eur
ope
2.34
2.44
2.70
3.28
3.45
4.03
4.08
4.07
3.53
3.71
3.75
3.76
3.77
Wes
tern
Eur
ope
8.43
8.46
8.47
9.94
10.4
310
.46
10.9
610
.96
10.9
610
.96
10.9
610
.99
10.9
8
Vol. 10 No. 1 Central Bank Transparency and Independence 207
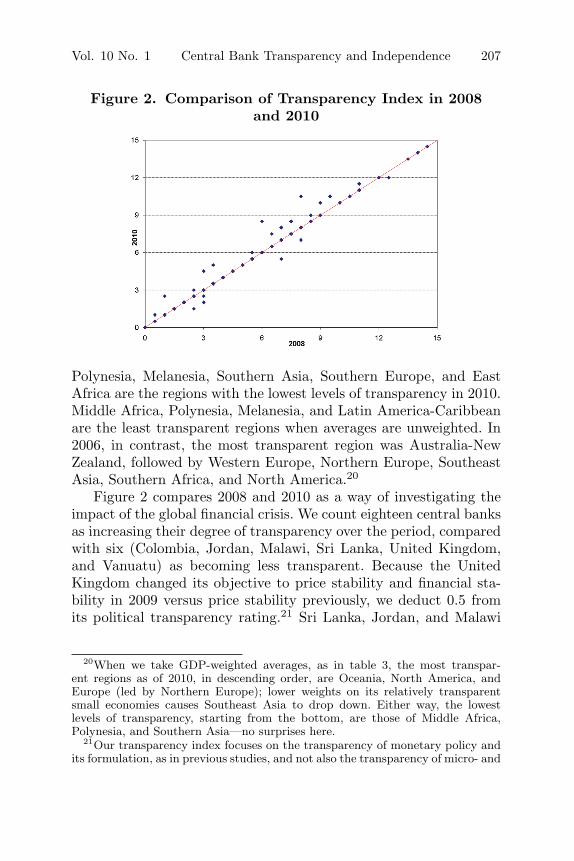
Figure 2. Comparison of Transparency Index in 2008and 2010
Polynesia, Melanesia, Southern Asia, Southern Europe, and EastAfrica are the regions with the lowest levels of transparency in 2010.Middle Africa, Polynesia, Melanesia, and Latin America-Caribbeanare the least transparent regions when averages are unweighted. In2006, in contrast, the most transparent region was Australia-NewZealand, followed by Western Europe, Northern Europe, SoutheastAsia, Southern Africa, and North America.20
Figure 2 compares 2008 and 2010 as a way of investigating theimpact of the global financial crisis. We count eighteen central banksas increasing their degree of transparency over the period, comparedwith six (Colombia, Jordan, Malawi, Sri Lanka, United Kingdom,and Vanuatu) as becoming less transparent. Because the UnitedKingdom changed its objective to price stability and financial sta-bility in 2009 versus price stability previously, we deduct 0.5 fromits political transparency rating.21 Sri Lanka, Jordan, and Malawi
20When we take GDP-weighted averages, as in table 3, the most transpar-ent regions as of 2010, in descending order, are Oceania, North America, andEurope (led by Northern Europe); lower weights on its relatively transparentsmall economies causes Southeast Asia to drop down. Either way, the lowestlevels of transparency, starting from the bottom, are those of Middle Africa,Polynesia, and Southern Asia—no surprises here.
21Our transparency index focuses on the transparency of monetary policy andits formulation, as in previous studies, and not also the transparency of micro- and
208 International Journal of Central Banking March 2014
Figure 3. Trends in Transparency by Level of EconomicDevelopment: Weighted
0
3
6
9
12
15
1998 1999 2000 2001 2002 2003 2004 2005 2006 2007 2008 2009 2010
Tran
spar
ency
Inde
x
Developed Countries Emerging Countries Others
receive lower ratings in terms of policy transparency due to changesin how they announce and explain policy decisions. Vanuatu receiveslower marks for operational transparency, and Colombia for eco-nomic and procedural transparency. It does not appear, on balance,that the financial crisis reversed the overall movement in the direc-tion of greater central bank transparency, although—unlike earlierperiods—a non-negligible number of countries buck the trend. Itis sometimes argued that excessive transparency about, inter alia,problems in the financial system can be counterproductive (by pro-voking self-fulfilling bank runs, etc.). If so, such concerns have notobviously reversed the trend toward greater transparency regardingthe objectives and conduct of monetary policy, our concern here.
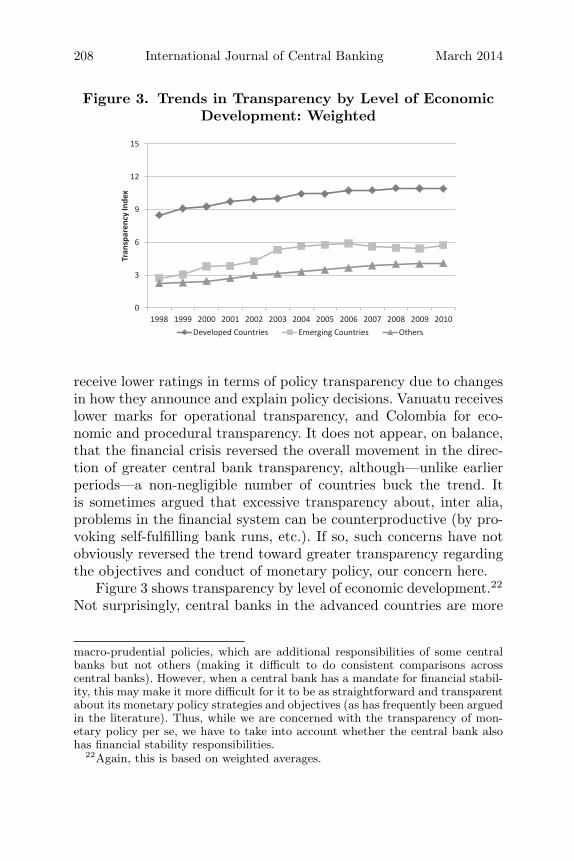
Figure 3 shows transparency by level of economic development.22
Not surprisingly, central banks in the advanced countries are more
macro-prudential policies, which are additional responsibilities of some centralbanks but not others (making it difficult to do consistent comparisons acrosscentral banks). However, when a central bank has a mandate for financial stabil-ity, this may make it more difficult for it to be as straightforward and transparentabout its monetary policy strategies and objectives (as has frequently been arguedin the literature). Thus, while we are concerned with the transparency of mon-etary policy per se, we have to take into account whether the central bank alsohas financial stability responsibilities.
22Again, this is based on weighted averages.
Vol. 10 No. 1 Central Bank Transparency and Independence 209
transparent than central banks in emerging markets (defined asmiddle-income countries with significant links to international finan-cial markets), which in turn are more transparent than central banksin developing countries.23 We see an upward trend over time in allthree categories of economies until 2006. In the case of emerging mar-kets, this is in contrast to Crowe and Meade, who find no increasebetween 1998 and 2006; it is precisely in this period and sub-groupof economies that our data show the most dramatic increase in thelevel of transparency.24
Strikingly, while transparency continues to trend upward in boththe advanced and developing countries, the same emerging marketsthat made the most dramatic strides through 2006 (the terminal dateof our earlier study) appear to give back some ground thereafter.This reflects somewhat lower rates for a number of larger emergingmarkets (Brazil and China in 2007; Brazil, Colombia, and Poland in2008).25
Tables 4 and 5 update our earlier regressions on the determinantsof transparency. Table 4 presents the cross-section results, with allvariables averaged over the 1998–2010 period. Evidently, countrieswith higher per capita incomes, deeper financial markets, more openeconomies, and stronger political institutions have more transparentcentral banks. A new result here is the positive association betweenpast inflation and current transparency. However, the inflation vari-able is not significant in all specifications; it is correlated with variousdimensions of the political regime (columns 5–7), making it hard toidentify its effects.26
23We adopt the Dow Jones classification of emerging markets throughout.24Siklos (2011) reports conclusions similar to ours. Note that no countries
moved between emerging market and developing country status over the periodaccording to our categorization.
25The People’s Bank of China announced numerical forecasts before 2007 butnot after. Brazil did not publish quarterly inflation reports starting in 2007 (theypublished all the reports for the period of 2007–11 in July 2011). Poland changedthe frequency of its inflation reports and inflation and output forecast announce-ments from four times a year to three times a year starting in 2008. Likewise,Columbia changed the frequency of inflation reports from four times a year tothree times a year starting in 2008.
26Some recent literature has suggested the existence of a positive relationshipbetween inflation and democracy, especially in the Latin American context (see,e.g., Haggard and Kaufman 1995).
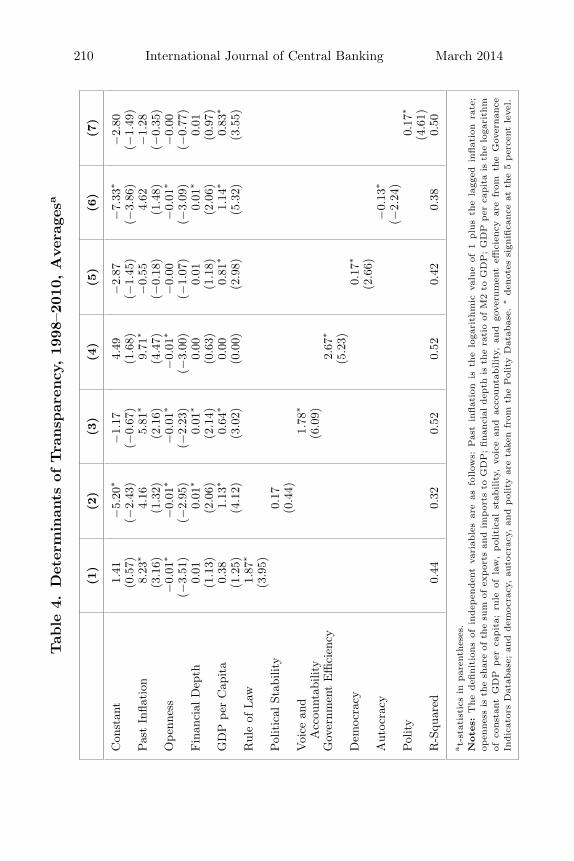
210 International Journal of Central Banking March 2014Tab
le4.
Det
erm
inan
tsof
Tra
nsp
aren
cy,19
98–2
010,
Ave
rage
sa
(1)
(2)
(3)
(4)
(5)
(6)
(7)
Con
stan
t1.
41−
5.20
∗−
1.17
4.49
−2.
87−
7.33
∗−
2.80
(0.5
7)(−
2.43
)(−
0.67
)(1
.68)
(−1.
45)
(−3.
86)
(−1.
49)
Pas
tIn
flati
on8.
23∗
4.16
5.81
∗9.
71∗
−0.
554.
62−
1.28
(3.1
6)(1
.32)
(2.1
6)(4
.47)
(−0.
18)
(1.4
8)(−
0.35
)O
penn
ess
−0.
01∗
−0.
01∗
−0.
01∗
−0.
01∗
−0.
00−
0.01
∗−
0.00
(−3.
51)
(−2.
95)
(−2.
23)
(−3.
00)
(−1.
07)
(−3.
09)
(−0.
77)
Fin
anci
alD
epth
0.01
0.01
∗0.
01∗
0.00
0.01
0.01
∗0.
01(1
.13)
(2.0
6)(2
.14)
(0.6
3)(1
.18)
(2.0
6)(0
.97)
GD
Ppe
rC
apit
a0.
381.
13∗
0.64
∗0.
000.
81∗
1.14
∗0.
83∗
(1.2
5)(4
.12)
(3.0
2)(0
.00)
(2.9
8)(5
.32)
(3.5
5)R
ule
ofLaw
1.87
∗
(3.9
5)Pol
itic
alSt
abili
ty0.
17(0
.44)
Voi
cean
d1.
78∗
Acc
ount
abili
ty(6
.09)
Gov
ernm
ent
Effi
cien
cy2.
67∗
(5.2
3)D
emoc
racy
0.17
∗
(2.6
6)A
utoc
racy
−0.
13∗
(−2.
24)
Pol
ity
0.17
∗
(4.6
1)R
-Squ
ared
0.44
0.32
0.52
0.52
0.42
0.38
0.50
at-
stat
isti
csin
par
enth
eses
.N
ote
s:T
he
defi
nit
ions
ofin
dep
enden
tva
riab
les
are
asfo
llow
s:Pas
tin
flat
ion
isth
elo
gari
thm
icva
lue
of1
plu
sth
ela
gged
inflat
ion
rate
;op
ennes
sis
the
shar
eof
the
sum
ofex
por
tsan
dim
por
tsto
GD
P;finan
cial
dep
this
the
rati
oof
M2
toG
DP;G
DP
per
capit
ais
the
loga
rith
mof
const
ant
GD
Pper
capit
a;ru
leof
law
,pol
itic
alst
ability,
voic
ean
dac
count
ability,
and
gove
rnm
ent
effici
ency
are
from
the
Gov
ernan
ceIn
dic
ator
sD
atab
ase;
and
dem
ocra
cy,au
tocr
acy,
and
pol
ity
are
take
nfr
omth
ePol
ity
Dat
abas
e.∗
den
otes
sign
ifica
nce
atth
e5
per
cent
leve
l.
Vol. 10 No. 1 Central Bank Transparency and Independence 211
Tab
le5.
Det
erm
inan
tsof
Tra
nsp
aren
cy,Pan
elFix
edEffec
tsa
(1)
(2)
(3)
(4)
(5)
(6)
(7)
(8)
Con
stan
t−
3.08
−3.
99−
2.24
−3.
17−
1.04
−3.
28−
2.74
−3.
07(−
0.01
)(−
0.01
)(−
0.01
)(−
0.01
)(−
0.02
)(−
0.01
)(−
0.01
)(−
0.01
)Pas
tIn
flati
on−
0.60
−0.
56−
0.53
−0.
60−
0.48
−0.
61−
0.65
−0.
62(−
1.27
)(−
1.20
)(−
1.13
)(−
1.26
)(−
1.02
)(−
1.35
)(−
1.44
)(−
1.38
)O
penn
ess
−0.
01∗
−0.
01∗
−0.
01∗
−0.
01∗
−0.
01∗
−0.
00−
0.01
∗−
0.00
∗
(−3.
24)
(−2.
93)
(−3.
31)
(−3.
23(−
3.81
)(−
1.82
)(−
2.92
)(−
2.13
)Fin
anci
alD
epth
0.03
∗0.
03∗
0.03
∗0.
03∗
0.03
∗0.
02∗
0.02
∗0.
02∗
(6.7
6)(6
.66)
(6.5
8)(6
.77)
(6.8
2)(5
.75)
(5.6
1)(5
.70)
GD
Ppe
rC
apit
a0.
82∗
0.92
∗0.
73∗
0.83
∗0.
59∗
0.66
∗0.
90∗
0.75
∗
(6.9
9)(7
.81)
(6.6
3)(6
.82)
(4.9
6)(6
.02)
(8.4
0)(6
.99)
Rul
eof
Law
−0.
11(0
.85)
Pol
itic
alSt
abili
ty−
0.31
∗
(−2.
78)
(con
tinu
ed)
212 International Journal of Central Banking March 2014
Tab
le5.
(Con
tinued
)
(1)
(2)
(3)
(4)
(5)
(6)
(7)
(8)
Voi
cean
d0.
21A
ccou
ntab
ility
(1.7
8)G
over
nmen
t−
0.12
Effi
cien
cy(−
0.90
)R
egul
ator
yQ
ualit
y0.
48∗
(3.4
6)D
emoc
racy
0.29
∗
(9.2
9)A
utoc
racy
−0.
41∗
(−9.
30)
Pol
ity
0.19
∗
(9.8
5)H
auss
man
Tes
t18
.18∗
11.0
1∗28
.03∗
26.8
5∗26
.63∗
11.9
1∗9.
2310
.00
R-S
quar
ed0.
950.
950.
950.
950.
950.
960.
960.
96
at-
stat
isti
csin
par
enth
eses
.N
ote
s:T
he
defi
nit
ions
ofin
dep
enden
tva
riab
les
are
asfo
llow
s:Pas
tin
flat
ion
isth
elo
gari
thm
icva
lue
of1
plu
sth
ela
gged
inflat
ion
rate
;op
ennes
sis
the
shar
eof
the
sum
ofex
por
tsan
dim
por
tsto
GD
P;finan
cial
dep
this
the
rati
oof
M2
toG
DP;G
DP
per
capit
ais
the
loga
rith
mof
const
ant
GD
Pper
capit
a;ru
leof
law
,pol
itic
alst
ability,
voic
ean
dac
count
ability,
and
gove
rnm
ent
effici
ency
are
from
the
Gov
ernan
ceIn
dic
ator
sD
atab
ase;
and
dem
ocra
cy,au
tocr
acy,
and
pol
ity
are
take
nfr
omth
ePol
ity
Dat
abas
e.∗
den
otes
sign
ifica
nce
atth
e5
per
cent
leve
l.
Vol. 10 No. 1 Central Bank Transparency and Independence 213
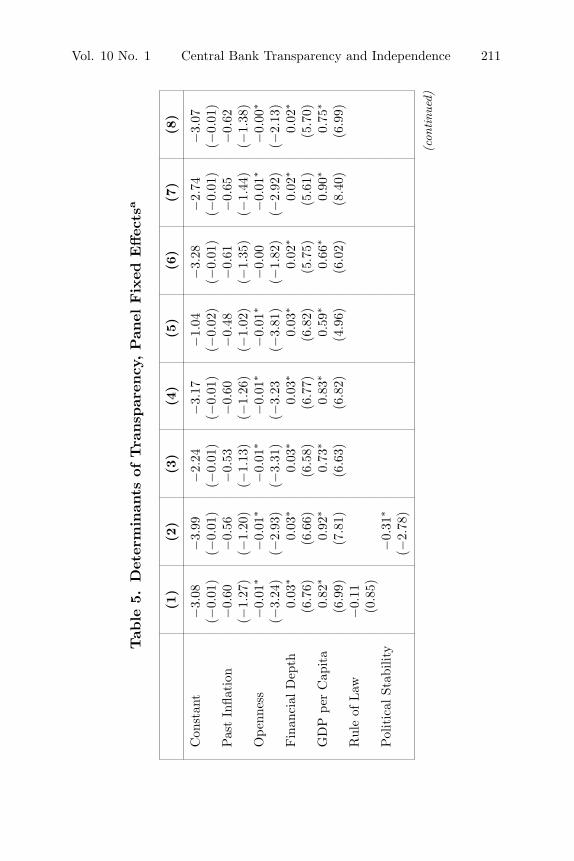
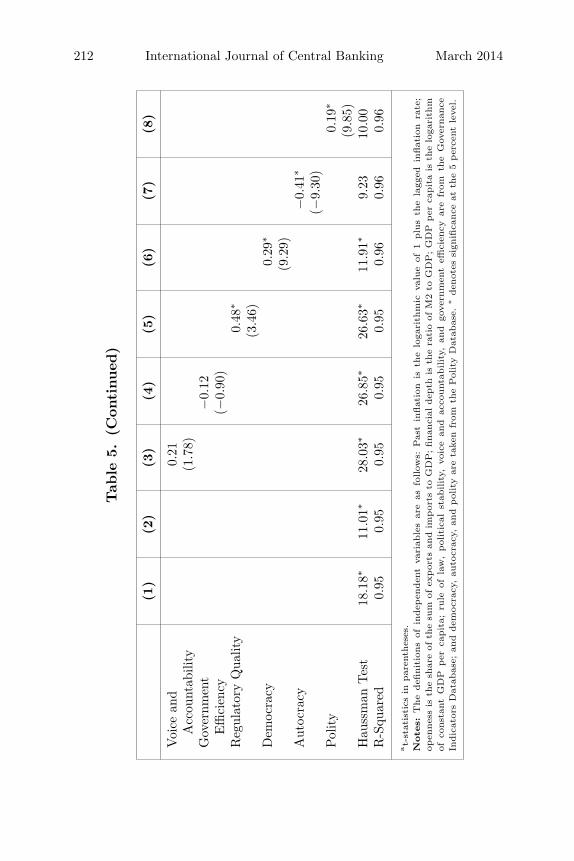
Table 5 reports the analogous panel estimates, with countryeffects included in all columns.27 Since these results eliminate time-invariant country-specific effects, they can be interpreted as ana-lyzing the determinants of changes in transparency over time. Herethe positive effects of higher per capita incomes, deeper financialmarkets, more economic openness, and stronger political institu-tions come through even more clearly than before. In contrast, pastinflation is uniformly insignificant, reinforcing our earlier skepticismabout the robustness of this variable.
Some previous studies, including our own, have suggested thattransparency becomes more important as a mechanism of monetarypolicy accountability when countries adopt a more flexible exchangerate and success at maintaining a peg no longer suffices for verifyingthe ability of the central bank to attain its monetary policy goals.In table 21 (in appendix 2) we add a measure of the flexibility ofthe exchange rate regime. This index is based on the IMF coarse-classification data provided by Ilzetzki, Reinhart, and Rogoff (2008)and takes the score 1 to 6, where a higher score indicates a moreflexible exchange rate regime. Data on the exchange rate regime areavailable only through 2007, making for a shorter sample, which iswhy we relegate these results to an appendix. They confirm the pre-sumption that countries with more flexible exchange rate regimesalso tend to have more transparent central banks. Otherwise, thesealternative estimates are broadly consistent with those in the text.28
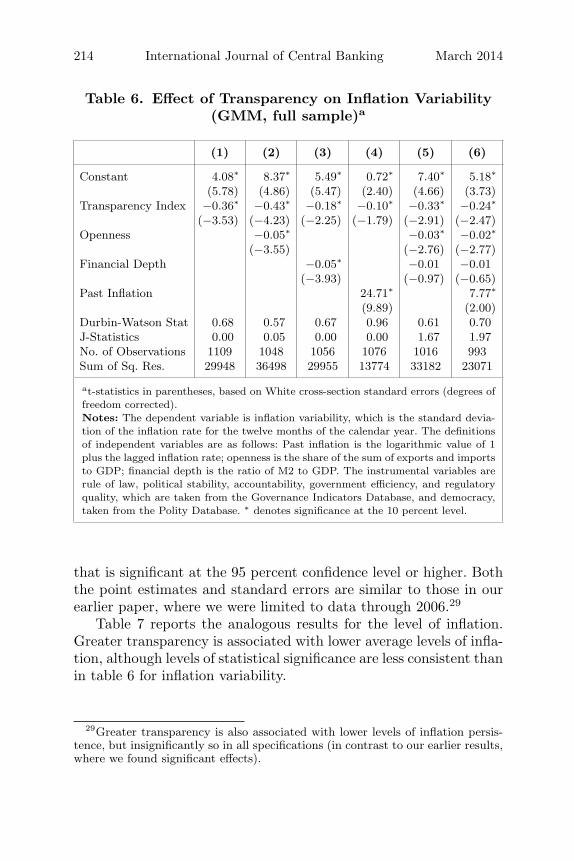
Table 6 updates our earlier analysis of the effects of transparencyon inflation variability, defined as the standard deviation of monthlyinflation in a given year. We use the independent variables in tables4 and 5 as instruments for transparency in table 6 and include asadditional determinants of inflation variability measures of open-ness, financial depth, and past inflation. According to table 6, moreopen economies have less variable inflation, while countries with apast history of inflation experience more nominal variability. Centralbank transparency consistently enters with a negative coefficient
27The variables used here are stationary and cointegrated according to thestandard augmented Dickey-Fuller tests.
28Estimates on panel data including country fixed effects are again consistentwith the just-mentioned results, although the exchange-rate-regime variable isnot consistently significant at the same high level of confidence.
214 International Journal of Central Banking March 2014
Table 6. Effect of Transparency on Inflation Variability(GMM, full sample)a
(1) (2) (3) (4) (5) (6)
Constant 4.08∗ 8.37∗ 5.49∗ 0.72∗ 7.40∗ 5.18∗
(5.78) (4.86) (5.47) (2.40) (4.66) (3.73)Transparency Index −0.36∗ −0.43∗ −0.18∗ −0.10∗ −0.33∗ −0.24∗
(−3.53) (−4.23) (−2.25) (−1.79) (−2.91) (−2.47)Openness −0.05∗ −0.03∗ −0.02∗
(−3.55) (−2.76) (−2.77)Financial Depth −0.05∗ −0.01 −0.01
(−3.93) (−0.97) (−0.65)Past Inflation 24.71∗ 7.77∗
(9.89) (2.00)Durbin-Watson Stat 0.68 0.57 0.67 0.96 0.61 0.70J-Statistics 0.00 0.05 0.00 0.00 1.67 1.97No. of Observations 1109 1048 1056 1076 1016 993Sum of Sq. Res. 29948 36498 29955 13774 33182 23071
at-statistics in parentheses, based on White cross-section standard errors (degrees offreedom corrected).Notes: The dependent variable is inflation variability, which is the standard devia-tion of the inflation rate for the twelve months of the calendar year. The definitionsof independent variables are as follows: Past inflation is the logarithmic value of 1plus the lagged inflation rate; openness is the share of the sum of exports and importsto GDP; financial depth is the ratio of M2 to GDP. The instrumental variables arerule of law, political stability, accountability, government efficiency, and regulatoryquality, which are taken from the Governance Indicators Database, and democracy,taken from the Polity Database. ∗ denotes significance at the 10 percent level.
that is significant at the 95 percent confidence level or higher. Boththe point estimates and standard errors are similar to those in ourearlier paper, where we were limited to data through 2006.29
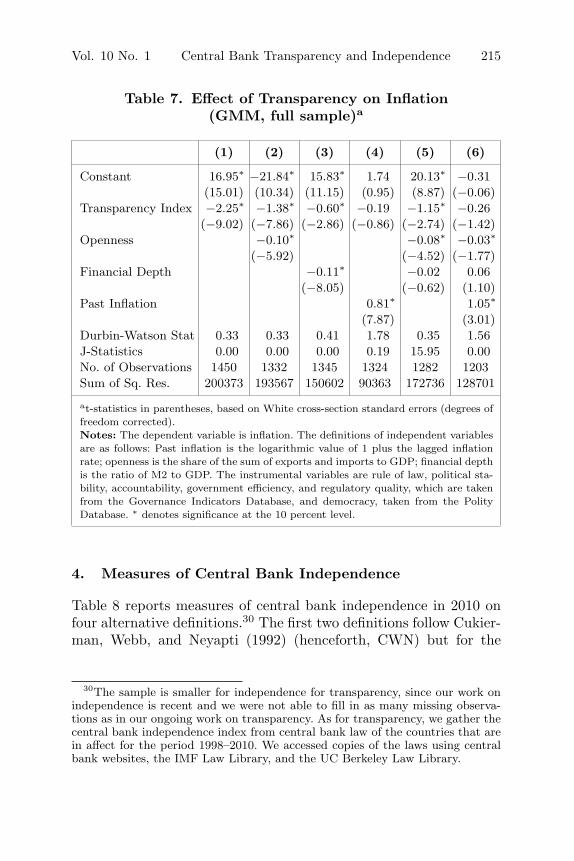
Table 7 reports the analogous results for the level of inflation.Greater transparency is associated with lower average levels of infla-tion, although levels of statistical significance are less consistent thanin table 6 for inflation variability.
29Greater transparency is also associated with lower levels of inflation persis-tence, but insignificantly so in all specifications (in contrast to our earlier results,where we found significant effects).
Vol. 10 No. 1 Central Bank Transparency and Independence 215
Table 7. Effect of Transparency on Inflation(GMM, full sample)a
(1) (2) (3) (4) (5) (6)
Constant 16.95∗ −21.84∗ 15.83∗ 1.74 20.13∗ −0.31(15.01) (10.34) (11.15) (0.95) (8.87) (−0.06)
Transparency Index −2.25∗ −1.38∗ −0.60∗ −0.19 −1.15∗ −0.26(−9.02) (−7.86) (−2.86) (−0.86) (−2.74) (−1.42)
Openness −0.10∗ −0.08∗ −0.03∗
(−5.92) (−4.52) (−1.77)Financial Depth −0.11∗ −0.02 0.06
(−8.05) (−0.62) (1.10)Past Inflation 0.81∗ 1.05∗
(7.87) (3.01)Durbin-Watson Stat 0.33 0.33 0.41 1.78 0.35 1.56J-Statistics 0.00 0.00 0.00 0.19 15.95 0.00No. of Observations 1450 1332 1345 1324 1282 1203Sum of Sq. Res. 200373 193567 150602 90363 172736 128701
at-statistics in parentheses, based on White cross-section standard errors (degrees offreedom corrected).Notes: The dependent variable is inflation. The definitions of independent variablesare as follows: Past inflation is the logarithmic value of 1 plus the lagged inflationrate; openness is the share of the sum of exports and imports to GDP; financial depthis the ratio of M2 to GDP. The instrumental variables are rule of law, political sta-bility, accountability, government efficiency, and regulatory quality, which are takenfrom the Governance Indicators Database, and democracy, taken from the PolityDatabase. ∗ denotes significance at the 10 percent level.
4. Measures of Central Bank Independence
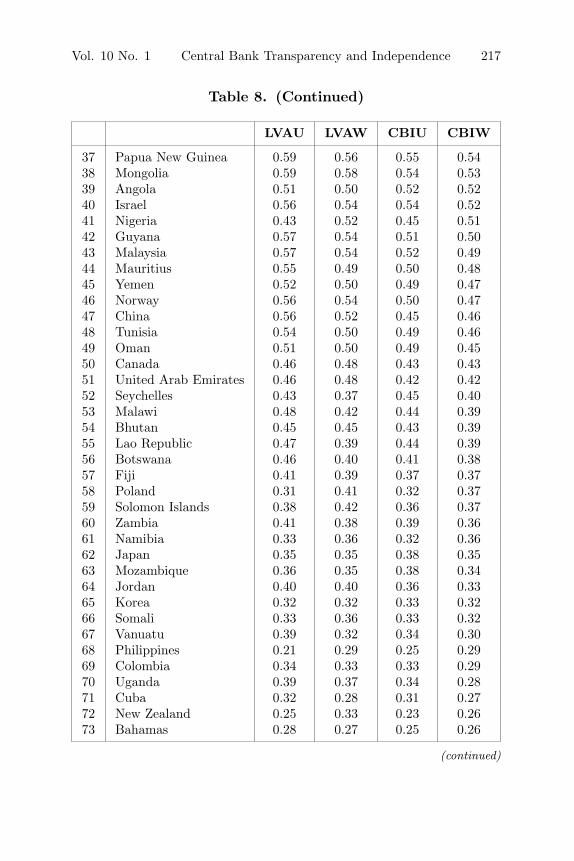
Table 8 reports measures of central bank independence in 2010 onfour alternative definitions.30 The first two definitions follow Cukier-man, Webb, and Neyapti (1992) (henceforth, CWN) but for the
30The sample is smaller for independence for transparency, since our work onindependence is recent and we were not able to fill in as many missing observa-tions as in our ongoing work on transparency. As for transparency, we gather thecentral bank independence index from central bank law of the countries that arein affect for the period 1998–2010. We accessed copies of the laws using centralbank websites, the IMF Law Library, and the UC Berkeley Law Library.
216 International Journal of Central Banking March 2014
Table 8. Comparison of Different Measures ofIndependence in 2010
LVAU LVAW CBIU CBIW
1 Kyrgyz Republic 0.89 0.88 0.86 0.832 Latvia 0.88 0.87 0.86 0.833 Euro Area 0.85 0.84 0.84 0.814 Lithuania 0.85 0.84 0.81 0.795 Romania 0.83 0.82 0.81 0.796 Estonia 0.85 0.84 0.80 0.797 Armenia 0.86 0.85 0.79 0.778 Sweden 0.80 0.78 0.78 0.779 Hungary 0.88 0.87 0.78 0.7710 Macedonia 0.82 0.81 0.76 0.7411 Indonesia 0.80 0.77 0.74 0.7312 Croatia 0.80 0.79 0.75 0.7313 Bosnia and Herzegovina 0.86 0.84 0.72 0.7214 Iceland 0.71 0.67 0.69 0.6915 Iraq 0.75 0.74 0.71 0.6916 Chile 0.78 0.76 0.72 0.6917 Moldova 0.73 0.71 0.68 0.6818 Sierra Leone 0.72 0.69 0.67 0.6719 El Salvador 0.78 0.75 0.66 0.6720 Kenya 0.68 0.65 0.67 0.6721 Azerbaijan 0.65 0.65 0.62 0.6522 Lesotho 0.71 0.69 0.65 0.6423 Venezuela 0.73 0.71 0.65 0.6424 Czech Republic 0.68 0.66 0.66 0.6425 Cambodia 0.67 0.65 0.64 0.6426 Mexico 0.66 0.65 0.65 0.6327 Albania 0.67 0.65 0.64 0.6228 Russia 0.77 0.77 0.62 0.6129 Turkey 0.73 0.71 0.62 0.6030 Sri Lanka 0.68 0.66 0.63 0.6031 Bulgaria 0.71 0.70 0.60 0.5832 Peru 0.56 0.58 0.53 0.5633 Argentina 0.60 0.60 0.57 0.5634 Tanzania 0.62 0.60 0.58 0.5635 ECCB 0.61 0.56 0.57 0.5536 Georgia 0.60 0.58 0.63 0.55
(continued)
Vol. 10 No. 1 Central Bank Transparency and Independence 217
Table 8. (Continued)
LVAU LVAW CBIU CBIW
37 Papua New Guinea 0.59 0.56 0.55 0.5438 Mongolia 0.59 0.58 0.54 0.5339 Angola 0.51 0.50 0.52 0.5240 Israel 0.56 0.54 0.54 0.5241 Nigeria 0.43 0.52 0.45 0.5142 Guyana 0.57 0.54 0.51 0.5043 Malaysia 0.57 0.54 0.52 0.4944 Mauritius 0.55 0.49 0.50 0.4845 Yemen 0.52 0.50 0.49 0.4746 Norway 0.56 0.54 0.50 0.4747 China 0.56 0.52 0.45 0.4648 Tunisia 0.54 0.50 0.49 0.4649 Oman 0.51 0.50 0.49 0.4550 Canada 0.46 0.48 0.43 0.4351 United Arab Emirates 0.46 0.48 0.42 0.4252 Seychelles 0.43 0.37 0.45 0.4053 Malawi 0.48 0.42 0.44 0.3954 Bhutan 0.45 0.45 0.43 0.3955 Lao Republic 0.47 0.39 0.44 0.3956 Botswana 0.46 0.40 0.41 0.3857 Fiji 0.41 0.39 0.37 0.3758 Poland 0.31 0.41 0.32 0.3759 Solomon Islands 0.38 0.42 0.36 0.3760 Zambia 0.41 0.38 0.39 0.3661 Namibia 0.33 0.36 0.32 0.3662 Japan 0.35 0.35 0.38 0.3563 Mozambique 0.36 0.35 0.38 0.3464 Jordan 0.40 0.40 0.36 0.3365 Korea 0.32 0.32 0.33 0.3266 Somali 0.33 0.36 0.33 0.3267 Vanuatu 0.39 0.32 0.34 0.3068 Philippines 0.21 0.29 0.25 0.2969 Colombia 0.34 0.33 0.33 0.2970 Uganda 0.39 0.37 0.34 0.2871 Cuba 0.32 0.28 0.31 0.2772 New Zealand 0.25 0.33 0.23 0.2673 Bahamas 0.28 0.27 0.25 0.26
(continued)
218 International Journal of Central Banking March 2014
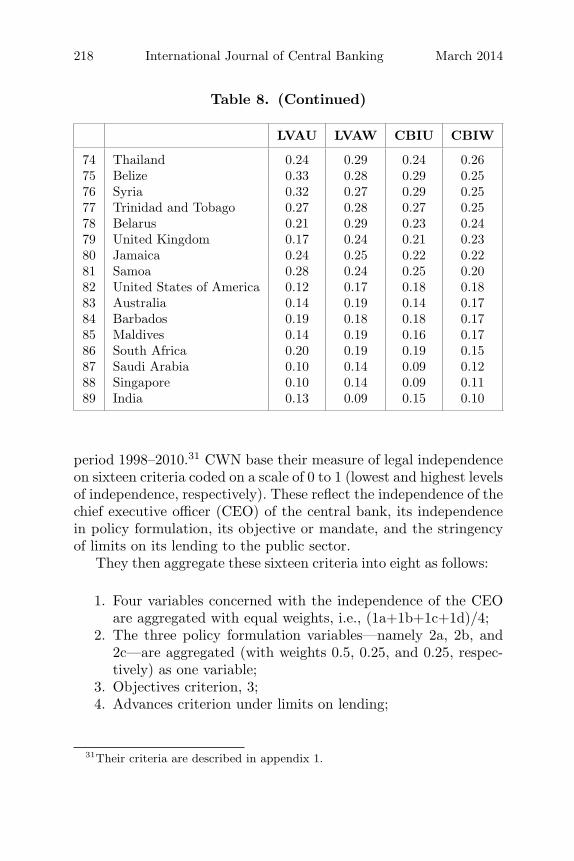
Table 8. (Continued)
LVAU LVAW CBIU CBIW
74 Thailand 0.24 0.29 0.24 0.2675 Belize 0.33 0.28 0.29 0.2576 Syria 0.32 0.27 0.29 0.2577 Trinidad and Tobago 0.27 0.28 0.27 0.2578 Belarus 0.21 0.29 0.23 0.2479 United Kingdom 0.17 0.24 0.21 0.2380 Jamaica 0.24 0.25 0.22 0.2281 Samoa 0.28 0.24 0.25 0.2082 United States of America 0.12 0.17 0.18 0.1883 Australia 0.14 0.19 0.14 0.1784 Barbados 0.19 0.18 0.18 0.1785 Maldives 0.14 0.19 0.16 0.1786 South Africa 0.20 0.19 0.19 0.1587 Saudi Arabia 0.10 0.14 0.09 0.1288 Singapore 0.10 0.14 0.09 0.1189 India 0.13 0.09 0.15 0.10
period 1998–2010.31 CWN base their measure of legal independenceon sixteen criteria coded on a scale of 0 to 1 (lowest and highest levelsof independence, respectively). These reflect the independence of thechief executive officer (CEO) of the central bank, its independencein policy formulation, its objective or mandate, and the stringencyof limits on its lending to the public sector.
They then aggregate these sixteen criteria into eight as follows:
1. Four variables concerned with the independence of the CEOare aggregated with equal weights, i.e., (1a+1b+1c+1d)/4;
2. The three policy formulation variables—namely 2a, 2b, and2c—are aggregated (with weights 0.5, 0.25, and 0.25, respec-tively) as one variable;
3. Objectives criterion, 3;4. Advances criterion under limits on lending;
31Their criteria are described in appendix 1.
Vol. 10 No. 1 Central Bank Transparency and Independence 219
5. Securitized lending criterion under limits on lending;6. Terms of lending criterion under limits on lending;7. Potential borrowers from the bank criterion under limits on
lending;8. Four criteria—4e, 4f, 4g, and 4h—on limits on lending are
aggregated to one by using equal weights, namely (4e+4f+4g+4h)/4.
From these eight aggregated variables, two indices are computed.LVAU is the unweighted average of the eight aggregated variables,whereas LVAW is the weighted average where the weights are givenin appendix 1.
For our two additional summary measures of central bank inde-pendence, we augment Cukierman, Webb, and Neyapti’s criteria byadding other aspects of central bank independence emphasized in thesubsequent literature. We added measures of limits on the reappoint-ment of the CEO, measures of provisions affecting (re)appointmentof other board members similar to those affecting the CEO, restric-tions on government representation on the board, and interven-tion of the government in exchange rate policy formulation.32 Theimportance of rules governing the appointment and dismissal of anentire central bank board, as opposed to just the governor, andrestrictions on government representation on the board were sug-gested by Bade and Parkin (1982), Eijffinger and Schaling (1993),Grilli, Masciandro, and Tabellini (1991), and Jacome and Vazquez(2008). Government intervention in the formulation and conductof foreign exchange policy is emphasized by Jacome and Vazquez(2008). The two additional measures are denoted Central Bank
32The resulting twenty-four criteria are first aggregated into nine criteria asfollows: (1) The five variables regarding appointment of the CEO are aggregatedinto one using equal weights; (2) the four variables under policy formulation areaggregated into one using equal weights; (3) the objectives criterion stands on itsown as number 3; (4–7) the first four criteria on limits on lending are each treatedas a separate variable, (8) the last four criteria on limits on lending are aggregatedinto a single variable using equal weights; and (9) the criteria regarding boardmembers is treated as a single variable. From these nine aggregated variablestwo indices are computed. CBIU is the unweighted average of the nine aggre-gated variables, and CBIW is the corresponding weighted average. The detailedcriteria list and weights used in constructing CBIW are described in appendix 1.
220 International Journal of Central Banking March 2014
Independence Unweighted (CBIU) and Central Bank IndependenceWeighted (CBIW).33
5. Trends in Central Bank Independence
The most independent central banks are those of the Kyrgyz Repub-lic, Latvia, Hungary, Armenia, and Bosnia and Herzegovina (indescending order), according to our LVAU and LVAW indices, andthe Kyrgyz Republic, Latvia, and the euro zone according to CBIUand CBIW. India, Saudi Arabia, Singapore, and the United Statesare the countries with the least independent central banks accord-ing to LVAU and LVAW. The Monetary Authority of Singapore andSaudi Arabian Monetary Agency are not subject to statutory limitson lending to the government, and their policy formulation is notentirely independent of government. The Reserve Bank of India, forits part, receives low scores for (the absence of) restrictions on theappointment of the governor, independence of policy formulation,and possession of an independent objective. The Federal Reserve issimilarly not subject to statutory restrictions on its lending to thegovernment.
Tables 9 and 10 present unweighted and weighted regional inde-pendence indices, respectively. They show that, on average, Europehas the most independent central banks, while Oceania and Ameri-cas have the least.
Figure 4 compares central bank independence in 1998 and 2010according to CBIW, our extended weighted index. The overall trendis in the direction of greater independence. Six central banks—thoseof Iceland, Venezuela, Iraq, Lithuania, Macedonia, and Norway—show especially dramatic increases over the period. Argentina, Aus-tralia, Bulgaria, and Georgia are exceptions to the trend. The lawgoverning the Reserve Bank of Australia was changed in 2002: pre-viously, the governor and board members were appointed by thegovernor general; in 2002 appointment power was given to the treas-urer, who is a minister (member of the executive branch), producinga lower score. Moreover, whereas board members had been appointed
33The four measures of central bank independence are quite highly correlatedwith one another, as shown in appendix 2.
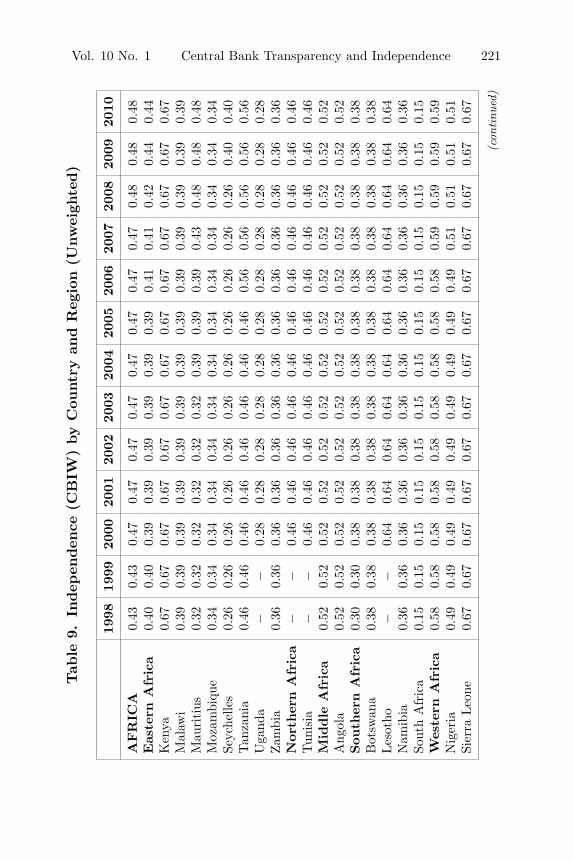
Vol. 10 No. 1 Central Bank Transparency and Independence 221Tab
le9.
Indep
enden
ce(C
BIW
)by
Cou
ntr
yan
dR
egio
n(U
nw
eigh
ted)
1998
1999
2000
2001
2002
2003
2004
2005
2006
2007
2008
2009
2010
AFR
ICA
0.43
0.43
0.47
0.47
0.47
0.47
0.47
0.47
0.47
0.47
0.48
0.48
0.48
Eas
tern
Afr
ica
0.40
0.40
0.39
0.39
0.39
0.39
0.39
0.39
0.41
0.41
0.42
0.44
0.44
Ken
ya0.
670.
670.
670.
670.
670.
670.
670.
670.
670.
670.
670.
670.
67M
alaw
i0.
390.
390.
390.
390.
390.
390.
390.
390.
390.
390.
390.
390.
39M
auri
tius
0.32
0.32
0.32
0.32
0.32
0.32
0.39
0.39
0.39
0.43
0.48
0.48
0.48
Moz
ambi
que
0.34
0.34
0.34
0.34
0.34
0.34
0.34
0.34
0.34
0.34
0.34
0.34
0.34
Seyc
helle
s0.
260.
260.
260.
260.
260.
260.
260.
260.
260.
260.
260.
400.
40Tan
zani
a0.
460.
460.
460.
460.
460.
460.
460.
460.
560.
560.
560.
560.
56U
gand
a−
−0.
280.
280.
280.
280.
280.
280.
280.
280.
280.
280.
28Zam
bia
0.36
0.36
0.36
0.36
0.36
0.36
0.36
0.36
0.36
0.36
0.36
0.36
0.36
Nor
ther
nA
fric
a−
−0.
460.
460.
460.
460.
460.
460.
460.
460.
460.
460.
46Tun
isia
−−
0.46
0.46
0.46
0.46
0.46
0.46
0.46
0.46
0.46
0.46
0.46
Mid
dle
Afr
ica
0.52
0.52
0.52
0.52
0.52
0.52
0.52
0.52
0.52
0.52
0.52
0.52
0.52
Ang
ola
0.52
0.52
0.52
0.52
0.52
0.52
0.52
0.52
0.52
0.52
0.52
0.52
0.52
Sou
ther
nA
fric
a0.
300.
300.
380.
380.
380.
380.
380.
380.
380.
380.
380.
380.
38B
otsw
ana
0.38
0.38
0.38
0.38
0.38
0.38
0.38
0.38
0.38
0.38
0.38
0.38
0.38
Les
otho
−−
0.64
0.64
0.64
0.64
0.64
0.64
0.64
0.64
0.64
0.64
0.64
Nam
ibia
0.36
0.36
0.36
0.36
0.36
0.36
0.36
0.36
0.36
0.36
0.36
0.36
0.36
Sout
hA
fric
a0.
150.
150.
150.
150.
150.
150.
150.
150.
150.
150.
150.
150.
15W
este
rnA
fric
a0.
580.
580.
580.
580.
580.
580.
580.
580.
580.
590.
590.
590.
59N
iger
ia0.
490.
490.
490.
490.
490.
490.
490.
490.
490.
510.
510.
510.
51Si
erra
Leo
ne0.
670.
670.
670.
670.
670.
670.
670.
670.
670.
670.
670.
670.
67
(con
tinu
ed)
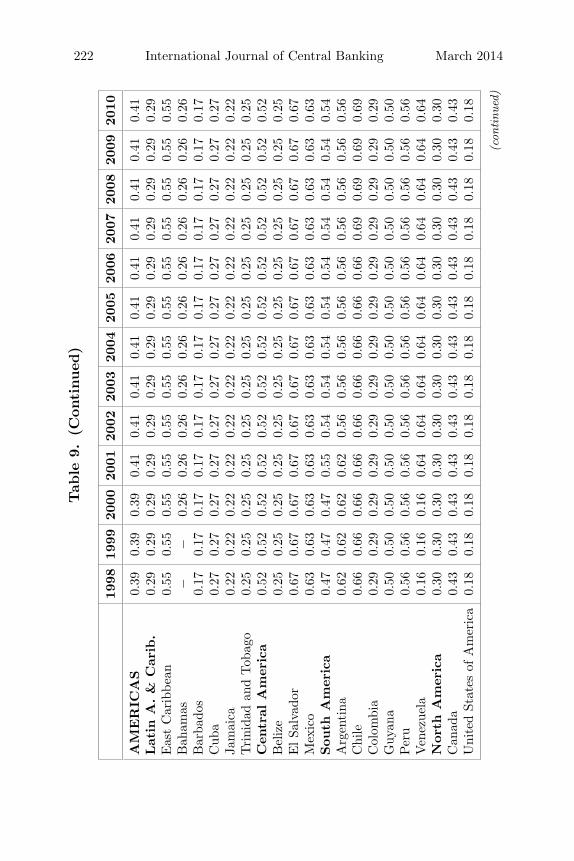
222 International Journal of Central Banking March 2014Tab
le9.
(Con
tinued
)
1998
1999
2000
2001
2002
2003
2004
2005
2006
2007
2008
2009
2010
AM
ER
ICA
S0.
390.
390.
390.
410.
410.
410.
410.
410.
410.
410.
410.
410.
41Lat
inA
.&
Car
ib.
0.29
0.29
0.29
0.29
0.29
0.29
0.29
0.29
0.29
0.29
0.29
0.29
0.29
Eas
tC
arib
bean
0.55
0.55
0.55
0.55
0.55
0.55
0.55
0.55
0.55
0.55
0.55
0.55
0.55
Bah
amas
−−
0.26
0.26
0.26
0.26
0.26
0.26
0.26
0.26
0.26
0.26
0.26
Bar
bado
s0.
170.
170.
170.
170.
170.
170.
170.
170.
170.
170.
170.
170.
17C
uba
0.27
0.27
0.27
0.27
0.27
0.27
0.27
0.27
0.27
0.27
0.27
0.27
0.27
Jam
aica
0.22
0.22
0.22
0.22
0.22
0.22
0.22
0.22
0.22
0.22
0.22
0.22
0.22
Tri
nida
dan
dTob
ago
0.25
0.25
0.25
0.25
0.25
0.25
0.25
0.25
0.25
0.25
0.25
0.25
0.25
Cen
tral
Am
eric
a0.
520.
520.
520.
520.
520.
520.
520.
520.
520.
520.
520.
520.
52B
eliz
e0.
250.
250.
250.
250.
250.
250.
250.
250.
250.
250.
250.
250.
25E
lSa
lvad
or0.
670.
670.
670.
670.
670.
670.
670.
670.
670.
670.
670.
670.
67M
exic
o0.
630.
630.
630.
630.
630.
630.
630.
630.
630.
630.
630.
630.
63Sou
thA
mer
ica
0.47
0.47
0.47
0.55
0.54
0.54
0.54
0.54
0.54
0.54
0.54
0.54
0.54
Arg
enti
na0.
620.
620.
620.
620.
560.
560.
560.
560.
560.
560.
560.
560.
56C
hile
0.66
0.66
0.66
0.66
0.66
0.66
0.66
0.66
0.66
0.69
0.69
0.69
0.69
Col
ombi
a0.
290.
290.
290.
290.
290.
290.
290.
290.
290.
290.
290.
290.
29G
uyan
a0.
500.
500.
500.
500.
500.
500.
500.
500.
500.
500.
500.
500.
50Per
u0.
560.
560.
560.
560.
560.
560.
560.
560.
560.
560.
560.
560.
56V
enez
uela
0.16
0.16
0.16
0.64
0.64
0.64
0.64
0.64
0.64
0.64
0.64
0.64
0.64
Nor
thA
mer
ica
0.30
0.30
0.30
0.30
0.30
0.30
0.30
0.30
0.30
0.30
0.30
0.30
0.30
Can
ada
0.43
0.43
0.43
0.43
0.43
0.43
0.43
0.43
0.43
0.43
0.43
0.43
0.43
Uni
ted
Stat
esof
Am
eric
a0.
180.
180.
180.
180.
180.
180.
180.
180.
180.
180.
180.
180.
18
(con
tinu
ed)
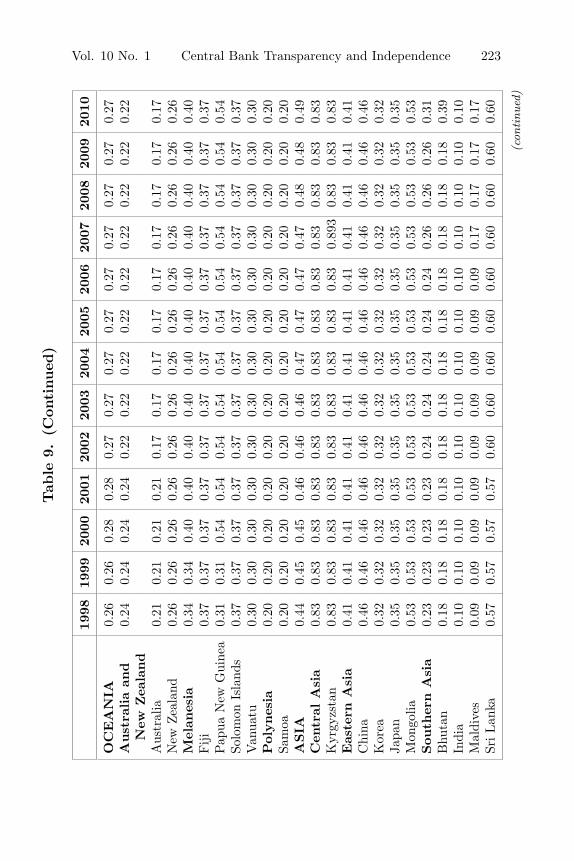
Vol. 10 No. 1 Central Bank Transparency and Independence 223Tab
le9.
(Con
tinued
)
1998
1999
2000
2001
2002
2003
2004
2005
2006
2007
2008
2009
2010
OC
EA
NIA
0.26
0.26
0.28
0.28
0.27
0.27
0.27
0.27
0.27
0.27
0.27
0.27
0.27
Aust
ralia
and
0.24
0.24
0.24
0.24
0.22
0.22
0.22
0.22
0.22
0.22
0.22
0.22
0.22
New
Zea
land
Aus
tral
ia0.
210.
210.
210.
210.
170.
170.
170.
170.
170.
170.
170.
170.
17N
ewZea
land
0.26
0.26
0.26
0.26
0.26
0.26
0.26
0.26
0.26
0.26
0.26
0.26
0.26
Mel
anes
ia0.
340.
340.
400.
400.
400.
400.
400.
400.
400.
400.
400.
400.
40Fiji
0.37
0.37
0.37
0.37
0.37
0.37
0.37
0.37
0.37
0.37
0.37
0.37
0.37
Pap
uaN
ewG
uine
a0.
310.
310.
540.
540.
540.
540.
540.
540.
540.
540.
540.
540.
54So
lom
onIs
land
s0.
370.
370.
370.
370.
370.
370.
370.
370.
370.
370.
370.
370.
37V
anua
tu0.
300.
300.
300.
300.
300.
300.
300.
300.
300.
300.
300.
300.
30Pol
ynes
ia0.
200.
200.
200.
200.
200.
200.
200.
200.
200.
200.
200.
200.
20Sa
moa
0.20
0.20
0.20
0.20
0.20
0.20
0.20
0.20
0.20
0.20
0.20
0.20
0.20
ASIA
0.44
0.45
0.45
0.46
0.46
0.46
0.47
0.47
0.47
0.47
0.48
0.48
0.49
Cen
tral
Asi
a0.
830.
830.
830.
830.
830.
830.
830.
830.
830.
830.
830.
830.
83K
yrgy
zsta
n0.
830.
830.
830.
830.
830.
830.
830.
830.
830.
893
0.83
0.83
0.83
Eas
tern
Asi
a0.
410.
410.
410.
410.
410.
410.
410.
410.
410.
410.
410.
410.
41C
hina
0.46
0.46
0.46
0.46
0.46
0.46
0.46
0.46
0.46
0.46
0.46
0.46
0.46
Kor
ea0.
320.
320.
320.
320.
320.
320.
320.
320.
320.
320.
320.
320.
32Ja
pan
0.35
0.35
0.35
0.35
0.35
0.35
0.35
0.35
0.35
0.35
0.35
0.35
0.35
Mon
golia
0.53
0.53
0.53
0.53
0.53
0.53
0.53
0.53
0.53
0.53
0.53
0.53
0.53
Sou
ther
nA
sia
0.23
0.23
0.23
0.23
0.24
0.24
0.24
0.24
0.24
0.26
0.26
0.26
0.31
Bhu
tan
0.18
0.18
0.18
0.18
0.18
0.18
0.18
0.18
0.18
0.18
0.18
0.18
0.39
Indi
a0.
100.
100.
100.
100.
100.
100.
100.
100.
100.
100.
100.
100.
10M
aldi
ves
0.09
0.09
0.09
0.09
0.09
0.09
0.09
0.09
0.09
0.17
0.17
0.17
0.17
SriLan
ka0.
570.
570.
570.
570.
600.
600.
600.
600.
600.
600.
600.
600.
60
(con
tinu
ed)
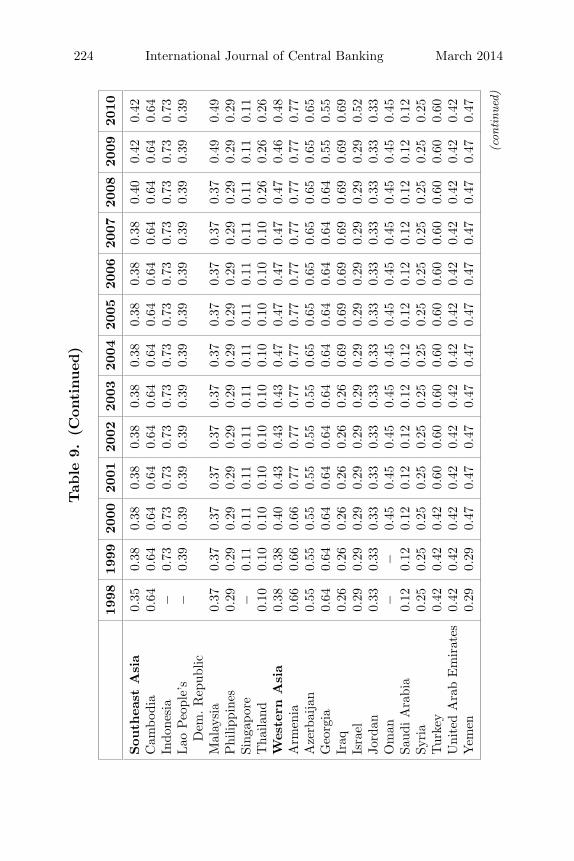
224 International Journal of Central Banking March 2014Tab
le9.
(Con
tinued
)
1998
1999
2000
2001
2002
2003
2004
2005
2006
2007
2008
2009
2010
Sou
thea
stA
sia
0.35
0.38
0.38
0.38
0.38
0.38
0.38
0.38
0.38
0.38
0.40
0.42
0.42
Cam
bodi
a0.
640.
640.
640.
640.
640.
640.
640.
640.
640.
640.
640.
640.
64In
done
sia
−0.
730.
730.
730.
730.
730.
730.
730.
730.
730.
730.
730.
73Lao
Peo
ple’
s−
0.39
0.39
0.39
0.39
0.39
0.39
0.39
0.39
0.39
0.39
0.39
0.39
Dem
.R
epub
licM
alay
sia
0.37
0.37
0.37
0.37
0.37
0.37
0.37
0.37
0.37
0.37
0.37
0.49
0.49
Phi
lippi
nes
0.29
0.29
0.29
0.29
0.29
0.29
0.29
0.29
0.29
0.29
0.29
0.29
0.29
Sing
apor
e−
0.11
0.11
0.11
0.11
0.11
0.11
0.11
0.11
0.11
0.11
0.11
0.11
Tha
iland
0.10
0.10
0.10
0.10
0.10
0.10
0.10
0.10
0.10
0.10
0.26
0.26
0.26
Wes
tern
Asi
a0.
380.
380.
400.
430.
430.
430.
470.
470.
470.
470.
470.
460.
48A
rmen
ia0.
660.
660.
660.
770.
770.
770.
770.
770.
770.
770.
770.
770.
77A
zerb
aija
n0.
550.
550.
550.
550.
550.
550.
650.
650.
650.
650.
650.
650.
65G
eorg
ia0.
640.
640.
640.
640.
640.
640.
640.
640.
640.
640.
640.
550.
55Ir
aq0.
260.
260.
260.
260.
260.
260.
690.
690.
690.
690.
690.
690.
69Is
rael
0.29
0.29
0.29
0.29
0.29
0.29
0.29
0.29
0.29
0.29
0.29
0.29
0.52
Jord
an0.
330.
330.
330.
330.
330.
330.
330.
330.
330.
330.
330.
330.
33O
man
−−
0.45
0.45
0.45
0.45
0.45
0.45
0.45
0.45
0.45
0.45
0.45
Saud
iA
rabi
a0.
120.
120.
120.
120.
120.
120.
120.
120.
120.
120.
120.
120.
12Sy
ria
0.25
0.25
0.25
0.25
0.25
0.25
0.25
0.25
0.25
0.25
0.25
0.25
0.25
Tur
key
0.42
0.42
0.42
0.60
0.60
0.60
0.60
0.60
0.60
0.60
0.60
0.60
0.60
Uni
ted
Ara
bE
mir
ates
0.42
0.42
0.42
0.42
0.42
0.42
0.42
0.42
0.42
0.42
0.42
0.42
0.42
Yem
en0.
290.
290.
470.
470.
470.
470.
470.
470.
470.
470.
470.
470.
47
(con
tinu
ed)
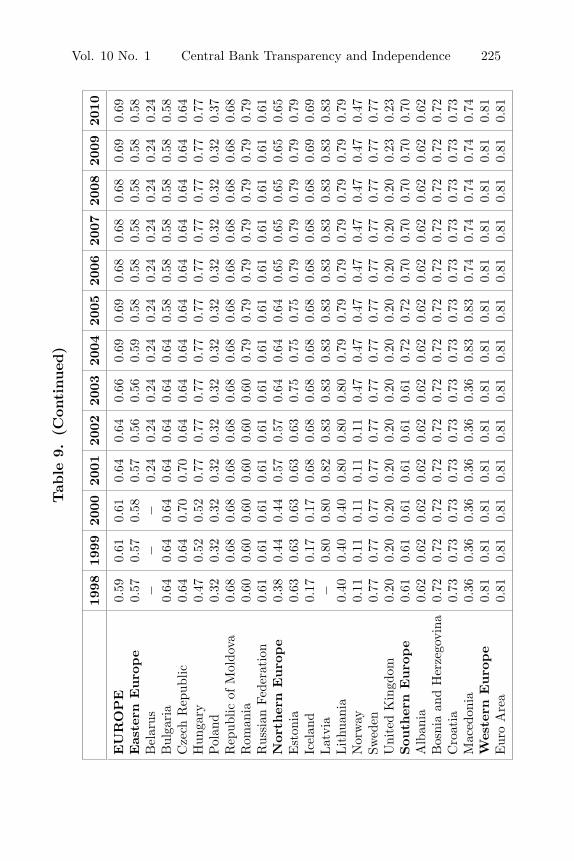
Vol. 10 No. 1 Central Bank Transparency and Independence 225Tab
le9.
(Con
tinued
)
1998
1999
2000
2001
2002
2003
2004
2005
2006
2007
2008
2009
2010
EU
RO
PE
0.59
0.61
0.61
0.64
0.64
0.66
0.69
0.69
0.68
0.68
0.68
0.69
0.69
Eas
tern
Euro
pe
0.57
0.57
0.58
0.57
0.56
0.56
0.59
0.58
0.58
0.58
0.58
0.58
0.58
Bel
arus
−−
−0.
240.
240.
240.
240.
240.
240.
240.
240.
240.
24B
ulga
ria
0.64
0.64
0.64
0.64
0.64
0.64
0.64
0.58
0.58
0.58
0.58
0.58
0.58
Cze
chR
epub
lic0.
640.
640.
700.
700.
640.
640.
640.
640.
640.
640.
640.
640.
64H
unga
ry0.
470.
520.
520.
770.
770.
770.
770.
770.
770.
770.
770.
770.
77Pol
and
0.32
0.32
0.32
0.32
0.32
0.32
0.32
0.32
0.32
0.32
0.32
0.32
0.37
Rep
ublic
ofM
oldo
va0.
680.
680.
680.
680.
680.
680.
680.
680.
680.
680.
680.
680.
68R
oman
ia0.
600.
600.
600.
600.
600.
600.
790.
790.
790.
790.
790.
790.
79R
ussi
anFe
dera
tion
0.61
0.61
0.61
0.61
0.61
0.61
0.61
0.61
0.61
0.61
0.61
0.61
0.61
Nor
ther
nEuro
pe
0.38
0.44
0.44
0.57
0.57
0.64
0.64
0.64
0.65
0.65
0.65
0.65
0.65
Est
onia
0.63
0.63
0.63
0.63
0.63
0.75
0.75
0.75
0.79
0.79
0.79
0.79
0.79
Icel
and
0.17
0.17
0.17
0.68
0.68
0.68
0.68
0.68
0.68
0.68
0.68
0.69
0.69
Lat
via
−0.
800.
800.
820.
830.
830.
830.
830.
830.
830.
830.
830.
83Lit
huan
ia0.
400.
400.
400.
800.
800.
800.
790.
790.
790.
790.
790.
790.
79N
orw
ay0.
110.
110.
110.
110.
110.
470.
470.
470.
470.
470.
470.
470.
47Sw
eden
0.77
0.77
0.77
0.77
0.77
0.77
0.77
0.77
0.77
0.77
0.77
0.77
0.77
Uni
ted
Kin
gdom
0.20
0.20
0.20
0.20
0.20
0.20
0.20
0.20
0.20
0.20
0.20
0.23
0.23
Sou
ther
nEuro
pe
0.61
0.61
0.61
0.61
0.61
0.61
0.72
0.72
0.70
0.70
0.70
0.70
0.70
Alb
ania
0.62
0.62
0.62
0.62
0.62
0.62
0.62
0.62
0.62
0.62
0.62
0.62
0.62
Bos
nia
and
Her
zego
vina
0.72
0.72
0.72
0.72
0.72
0.72
0.72
0.72
0.72
0.72
0.72
0.72
0.72
Cro
atia
0.73
0.73
0.73
0.73
0.73
0.73
0.73
0.73
0.73
0.73
0.73
0.73
0.73
Mac
edon
ia0.
360.
360.
360.
360.
360.
360.
830.
830.
740.
740.
740.
740.
74W
este
rnEuro
pe
0.81
0.81
0.81
0.81
0.81
0.81
0.81
0.81
0.81
0.81
0.81
0.81
0.81
Eur
oA
rea
0.81
0.81
0.81
0.81
0.81
0.81
0.81
0.81
0.81
0.81
0.81
0.81
0.81
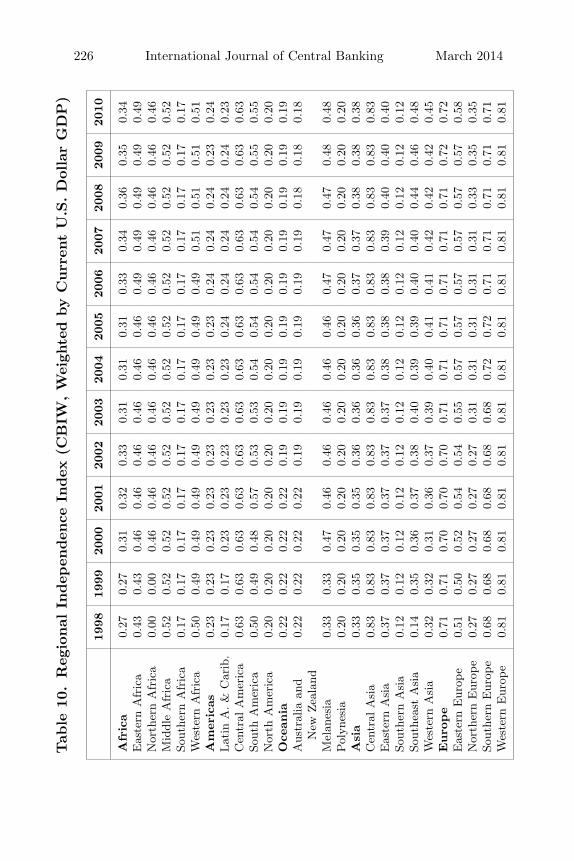
226 International Journal of Central Banking March 2014Tab
le10
.R
egio
nal
Indep
enden
ceIn
dex
(CB
IW,W
eigh
ted
by
Curr
ent
U.S
.D
olla
rG
DP
)
1998
1999
2000
2001
2002
2003
2004
2005
2006
2007
2008
2009
2010
Afr
ica
0.27
0.27
0.31
0.32
0.33
0.31
0.31
0.31
0.33
0.34
0.36
0.35
0.34
Eas
tern
Afr
ica
0.43
0.43
0.46
0.46
0.46
0.46
0.46
0.46
0.49
0.49
0.49
0.49
0.49
Nor
ther
nA
fric
a0.
000.
000.
460.
460.
460.
460.
460.
460.
460.
460.
460.
460.
46M
iddl
eA
fric
a0.
520.
520.
520.
520.
520.
520.
520.
520.
520.
520.
520.
520.
52So
uthe
rnA
fric
a0.
170.
170.
170.
170.
170.
170.
170.
170.
170.
170.
170.
170.
17W
este
rnA
fric
a0.
500.
490.
490.
490.
490.
490.
490.
490.
490.
510.
510.
510.
51A
mer
icas
0.23
0.23
0.23
0.23
0.23
0.23
0.23
0.23
0.24
0.24
0.24
0.23
0.24
Lat
inA
.&
Car
ib.
0.17
0.17
0.23
0.23
0.23
0.23
0.23
0.24
0.24
0.24
0.24
0.24
0.23
Cen
tral
Am
eric
a0.
630.
630.
630.
630.
630.
630.
630.
630.
630.
630.
630.
630.
63So
uth
Am
eric
a0.
500.
490.
480.
570.
530.
530.
540.
540.
540.
540.
540.
550.
55N
orth
Am
eric
a0.
200.
200.
200.
200.
200.
200.
200.
200.
200.
200.
200.
200.
20O
cean
ia0.
220.
220.
220.
220.
190.
190.
190.
190.
190.
190.
190.
190.
19A
ustr
alia
and
0.22
0.22
0.22
0.22
0.19
0.19
0.19
0.19
0.19
0.19
0.18
0.18
0.18
New
Zea
land
Mel
anes
ia0.
330.
330.
470.
460.
460.
460.
460.
460.
470.
470.
470.
480.
48Pol
ynes
ia0.
200.
200.
200.
200.
200.
200.
200.
200.
200.
200.
200.
200.
20A
sia
0.33
0.35
0.35
0.35
0.36
0.36
0.36
0.36
0.37
0.37
0.38
0.38
0.38
Cen
tral
Asi
a0.
830.
830.
830.
830.
830.
830.
830.
830.
830.
830.
830.
830.
83E
aste
rnA
sia
0.37
0.37
0.37
0.37
0.37
0.37
0.38
0.38
0.38
0.39
0.40
0.40
0.40
Sout
hern
Asi
a0.
120.
120.
120.
120.
120.
120.
120.
120.
120.
120.
120.
120.
12So
uthe
ast
Asi
a0.
140.
350.
360.
370.
380.
400.
390.
390.
400.
400.
440.
460.
48W
este
rnA
sia
0.32
0.32
0.31
0.36
0.37
0.39
0.40
0.41
0.41
0.42
0.42
0.42
0.45
Euro
pe
0.71
0.71
0.70
0.70
0.70
0.71
0.71
0.71
0.71
0.71
0.71
0.72
0.72
Eas
tern
Eur
ope
0.51
0.50
0.52
0.54
0.54
0.55
0.57
0.57
0.57
0.57
0.57
0.57
0.58
Nor
ther
nE
urop
e0.
270.
270.
270.
270.
270.
310.
310.
310.
310.
310.
330.
350.
35So
uthe
rnE
urop
e0.
680.
680.
680.
680.
680.
680.
720.
720.
710.
710.
710.
710.
71W
este
rnE
urop
e0.
810.
810.
810.
810.
810.
810.
810.
810.
810.
810.
810.
810.
81
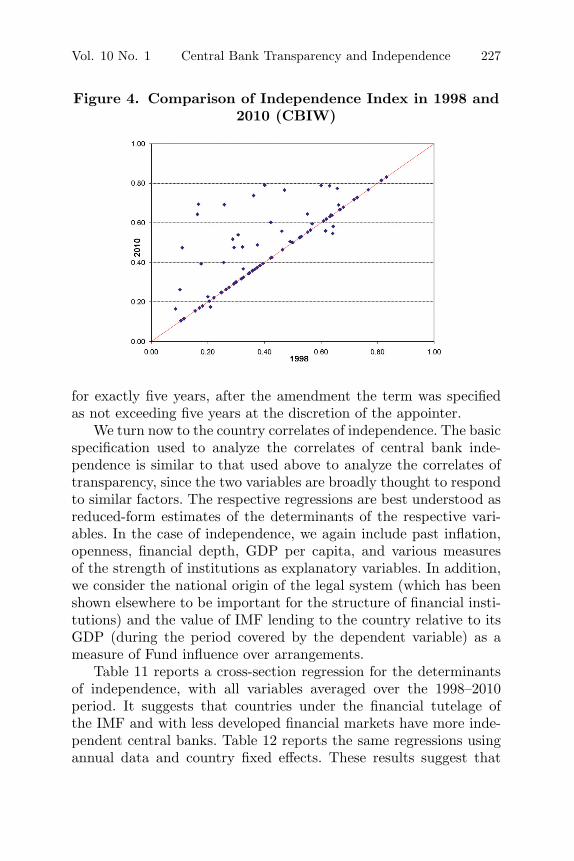
Vol. 10 No. 1 Central Bank Transparency and Independence 227
Figure 4. Comparison of Independence Index in 1998 and2010 (CBIW)
for exactly five years, after the amendment the term was specifiedas not exceeding five years at the discretion of the appointer.
We turn now to the country correlates of independence. The basicspecification used to analyze the correlates of central bank inde-pendence is similar to that used above to analyze the correlates oftransparency, since the two variables are broadly thought to respondto similar factors. The respective regressions are best understood asreduced-form estimates of the determinants of the respective vari-ables. In the case of independence, we again include past inflation,openness, financial depth, GDP per capita, and various measuresof the strength of institutions as explanatory variables. In addition,we consider the national origin of the legal system (which has beenshown elsewhere to be important for the structure of financial insti-tutions) and the value of IMF lending to the country relative to itsGDP (during the period covered by the dependent variable) as ameasure of Fund influence over arrangements.
Table 11 reports a cross-section regression for the determinantsof independence, with all variables averaged over the 1998–2010period. It suggests that countries under the financial tutelage ofthe IMF and with less developed financial markets have more inde-pendent central banks. Table 12 reports the same regressions usingannual data and country fixed effects. These results suggest that
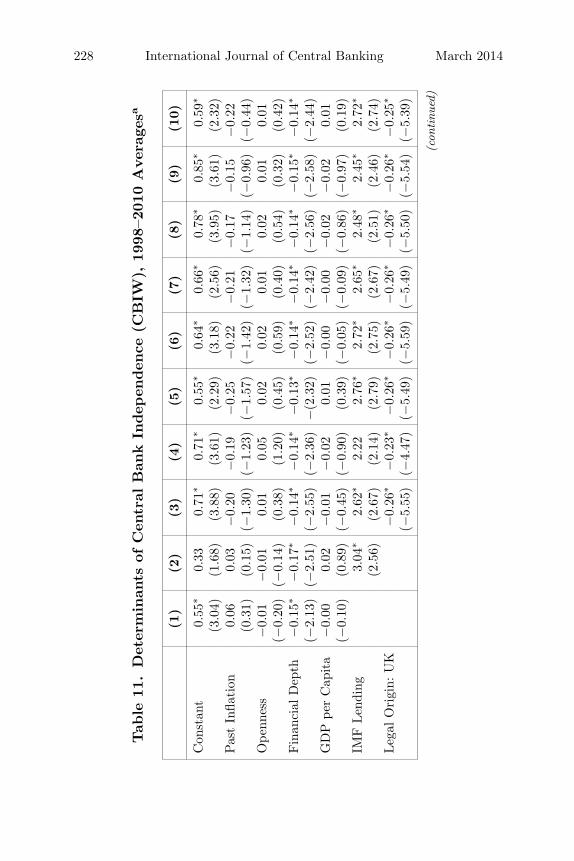
228 International Journal of Central Banking March 2014
Tab
le11
.D
eter
min
ants
ofC
entr
alB
ank
Indep
enden
ce(C
BIW
),19
98–2
010
Ave
rage
sa
(1)
(2)
(3)
(4)
(5)
(6)
(7)
(8)
(9)
(10)
Con
stan
t0.
55∗
0.33
0.71
∗0.
71∗
0.55
∗0.
64∗
0.66
∗0.
78∗
0.85
∗0.
59∗
(3.0
4)(1
.68)
(3.8
8)(3
.61)
(2.2
9)(3
.18)
(2.5
6)(3
.95)
(3.6
1)(2
.32)
Pas
tIn
flati
on0.
060.
03−
0.20
−0.
19−
0.25
−0.
22−
0.21
−0.
17−
0.15
−0.
22(0
.31)
(0.1
5)(−
1.30
)(−
1.23
)(−
1.57
)(−
1.42
)(−
1.32
)(−
1.14
)(−
0.96
)(−
0.44
)O
penn
ess
−0.
01−
0.01
0.01
0.05
0.02
0.02
0.01
0.02
0.01
0.01
(−0.
20)
(−0.
14)
(0.3
8)(1
.20)
(0.4
5)(0
.59)
(0.4
0)(0
.54)
(0.3
2)(0
.42)
Fin
anci
alD
epth
−0.
15∗
−0.
17∗
−0.
14∗
−0.
14∗
−0.
13∗
−0.
14∗
−0.
14∗
−0.
14∗
−0.
15∗
−0.
14∗
(−2.
13)
(−2.
51)
(−2.
55)
(−2.
36)
−(2
.32)
(−2.
52)
(−2.
42)
(−2.
56)
(−2.
58)
(−2.
44)
GD
Ppe
rC
apit
a−
0.00
0.02
−0.
01−
0.02
0.01
−0.
00−
0.00
−0.
02−
0.02
0.01
(−0.
10)
(0.8
9)(−
0.45
)(−
0.90
)(0
.39)
(−0.
05)
(−0.
09)
(−0.
86)
(−0.
97)
(0.1
9)IM
FLen
ding
3.04
∗2.
62∗
2.22
2.76
∗2.
72∗
2.65
∗2.
48∗
2.45
∗2.
72∗
(2.5
6)(2
.67)
(2.1
4)(2
.79)
(2.7
5)(2
.67)
(2.5
1)(2
.46)
(2.7
4)Leg
alO
rigi
n:U
K−
0.26
∗−
0.23
∗−
0.26
∗−
0.26
∗−
0.26
∗−
0.26
∗−
0.26
∗−
0.25
∗
(−5.
55)
(−4.
47)
(−5.
49)
(−5.
59)
(−5.
49)
(−5.
50)
(−5.
54)
(−5.
39)
(con
tinu
ed)
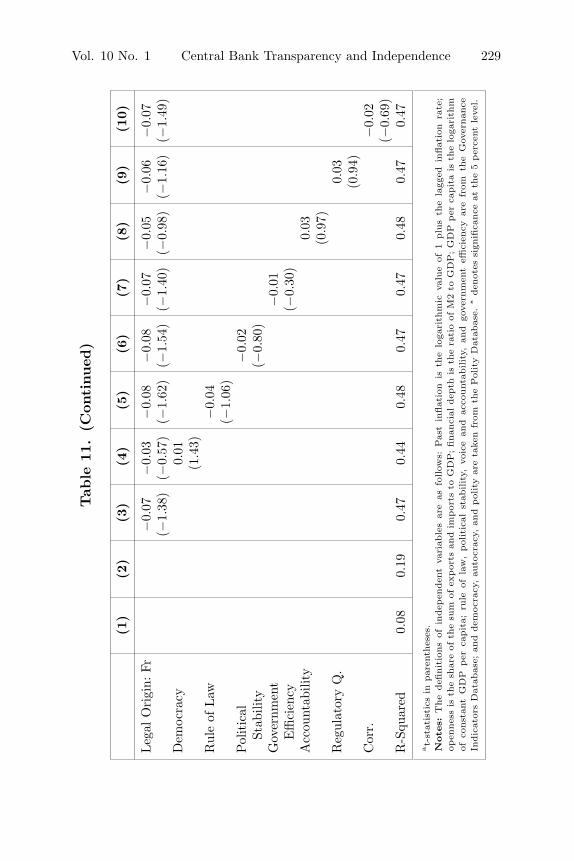
Vol. 10 No. 1 Central Bank Transparency and Independence 229
Tab
le11
.(C
ontinued
)
(1)
(2)
(3)
(4)
(5)
(6)
(7)
(8)
(9)
(10)
Leg
alO
rigi
n:Fr
−0.
07−
0.03
−0.
08−
0.08
−0.
07−
0.05
−0.
06−
0.07
(−1.
38)
(−0.
57)
(−1.
62)
(−1.
54)
(−1.
40)
(−0.
98)
(−1.
16)
(−1.
49)
Dem
ocra
cy0.
01(1
.43)
Rul
eof
Law
−0.
04(−
1.06
)Pol
itic
al−
0.02
Stab
ility
(−0.
80)
Gov
ernm
ent
−0.
01E
ffici
ency
(−0.
30)
Acc
ount
abili
ty0.
03(0
.97)
Reg
ulat
ory
Q.
0.03
(0.9
4)C
orr.
−0.
02(−
0.69
)R
-Squ
ared
0.08
0.19
0.47
0.44
0.48
0.47
0.47
0.48
0.47
0.47
at-
stat
isti
csin
par
enth
eses
.N
ote
s:T
he
defi
nit
ions
ofin
dep
enden
tva
riab
les
are
asfo
llow
s:Pas
tin
flat
ion
isth
elo
gari
thm
icva
lue
of1
plu
sth
ela
gged
inflat
ion
rate
;op
ennes
sis
the
shar
eof
the
sum
ofex
por
tsan
dim
por
tsto
GD
P;finan
cial
dep
this
the
rati
oof
M2
toG
DP;G
DP
per
capit
ais
the
loga
rith
mof
const
ant
GD
Pper
capit
a;ru
leof
law
,pol
itic
alst
ability,
voic
ean
dac
count
ability,
and
gove
rnm
ent
effici
ency
are
from
the
Gov
ernan
ceIn
dic
ator
sD
atab
ase;
and
dem
ocra
cy,au
tocr
acy,
and
pol
ity
are
take
nfr
omth
ePol
ity
Dat
abas
e.∗
den
otes
sign
ifica
nce
atth
e5
per
cent
leve
l.
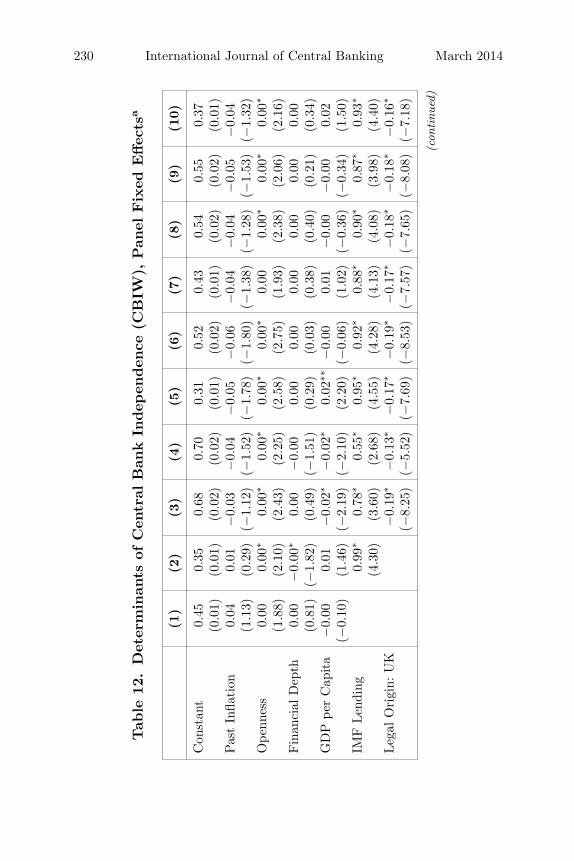
230 International Journal of Central Banking March 2014
Tab
le12
.D
eter
min
ants
ofC
entr
alB
ank
Indep
enden
ce(C
BIW
),Pan
elFix
edEffec
tsa
(1)
(2)
(3)
(4)
(5)
(6)
(7)
(8)
(9)
(10)
Con
stan
t0.
450.
350.
680.
700.
310.
520.
430.
540.
550.
37(0
.01)
(0.0
1)(0
.02)
(0.0
2)(0
.01)
(0.0
2)(0
.01)
(0.0
2)(0
.02)
(0.0
1)Pas
tIn
flati
on0.
040.
01−
0.03
−0.
04−
0.05
−0.
06−
0.04
−0.
04−
0.05
−0.
04(1
.13)
(0.2
9)(−
1.12
)(−
1.52
)(−
1.78
)(−
1.80
)(−
1.38
)(−
1.28
)(−
1.53
)(−
1.32
)O
penn
ess
0.00
0.00
∗0.
00∗
0.00
∗0.
00∗
0.00
∗0.
000.
00∗
0.00
∗0.
00∗
(1.8
8)(2
.10)
(2.4
3)(2
.25)
(2.5
8)(2
.75)
(1.9
3)(2
.38)
(2.0
6)(2
.16)
Fin
anci
alD
epth
0.00
−0.
00∗
0.00
−0.
000.
000.
000.
000.
000.
000.
00(0
.81)
(−1.
82)
(0.4
9)(−
1.51
)(0
.29)
(0.0
3)(0
.38)
(0.4
0)(0
.21)
(0.3
4)G
DP
per
Cap
ita
−0.
000.
01−
0.02
∗−
0.02
∗0.
02∗∗
−0.
000.
01−
0.00
−0.
000.
02(−
0.10
)(1
.46)
(−2.
19)
(−2.
10)
(2.2
0)(−
0.06
)(1
.02)
(−0.
36)
(−0.
34)
(1.5
0)IM
FLen
ding
0.99
∗0.
78∗
0.55
∗0.
95∗
0.92
∗0.
88∗
0.90
∗0.
87∗
0.93
∗
(4.3
0)(3
.60)
(2.6
8)(4
.55)
(4.2
8)(4
.13)
(4.0
8)(3
.98)
(4.4
0)Leg
alO
rigi
n:U
K−
0.19
∗−
0.13
∗−
0.17
∗−
0.19
∗−
0.17
∗−
0.18
∗−
0.18
∗−
0.16
∗
(−8.
25)
(−5.
52)
(−7.
69)
(−8.
53)
(−7.
57)
(−7.
65)
(−8.
08)
(−7.
18)
(con
tinu
ed)
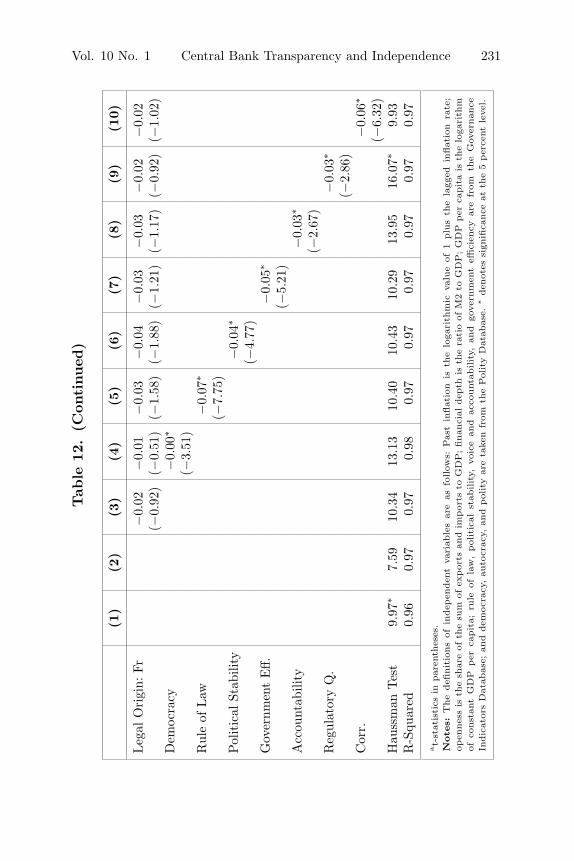
Vol. 10 No. 1 Central Bank Transparency and Independence 231
Tab
le12
.(C
ontinued
)
(1)
(2)
(3)
(4)
(5)
(6)
(7)
(8)
(9)
(10)
Leg
alO
rigi
n:Fr
−0.
02−
0.01
−0.
03−
0.04
−0.
03−
0.03
−0.
02−
0.02
(−0.
92)
(−0.
51)
(−1.
58)
(−1.
88)
(−1.
21)
(−1.
17)
(−0.
92)
(−1.
02)
Dem
ocra
cy−
0.00
∗
(−3.
51)
Rul
eof
Law
−0.
07∗
(−7.
75)
Pol
itic
alSt
abili
ty−
0.04
∗
(−4.
77)
Gov
ernm
ent
Eff.
−0.
05∗
(−5.
21)
Acc
ount
abili
ty−
0.03
∗
(−2.
67)
Reg
ulat
ory
Q.
−0.
03∗
(−2.
86)
Cor
r.−
0.06
∗
(−6.
32)
Hau
ssm
anTes
t9.
97∗
7.59
10.3
413
.13
10.4
010
.43
10.2
913
.95
16.0
7∗9.
93R
-Squ
ared
0.96
0.97
0.97
0.98
0.97
0.97
0.97
0.97
0.97
0.97
at-
stat
isti
csin
par
enth
eses
.N
ote
s:T
he
defi
nit
ions
ofin
dep
enden
tva
riab
les
are
asfo
llow
s:Pas
tin
flat
ion
isth
elo
gari
thm
icva
lue
of1
plu
sth
ela
gged
inflat
ion
rate
;op
ennes
sis
the
shar
eof
the
sum
ofex
por
tsan
dim
por
tsto
GD
P;finan
cial
dep
this
the
rati
oof
M2
toG
DP;G
DP
per
capit
ais
the
loga
rith
mof
const
ant
GD
Pper
capit
a;ru
leof
law
,pol
itic
alst
ability,
voic
ean
dac
count
ability,
and
gove
rnm
ent
effici
ency
are
from
the
Gov
ernan
ceIn
dic
ator
sD
atab
ase;
and
dem
ocra
cy,au
tocr
acy,
and
pol
ity
are
take
nfr
omth
ePol
ity
Dat
abas
e.∗
den
otes
sign
ifica
nce
atth
e5
per
cent
leve
l.
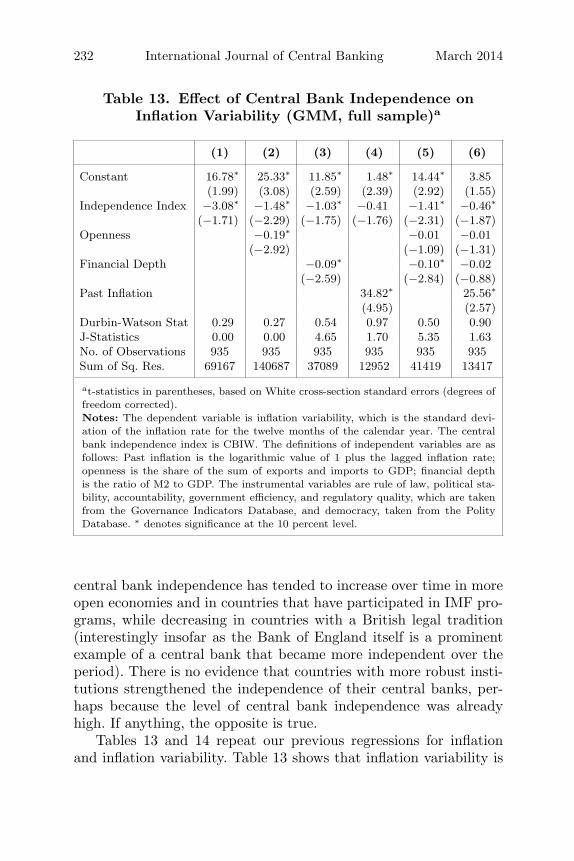
232 International Journal of Central Banking March 2014
Table 13. Effect of Central Bank Independence onInflation Variability (GMM, full sample)a
(1) (2) (3) (4) (5) (6)
Constant 16.78∗ 25.33∗ 11.85∗ 1.48∗ 14.44∗ 3.85(1.99) (3.08) (2.59) (2.39) (2.92) (1.55)
Independence Index −3.08∗ −1.48∗ −1.03∗ −0.41 −1.41∗ −0.46∗
(−1.71) (−2.29) (−1.75) (−1.76) (−2.31) (−1.87)Openness −0.19∗ −0.01 −0.01
(−2.92) (−1.09) (−1.31)Financial Depth −0.09∗ −0.10∗ −0.02
(−2.59) (−2.84) (−0.88)Past Inflation 34.82∗ 25.56∗
(4.95) (2.57)Durbin-Watson Stat 0.29 0.27 0.54 0.97 0.50 0.90J-Statistics 0.00 0.00 4.65 1.70 5.35 1.63No. of Observations 935 935 935 935 935 935Sum of Sq. Res. 69167 140687 37089 12952 41419 13417
at-statistics in parentheses, based on White cross-section standard errors (degrees offreedom corrected).Notes: The dependent variable is inflation variability, which is the standard devi-ation of the inflation rate for the twelve months of the calendar year. The centralbank independence index is CBIW. The definitions of independent variables are asfollows: Past inflation is the logarithmic value of 1 plus the lagged inflation rate;openness is the share of the sum of exports and imports to GDP; financial depthis the ratio of M2 to GDP. The instrumental variables are rule of law, political sta-bility, accountability, government efficiency, and regulatory quality, which are takenfrom the Governance Indicators Database, and democracy, taken from the PolityDatabase. ∗ denotes significance at the 10 percent level.
central bank independence has tended to increase over time in moreopen economies and in countries that have participated in IMF pro-grams, while decreasing in countries with a British legal tradition(interestingly insofar as the Bank of England itself is a prominentexample of a central bank that became more independent over theperiod). There is no evidence that countries with more robust insti-tutions strengthened the independence of their central banks, per-haps because the level of central bank independence was alreadyhigh. If anything, the opposite is true.
Tables 13 and 14 repeat our previous regressions for inflationand inflation variability. Table 13 shows that inflation variability is
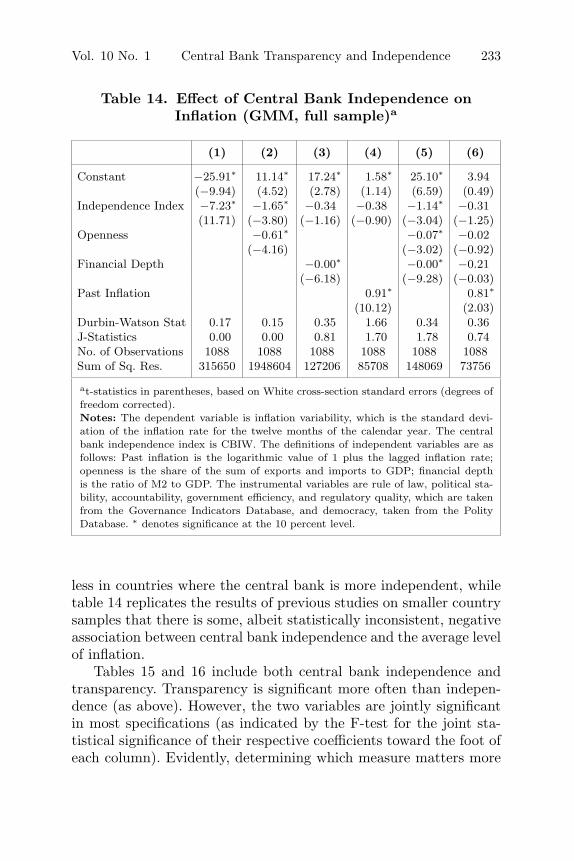
Vol. 10 No. 1 Central Bank Transparency and Independence 233
Table 14. Effect of Central Bank Independence onInflation (GMM, full sample)a
(1) (2) (3) (4) (5) (6)
Constant −25.91∗ 11.14∗ 17.24∗ 1.58∗ 25.10∗ 3.94(−9.94) (4.52) (2.78) (1.14) (6.59) (0.49)
Independence Index −7.23∗ −1.65∗ −0.34 −0.38 −1.14∗ −0.31(11.71) (−3.80) (−1.16) (−0.90) (−3.04) (−1.25)
Openness −0.61∗ −0.07∗ −0.02(−4.16) (−3.02) (−0.92)
Financial Depth −0.00∗ −0.00∗ −0.21(−6.18) (−9.28) (−0.03)
Past Inflation 0.91∗ 0.81∗
(10.12) (2.03)Durbin-Watson Stat 0.17 0.15 0.35 1.66 0.34 0.36J-Statistics 0.00 0.00 0.81 1.70 1.78 0.74No. of Observations 1088 1088 1088 1088 1088 1088Sum of Sq. Res. 315650 1948604 127206 85708 148069 73756
at-statistics in parentheses, based on White cross-section standard errors (degrees offreedom corrected).Notes: The dependent variable is inflation variability, which is the standard devi-ation of the inflation rate for the twelve months of the calendar year. The centralbank independence index is CBIW. The definitions of independent variables are asfollows: Past inflation is the logarithmic value of 1 plus the lagged inflation rate;openness is the share of the sum of exports and imports to GDP; financial depthis the ratio of M2 to GDP. The instrumental variables are rule of law, political sta-bility, accountability, government efficiency, and regulatory quality, which are takenfrom the Governance Indicators Database, and democracy, taken from the PolityDatabase. ∗ denotes significance at the 10 percent level.
less in countries where the central bank is more independent, whiletable 14 replicates the results of previous studies on smaller countrysamples that there is some, albeit statistically inconsistent, negativeassociation between central bank independence and the average levelof inflation.
Tables 15 and 16 include both central bank independence andtransparency. Transparency is significant more often than indepen-dence (as above). However, the two variables are jointly significantin most specifications (as indicated by the F-test for the joint sta-tistical significance of their respective coefficients toward the foot ofeach column). Evidently, determining which measure matters more
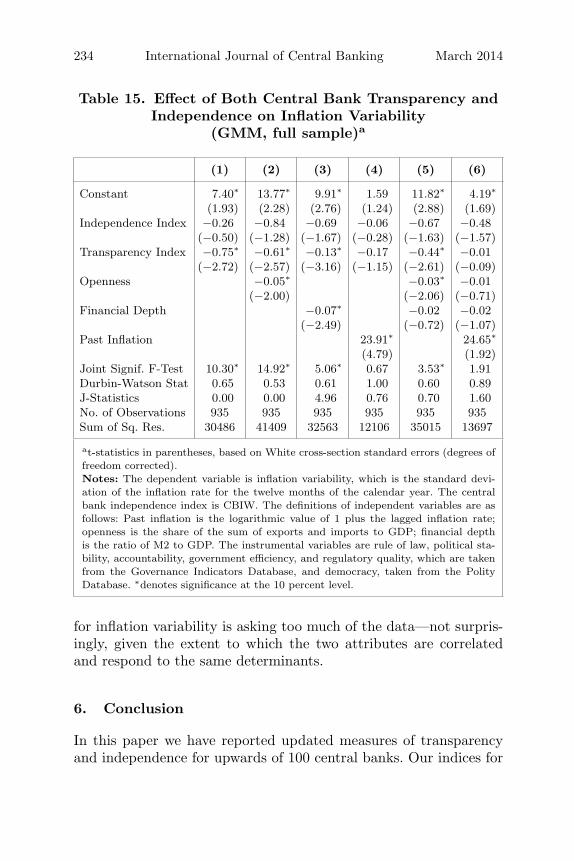
234 International Journal of Central Banking March 2014
Table 15. Effect of Both Central Bank Transparency andIndependence on Inflation Variability
(GMM, full sample)a
(1) (2) (3) (4) (5) (6)
Constant 7.40∗ 13.77∗ 9.91∗ 1.59 11.82∗ 4.19∗
(1.93) (2.28) (2.76) (1.24) (2.88) (1.69)Independence Index −0.26 −0.84 −0.69 −0.06 −0.67 −0.48
(−0.50) (−1.28) (−1.67) (−0.28) (−1.63) (−1.57)Transparency Index −0.75∗ −0.61∗ −0.13∗ −0.17 −0.44∗ −0.01
(−2.72) (−2.57) (−3.16) (−1.15) (−2.61) (−0.09)Openness −0.05∗ −0.03∗ −0.01
(−2.00) (−2.06) (−0.71)Financial Depth −0.07∗ −0.02 −0.02
(−2.49) (−0.72) (−1.07)Past Inflation 23.91∗ 24.65∗
(4.79) (1.92)Joint Signif. F-Test 10.30∗ 14.92∗ 5.06∗ 0.67 3.53∗ 1.91Durbin-Watson Stat 0.65 0.53 0.61 1.00 0.60 0.89J-Statistics 0.00 0.00 4.96 0.76 0.70 1.60No. of Observations 935 935 935 935 935 935Sum of Sq. Res. 30486 41409 32563 12106 35015 13697
at-statistics in parentheses, based on White cross-section standard errors (degrees offreedom corrected).Notes: The dependent variable is inflation variability, which is the standard devi-ation of the inflation rate for the twelve months of the calendar year. The centralbank independence index is CBIW. The definitions of independent variables are asfollows: Past inflation is the logarithmic value of 1 plus the lagged inflation rate;openness is the share of the sum of exports and imports to GDP; financial depthis the ratio of M2 to GDP. The instrumental variables are rule of law, political sta-bility, accountability, government efficiency, and regulatory quality, which are takenfrom the Governance Indicators Database, and democracy, taken from the PolityDatabase. ∗denotes significance at the 10 percent level.
for inflation variability is asking too much of the data—not surpris-ingly, given the extent to which the two attributes are correlatedand respond to the same determinants.
6. Conclusion
In this paper we have reported updated measures of transparencyand independence for upwards of 100 central banks. Our indices for
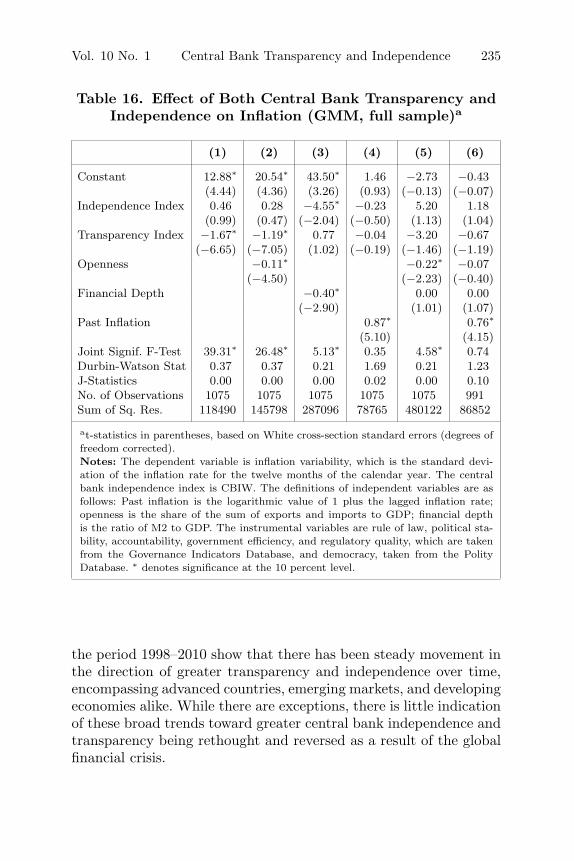
Vol. 10 No. 1 Central Bank Transparency and Independence 235
Table 16. Effect of Both Central Bank Transparency andIndependence on Inflation (GMM, full sample)a
(1) (2) (3) (4) (5) (6)
Constant 12.88∗ 20.54∗ 43.50∗ 1.46 −2.73 −0.43(4.44) (4.36) (3.26) (0.93) (−0.13) (−0.07)
Independence Index 0.46 0.28 −4.55∗ −0.23 5.20 1.18(0.99) (0.47) (−2.04) (−0.50) (1.13) (1.04)
Transparency Index −1.67∗ −1.19∗ 0.77 −0.04 −3.20 −0.67(−6.65) (−7.05) (1.02) (−0.19) (−1.46) (−1.19)
Openness −0.11∗ −0.22∗ −0.07(−4.50) (−2.23) (−0.40)
Financial Depth −0.40∗ 0.00 0.00(−2.90) (1.01) (1.07)
Past Inflation 0.87∗ 0.76∗
(5.10) (4.15)Joint Signif. F-Test 39.31∗ 26.48∗ 5.13∗ 0.35 4.58∗ 0.74Durbin-Watson Stat 0.37 0.37 0.21 1.69 0.21 1.23J-Statistics 0.00 0.00 0.00 0.02 0.00 0.10No. of Observations 1075 1075 1075 1075 1075 991Sum of Sq. Res. 118490 145798 287096 78765 480122 86852
at-statistics in parentheses, based on White cross-section standard errors (degrees offreedom corrected).Notes: The dependent variable is inflation variability, which is the standard devi-ation of the inflation rate for the twelve months of the calendar year. The centralbank independence index is CBIW. The definitions of independent variables are asfollows: Past inflation is the logarithmic value of 1 plus the lagged inflation rate;openness is the share of the sum of exports and imports to GDP; financial depthis the ratio of M2 to GDP. The instrumental variables are rule of law, political sta-bility, accountability, government efficiency, and regulatory quality, which are takenfrom the Governance Indicators Database, and democracy, taken from the PolityDatabase. ∗ denotes significance at the 10 percent level.
the period 1998–2010 show that there has been steady movement inthe direction of greater transparency and independence over time,encompassing advanced countries, emerging markets, and developingeconomies alike. While there are exceptions, there is little indicationof these broad trends toward greater central bank independence andtransparency being rethought and reversed as a result of the globalfinancial crisis.
236 International Journal of Central Banking March 2014
Our analysis of these two dimensions of monetary policy arrange-ments confirms the impression that central bank independence andtransparency go together—that they respond to the same or, at least,related imperatives. Independence gives central banks more freedomof choice in their tactics, while transparency is a way for them tocommunicate the intent of those tactics to the markets and therebyenhance the effectiveness of their policies. Independence gives cen-tral banks insulation from political pressures, while transparencyabout their intentions and actions is a way of holding them account-able for their decisions in the court of public opinion. We find thattransparency and independence respond to similar economic andinstitutional determinants: levels of both tend to have increased overtime in more open economies, for example. But some of the deter-minants of the two dimensions of central banking arrangements alsodiffer: where we find that transparency has tended to rise in countrieswith deeper financial markets, levels of central bank independencehave not. While trends in transparency are positively affected by thestrength of political institutions, the same is not obviously true oftrends in independence.
Finally, we show that outcomes like the level and variabilityof inflation are significantly affected by both central bank inde-pendence and transparency. Disentangling the impact of the twodimensions of central bank arrangements is difficult—not surpris-ingly, given that they respond to similar determinants. But noneof this is to question that trends in central bank independence andtransparency have been strongly upward or that these developmentsmatter importantly for policy.
Appendix 1. Construction of Central Bank TransparencyIndex
We obtained information on central bank transparency from centralbanks’ websites where possible.34 These websites uniformly provideinformation for the most recent year; in some cases they also pro-vide information for earlier years. We then filled in remaining gaps by
34Exactly the same procedures were followed in gathering data on central bankindependence; see below.
Vol. 10 No. 1 Central Bank Transparency and Independence 237
referring to individual central bank annual reports and, where nec-essary, additional publications. The publications we used are housedin the IMF Law Library and the UC Berkeley Law Library.
The resulting index of central bank transparency is the sumof the scores for answers to the fifteen questions below (min = 0,max = 15).
Political Transparency
Political transparency refers to openness about policy objectives.This comprises a formal statement of objectives, including an explicitprioritization in case of multiple goals, a quantification of the pri-mary objective(s), and explicit institutional arrangements.
• Is there a formal statement of the objective(s) of monetarypolicy, with an explicit prioritization in case of multiple objec-tives?
No formal objective(s) = 0.Multiple objectives without prioritization = 1/2.One primary objective, or multiple objectives with explicitpriority = 1.
• Is there a quantification of the primary objective(s)?No = 0.Yes = 1.
• Are there explicit contacts or other similar institutionalarrangements between the monetary authorities and the gov-ernment?
No central bank contracts or other institutional arrange-ments = 0.Central bank without explicit instrument independence orcontract = 1/2.Central bank with explicit instrument independence orcentral bank contract although possibly subject to anexplicit override procedure = 1.
Economic Transparency
Economic transparency focuses on the economic information that isused for monetary policy. This includes economic data, the modelof the economy that the central bank employs to construct forecasts
238 International Journal of Central Banking March 2014
or evaluate the impact of its decisions, and the internal forecasts(model based or judgmental) that the central bank relies on.
• Is the basic economic data relevant for the conduct of mone-tary policy publicly available? (The focus is on the followingfive variables: money supply, inflation, GDP, unemploymentrate, and capacity utilization.)
Quarterly time series for at most two out of the five vari-ables = 0.Quarterly time series for three or four out of the five vari-ables = 1/2.Quarterly time series for all five variables = 1.
• Does the central bank disclose the macroeconomic model(s) ituses for policy analysis?
No = 0.Yes = 1.
• Does the central bank regularly publish its own macroeco-nomic forecasts?
No numerical central bank forecasts for inflation and out-put = 0.Numerical central bank forecasts for inflation and/or out-put published at less than quarterly frequency = 1/2.Quarterly numerical central bank forecasts for inflationand output for the medium term (one to two years ahead),specifying the assumptions about the policy instrument(conditional or unconditional forecasts) = 1.
Procedural Transparency
Procedural transparency is about the way monetary policy decisionsare taken.
• Does the central bank provide an explicit policy rule or strat-egy that describes its monetary policy framework?
No = 0.Yes = 1.
• Does the central bank give a comprehensive account of pol-icy deliberations (or explanations in case of a single centralbanker) within a reasonable amount of time?
Vol. 10 No. 1 Central Bank Transparency and Independence 239
No or only after a substantial lag (more than eight weeks)= 0.Yes, comprehensive minutes (although not necessarily ver-batim or attributed) or explanations (in case of a singlecentral banker), including a discussion of backward- andforward-looking arguments = 1.
• Does the central bank disclose how each decision on the levelof its main operating instrument or target was reached?
No voting records, or only after substantial lag (more thaneight weeks) = 0.Non-attributed voting records = 1/2.Individual voting records, or decision by single centralbanker = 1.
Policy Transparency
Policy transparency means prompt disclosure of policy decisions,together with an explanation of the decision, and an explicit policyinclination or indication of likely future policy actions.
• Are decisions about adjustments to the main operating instru-ment or target announced promptly?
No or only after the day of implementation = 0.Yes, on the day of implementation = 1.
• Does the central bank provide an explanation when itannounces policy decisions?
No = 0.Yes, when policy decisions change, or only superficially =1/2.Yes, always and including forwarding-looking assessments= 1.
• Does the central bank disclose an explicit policy inclinationafter every policy meeting or an explicit indication of likelyfuture policy actions (at least quarterly)?
No = 0.Yes = 1.
240 International Journal of Central Banking March 2014
Operational Transparency
Operational transparency concerns the implementation of the cen-tral bank’s policy actions. It involves a discussion of control errors inachieving operating targets and (unanticipated) macroeconomic dis-turbances that affect the transmission of monetary policy. Further-more, the evaluation of the macroeconomic outcomes of monetarypolicy in light of its objectives is included here as well.
• Does the central bank regularly evaluate to what extent itsmain policy operating targets (if any) have been achieved?
No or not very often (at less than annual frequency) = 0.Yes but without providing explanations for significantdeviations = 1/2.Yes, accounting for significant deviations from target (ifany); or, (nearly) perfect control over main operatinginstrument/target = 1.
• Does the central bank regularly provide information on (unan-ticipated) macroeconomic disturbances that affect the policytransmission process?
No or not very often = 0.Yes but only through short-term forecasts or analysis ofcurrent macroeconomic developments (at least quarterly)= 1/2.Yes, including a discussion of past forecast errors (at leastannually) = 1.
• Does the central bank regularly provide an evaluation of thepolicy outcome in light of its macroeconomic objectives?
No or not very often (at less than annual frequency) = 0.Yes but superficially = 1/2.Yes, with an explicit account of the contribution of mon-etary policy in meeting the objectives = 1.
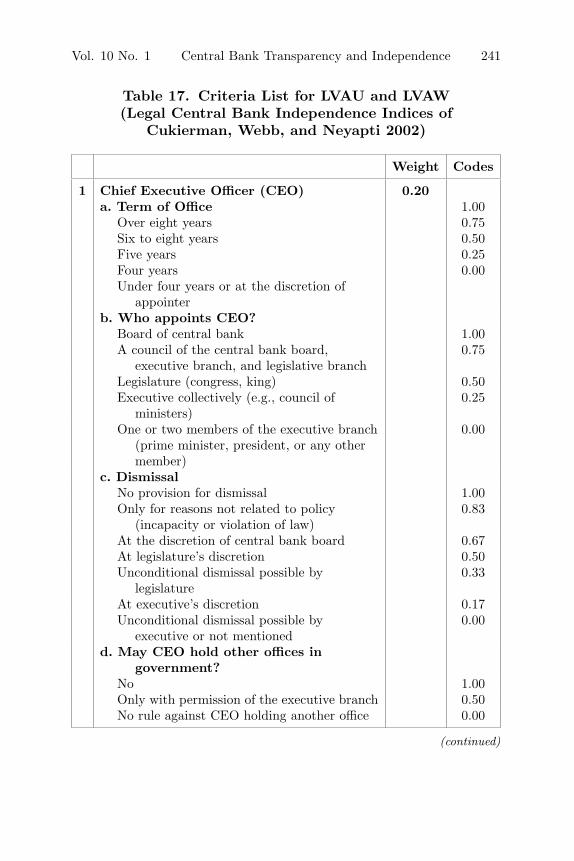
Vol. 10 No. 1 Central Bank Transparency and Independence 241
Table 17. Criteria List for LVAU and LVAW(Legal Central Bank Independence Indices of
Cukierman, Webb, and Neyapti 2002)
Weight Codes
1 Chief Executive Officer (CEO) 0.20a. Term of Office 1.00
Over eight years 0.75Six to eight years 0.50Five years 0.25Four years 0.00Under four years or at the discretion of
appointerb. Who appoints CEO?
Board of central bank 1.00A council of the central bank board,
executive branch, and legislative branch0.75
Legislature (congress, king) 0.50Executive collectively (e.g., council of
ministers)0.25
One or two members of the executive branch(prime minister, president, or any othermember)
0.00
c. DismissalNo provision for dismissal 1.00Only for reasons not related to policy
(incapacity or violation of law)0.83
At the discretion of central bank board 0.67At legislature’s discretion 0.50Unconditional dismissal possible by
legislature0.33
At executive’s discretion 0.17Unconditional dismissal possible by
executive or not mentioned0.00
d. May CEO hold other offices ingovernment?
No 1.00Only with permission of the executive branch 0.50No rule against CEO holding another office 0.00
(continued)
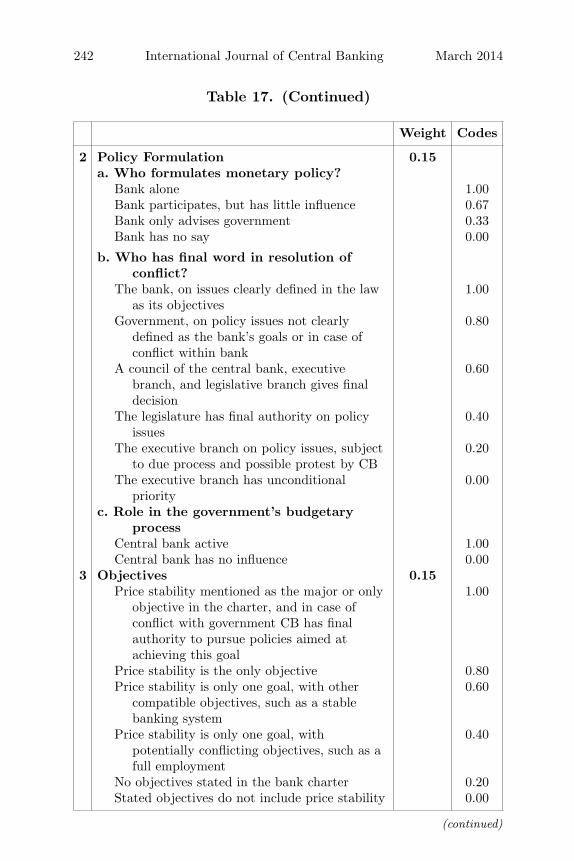
242 International Journal of Central Banking March 2014
Table 17. (Continued)
Weight Codes
2 Policy Formulation 0.15a. Who formulates monetary policy?
Bank alone 1.00Bank participates, but has little influence 0.67Bank only advises government 0.33Bank has no say 0.00
b. Who has final word in resolution ofconflict?
The bank, on issues clearly defined in the lawas its objectives
1.00
Government, on policy issues not clearlydefined as the bank’s goals or in case ofconflict within bank
0.80
A council of the central bank, executivebranch, and legislative branch gives finaldecision
0.60
The legislature has final authority on policyissues
0.40
The executive branch on policy issues, subjectto due process and possible protest by CB
0.20
The executive branch has unconditionalpriority
0.00
c. Role in the government’s budgetaryprocess
Central bank active 1.00Central bank has no influence 0.00
3 Objectives 0.15Price stability mentioned as the major or only
objective in the charter, and in case ofconflict with government CB has finalauthority to pursue policies aimed atachieving this goal
1.00
Price stability is the only objective 0.80Price stability is only one goal, with other
compatible objectives, such as a stablebanking system
0.60
Price stability is only one goal, withpotentially conflicting objectives, such as afull employment
0.40
No objectives stated in the bank charter 0.20Stated objectives do not include price stability 0.00
(continued)
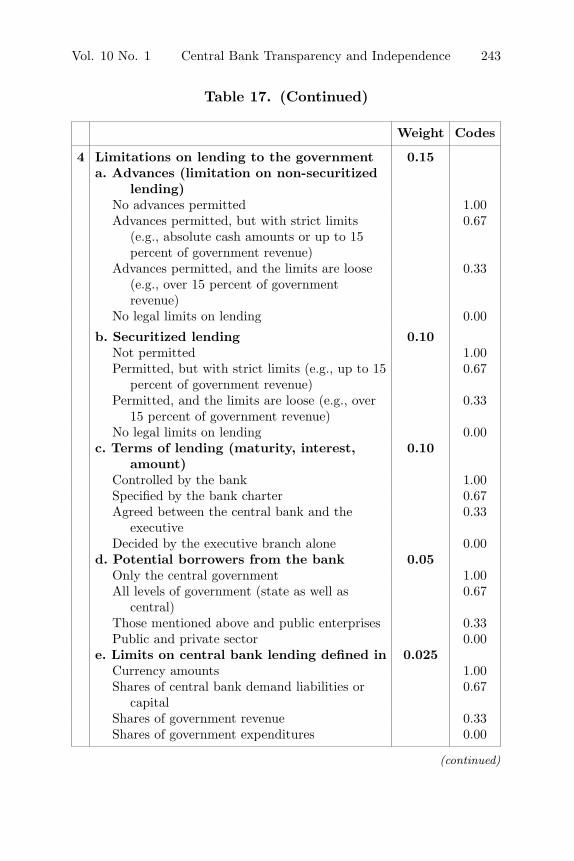
Vol. 10 No. 1 Central Bank Transparency and Independence 243
Table 17. (Continued)
Weight Codes
4 Limitations on lending to the government 0.15a. Advances (limitation on non-securitized
lending)No advances permitted 1.00Advances permitted, but with strict limits
(e.g., absolute cash amounts or up to 15percent of government revenue)
0.67
Advances permitted, and the limits are loose(e.g., over 15 percent of governmentrevenue)
0.33
No legal limits on lending 0.00
b. Securitized lending 0.10Not permitted 1.00Permitted, but with strict limits (e.g., up to 15
percent of government revenue)0.67
Permitted, and the limits are loose (e.g., over15 percent of government revenue)
0.33
No legal limits on lending 0.00c. Terms of lending (maturity, interest,
amount)0.10
Controlled by the bank 1.00Specified by the bank charter 0.67Agreed between the central bank and the
executive0.33
Decided by the executive branch alone 0.00d. Potential borrowers from the bank 0.05
Only the central government 1.00All levels of government (state as well as
central)0.67
Those mentioned above and public enterprises 0.33Public and private sector 0.00
e. Limits on central bank lending defined in 0.025Currency amounts 1.00Shares of central bank demand liabilities or
capital0.67
Shares of government revenue 0.33Shares of government expenditures 0.00
(continued)
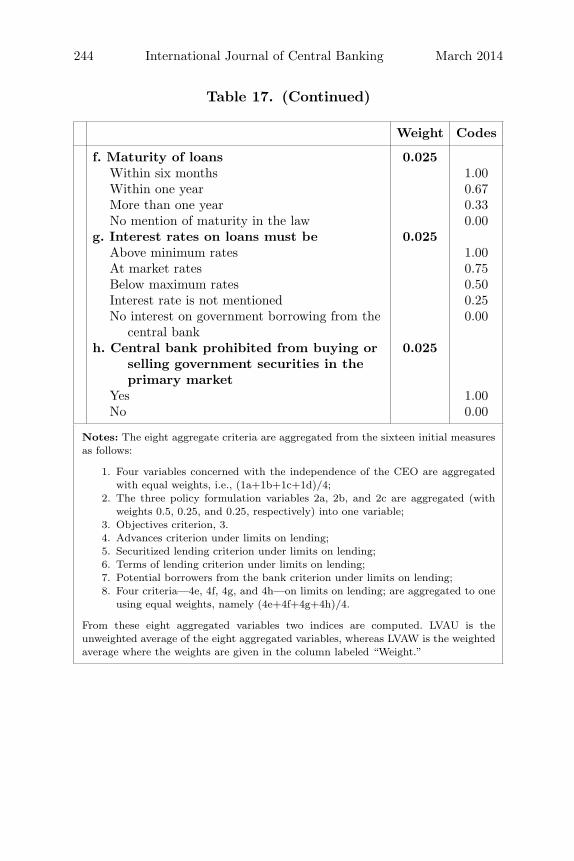
244 International Journal of Central Banking March 2014
Table 17. (Continued)
Weight Codes
f. Maturity of loans 0.025Within six months 1.00Within one year 0.67More than one year 0.33No mention of maturity in the law 0.00
g. Interest rates on loans must be 0.025Above minimum rates 1.00At market rates 0.75Below maximum rates 0.50Interest rate is not mentioned 0.25No interest on government borrowing from the
central bank0.00
h. Central bank prohibited from buying orselling government securities in theprimary market
0.025
Yes 1.00No 0.00
Notes: The eight aggregate criteria are aggregated from the sixteen initial measuresas follows:
1. Four variables concerned with the independence of the CEO are aggregatedwith equal weights, i.e., (1a+1b+1c+1d)/4;
2. The three policy formulation variables 2a, 2b, and 2c are aggregated (withweights 0.5, 0.25, and 0.25, respectively) into one variable;
3. Objectives criterion, 3.4. Advances criterion under limits on lending;5. Securitized lending criterion under limits on lending;6. Terms of lending criterion under limits on lending;7. Potential borrowers from the bank criterion under limits on lending;8. Four criteria—4e, 4f, 4g, and 4h—on limits on lending; are aggregated to one
using equal weights, namely (4e+4f+4g+4h)/4.
From these eight aggregated variables two indices are computed. LVAU is theunweighted average of the eight aggregated variables, whereas LVAW is the weightedaverage where the weights are given in the column labeled “Weight.”
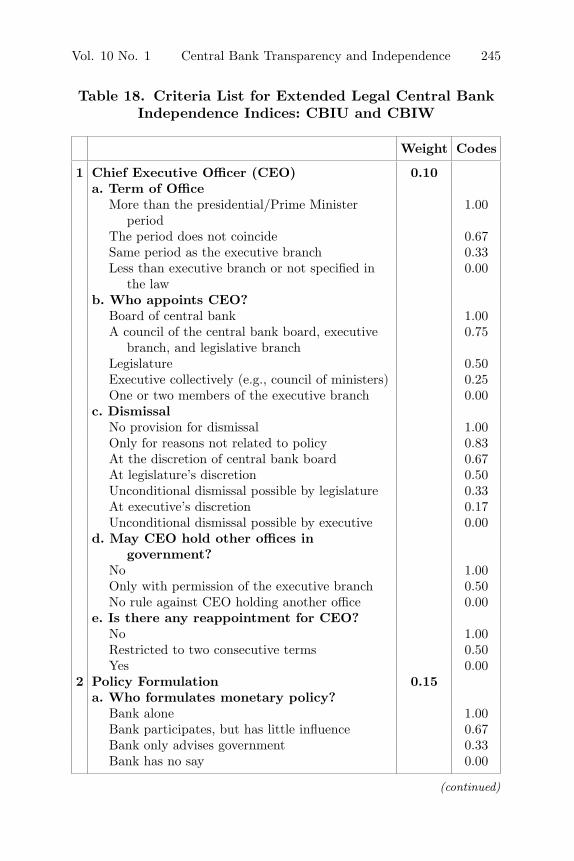
Vol. 10 No. 1 Central Bank Transparency and Independence 245
Table 18. Criteria List for Extended Legal Central BankIndependence Indices: CBIU and CBIW
Weight Codes
1 Chief Executive Officer (CEO) 0.10a. Term of Office
More than the presidential/Prime Ministerperiod
1.00
The period does not coincide 0.67Same period as the executive branch 0.33Less than executive branch or not specified in
the law0.00
b. Who appoints CEO?Board of central bank 1.00A council of the central bank board, executive
branch, and legislative branch0.75
Legislature 0.50Executive collectively (e.g., council of ministers) 0.25One or two members of the executive branch 0.00
c. DismissalNo provision for dismissal 1.00Only for reasons not related to policy 0.83At the discretion of central bank board 0.67At legislature’s discretion 0.50Unconditional dismissal possible by legislature 0.33At executive’s discretion 0.17Unconditional dismissal possible by executive 0.00
d. May CEO hold other offices ingovernment?
No 1.00Only with permission of the executive branch 0.50No rule against CEO holding another office 0.00
e. Is there any reappointment for CEO?No 1.00Restricted to two consecutive terms 0.50Yes 0.00
2 Policy Formulation 0.15a. Who formulates monetary policy?
Bank alone 1.00Bank participates, but has little influence 0.67Bank only advises government 0.33Bank has no say 0.00
(continued)
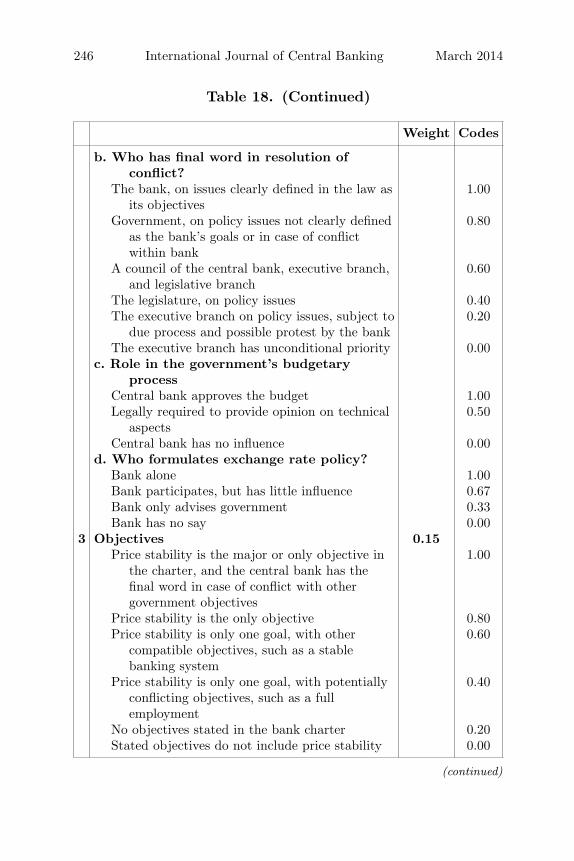
246 International Journal of Central Banking March 2014
Table 18. (Continued)
Weight Codes
b. Who has final word in resolution ofconflict?
The bank, on issues clearly defined in the law asits objectives
1.00
Government, on policy issues not clearly definedas the bank’s goals or in case of conflictwithin bank
0.80
A council of the central bank, executive branch,and legislative branch
0.60
The legislature, on policy issues 0.40The executive branch on policy issues, subject to
due process and possible protest by the bank0.20
The executive branch has unconditional priority 0.00c. Role in the government’s budgetary
processCentral bank approves the budget 1.00Legally required to provide opinion on technical
aspects0.50
Central bank has no influence 0.00d. Who formulates exchange rate policy?
Bank alone 1.00Bank participates, but has little influence 0.67Bank only advises government 0.33Bank has no say 0.00
3 Objectives 0.15Price stability is the major or only objective in
the charter, and the central bank has thefinal word in case of conflict with othergovernment objectives
1.00
Price stability is the only objective 0.80Price stability is only one goal, with other
compatible objectives, such as a stablebanking system
0.60
Price stability is only one goal, with potentiallyconflicting objectives, such as a fullemployment
0.40
No objectives stated in the bank charter 0.20Stated objectives do not include price stability 0.00
(continued)
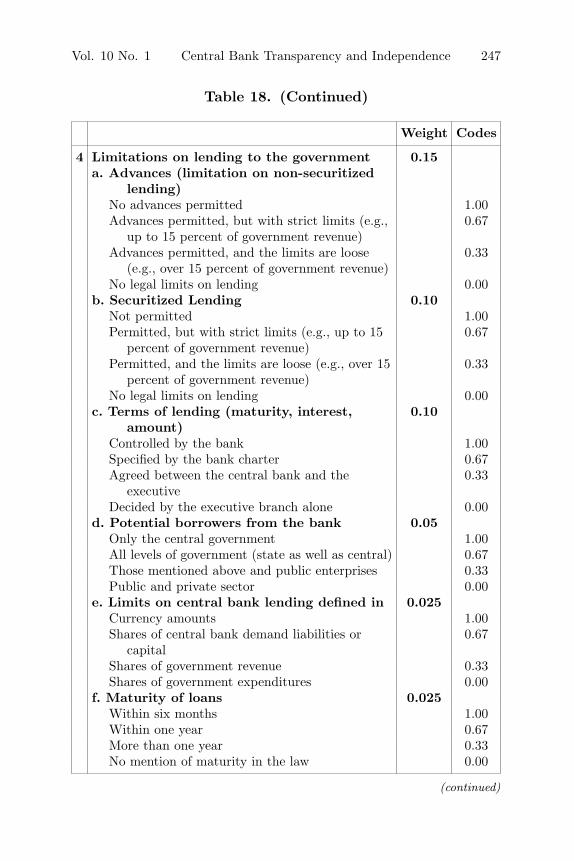
Vol. 10 No. 1 Central Bank Transparency and Independence 247
Table 18. (Continued)
Weight Codes
4 Limitations on lending to the government 0.15a. Advances (limitation on non-securitized
lending)No advances permitted 1.00Advances permitted, but with strict limits (e.g.,
up to 15 percent of government revenue)0.67
Advances permitted, and the limits are loose(e.g., over 15 percent of government revenue)
0.33
No legal limits on lending 0.00b. Securitized Lending 0.10
Not permitted 1.00Permitted, but with strict limits (e.g., up to 15
percent of government revenue)0.67
Permitted, and the limits are loose (e.g., over 15percent of government revenue)
0.33
No legal limits on lending 0.00c. Terms of lending (maturity, interest,
amount)0.10
Controlled by the bank 1.00Specified by the bank charter 0.67Agreed between the central bank and the
executive0.33
Decided by the executive branch alone 0.00d. Potential borrowers from the bank 0.05
Only the central government 1.00All levels of government (state as well as central) 0.67Those mentioned above and public enterprises 0.33Public and private sector 0.00
e. Limits on central bank lending defined in 0.025Currency amounts 1.00Shares of central bank demand liabilities or
capital0.67
Shares of government revenue 0.33Shares of government expenditures 0.00
f. Maturity of loans 0.025Within six months 1.00Within one year 0.67More than one year 0.33No mention of maturity in the law 0.00
(continued)
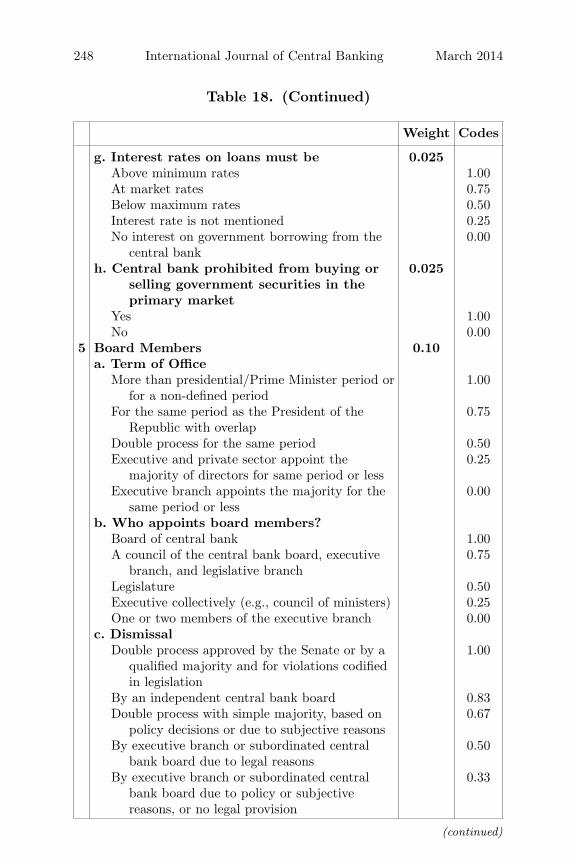
248 International Journal of Central Banking March 2014
Table 18. (Continued)
Weight Codes
g. Interest rates on loans must be 0.025Above minimum rates 1.00At market rates 0.75Below maximum rates 0.50Interest rate is not mentioned 0.25No interest on government borrowing from the
central bank0.00
h. Central bank prohibited from buying orselling government securities in theprimary market
0.025
Yes 1.00No 0.00
5 Board Members 0.10a. Term of Office
More than presidential/Prime Minister period orfor a non-defined period
1.00
For the same period as the President of theRepublic with overlap
0.75
Double process for the same period 0.50Executive and private sector appoint the
majority of directors for same period or less0.25
Executive branch appoints the majority for thesame period or less
0.00
b. Who appoints board members?Board of central bank 1.00A council of the central bank board, executive
branch, and legislative branch0.75
Legislature 0.50Executive collectively (e.g., council of ministers) 0.25One or two members of the executive branch 0.00
c. DismissalDouble process approved by the Senate or by a
qualified majority and for violations codifiedin legislation
1.00
By an independent central bank board 0.83Double process with simple majority, based on
policy decisions or due to subjective reasons0.67
By executive branch or subordinated centralbank board due to legal reasons
0.50
By executive branch or subordinated centralbank board due to policy or subjectivereasons, or no legal provision
0.33
(continued)
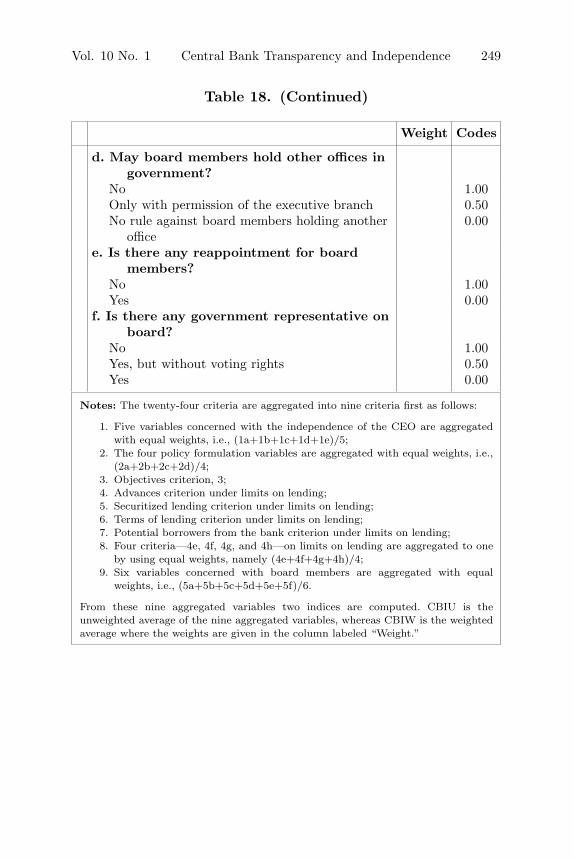
Vol. 10 No. 1 Central Bank Transparency and Independence 249
Table 18. (Continued)
Weight Codes
d. May board members hold other offices ingovernment?
No 1.00Only with permission of the executive branch 0.50No rule against board members holding another
office0.00
e. Is there any reappointment for boardmembers?
No 1.00Yes 0.00
f. Is there any government representative onboard?
No 1.00Yes, but without voting rights 0.50Yes 0.00
Notes: The twenty-four criteria are aggregated into nine criteria first as follows:
1. Five variables concerned with the independence of the CEO are aggregatedwith equal weights, i.e., (1a+1b+1c+1d+1e)/5;
2. The four policy formulation variables are aggregated with equal weights, i.e.,(2a+2b+2c+2d)/4;
3. Objectives criterion, 3;4. Advances criterion under limits on lending;5. Securitized lending criterion under limits on lending;6. Terms of lending criterion under limits on lending;7. Potential borrowers from the bank criterion under limits on lending;8. Four criteria—4e, 4f, 4g, and 4h—on limits on lending are aggregated to one
by using equal weights, namely (4e+4f+4g+4h)/4;9. Six variables concerned with board members are aggregated with equal
weights, i.e., (5a+5b+5c+5d+5e+5f)/6.
From these nine aggregated variables two indices are computed. CBIU is theunweighted average of the nine aggregated variables, whereas CBIW is the weightedaverage where the weights are given in the column labeled “Weight.”
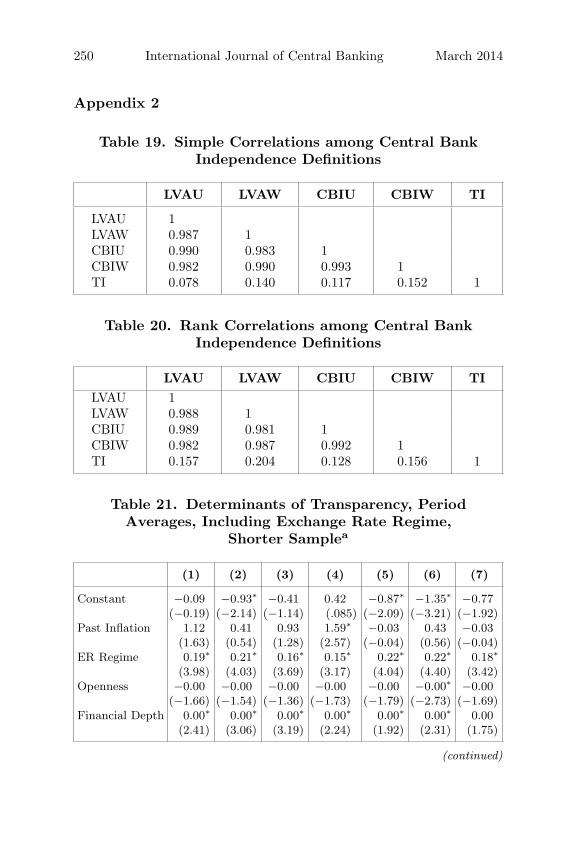
250 International Journal of Central Banking March 2014
Appendix 2
Table 19. Simple Correlations among Central BankIndependence Definitions
LVAU LVAW CBIU CBIW TI
LVAU 1LVAW 0.987 1CBIU 0.990 0.983 1CBIW 0.982 0.990 0.993 1TI 0.078 0.140 0.117 0.152 1
Table 20. Rank Correlations among Central BankIndependence Definitions
LVAU LVAW CBIU CBIW TILVAU 1LVAW 0.988 1CBIU 0.989 0.981 1CBIW 0.982 0.987 0.992 1TI 0.157 0.204 0.128 0.156 1
Table 21. Determinants of Transparency, PeriodAverages, Including Exchange Rate Regime,
Shorter Samplea
(1) (2) (3) (4) (5) (6) (7)
Constant −0.09 −0.93∗ −0.41 0.42 −0.87∗ −1.35∗ −0.77(−0.19) (−2.14) (−1.14) (.085) (−2.09) (−3.21) (−1.92)
Past Inflation 1.12 0.41 0.93 1.59∗ −0.03 0.43 −0.03(1.63) (0.54) (1.28) (2.57) (−0.04) (0.56) (−0.04)
ER Regime 0.19∗ 0.21∗ 0.16∗ 0.15∗ 0.22∗ 0.22∗ 0.18∗
(3.98) (4.03) (3.69) (3.17) (4.04) (4.40) (3.42)Openness −0.00 −0.00 −0.00 −0.00 −0.00 −0.00∗ −0.00
(−1.66) (−1.54) (−1.36) (−1.73) (−1.79) (−2.73) (−1.69)Financial Depth 0.00∗ 0.00∗ 0.00∗ 0.00∗ 0.00∗ 0.00∗ 0.00
(2.41) (3.06) (3.19) (2.24) (1.92) (2.31) (1.75)
(continued)
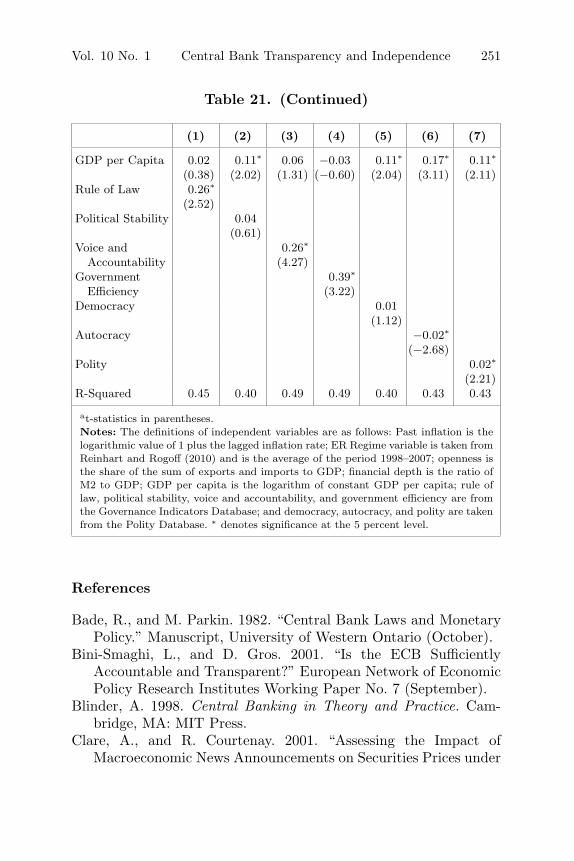
Vol. 10 No. 1 Central Bank Transparency and Independence 251
Table 21. (Continued)
(1) (2) (3) (4) (5) (6) (7)
GDP per Capita 0.02 0.11∗ 0.06 −0.03 0.11∗ 0.17∗ 0.11∗
(0.38) (2.02) (1.31) (−0.60) (2.04) (3.11) (2.11)Rule of Law 0.26∗
(2.52)Political Stability 0.04
(0.61)Voice and 0.26∗
Accountability (4.27)Government 0.39∗
Efficiency (3.22)Democracy 0.01
(1.12)Autocracy −0.02∗
(−2.68)Polity 0.02∗
(2.21)R-Squared 0.45 0.40 0.49 0.49 0.40 0.43 0.43
at-statistics in parentheses.Notes: The definitions of independent variables are as follows: Past inflation is thelogarithmic value of 1 plus the lagged inflation rate; ER Regime variable is taken fromReinhart and Rogoff (2010) and is the average of the period 1998–2007; openness isthe share of the sum of exports and imports to GDP; financial depth is the ratio ofM2 to GDP; GDP per capita is the logarithm of constant GDP per capita; rule oflaw, political stability, voice and accountability, and government efficiency are fromthe Governance Indicators Database; and democracy, autocracy, and polity are takenfrom the Polity Database. ∗ denotes significance at the 5 percent level.
References
Bade, R., and M. Parkin. 1982. “Central Bank Laws and MonetaryPolicy.” Manuscript, University of Western Ontario (October).
Bini-Smaghi, L., and D. Gros. 2001. “Is the ECB SufficientlyAccountable and Transparent?” European Network of EconomicPolicy Research Institutes Working Paper No. 7 (September).
Blinder, A. 1998. Central Banking in Theory and Practice. Cam-bridge, MA: MIT Press.
Clare, A., and R. Courtenay. 2001. “Assessing the Impact ofMacroeconomic News Announcements on Securities Prices under
252 International Journal of Central Banking March 2014
Different Monetary Policy Regimes.” Bank of England WorkingPaper No. 125 (March).
Crowe, C., and E. Meade. 2008. “Central Bank Independence andTransparency: Evolution and Effectiveness.” European Journalof Political Economy 24 (4): 763–77.
Cukierman, A., S. Webb, and B. Neyapti. 1992. “Measuring theIndependence of Central Banks and Its Effect on Policy Out-comes.” World Bank Economic Review 6 (3): 353–98.
Debelle, G., and S. Fischer. 1994. “How Independent Should a Cen-tral Bank Be?” In Goals, Guidelines and Constraints FacingMonetary Policymakers, ed. J. Fuhrer, 195–221. Boston: FederalReserve Bank of Boston.
De Haan, J., F. Amtenbrink, and S. Waller. 2004. “The Trans-parency and Credibility of the European Central Bank.” Journalof Common Market Studies 42 (4): 775–94.
Dincer, N., and B. Eichengreen. 2008. “Central Bank Transparency:Where, Why and with What Effects?” In Central Banks as Eco-nomic Institutions, ed. J.-P. Touffut. Cheltenham: Edward Elgar.
———. 2010. “Central Bank Transparency: Causes, Consequencesand Updates.” Theoretical Inquiries in Law 11 (1).
Eijffinger, S., and P. Geraats. 2006. “How Transparent Are CentralBanks?” European Journal of Political Economy 22 (1): 1–22.
Eijffinger, S., and E. Schaling. 1993. “Central Bank Independencein Twelve Industrial Countries.” Banca Nazionale del LavoroQuarterly Review 184 (March): 49–89.
Fry, M., D. Julius, L. Mahadeva, S. Roger, and G. Sterne. 2000. “KeyIssues in the Choice of Monetary Policy Framework.” In Mon-etary Policy Frameworks in a Global Context, ed. L. Mahadevaand G. Sterne, 1–216. London: Routledge.
Grilli, V., D. Masciandaro, and G. Tabellini. 1991. “Political andMonetary Institutions and Public Financial Policies in the Indus-trial Countries.” Economic Policy 6 (13): 341–92.
Haggard, S., and R. Kaufman. 1995. The Political Economy ofDemocratic Transitions. Princeton, NJ: Princeton UniversityPress.
Ilzetzki, E., C. Reinhart, and K. Rogoff. 2008. “Exchange RateArrangements Entering the 21st Century: Which Anchor WillHold?” Unpublished Manuscript, University of Maryland andHarvard University.
Vol. 10 No. 1 Central Bank Transparency and Independence 253
Jacome, L. I., and F. Vazquez. 2008. “Is There Any Link betweenLegal Central Bank Independence and Inflation? Evidence fromLatin America and the Caribbean.” European Journal of PoliticalEconomy 24 (4): 788–801.
Mishkin, F. 2004. “Can Central Bank Transparency Go Too Far?”NBER Working Paper No. 10829 (October).
Reinhart, C., and K. Rogoff. 2004. “The Modern History ofExchange Rate Arrangements: A Reinterpretation.” QuarterlyJournal of Economics 119 (1): 1–48. (Database available athttp://www.carmenreinhart.com/research/publications-by-topic/exchange-rates-and-dollarization/.)
Rogoff, K. 1985. “The Optimal Degree of Commitment to a Mone-tary Target.” Quarterly Journal of Economics 100 (4): 1169–90.
Siklos, P. L. 2002. The Changing Face of Central Banking: Evo-lutionary Trends Since World War II. Cambridge: CambridgeUniversity Press.
———. 2011. “Central Bank Transparency: Another Look.” AppliedEconomics Letters 18 (10): 929–33.
Walsh, C. 2003. Monetary Theory and Policy. Cambridge, MA: MITPress.
Recommended