Corporate Presentation
Southern Cone / Andean CEO Conference
May, 2012

Our Company
2

Company overview
Largest Latin American IT Services provider
and an undisputed leader in systems integration, support and IT
Outsourcing
and an undisputed leader in systems integration, support and IT
Outsourcing
3
Independent service provider
with world-class credentials and quality certifications
with world-class credentials and quality certifications
Business model is based Business model is based on developing long term
relationships,
closeness and contact with customers, through its more than
8,000 IT professionals
closeness and contact with customers, through its more than
8,000 IT professionals
Company overview
Highly diversified customer base
by geography and industryby geography and industry
Positive financial results
as a consequence of a increase in high value-added revenues strength
of recurring revenues and a successful regional expansion
as a consequence of a increase in high value-added revenues strength
of recurring revenues and a successful regional expansion
Investment plan for US$ 500 million
intended to continue consolidating SONDA regional leading position in
Latin America
intended to continue consolidating SONDA regional leading position in
Latin America
4
Mexico
Colombia
Costa Rica
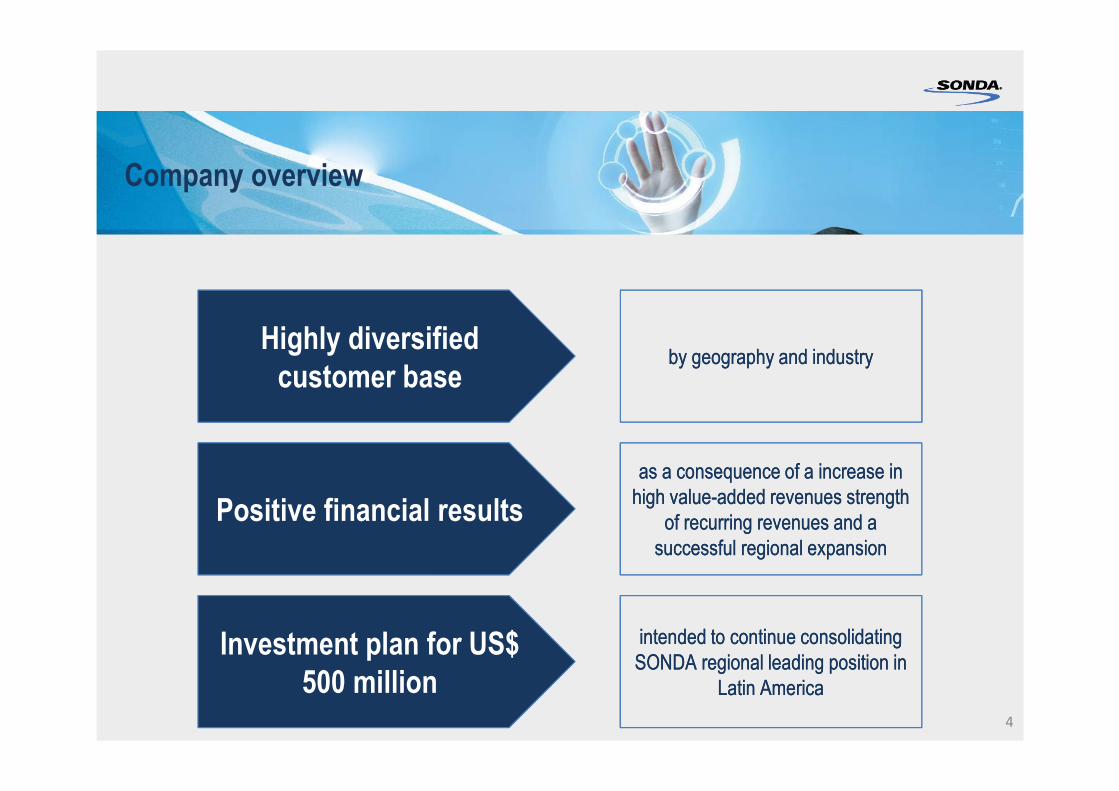
Company overview
� Founded in Chile in 1974, SONDA has
more than 37 years of experience
Ecuador
Peru
Chile
Argentina
Uruguay
Brazil
Panama�Present in 10 countries in the region, with +1,000 cities under coverage
�Over 12,500 employees in the region out of which more than 5,500 are based in Brazil
5

What we do for our customers
� Comprehensive IT offeringsWe are a comprehensive provider of IT solutions with a vast experience in offering services for resolving from the simplest needs through to the most complex, with a business focus aligned to our clients’ strategies.
� IT Adoption Lifecycle
Planning Solution Design
Provisioning Integration Operation
Continuous Improvement
Business and IT Strategy
IT Solution Design
Infrastructure Provisioning
Systems Integration
Maintenance and Operation
6

Comprehensive offering
7
APPLICATIONSIT SERVICES PLATFORMS
�Solving business problems and needs through solutions based on Information Technology.
�Comprehensive offering ranging from the delivery of infrastructure and support services to large-scale and complex systems integration projects and full IT outsourcing.
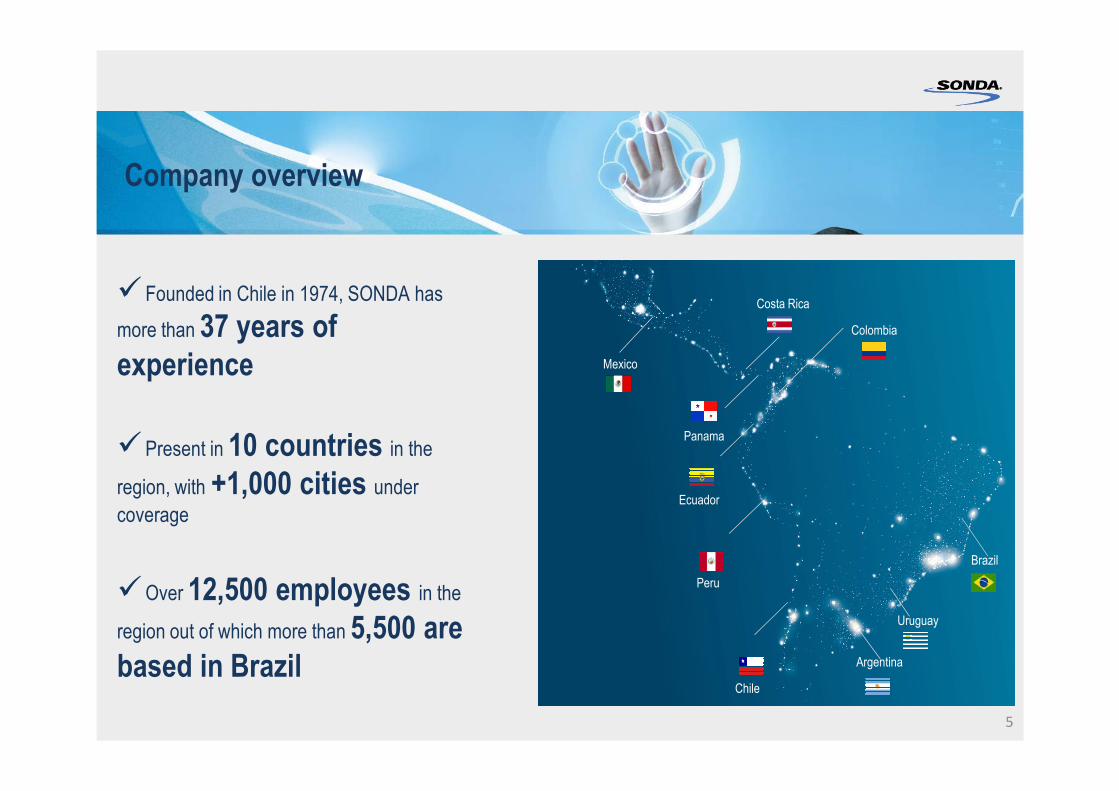
Strong customer base
MANUFACTURING FINANCE TELECOM RETAIL
8
HEALTH ENERGY SERVICES/UTILITIES PUBLIC SECTOR
�Our customers are leading companies in their industries
�More than 5,000 clients throughout Latin America

Alliances with world class vendors
9001:2008Quality management system based on processes and focused on continuous improvement and customer satisfaction
�ISO
9
IT Infrastructure Library
Best practices for managing IT services
�ITIL
Project Management Office
Quality methodology in managing projects
�PMO
Capability Maturity Model Integrated
Best practices for the development of application systems
�CMMI

Case Study
� Retirement Fund Management SolutionA replicable business model
10

Case Study
� Public Transportation Payment Solution -PanamaA major IT Outsourcing contract
Operator’s Buses Payment Areas
Centralyzed Systems
Selling Network
Access point recharge (in person, Web, agreements, self-service)
Access Point
Access Point
Customer Service Centres
11

Case Study
� Coverage and support for Business AppsLargest Service Desk in Latam
� 45,000 IT users
� 1,000,000 Service Desk Calls
� 24x7x365 Operation Support
12
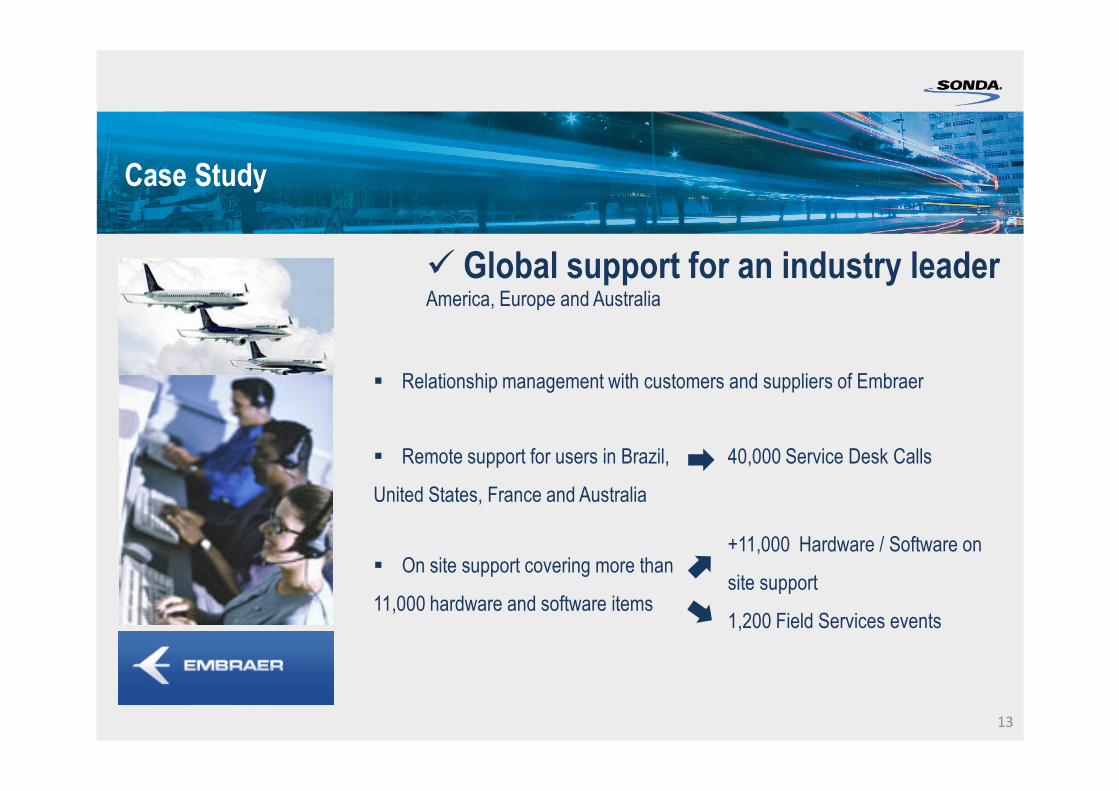
Case Study
� Global support for an industry leader America, Europe and Australia
� Relationship management with customers and suppliers of Embraer
40,000 Service Desk Calls� Remote support for users in Brazil,
United States, France and Australia
� On site support covering more than
11,000 hardware and software items
+11,000 Hardware / Software on
site support
1,200 Field Services events
13

Case Study
� Reducing costs by intensive use of IT Services SAP Outsourcing Services
14

IT Industryin Latin America
15

Latin America, still behind in IT adoption
IT Spending as a percentage of GDP
There is a significant gap in the IT -Investment as a percentage of GDP between developed and emerging economies
15.2%
16
2.1%
6.8%7.2%
15.2%
9.7%
5.3%
Western Europe
Central and Eastern Europe
Asia/Pacific India Latin America
Worldwide
Favorable outlook for IT industry in Latin America
9.7% CAGR (2010-2015) LATIN AMERICA
10.0 10.5 9.8 9.2 8.2
17
10.0%
CAGR (2010-2015) IN STRATEGIC MARKETS
10.5%
BRAZIL
CAGR
2010-2015
9.8%
CHILE
CAGR
2010-2015
9.2%
MEXICO
CAGR
2010-2015
8.2%
COLOMBIA
CAGR
2010-2015
10.7% CAGR (2010-2015) IT SERVICES IN LATAM
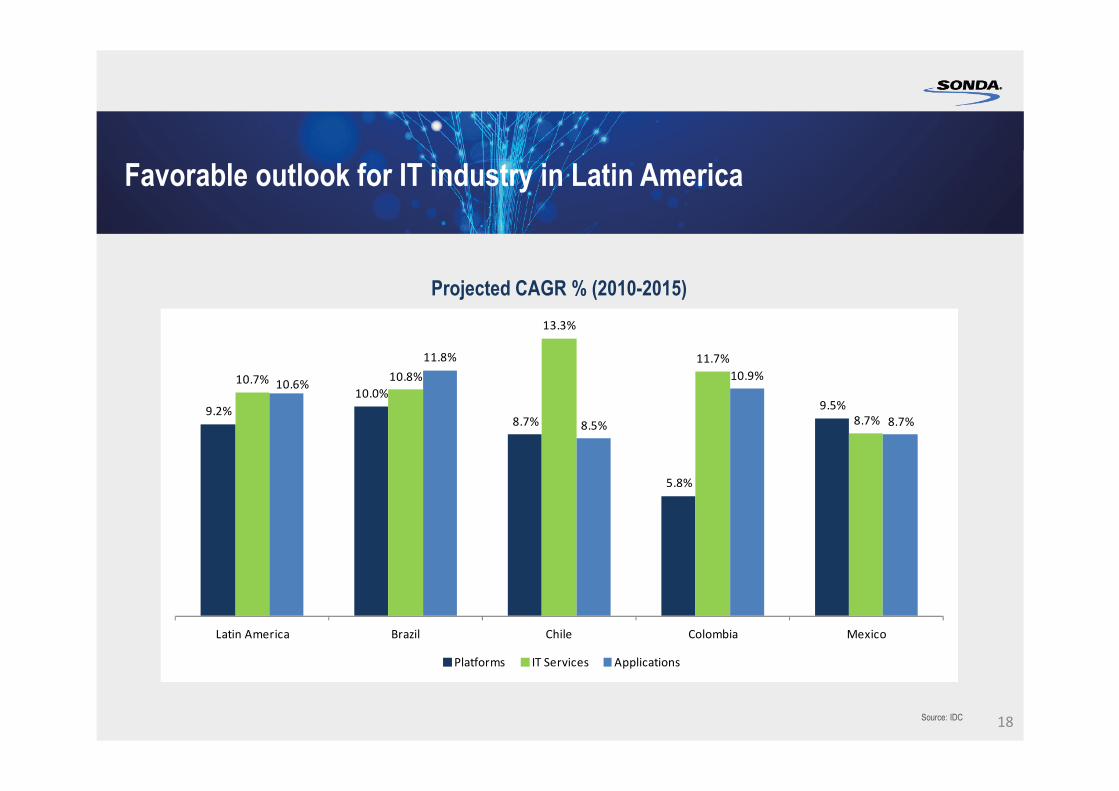
Favorable outlook for IT industry in Latin America
10.0%10.7% 10.8%
13.3%
11.7%
10.6%
11.8%
10.9%
Projected CAGR % (2010-2015)
18
9.2%
10.0%
8.7%
5.8%
9.5%
8.7%8.5% 8.7%
Latin America Brazil Chile Colombia Mexico
Platforms IT Services Applications
Source: IDC

Projected Annual Investment in IT (US$ million)
112,197
123,519
136,592
149,016
22% 21%
Breakdown by Country
Favorable outlook for IT industry in Latin America
19Source: IDC
2011 2012 2013 2014 2015
Brazil Chile Colombia Mexico Other
102,948112,197
48% 48% 49% 50% 52%
4% 4% 4% 5% 5%6% 6% 5% 5% 5%
18% 18% 18% 17% 17%
24% 24% 23% 22% 21%
2011 2012 2013 2014 2015
Brazil Chile Colombia Mexico Other
Solid FinancialPerformanceBalanced growth and consistent cash-flow generation
20

858.0
1,141.8
Recent financial performance
+33.1% Revenues: 1Q11 – 1Q12(US$ million)
Revenues2007 – 2011(US$ million)
CAGR (2007-2011)=20.6%
516.4
822.9
720.6
858.0
2007* 2008* 2009 2010 2011
(*) Financial statements prepared under Chilean GAAP
260.6315.9
1Q11 1Q12
+21.2%
21

Recent financial performance
141.3148.3
176.5CAGR (2007-2011)=15.8%
+19.1%
EBITDA: 1Q11 – 1Q12(US$ million)
EBITDA2007 – 2011(US$ million)
(*) Financial statements prepared under Chilean GAAP
94.1
141.3131.9
148.3
2007* 2008* 2009 2010 2011
17,3%
17.2%
18.3%
15.5%
18.2%
EBITDA Margin
43.5
54.0
1Q11 1Q12
17.1%
16.7%
+24.2%
22

Revenues evolution 2007 – 1Q12
2007 2011 1Q12
57%
28%
7%
8%
CHILE BRAZIL MEXICO OPLA
43%
35%
12%
11%
CHILE BRAZIL MEXICO OPLA
46%
32%
9%
12%
CHILE BRAZIL MEXICO OPLA
23

EBITDA evolution 2007 – 1Q12
2007 2011 1Q12
76%
14%
4%6%
CHILE BRAZIL MEXICO OPLA
62%
23%
9%
6%
CHILE BRAZIL MEXICO OPLA
62%
21%
8%
9%
CHILE BRAZIL MEXICO OPLA
24
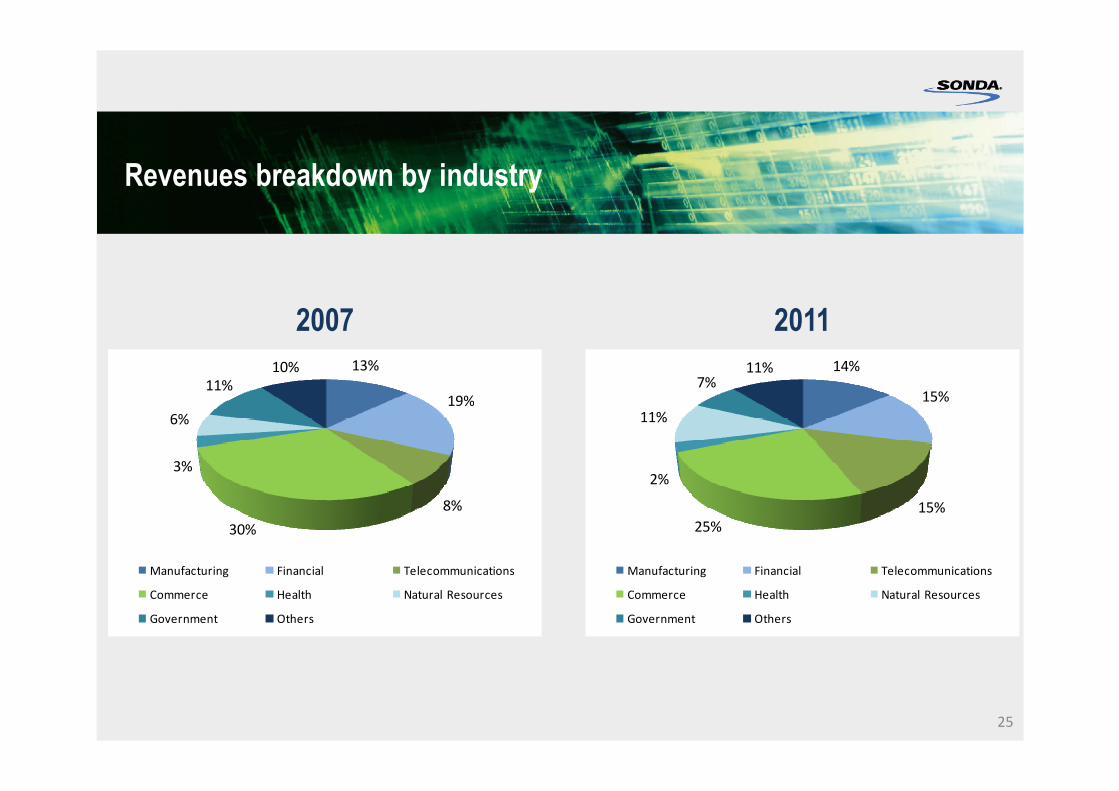
Revenues breakdown by industry
13%
19%11%
10% 14%
15%7%
11%
2007 2011
19%
8%
30%
3%
6%
Manufacturing Financial Telecommunications
Commerce Health Natural Resources
Government Others
15%
15%
25%
2%
11%
Manufacturing Financial Telecommunications
Commerce Health Natural Resources
Government Others
25

FY10 – FY11 / 1Q11 – 1Q12Consolidated Results
US$ million FY11 FY10 Var (%) 1Q12 1Q11 Var (%)
Revenues 1Q11 – 1Q12(US$ million)
+ 21.2%260.6
315.9
43.5
54.0
1Q11 1Q12 26
US$ million FY11 FY10 Var (%) 1Q12 1Q11 Var (%)
Revenues 1,141.8 858.0 33.1% 315.9 260.6 21.2%
EBIT 132.8 111.9 18.7% 38.8 33.6 15.3%
Operating Margin 11.6% 13.0% 12.3% 12.9%
EBITDA 176.5 148.3 19.1% 54.0 43.5 24.2%
EBITDA Margin 15.5% 17.3% 17.1% 16.7%
Net Income 78.2 64.6 21.1% 25.1 24.6 2.1%
Net Margin 6.9% 7.5% 7.9% 9.4%
EBITDA 1Q11 – 1Q12(US$ million)
+ 24.2%
1Q11 1Q12

ChileMarket leader with over US$ 487 million in revenues for 2011 and US$ 147 million for 1Q12
US$ million FY11 FY10 Var (%) 1Q12 1Q11 Var (%)
Revenues 487.2 383.9 26.9% 146.9 104.8 40.2%
EBIT 80.3 66.5 20.7% 25.2 21.3 18.3%
Operating Margin 16.5% 17.3% 17.1% 20.3%
EBITDA 108.8 93.0 17.0% 33.5 27.8 20.2%
27.833.5
1Q11 1Q12
27
EBITDA(US$ million)
+ 20.2%
EBITDA 108.8 93.0 17.0% 33.5 27.8 20.2%
EBITDA Margin 22.3% 24.2% 22.8% 26.6%
� Extensive background in the development of complex IT projects for the modernization of both public institutions and private sector
� Prestige earned for decades, characterized by a deep service culture

BrazilOperations generating nearly 40% of consolidated revenues in 2011 and 30% in 1Q12
US$ million FY11 FY10 Var (%) 1Q12 1Q11 Var (%)
Revenues 401.4 316.5 26.8% 102.7 96.6 6.3%
EBIT 32.5 32.7 -0.7% 8.5 8.7 -1.8%
Operating Margin 8.1% 10.3% 8.3% 9.0%
EBITDA 40.0 38.2 4.7% 11.4 10.4 9.6%
10.4
11.4
1Q11 1Q12
EBITDA 40.0 38.2 4.7% 11.4 10.4 9.6%
EBITDA Margin 10.0% 12.1% 11.1% 10.7%EBITDA(US$ million)
+ 9.6%
� Major player in Brazil with deep market knowledge
� Broad portfolio of blue-chip clients
� Extensive service network with national coverage
28

MexicoExpected revenues of US$ 120 million for 2012 with significant improvement in margins
US$ million FY11 FY10 Var (%) 1Q12 1Q11 Var (%)
Revenues 132.4 73.1 81.1% 28.4 33.7 -15.7%
EBIT 13.5 8.3 61.7% 3.5 2.7 29.6%
Operating Margin 10.2% 11.4% 12.5% 8.1%
EBITDA 16.7 9.4 76.7% 4.5 3.5 30.4%
3.5
4.5
1Q11 1Q12
EBITDA 16.7 9.4 76.7% 4.5 3.5 30.4%
EBITDA Margin 12.6% 12.9% 16.0% 10.4%
� Among the Top 10 IT systems integrators in the country
� More than 100 customers from various industries
EBITDA(US$ million)
+30.4%
29

OPLARevenues reaching over US$120 million in 2011 and growing 47.9% in 1Q12
US$ million FY11 FY10 Var (%) 1Q12 1Q11 Var (%)
Revenues 120.8 84.5 42.9% 38.0 25.7 47.9%
EBIT 6.6 4.4 51.6% 1.5 0.9 62.7%
Operating Margin 5.5% 5.2% 4.0% 3.6%
EBITDA 11.1 7.7 44.4% 4.7 1.8 155.3%
1.8
4.7
1Q11 1Q12
EBITDA 11.1 7.7 44.4% 4.7 1.8 155.3%
EBITDA Margin 9.2% 9.1% 12.3% 7.1%
� SONDA’s services cover other seven Latin American countries, grouped in a region called OPLA: Argentina, Colombia, Costa Rica, Ecuador, Panama, Peru and Uruguay
� In this region, IT industry grows at higher rates than Latin America in average
EBITDA (US$ million)
+155.3%
30
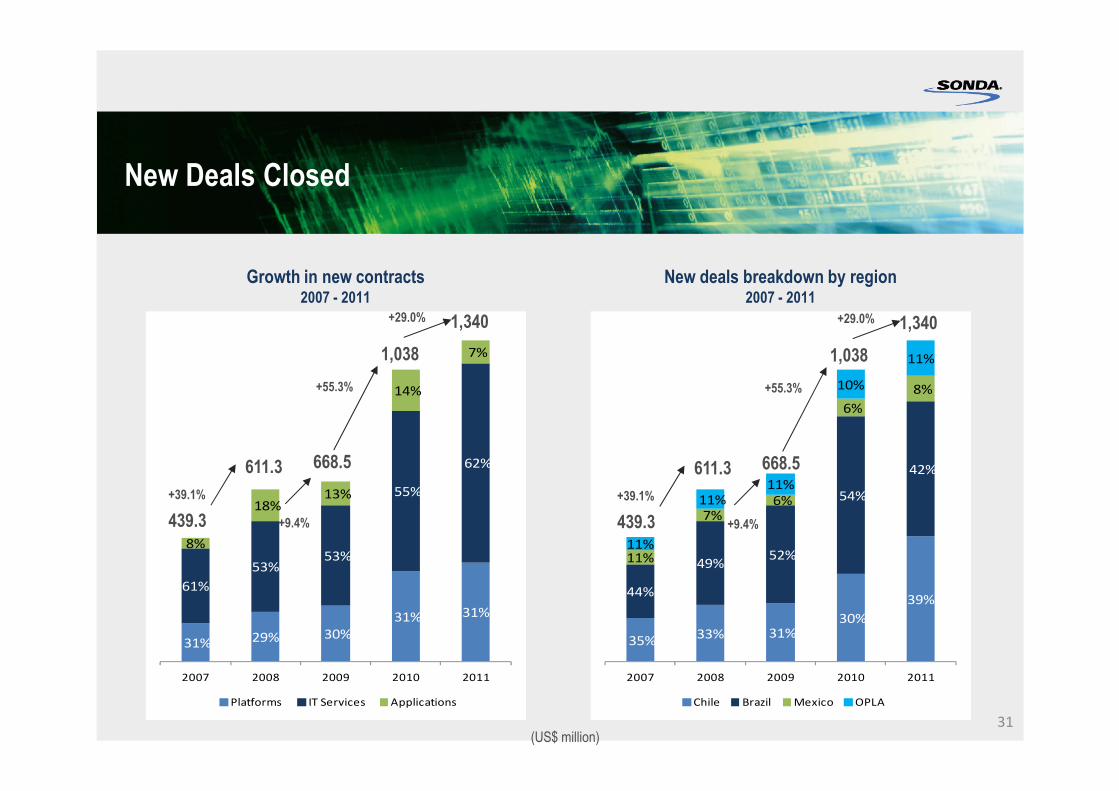
New Deals Closed
14%
7%
+55.3%
+29.0%
1,038
1,340
8%10%
11%
+55.3%
+29.0%
1,038
1,340
Growth in new contracts 2007 - 2011
New deals breakdown by region2007 - 2011
31
31% 29% 30%
31% 31%
61%
53%53%
55%
62%
8%
18% 13%
14%
2007 2008 2009 2010 2011
Platforms IT Services Applications
+9.4%
+39.1%
439.3
611.3 668.5
35%33% 31%
30%
39%44%
49%52%
54%
42%
11%
7% 6%
6%
8%
11%
11%11%
2007 2008 2009 2010 2011
Chile Brazil Mexico OPLA
+9.4%
+39.1%
439.3
611.3 668.5
(US$ million)

New Deals Closed
Growth in new contracts 1Q11 – 1Q12
New deals breakdown by region1Q11 – 1Q12
5%
+ 32.3%289.0
13%
+ 32.3%289.0
3232(US$ million)
50%44%
42%
51%8%
1Q11 1Q12
Platforms IT Services Applications
218.4
30%39%
52%
41%8%
7%
9%
13%
1Q11 1Q12
CHILE BRAZIL MEXICO OPLA
218.4
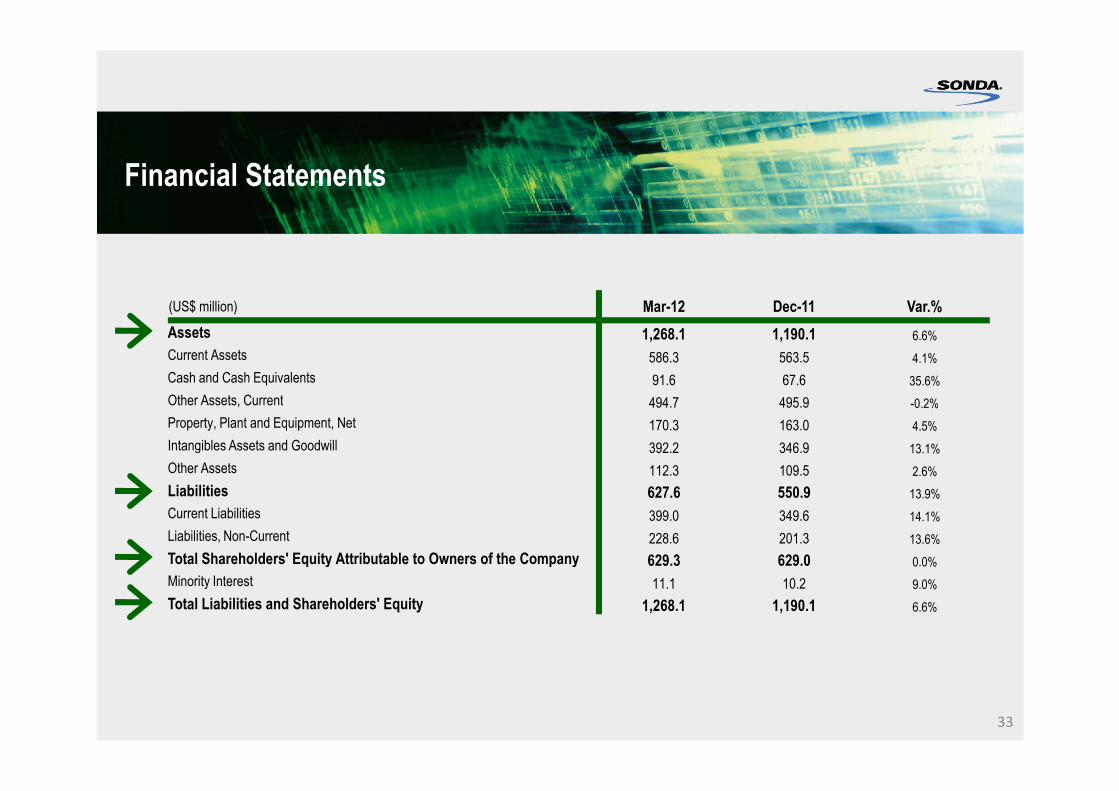
Financial Statements
(US$ million) Mar-12 Dec-11 Var.%
Assets 1,268.1 1,190.1 6.6%
Current Assets 586.3 563.5 4.1%
Cash and Cash Equivalents 91.6 67.6 35.6%
Other Assets, Current 494.7 495.9 -0.2%
33
Other Assets, Current 494.7 495.9 -0.2%
Property, Plant and Equipment, Net 170.3 163.0 4.5%
Intangibles Assets and Goodwill 392.2 346.9 13.1%
Other Assets 112.3 109.5 2.6%
Liabilities 627.6 550.9 13.9%
Current Liabilities 399.0 349.6 14.1%
Liabilities, Non-Current 228.6 201.3 13.6%
Total Shareholders' Equity Attributable to Owners of the Company 629.3 629.0 0.0%
Minority Interest 11.1 10.2 9.0%
Total Liabilities and Shareholders' Equity 1,268.1 1,190.1 6.6%

Investment Plan 2010-2012
34

Investment Plan 2010 - 2012
Total investment for US$500 million to finance:
� Eight new companies acquired
� New headquarters in Brazil
� New datacenters construction
� Enterprise Cloud Computing
� Panama’s Implementation Project
� Implementation of new systems integration projects in Latin America
� Strengthening the positioning in Brazil, expanding territorial coverage and taking advantage of the new cycle of economic expansion
� New acquisitions in Brazil, Mexico, Colombia and other countries with potential
� Development of high value-added business lines throughout the region
35

Investment Plan 2010 - 2012
Colombia
TELSINC
SOFTEAM
NEXTIRAONE
36
� US$ 280 million invested in
acquisitions during 2010-2012
� Acquired companies had US$ 465
million in yearly revenues before being
acquired
� New companies strengthen
SONDA’S regional offering at the same
time expanding its regional coverage
Chile
Colombia
Perú
SOFTEAM
KAIZEN
CEITECH
QUINTEC
PARS
ELUCID
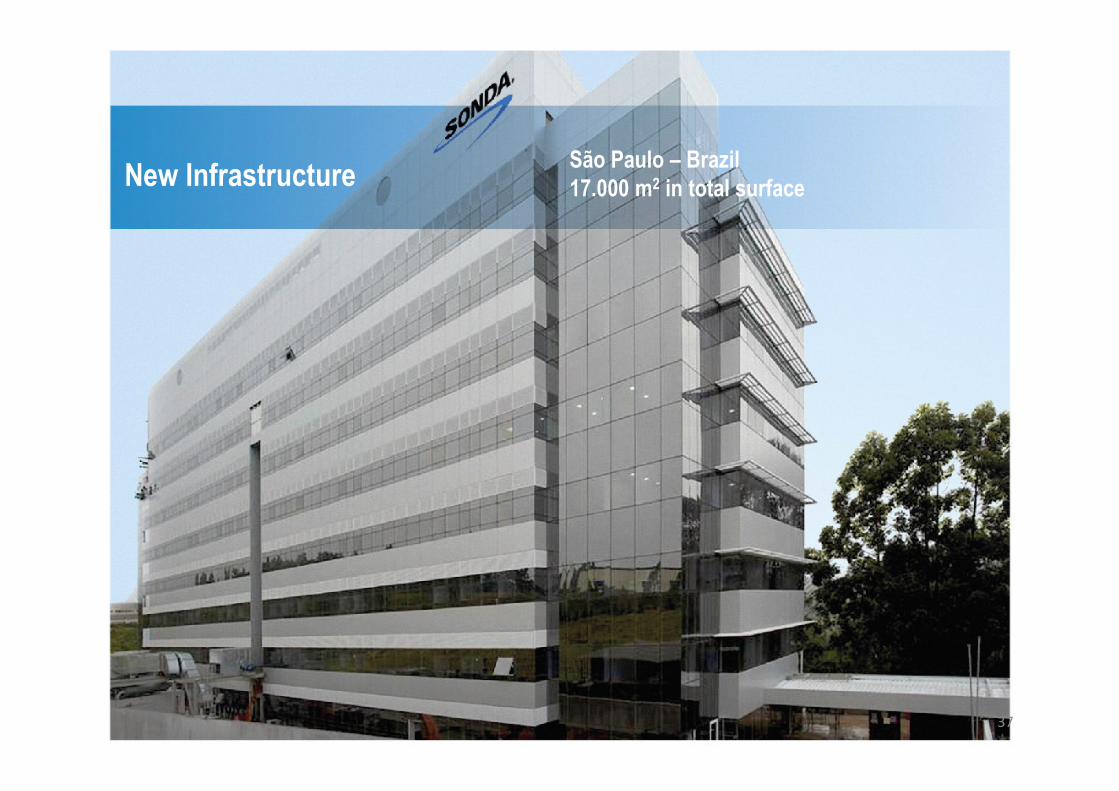
New InfrastructureSão Paulo – Brazil17.000 m2 in total surface
37

New Datacenter Infrastructure
Latest technology: � Two new datacenters in Brazil and Chile, adding 2,200 squared meters in capacity� Both projects with ANSI/TIA-942 TIER III certifications, guaranteeing high levels of security� Operating since 2Q11 in Brazil and starting operations on 1H12 in Chile 38
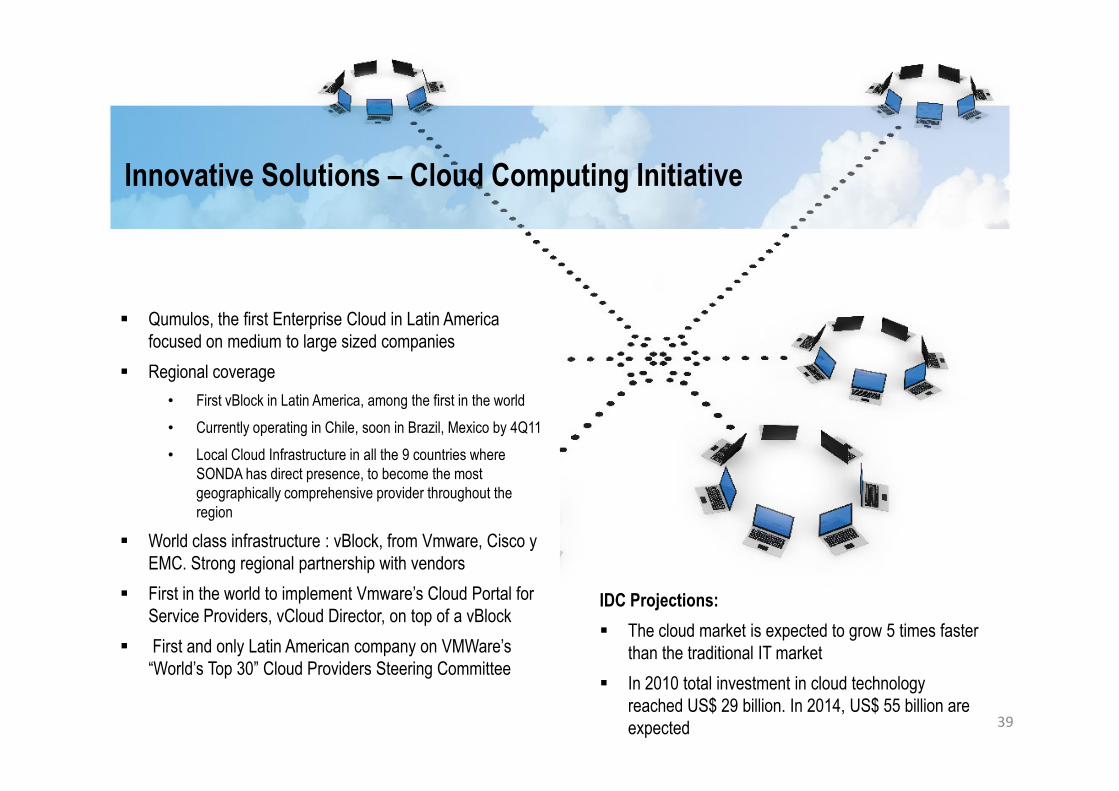
Innovative Solutions – Cloud Computing Initiative
� Qumulos, the first Enterprise Cloud in Latin America focused on medium to large sized companies
� Regional coverage
• First vBlock in Latin America, among the first in the world• First vBlock in Latin America, among the first in the world
• Currently operating in Chile, soon in Brazil, Mexico by 4Q11
• Local Cloud Infrastructure in all the 9 countries where SONDA has direct presence, to become the most geographically comprehensive provider throughout the region
� World class infrastructure : vBlock, from Vmware, Cisco y EMC. Strong regional partnership with vendors
� First in the world to implement Vmware’s Cloud Portal for Service Providers, vCloud Director, on top of a vBlock
� First and only Latin American company on VMWare’s “World’s Top 30” Cloud Providers Steering Committee
IDC Projections:
� The cloud market is expected to grow 5 times faster than the traditional IT market
� In 2010 total investment in cloud technology reached US$ 29 billion. In 2014, US$ 55 billion are expected 39

Perspectives
1 Favorable outlook for the IT industry in Latin America
2 Execution of the US$500 million investment plan
3 New acquisitions create synergy and margin improvement opportunities
4 Extended customer base fosters cross-selling opportunities
5 Pipeline of new business opportunities allow to maintain growth rates in the future
6 Strong positioning in the IT services market in Brazil
7 Increase in new business with regional accounts
8 Main focus in comprehensive solutions based on IT outsourcing
9 Consolidation as the IT services leader provider in Latin America40

Tel (56-2) 657 50 00
Teatinos 500Teatinos 500
Santiago. CHILE
www.SONDA.com
Recommended