The Harrelson Group 2018 1st Quarter Market Report
2018 GRAND STRAND MARKET UPDATE
Data Represents January 1st - March 31st for all years as of 04/19/18. Source of data contained is the CCAR Multiple Listing Service. Information is deemed reliable but not guaranteed. Consult your Century 21 The Harrelson Group agent for more information.
2018 Century 21 The Harrelson Group
New Listings
0
1,750
3,500
5,250
7,000
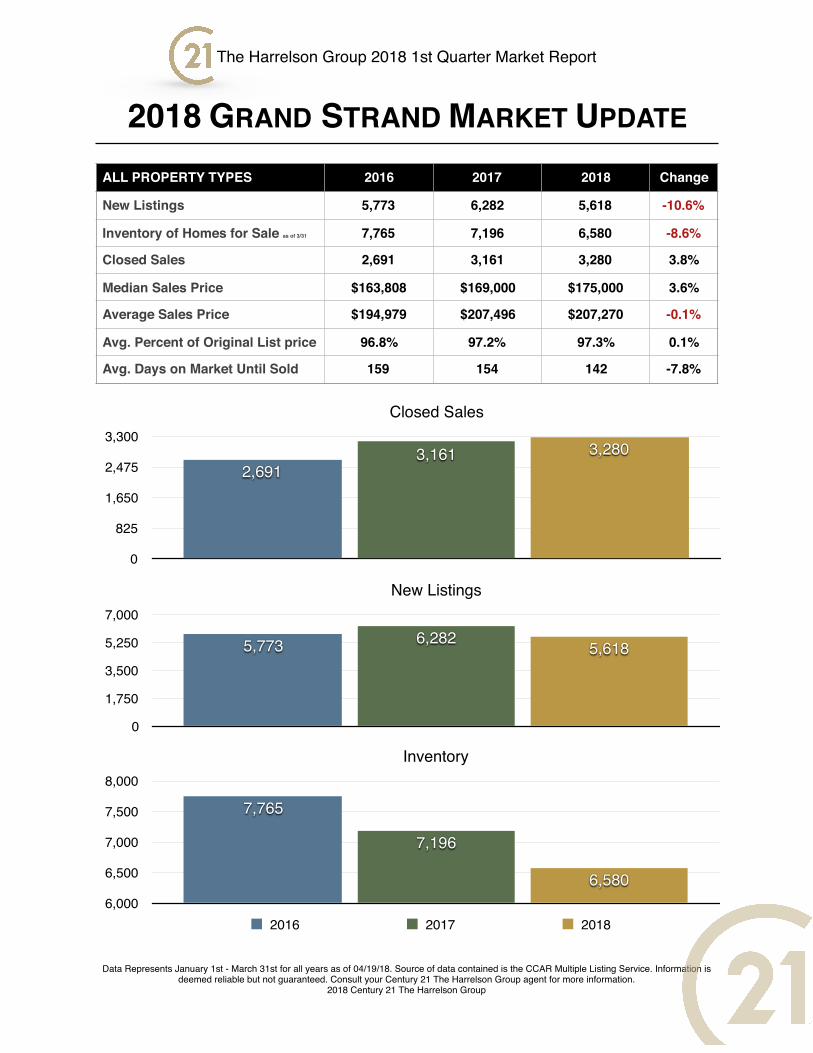
5,6186,2825,773
Closed Sales
0
825
1,650
2,475
3,3003,2803,161
2,691
Inventory
6,000
6,500
7,000
7,500
8,000
6,580
7,196
7,765
2016 2017 2018
ALL PROPERTY TYPES 2016 2017 2018 Change
New Listings 5,773 6,282 5,618 -10.6%
Inventory of Homes for Sale as of 3/31 7,765 7,196 6,580 -8.6%
Closed Sales 2,691 3,161 3,280 3.8%
Median Sales Price $163,808 $169,000 $175,000 3.6%
Average Sales Price $194,979 $207,496 $207,270 -0.1%
Avg. Percent of Original List price 96.8% 97.2% 97.3% 0.1%
Avg. Days on Market Until Sold 159 154 142 -7.8%
The Harrelson Group 2018 1st Quarter Market Report
HORRY COUNTY
Data Represents January 1st - March 31st for all years as of 04/19/18. Source of data contained is the CCAR Multiple Listing Service. Information is deemed reliable but not guaranteed. Consult your Century 21 The Harrelson Group agent for more information.
2018 Century 21 The Harrelson Group
Closed Sales
0
400
800
1200
1600
2000
Residential Condo/Townhouse
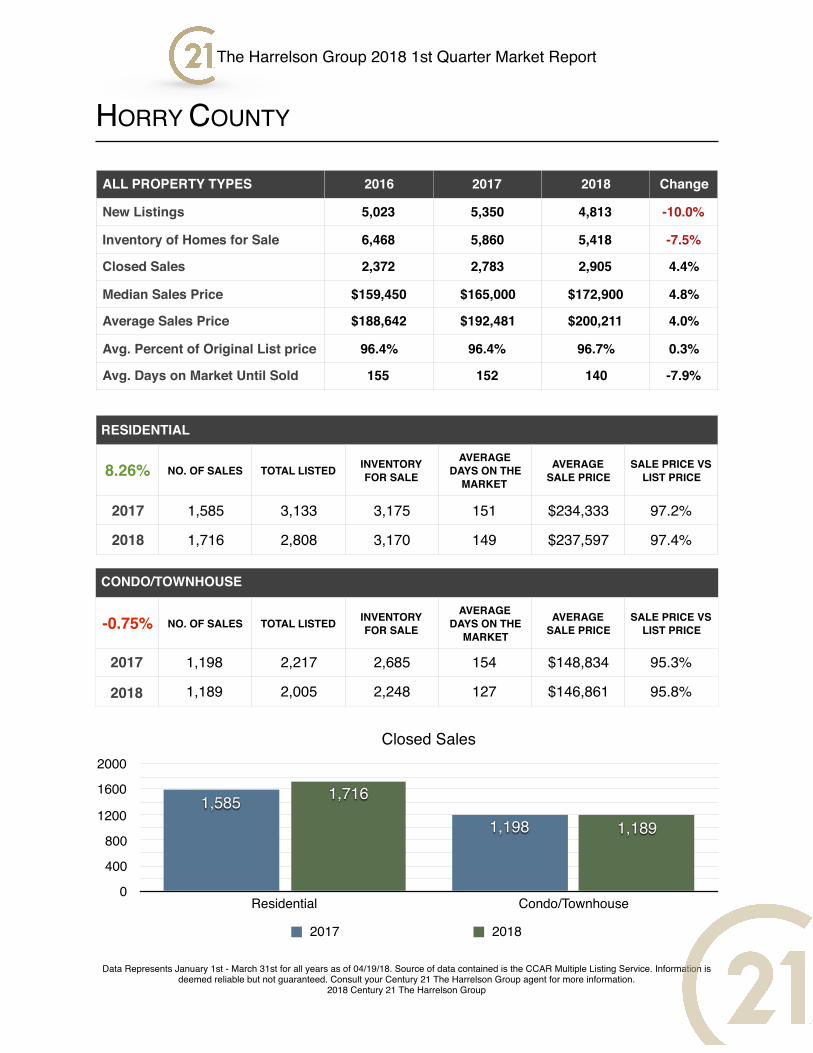
1,189
1,716
1,1981,585
2017 2018
RESIDENTIAL
8.26% NO. OF SALES TOTAL LISTED INVENTORY FOR SALE
AVERAGE DAYS ON THE
MARKET
AVERAGE SALE PRICE
SALE PRICE VS LIST PRICE
2017 1,585 3,133 3,175 151 $234,333 97.2%
2018 1,716 2,808 3,170 149 $237,597 97.4%
CONDO/TOWNHOUSE
-0.75% NO. OF SALES TOTAL LISTED INVENTORY FOR SALE
AVERAGE DAYS ON THE
MARKET
AVERAGE SALE PRICE
SALE PRICE VS LIST PRICE
2017 1,198 2,217 2,685 154 $148,834 95.3%
2018 1,189 2,005 2,248 127 $146,861 95.8%
ALL PROPERTY TYPES 2016 2017 2018 Change
New Listings 5,023 5,350 4,813 -10.0%
Inventory of Homes for Sale 6,468 5,860 5,418 -7.5%
Closed Sales 2,372 2,783 2,905 4.4%
Median Sales Price $159,450 $165,000 $172,900 4.8%
Average Sales Price $188,642 $192,481 $200,211 4.0%
Avg. Percent of Original List price 96.4% 96.4% 96.7% 0.3%
Avg. Days on Market Until Sold 155 152 140 -7.9%
The Harrelson Group 2018 1st Quarter Market Report
MYRTLE BEACH
Data Represents January 1st - March 31st for all years as of 04/19/18. Source of data contained is the CCAR Multiple Listing Service. Information is deemed reliable but not guaranteed. Consult your Century 21 The Harrelson Group agent for more information.
2018 Century 21 The Harrelson Group
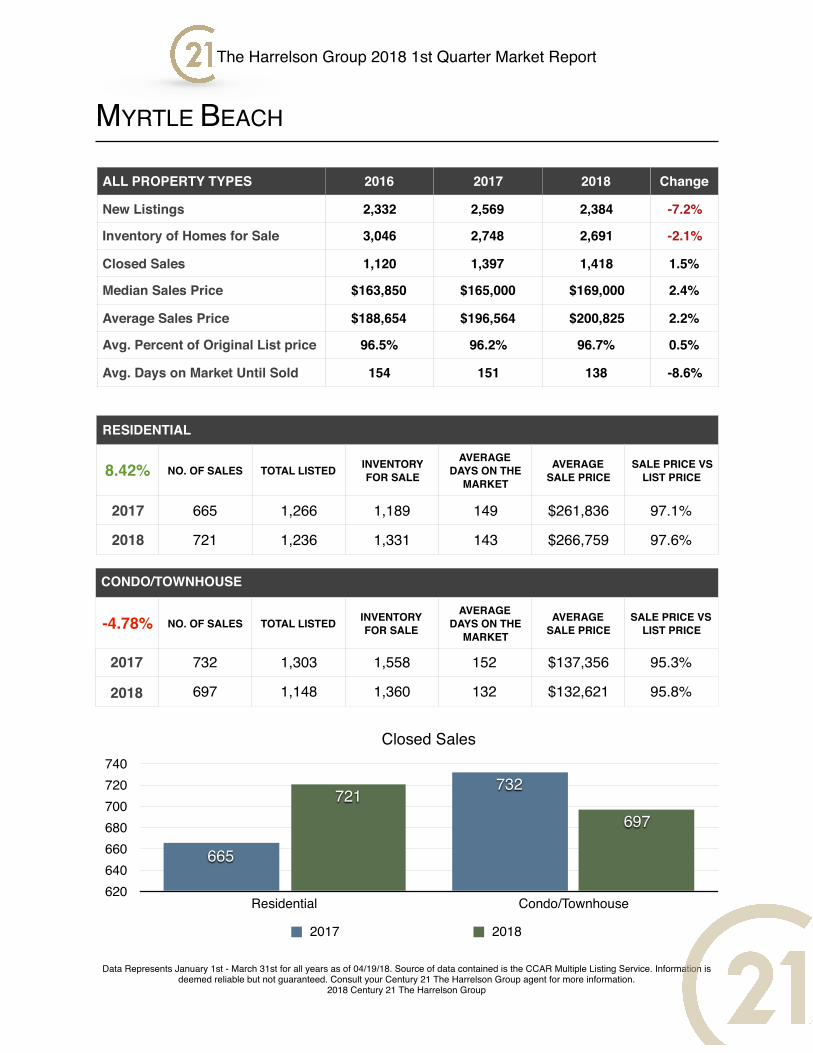
ALL PROPERTY TYPES 2016 2017 2018 Change
New Listings 2,332 2,569 2,384 -7.2%
Inventory of Homes for Sale 3,046 2,748 2,691 -2.1%
Closed Sales 1,120 1,397 1,418 1.5%
Median Sales Price $163,850 $165,000 $169,000 2.4%
Average Sales Price $188,654 $196,564 $200,825 2.2%
Avg. Percent of Original List price 96.5% 96.2% 96.7% 0.5%
Avg. Days on Market Until Sold 154 151 138 -8.6%
RESIDENTIAL
8.42% NO. OF SALES TOTAL LISTED INVENTORY FOR SALE
AVERAGE DAYS ON THE
MARKET
AVERAGE SALE PRICE
SALE PRICE VS LIST PRICE
2017 665 1,266 1,189 149 $261,836 97.1%
2018 721 1,236 1,331 143 $266,759 97.6%
CONDO/TOWNHOUSE
-4.78% NO. OF SALES TOTAL LISTED INVENTORY FOR SALE
AVERAGE DAYS ON THE
MARKET
AVERAGE SALE PRICE
SALE PRICE VS LIST PRICE
2017 732 1,303 1,558 152 $137,356 95.3%
2018 697 1,148 1,360 132 $132,621 95.8%
Closed Sales
620640660680700720740
Residential Condo/Townhouse
697721
732
665
2017 2018
The Harrelson Group 2018 1st Quarter Market Report
NORTH MYRTLE BEACH
Data Represents January 1st - March 31st for all years as of 04/19/18. Source of data contained is the CCAR Multiple Listing Service. Information is deemed reliable but not guaranteed. Consult your Century 21 The Harrelson Group agent for more information.
2018 Century 21 The Harrelson Group
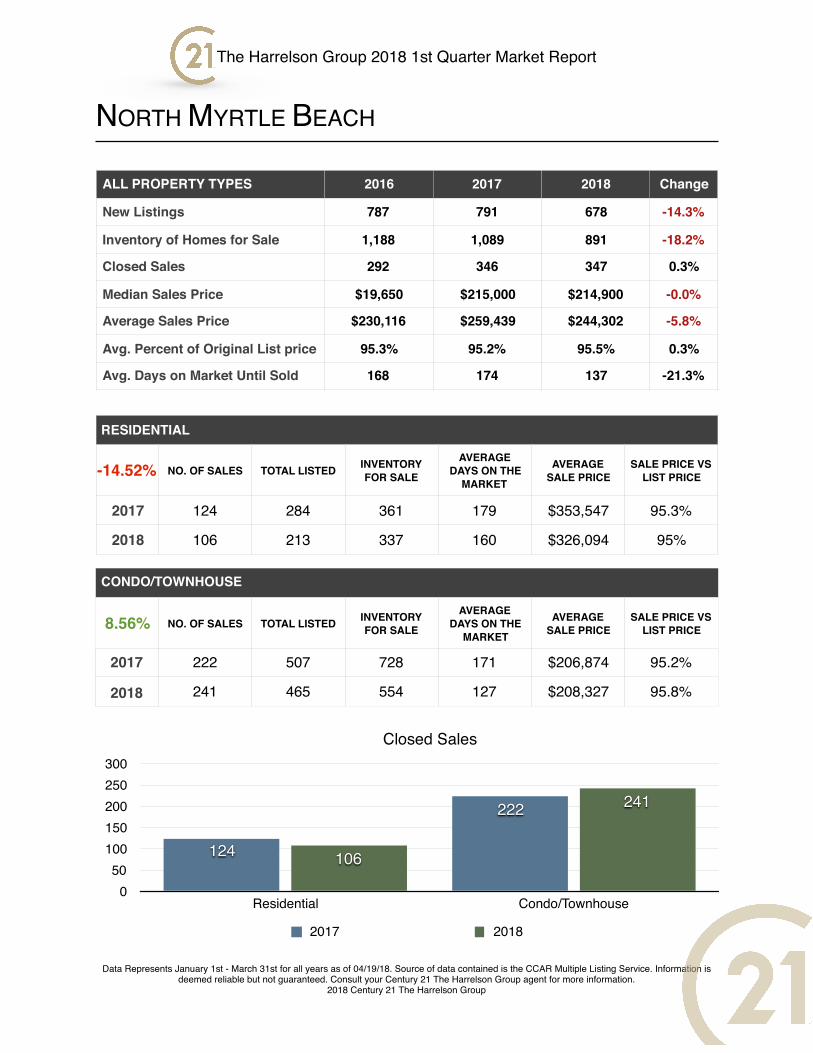
ALL PROPERTY TYPES 2016 2017 2018 Change
New Listings 787 791 678 -14.3%
Inventory of Homes for Sale 1,188 1,089 891 -18.2%
Closed Sales 292 346 347 0.3%
Median Sales Price $19,650 $215,000 $214,900 -0.0%
Average Sales Price $230,116 $259,439 $244,302 -5.8%
Avg. Percent of Original List price 95.3% 95.2% 95.5% 0.3%
Avg. Days on Market Until Sold 168 174 137 -21.3%
RESIDENTIAL
-14.52% NO. OF SALES TOTAL LISTED INVENTORY FOR SALE
AVERAGE DAYS ON THE
MARKET
AVERAGE SALE PRICE
SALE PRICE VS LIST PRICE
2017 124 284 361 179 $353,547 95.3%
2018 106 213 337 160 $326,094 95%
CONDO/TOWNHOUSE
8.56% NO. OF SALES TOTAL LISTED INVENTORY FOR SALE
AVERAGE DAYS ON THE
MARKET
AVERAGE SALE PRICE
SALE PRICE VS LIST PRICE
2017 222 507 728 171 $206,874 95.2%
2018 241 465 554 127 $208,327 95.8%
Closed Sales
050
100150200250300
Residential Condo/Townhouse
241
106
222
124
2017 2018
The Harrelson Group 2018 1st Quarter Market Report
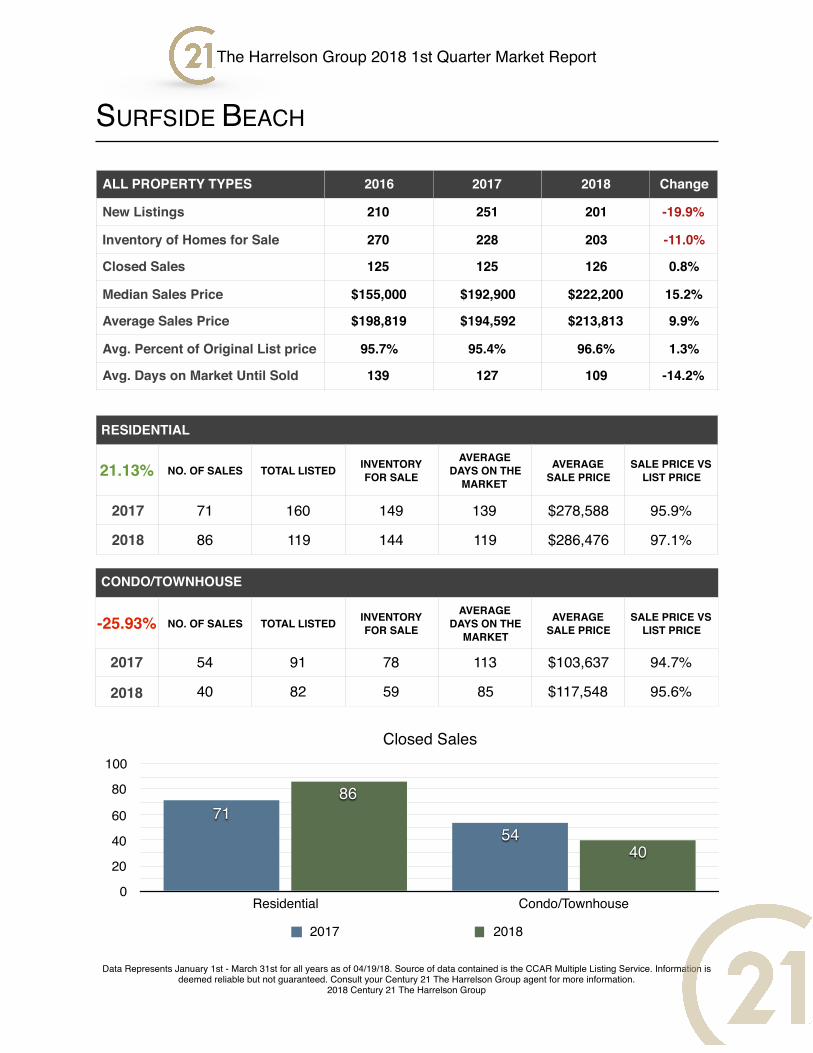
SURFSIDE BEACH
Data Represents January 1st - March 31st for all years as of 04/19/18. Source of data contained is the CCAR Multiple Listing Service. Information is deemed reliable but not guaranteed. Consult your Century 21 The Harrelson Group agent for more information.
2018 Century 21 The Harrelson Group
ALL PROPERTY TYPES 2016 2017 2018 Change
New Listings 210 251 201 -19.9%
Inventory of Homes for Sale 270 228 203 -11.0%
Closed Sales 125 125 126 0.8%
Median Sales Price $155,000 $192,900 $222,200 15.2%
Average Sales Price $198,819 $194,592 $213,813 9.9%
Avg. Percent of Original List price 95.7% 95.4% 96.6% 1.3%
Avg. Days on Market Until Sold 139 127 109 -14.2%
RESIDENTIAL
21.13% NO. OF SALES TOTAL LISTED INVENTORY FOR SALE
AVERAGE DAYS ON THE
MARKET
AVERAGE SALE PRICE
SALE PRICE VS LIST PRICE
2017 71 160 149 139 $278,588 95.9%
2018 86 119 144 119 $286,476 97.1%
CONDO/TOWNHOUSE
-25.93% NO. OF SALES TOTAL LISTED INVENTORY FOR SALE
AVERAGE DAYS ON THE
MARKET
AVERAGE SALE PRICE
SALE PRICE VS LIST PRICE
2017 54 91 78 113 $103,637 94.7%
2018 40 82 59 85 $117,548 95.6%
Closed Sales
0
20
40
60
80
100
Residential Condo/Townhouse
40
86
5471
2017 2018
The Harrelson Group 2018 1st Quarter Market Report
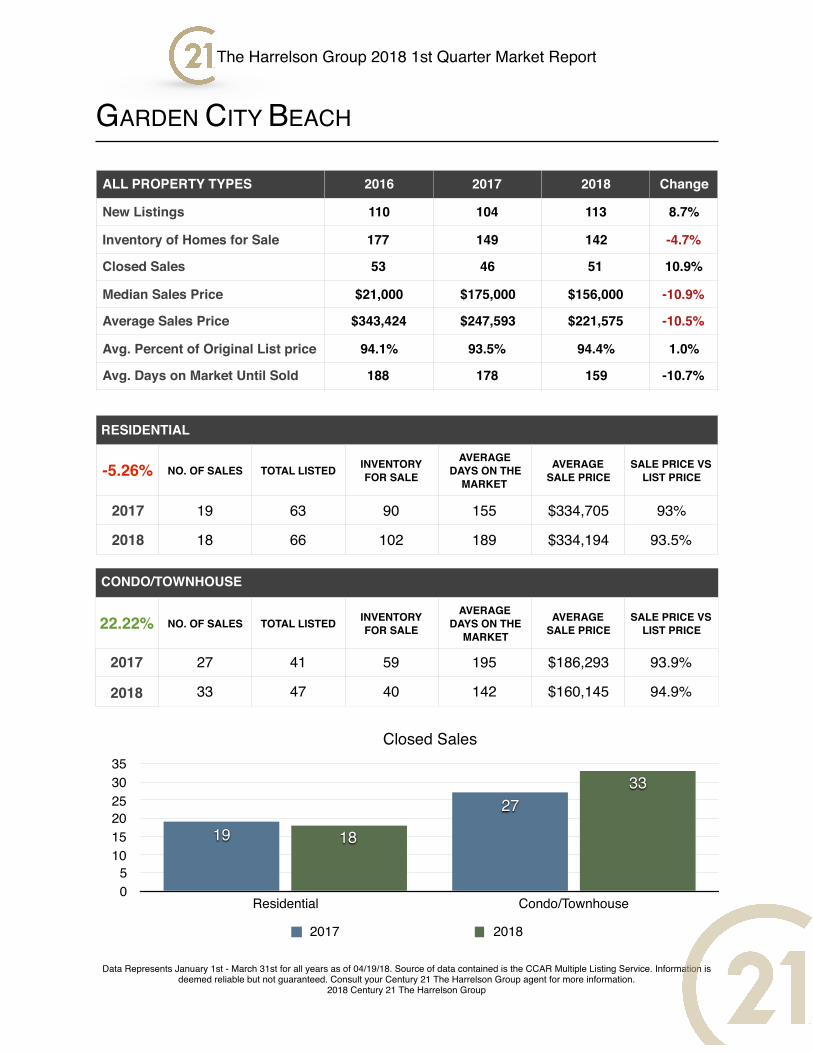
GARDEN CITY BEACH
Data Represents January 1st - March 31st for all years as of 04/19/18. Source of data contained is the CCAR Multiple Listing Service. Information is deemed reliable but not guaranteed. Consult your Century 21 The Harrelson Group agent for more information.
2018 Century 21 The Harrelson Group
ALL PROPERTY TYPES 2016 2017 2018 Change
New Listings 110 104 113 8.7%
Inventory of Homes for Sale 177 149 142 -4.7%
Closed Sales 53 46 51 10.9%
Median Sales Price $21,000 $175,000 $156,000 -10.9%
Average Sales Price $343,424 $247,593 $221,575 -10.5%
Avg. Percent of Original List price 94.1% 93.5% 94.4% 1.0%
Avg. Days on Market Until Sold 188 178 159 -10.7%
RESIDENTIAL
-5.26% NO. OF SALES TOTAL LISTED INVENTORY FOR SALE
AVERAGE DAYS ON THE
MARKET
AVERAGE SALE PRICE
SALE PRICE VS LIST PRICE
2017 19 63 90 155 $334,705 93%
2018 18 66 102 189 $334,194 93.5%
CONDO/TOWNHOUSE
22.22% NO. OF SALES TOTAL LISTED INVENTORY FOR SALE
AVERAGE DAYS ON THE
MARKET
AVERAGE SALE PRICE
SALE PRICE VS LIST PRICE
2017 27 41 59 195 $186,293 93.9%
2018 33 47 40 142 $160,145 94.9%
Closed Sales
05
101520253035
Residential Condo/Townhouse
33
18
27
19
2017 2018
The Harrelson Group 2018 1st Quarter Market Report
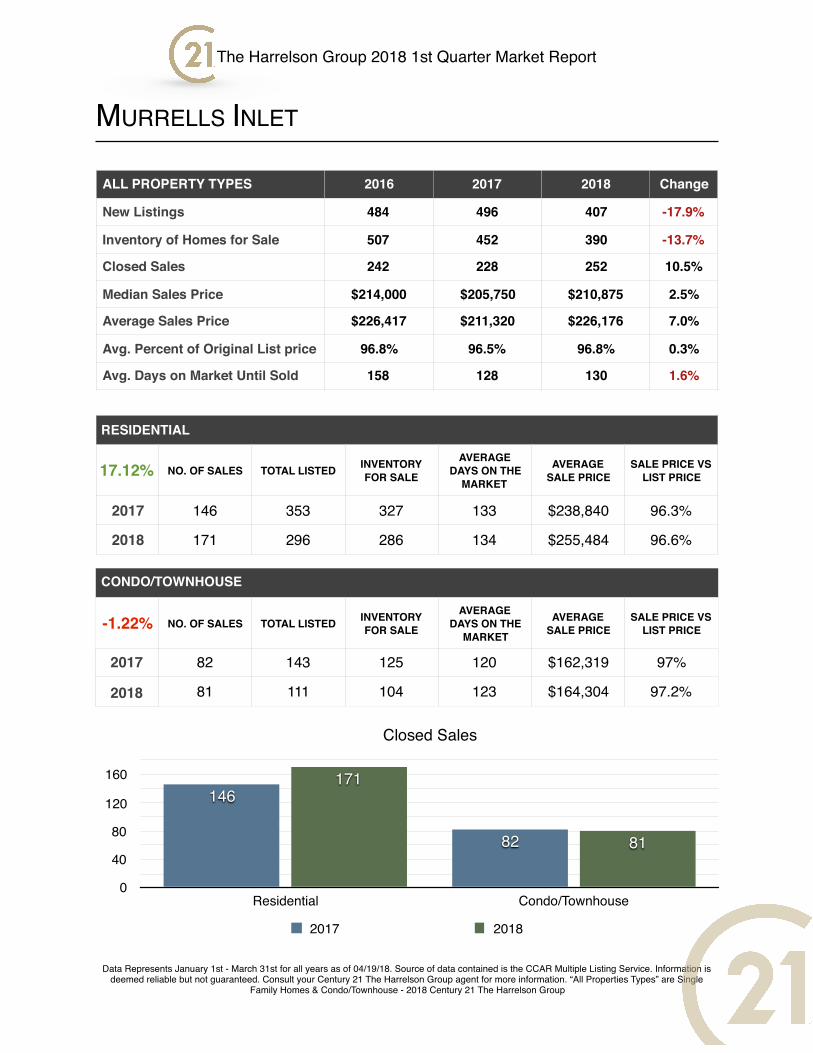
MURRELLS INLET
Data Represents January 1st - March 31st for all years as of 04/19/18. Source of data contained is the CCAR Multiple Listing Service. Information is deemed reliable but not guaranteed. Consult your Century 21 The Harrelson Group agent for more information. “All Properties Types” are Single
Family Homes & Condo/Townhouse - 2018 Century 21 The Harrelson Group
ALL PROPERTY TYPES 2016 2017 2018 Change
New Listings 484 496 407 -17.9%
Inventory of Homes for Sale 507 452 390 -13.7%
Closed Sales 242 228 252 10.5%
Median Sales Price $214,000 $205,750 $210,875 2.5%
Average Sales Price $226,417 $211,320 $226,176 7.0%
Avg. Percent of Original List price 96.8% 96.5% 96.8% 0.3%
Avg. Days on Market Until Sold 158 128 130 1.6%
RESIDENTIAL
17.12% NO. OF SALES TOTAL LISTED INVENTORY FOR SALE
AVERAGE DAYS ON THE
MARKET
AVERAGE SALE PRICE
SALE PRICE VS LIST PRICE
2017 146 353 327 133 $238,840 96.3%
2018 171 296 286 134 $255,484 96.6%
CONDO/TOWNHOUSE
-1.22% NO. OF SALES TOTAL LISTED INVENTORY FOR SALE
AVERAGE DAYS ON THE
MARKET
AVERAGE SALE PRICE
SALE PRICE VS LIST PRICE
2017 82 143 125 120 $162,319 97%
2018 81 111 104 123 $164,304 97.2%
Closed Sales
0
40
80
120
160
Residential Condo/Townhouse
81
171
82
146
2017 2018
The Harrelson Group 2018 1st Quarter Market Report
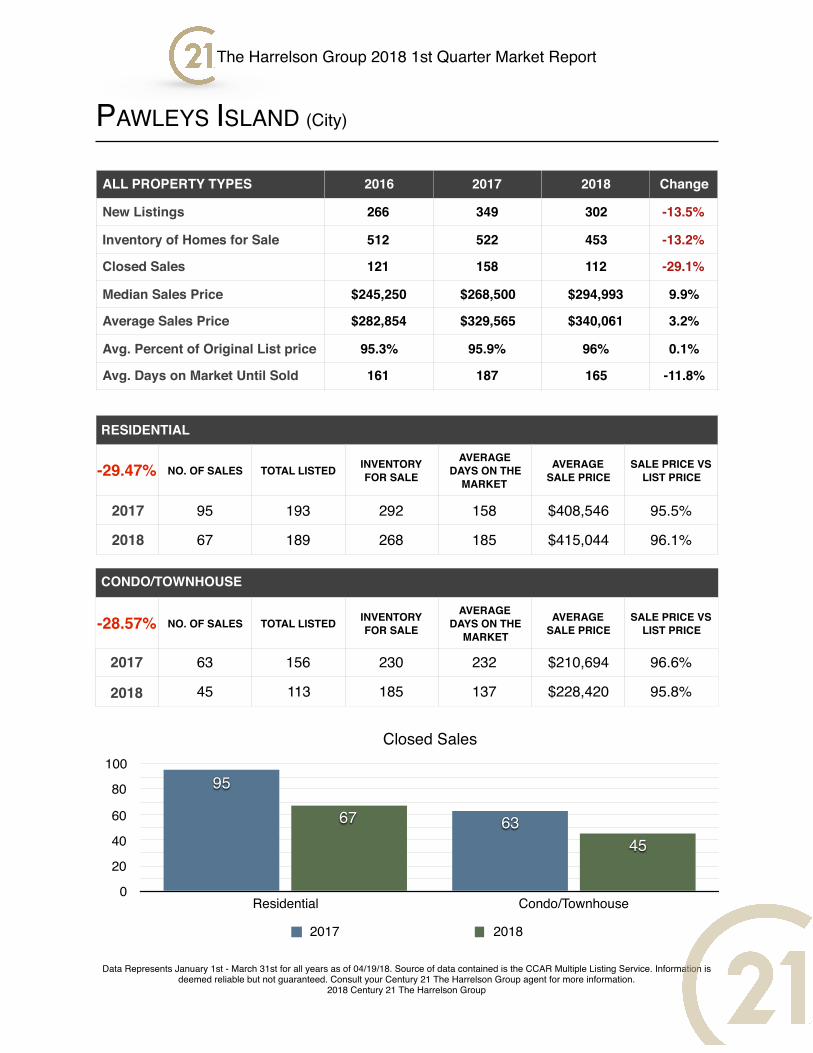
PAWLEYS ISLAND (City)
Data Represents January 1st - March 31st for all years as of 04/19/18. Source of data contained is the CCAR Multiple Listing Service. Information is deemed reliable but not guaranteed. Consult your Century 21 The Harrelson Group agent for more information.
2018 Century 21 The Harrelson Group
ALL PROPERTY TYPES 2016 2017 2018 Change
New Listings 266 349 302 -13.5%
Inventory of Homes for Sale 512 522 453 -13.2%
Closed Sales 121 158 112 -29.1%
Median Sales Price $245,250 $268,500 $294,993 9.9%
Average Sales Price $282,854 $329,565 $340,061 3.2%
Avg. Percent of Original List price 95.3% 95.9% 96% 0.1%
Avg. Days on Market Until Sold 161 187 165 -11.8%
RESIDENTIAL
-29.47% NO. OF SALES TOTAL LISTED INVENTORY FOR SALE
AVERAGE DAYS ON THE
MARKET
AVERAGE SALE PRICE
SALE PRICE VS LIST PRICE
2017 95 193 292 158 $408,546 95.5%
2018 67 189 268 185 $415,044 96.1%
CONDO/TOWNHOUSE
-28.57% NO. OF SALES TOTAL LISTED INVENTORY FOR SALE
AVERAGE DAYS ON THE
MARKET
AVERAGE SALE PRICE
SALE PRICE VS LIST PRICE
2017 63 156 230 232 $210,694 96.6%
2018 45 113 185 137 $228,420 95.8%
Closed Sales
0
20
40
60
80
100
Residential Condo/Townhouse
4567 63
95
2017 2018
The Harrelson Group 2018 1st Quarter Market Report
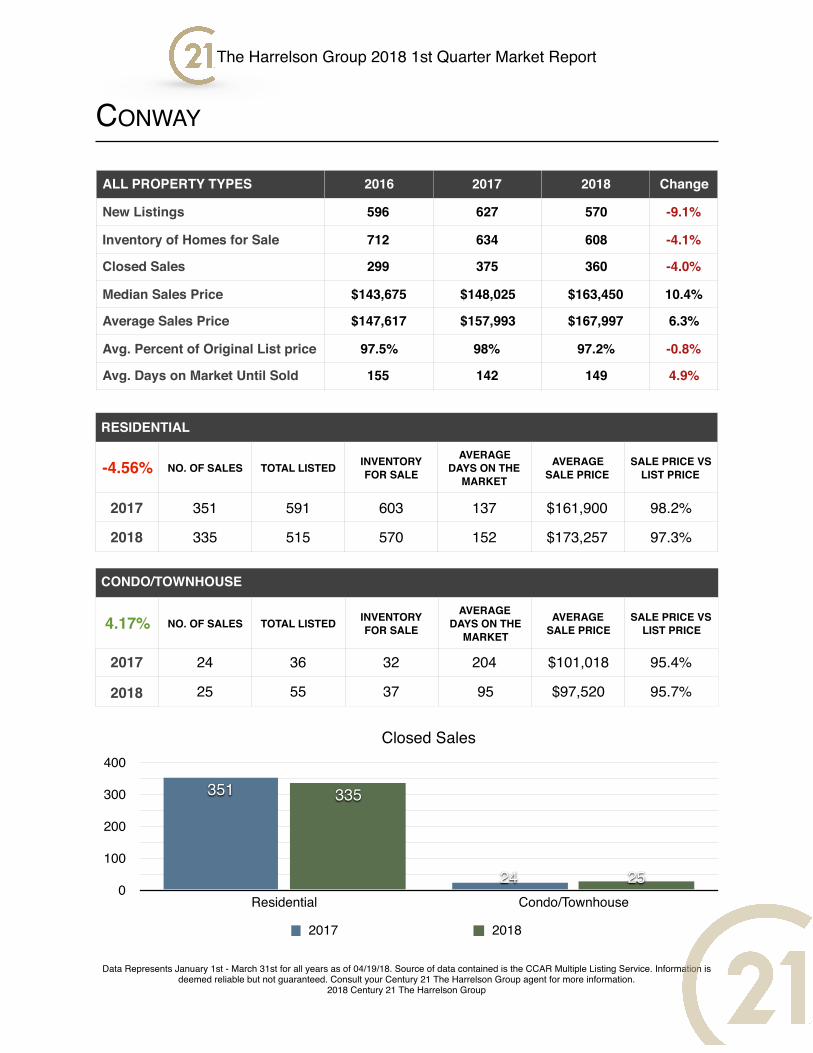
CONWAY
Data Represents January 1st - March 31st for all years as of 04/19/18. Source of data contained is the CCAR Multiple Listing Service. Information is deemed reliable but not guaranteed. Consult your Century 21 The Harrelson Group agent for more information.
2018 Century 21 The Harrelson Group
ALL PROPERTY TYPES 2016 2017 2018 Change
New Listings 596 627 570 -9.1%
Inventory of Homes for Sale 712 634 608 -4.1%
Closed Sales 299 375 360 -4.0%
Median Sales Price $143,675 $148,025 $163,450 10.4%
Average Sales Price $147,617 $157,993 $167,997 6.3%
Avg. Percent of Original List price 97.5% 98% 97.2% -0.8%
Avg. Days on Market Until Sold 155 142 149 4.9%
RESIDENTIAL
-4.56% NO. OF SALES TOTAL LISTED INVENTORY FOR SALE
AVERAGE DAYS ON THE
MARKET
AVERAGE SALE PRICE
SALE PRICE VS LIST PRICE
2017 351 591 603 137 $161,900 98.2%
2018 335 515 570 152 $173,257 97.3%
CONDO/TOWNHOUSE
4.17% NO. OF SALES TOTAL LISTED INVENTORY FOR SALE
AVERAGE DAYS ON THE
MARKET
AVERAGE SALE PRICE
SALE PRICE VS LIST PRICE
2017 24 36 32 204 $101,018 95.4%
2018 25 55 37 95 $97,520 95.7%
Closed Sales
0
100
200
300
400
Residential Condo/Townhouse
25
335
24
351
2017 2018
The Harrelson Group 2018 1st Quarter Market Report
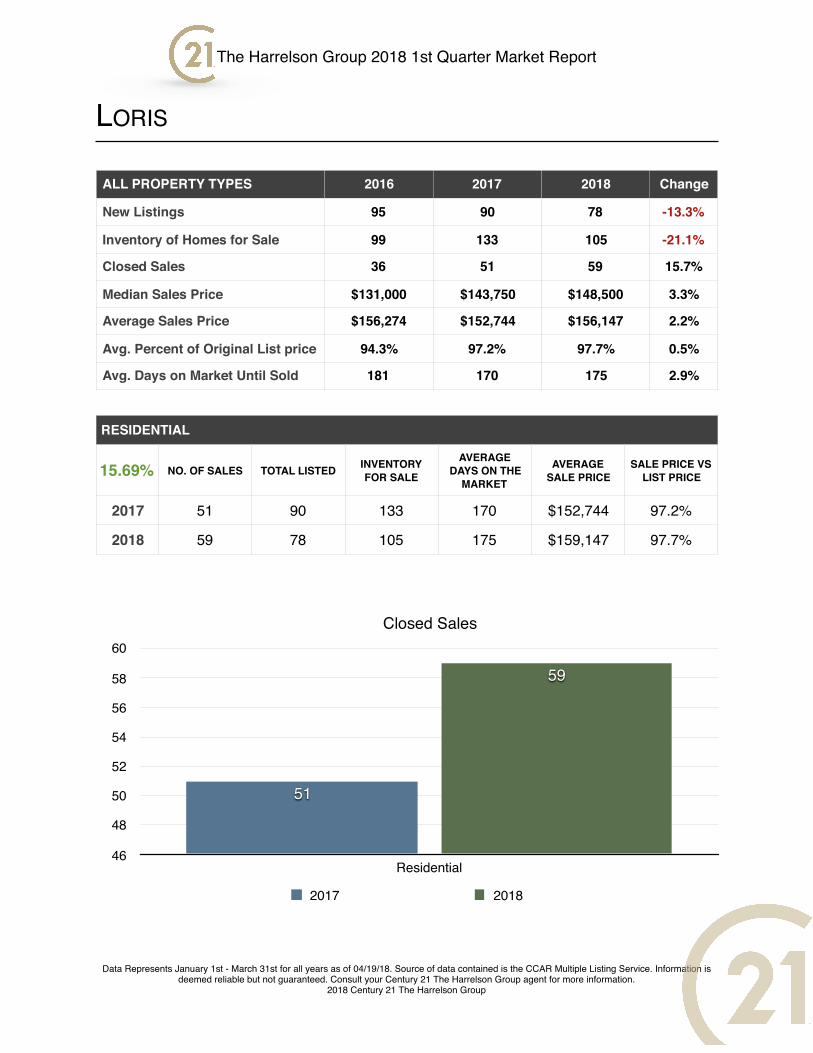
LORIS
Data Represents January 1st - March 31st for all years as of 04/19/18. Source of data contained is the CCAR Multiple Listing Service. Information is deemed reliable but not guaranteed. Consult your Century 21 The Harrelson Group agent for more information.
2018 Century 21 The Harrelson Group
ALL PROPERTY TYPES 2016 2017 2018 Change
New Listings 95 90 78 -13.3%
Inventory of Homes for Sale 99 133 105 -21.1%
Closed Sales 36 51 59 15.7%
Median Sales Price $131,000 $143,750 $148,500 3.3%
Average Sales Price $156,274 $152,744 $156,147 2.2%
Avg. Percent of Original List price 94.3% 97.2% 97.7% 0.5%
Avg. Days on Market Until Sold 181 170 175 2.9%
RESIDENTIAL
15.69% NO. OF SALES TOTAL LISTED INVENTORY FOR SALE
AVERAGE DAYS ON THE
MARKET
AVERAGE SALE PRICE
SALE PRICE VS LIST PRICE
2017 51 90 133 170 $152,744 97.2%
2018 59 78 105 175 $159,147 97.7%
Closed Sales
46
48
50
52
54
56
58
60
Residential
59
51
2017 2018
The Harrelson Group 2018 1st Quarter Market Report
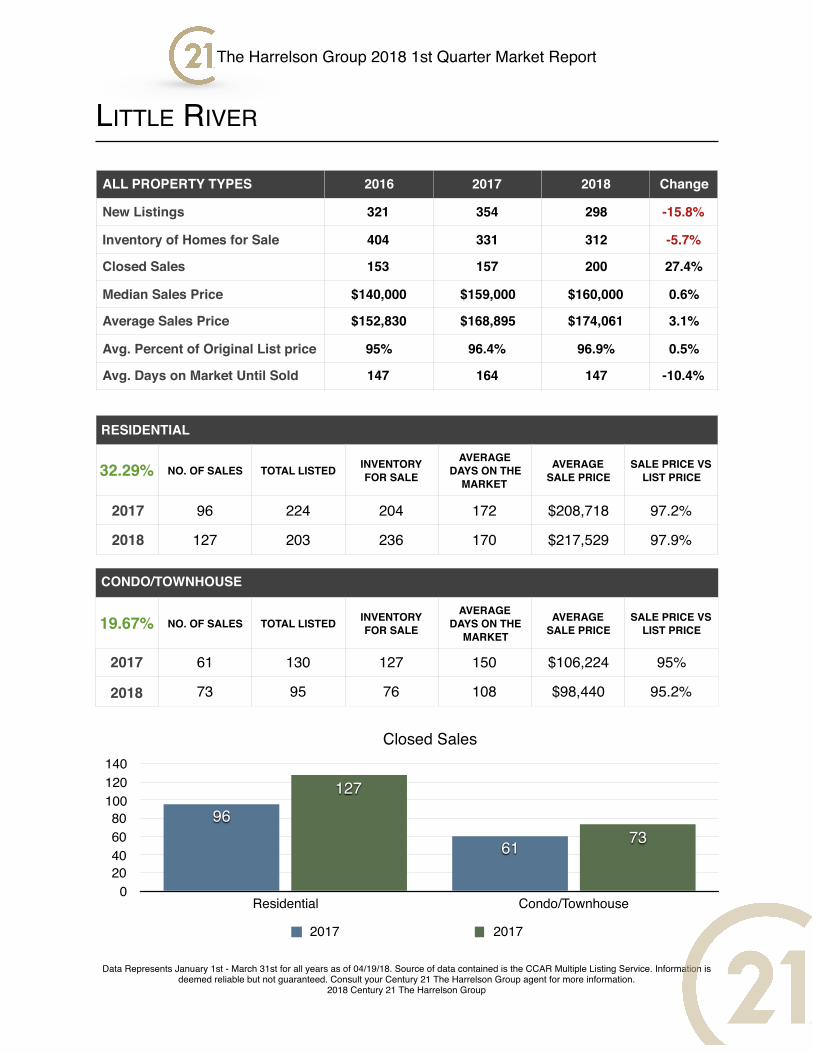
LITTLE RIVER
Data Represents January 1st - March 31st for all years as of 04/19/18. Source of data contained is the CCAR Multiple Listing Service. Information is deemed reliable but not guaranteed. Consult your Century 21 The Harrelson Group agent for more information.
2018 Century 21 The Harrelson Group
ALL PROPERTY TYPES 2016 2017 2018 Change
New Listings 321 354 298 -15.8%
Inventory of Homes for Sale 404 331 312 -5.7%
Closed Sales 153 157 200 27.4%
Median Sales Price $140,000 $159,000 $160,000 0.6%
Average Sales Price $152,830 $168,895 $174,061 3.1%
Avg. Percent of Original List price 95% 96.4% 96.9% 0.5%
Avg. Days on Market Until Sold 147 164 147 -10.4%
RESIDENTIAL
32.29% NO. OF SALES TOTAL LISTED INVENTORY FOR SALE
AVERAGE DAYS ON THE
MARKET
AVERAGE SALE PRICE
SALE PRICE VS LIST PRICE
2017 96 224 204 172 $208,718 97.2%
2018 127 203 236 170 $217,529 97.9%
CONDO/TOWNHOUSE
19.67% NO. OF SALES TOTAL LISTED INVENTORY FOR SALE
AVERAGE DAYS ON THE
MARKET
AVERAGE SALE PRICE
SALE PRICE VS LIST PRICE
2017 61 130 127 150 $106,224 95%
2018 73 95 76 108 $98,440 95.2%
Closed Sales
020406080
100120140
Residential Condo/Townhouse
73
127
61
96
2017 2017
The Harrelson Group 2018 1st Quarter Market Report
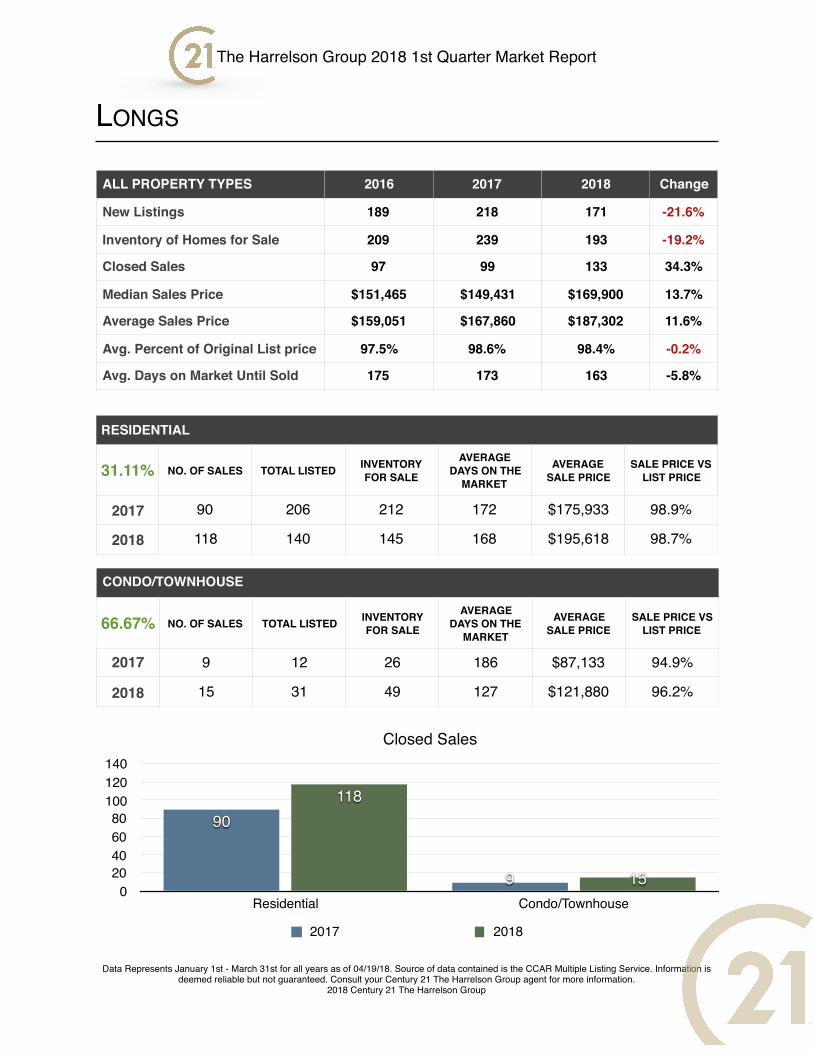
LONGS
Data Represents January 1st - March 31st for all years as of 04/19/18. Source of data contained is the CCAR Multiple Listing Service. Information is deemed reliable but not guaranteed. Consult your Century 21 The Harrelson Group agent for more information.
2018 Century 21 The Harrelson Group
ALL PROPERTY TYPES 2016 2017 2018 Change
New Listings 189 218 171 -21.6%
Inventory of Homes for Sale 209 239 193 -19.2%
Closed Sales 97 99 133 34.3%
Median Sales Price $151,465 $149,431 $169,900 13.7%
Average Sales Price $159,051 $167,860 $187,302 11.6%
Avg. Percent of Original List price 97.5% 98.6% 98.4% -0.2%
Avg. Days on Market Until Sold 175 173 163 -5.8%
RESIDENTIAL
31.11% NO. OF SALES TOTAL LISTED INVENTORY FOR SALE
AVERAGE DAYS ON THE
MARKET
AVERAGE SALE PRICE
SALE PRICE VS LIST PRICE
2017 90 206 212 172 $175,933 98.9%
2018 118 140 145 168 $195,618 98.7%
CONDO/TOWNHOUSE
66.67% NO. OF SALES TOTAL LISTED INVENTORY FOR SALE
AVERAGE DAYS ON THE
MARKET
AVERAGE SALE PRICE
SALE PRICE VS LIST PRICE
2017 9 12 26 186 $87,133 94.9%
2018 15 31 49 127 $121,880 96.2%
Closed Sales
020406080
100120140
Residential Condo/Townhouse
15
118
9
90
2017 2018
The Harrelson Group 2018 1st Quarter Market Report
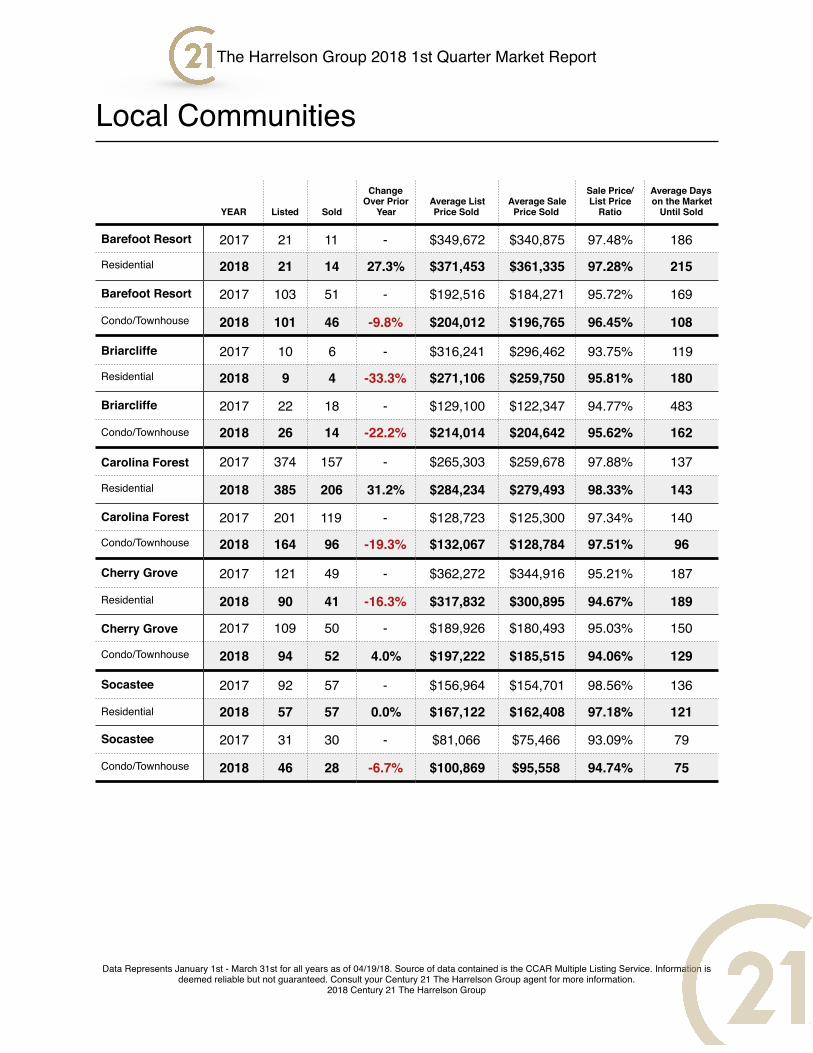
Local Communities
Data Represents January 1st - March 31st for all years as of 04/19/18. Source of data contained is the CCAR Multiple Listing Service. Information is deemed reliable but not guaranteed. Consult your Century 21 The Harrelson Group agent for more information.
2018 Century 21 The Harrelson Group
YEAR Listed Sold
Change Over Prior
YearAverage List Price Sold
Average Sale Price Sold
Sale Price/List Price
Ratio
Average Days on the Market
Until Sold
Barefoot Resort 2017 21 11 - $349,672 $340,875 97.48% 186
Residential 2018 21 14 27.3% $371,453 $361,335 97.28% 215
Barefoot Resort 2017 103 51 - $192,516 $184,271 95.72% 169
Condo/Townhouse 2018 101 46 -9.8% $204,012 $196,765 96.45% 108
Briarcliffe 2017 10 6 - $316,241 $296,462 93.75% 119
Residential 2018 9 4 -33.3% $271,106 $259,750 95.81% 180
Briarcliffe 2017 22 18 - $129,100 $122,347 94.77% 483
Condo/Townhouse 2018 26 14 -22.2% $214,014 $204,642 95.62% 162
Carolina Forest 2017 374 157 - $265,303 $259,678 97.88% 137
Residential 2018 385 206 31.2% $284,234 $279,493 98.33% 143
Carolina Forest 2017 201 119 - $128,723 $125,300 97.34% 140
Condo/Townhouse 2018 164 96 -19.3% $132,067 $128,784 97.51% 96
Cherry Grove 2017 121 49 - $362,272 $344,916 95.21% 187
Residential 2018 90 41 -16.3% $317,832 $300,895 94.67% 189
Cherry Grove 2017 109 50 - $189,926 $180,493 95.03% 150
Condo/Townhouse 2018 94 52 4.0% $197,222 $185,515 94.06% 129
Socastee 2017 92 57 - $156,964 $154,701 98.56% 136
Residential 2018 57 57 0.0% $167,122 $162,408 97.18% 121
Socastee 2017 31 30 - $81,066 $75,466 93.09% 79
Condo/Townhouse 2018 46 28 -6.7% $100,869 $95,558 94.74% 75
Recommended