CBRE Cap Rate SuRvey
Click to Enter
A CBRE Publication February 2012
In This Issue:
Overview pg 2
Office pg 5
Multihousing pg 12
Retail pg 16
Industrial pg 23
Hotels pg 27
Appendix pg 30
In ThIs Issue:
Overview
Office
Multihousing
Retail
Industrial
hotel
Appendix
Cap Rate Survey February 2012
2
<< | >>In ThIs Issue:
Overview
Office
Multihousing
Retail
Industrial
hotel
Appendix
Investor demand for uS commercial real estate assets expanded in 2011. a steady recovery in the leasing market conditions that drive income
combined with both low rates of return and excessive volatility in other asset classes has persuaded many investors to reconsider commercial real
estate investments. Figures from Real Capital analytics (RCa) show that transaction volume grew over 50% from 2010 with yearend property sales
totaling $211.2 billion. to put this figure into context, in 2005, the first year for which consistent figures are available, the uS market saw $339.4
billion in commercial property transactions.
the retail and hotel sectors saw the largest growth rates in investment activity in 2011, with volume up 89.1% and 96.8% respectively. part of these
high rates of growth is from the turnaround of expectations on the capacity of the uS consumer. Surveys of investor intentions consistently showed
retail as the least favored sector early into the downturn given the consumer related economic shocks.
another factor driving the high rates of growth is the investor preference for safety and security. the RCa figures show that for the retail sector,
investment sale activity within the strip center component was up 108% from a year earlier. this category is the component capturing grocery
anchored retail which came to be particularly favored by investors for with the focus on the sale of the daily necessities; these shopping centers
were not as impacted by the decline in discretionary spending seen during the economic downturn. Beyond this segment of retail however, other
asset types associated with core assets and core markets did well. Investment in the office sector was up 31.9% year over year, lower than overall
transaction volume, but the CBD office component was up 56.3% year over year. the perception that these assets have more durable exit pricing,
and exit liquidity, have made investors particularly hungry for these assets though the large lot sizes also makes CBD office assets an efficient way
to deploy large amounts of capital quickly.
the performance of the sector relative to other asset classes is clearly driving investors to seek to deploy large amounts of capital in commercial
property investments. the NCReIF property index shows that private equity real estate delivered at 14.3% total return in 2011. this figure came in
at a 13.1% return for 2010 delivering two consecutive years of double-digit returns. By contrast the S&p 500 only delivered a 2.1% total return in
2011 given the harsh fall-off seen in august following the downgrade of uS sovereign debt from aaa to aa+. Granted, commercial real estate also
suffered somewhat from the investor skittishness that accompanied the downgrade, into the 4th quarter of 2011 the pace of growth in investment
sales slowed to 10.4% on a year over year basis as investors struggled to make sense of the low levels of capitalization rates and expectations for
a moderate pace of job growth in the coming years.
United States Overview
In ThIs Issue:
Overview
Office
Multihousing
Retail
Industrial
hotel
Appendix
Cap Rate Survey February 2012
3
<< | >>In ThIs Issue:
Overview
Office
Multihousing
Retail
Industrial
hotel
Appendix
United States Overview (continued)
Despite volatility in the stock market in 2011, the labor market steadily added jobs. the pace of job growth accelerated each month early in 2011
averaging 207,000 new jobs per month through april. the combined effects of bad weather in the Northeast, tornadoes in the South and supply
chain disruptions from the Japanese tsunami combined to push monthly job growth down to an average of 80,000 new jobs per month from
May to august of 2011. Over the rest of the year though, the pace of job creation rebounded, averaging 170,000 new jobs per month. While
there was a slowdown in growth mid-year, the needle was always moving in the right direction. economic forecasts for 2012 generally hold job
growth to little more than that which was seen in 2011; still even this slow trend toward growth will help the performance of the leasing market and
property income.
With the exception of the retail sector, all commercial property types reported falling vacancy rates in 2011. at year end, office vacancy rates fell
to 16.0% with improvements in both CBD and Suburban office market. the office sector continues to enjoy strong transaction volume, with much of
the focus on Washington DC and Manhattan which accounted for more than 40% of all sales in 2011. For the year, the volume of office transactions
totaled just under $62.9 billion, up 31.9% year over year.
Industrial availability declined at a steady pace of 20 basis points per quarter in 2011 reaching 13.5% by year end. early in the recovery, only
those markets which were regional distribution centers or tech hubs saw improvements in leasing but by year end 2011, even markets like phoenix
where the fall in the housing caused so much pain saw substantial declines in availability rates. the recovery of the industrial investment market
in these housing driven metro areas is still tenuous however with our survey of cap rates for stabilized class a assets still in the high 6% to mid 7%
range for assets in housing-driven markets versus the low 5% range for distribution focused markets.
Retail has been the only property sector to report deteriorating fundamentals from last year. Retail availability came in at 13.2% by year end, up
from 13.0% at the end of 2010. the silver lining in the market is that pace of increase has stopped with availability now unchanged from the 3rd
quarter. according to RCa, sales volume ratcheted up to $42.1 billion in 2011 versus $22.3 billion in 2010. Roughly 60% of the volume in 2011
was focused on the strip center component of the market.
In ThIs Issue:
Overview
Office
Multihousing
Retail
Industrial
hotel
Appendix
Cap Rate Survey February 2012
4
<< | >>In ThIs Issue:
Overview
Office
Multihousing
Retail
Industrial
hotel
Appendix
United States Overview (continued)
Multihousing continues to enjoy the healthiest fundamentals as compared to the other property sectors. vacancy stood at 5.3% by year end 2011,
down from 6.0% at the end of 2010. the vacancy rate for the sector is now at the long-run average and as demand continues to grow, additional
rent pressure can be expected. Rents grew at an almost 5% pace in 2011 versus 1.4% for 2010. the sale of high-rise assets accounted for roughly
27% of all investment volume in the years from 2005 to 2008 but have accounted for just under 36% of all activity since 2009 in part due to investor
preference for assets in gateway markets. In 2011, just over 24% of all investment activity was focused on New york and Washington D.C., markets
where stabilized class a cap rates stood at 4% and 4.5% respectively at the end of 2011.
In the hotel sector the pace of growth in revenue per available room (Revpar) continues to steam ahead. In the full service segment, for the 4th
quarter of 2011 Revpar grew 7.8% from a year earlier while the limited service segment saw growth of 8.6%. this pace of Revpar growth has
been fairly constant since the economic recovery started in 2010. With a one-night lease term, the hotel sector was the first sector to show an
improvement. the recovering fundamentals have helped investors make the jump into the hotel sector with investment sales nearly doubling
into 2011.
In ThIs Issue:
Overview
Office
Multihousing
Retail
Industrial
hotel
Appendix
Cap Rate Survey February 2012
5
<< | >>In ThIs Issue:
Overview
Office
Multihousing
Retail
Industrial
hotel
Appendix
Office | Overview
Investment volume in the office sector is up $17.3 billion in 2011 versus 2010. To put this figure in perspective, in 2009 during the most
challenging economic environment the market has seen in a generation, total office investment activity was less than $17.1 billion; less than the
increase from last year. Most of this increase in activity was seen in the CBD office market which saw an increase of $12.8 billion from a year
earlier to reach $35.4 billion in activity. These markets have shown more liquidity than the suburban markets in 2011 with sales representing
56% of all activity despite these markets represent only 40% of all office inventory in the U.S.
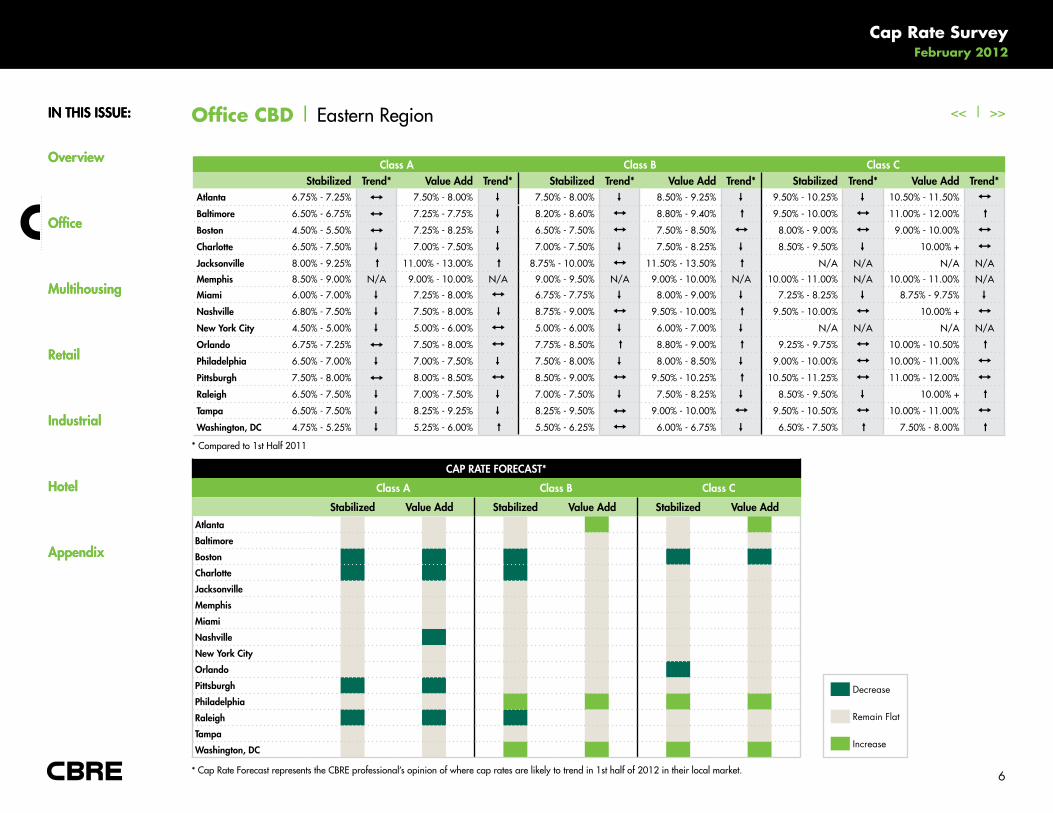
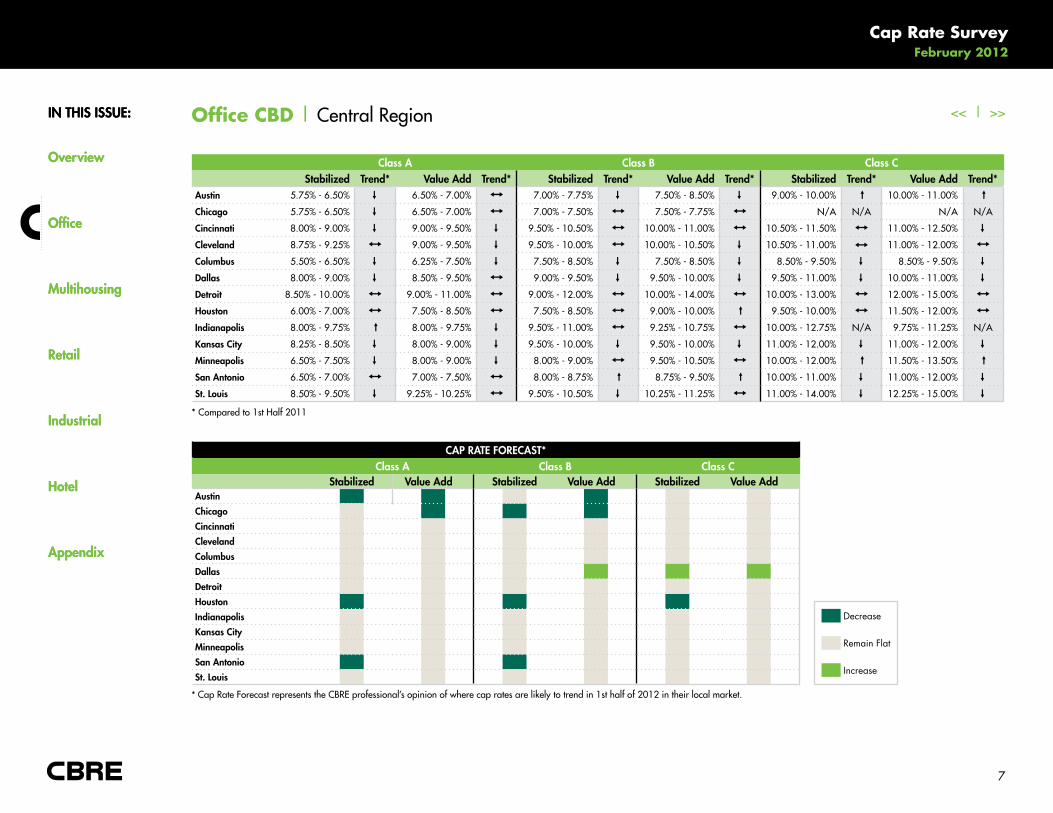
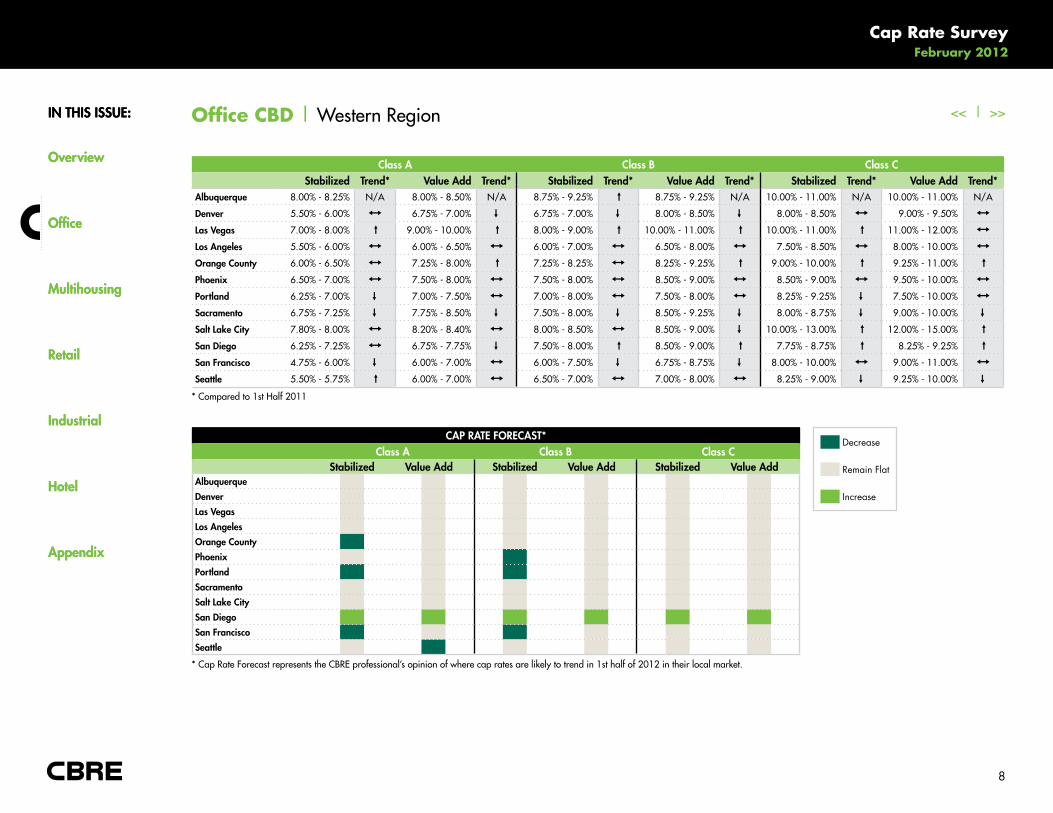
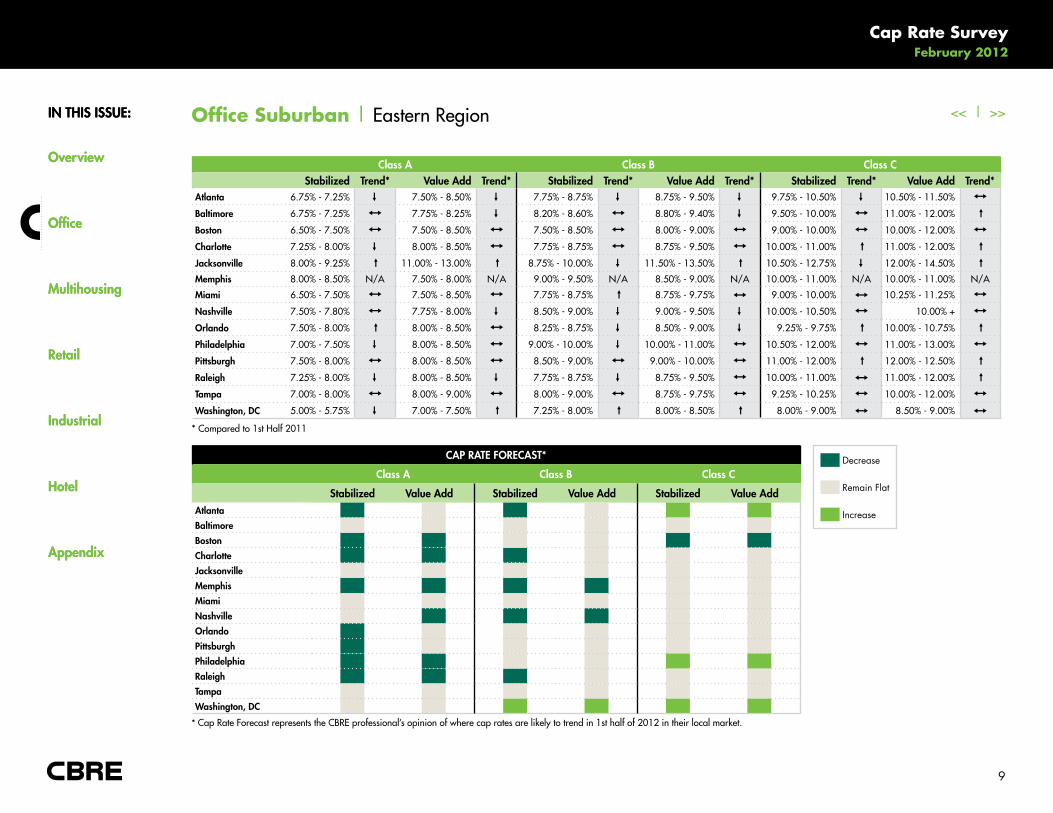
The CBRE Cap Rate Survey highlights a significant disparity in investor demand for office assets across different types of markets. There is a
450 basis point spread between the lowest and highest cap rates for stabilized Class A office assets in CBD submarkets and roughly a 390
basis point spread for assets in Suburban submarkets. In the mid-year 2011 version of this report, the disparity between the highest and lowest
CBD markets was also at about 450 basis points but in Suburban areas the spread was narrower at 340 basis points. With pricing so tight for
core assets in CBD office markets, some investors are beginning to stretch to investments in suburban locations in a select number of markets
and cap rates are adjusting.
Select from the list below to access the current CBD office cap rates and forecast.
Download a Complete Office CBD Current Cap Rates Chart (PDF)
Download a Complete Office CBD Cap Rate Forecast Chart (PDF)
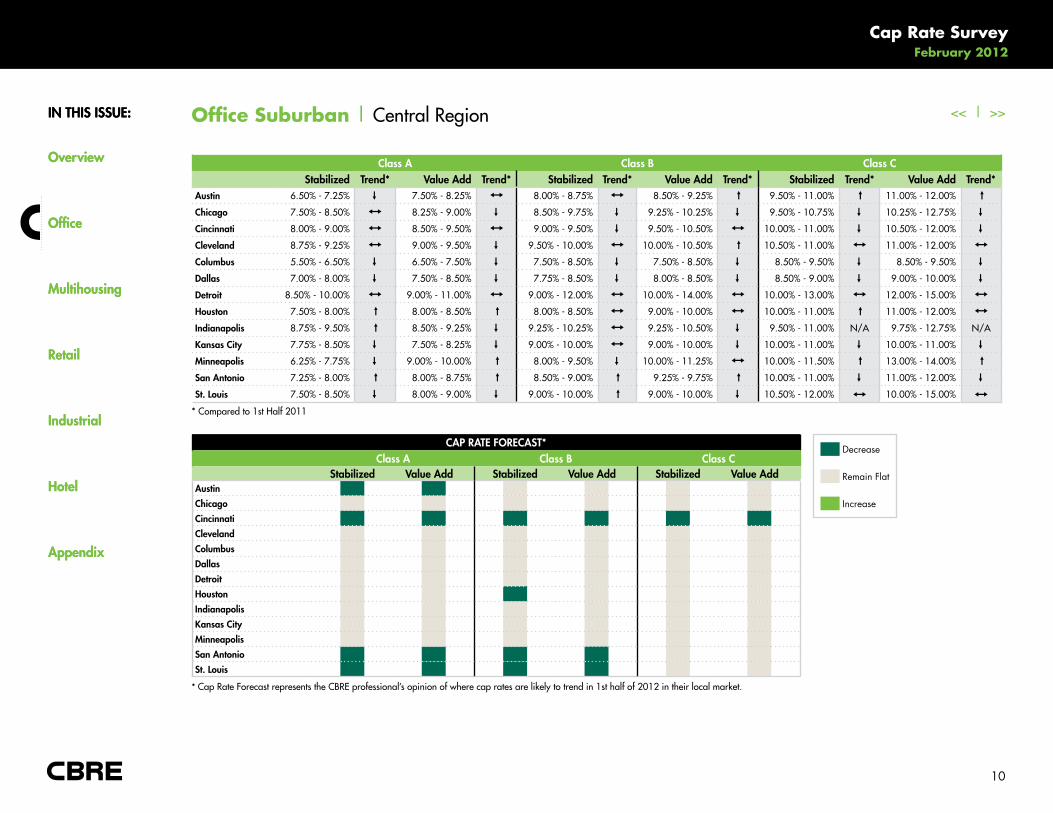
Select from the list below to access the current suburban office cap rates and forecast.
Download a Complete Office suburban Current Cap Rates Chart (PDF)
Download a Complete Office suburban Cap Rate Forecast Chart (PDF)
In ThIs Issue:
Overview
Office
Multihousing
Retail
Industrial
hotel
Appendix
Cap Rate Survey February 2012
6
<< | >>In ThIs Issue:
Overview
Office
Multihousing
Retail
Industrial
hotel
Appendix
Office CBD | eastern Region
* Compared to 1st Half 2011
CAP RATe FOReCAsT*
Class A Class B Class C
stabilized Value Add stabilized Value Add stabilized Value AddAtlanta
Baltimore
Boston
Charlotte
Jacksonville
Memphis
Miami
nashville
new York City
Orlando
Pittsburgh
Philadelphia
Raleigh
Tampa
Washington, DC
* Cap Rate Forecast represents the CBRe professional’s opinion of where cap rates are likely to trend in 1st half of 2012 in their local market.
Class A Class B Class Cstabilized Trend* Value Add Trend* stabilized Trend* Value Add Trend* stabilized Trend* Value Add Trend*
Atlanta 6.75% - 7.25% I 7.50% - 8.00%
↓
7.50% - 8.00%
↓
8.50% - 9.25%
↓
9.50% - 10.25%
↓
10.50% - 11.50%
I
Baltimore 6.50% - 6.75% I 7.25% - 7.75%
↓
8.20% - 8.60%
I
8.80% - 9.40% ↓ 9.50% - 10.00%
I
11.00% - 12.00% ↓
Boston 4.50% - 5.50% I 7.25% - 8.25%
↓
6.50% - 7.50%
I
7.50% - 8.50%
I
8.00% - 9.00%
I
9.00% - 10.00%
I
Charlotte 6.50% - 7.50%
↓
7.00% - 7.50%
↓
7.00% - 7.50%
↓
7.50% - 8.25%
↓
8.50% - 9.50%
↓
10.00% +
I
Jacksonville 8.00% - 9.25% ↓ 11.00% - 13.00% ↓ 8.75% - 10.00%
I
11.50% - 13.50% ↓ N/a N/a N/a N/a
Memphis 8.50% - 9.00% N/a 9.00% - 10.00% N/a 9.00% - 9.50% N/a 9.00% - 10.00% N/a 10.00% - 11.00% N/a 10.00% - 11.00% N/a
Miami 6.00% - 7.00%
↓
7.25% - 8.00%
I
6.75% - 7.75%
↓
8.00% - 9.00%
↓
7.25% - 8.25%
↓
8.75% - 9.75%
↓
nashville 6.80% - 7.50%
↓
7.50% - 8.00%
↓
8.75% - 9.00%
I
9.50% - 10.00% ↓ 9.50% - 10.00%
I
10.00% +
I
new York City 4.50% - 5.00%
↓
5.00% - 6.00%
I
5.00% - 6.00%
↓
6.00% - 7.00%
↓
N/a N/a N/a N/a
Orlando 6.75% - 7.25% I 7.50% - 8.00%
I
7.75% - 8.50% ↓ 8.80% - 9.00% ↓ 9.25% - 9.75%
I
10.00% - 10.50% ↓
Philadelphia 6.50% - 7.00%
↓
7.00% - 7.50%
↓
7.50% - 8.00%
↓
8.00% - 8.50%
↓
9.00% - 10.00%
I
10.00% - 11.00%
I
Pittsburgh 7.50% - 8.00% I 8.00% - 8.50%
I
8.50% - 9.00%
I
9.50% - 10.25% ↓ 10.50% - 11.25%
I
11.00% - 12.00%
I
Raleigh 6.50% - 7.50%
↓
7.00% - 7.50%
↓
7.00% - 7.50%
↓
7.50% - 8.25%
↓
8.50% - 9.50%
↓
10.00% + ↓
Tampa 6.50% - 7.50%↓
8.25% - 9.25%↓
8.25% - 9.50% I 9.00% - 10.00%I
9.50% - 10.50%I
10.00% - 11.00%I
Washington, DC 4.75% - 5.25%
↓
5.25% - 6.00% ↓ 5.50% - 6.25%
I
6.00% - 6.75%
↓
6.50% - 7.50% ↓ 7.50% - 8.00% ↓
Decrease
Remain Flat
Increase
In ThIs Issue:
Overview
Office
Multihousing
Retail
Industrial
hotel
Appendix
Cap Rate Survey February 2012
7
<< | >>In ThIs Issue:
Overview
Office
Multihousing
Retail
Industrial
hotel
Appendix
Office CBD | Central Region
Class A Class B Class Cstabilized Trend* Value Add Trend* stabilized Trend* Value Add Trend* stabilized Trend* Value Add Trend*
Austin 5.75% - 6.50%
↓
6.50% - 7.00%
I
7.00% - 7.75%
↓
7.50% - 8.50%
↓
9.00% - 10.00% ↓ 10.00% - 11.00% ↓
Chicago 5.75% - 6.50%
↓
6.50% - 7.00%
I
7.00% - 7.50%
I
7.50% - 7.75%
I
N/a N/a N/a N/a
Cincinnati 8.00% - 9.00%
↓
9.00% - 9.50%
↓
9.50% - 10.50%
I
10.00% - 11.00%
I
10.50% - 11.50%
I
11.00% - 12.50%
↓
Cleveland 8.75% - 9.25%
I
9.00% - 9.50%
↓
9.50% - 10.00%
I
10.00% - 10.50%
↓
10.50% - 11.00% I 11.00% - 12.00%
I
Columbus 5.50% - 6.50%
↓
6.25% - 7.50%
↓
7.50% - 8.50%
↓
7.50% - 8.50%
↓
8.50% - 9.50%
↓
8.50% - 9.50%
↓
Dallas 8.00% - 9.00%
↓
8.50% - 9.50%
I
9.00% - 9.50%
↓
9.50% - 10.00%
↓
9.50% - 11.00%
↓
10.00% - 11.00%
↓
Detroit 8.50% - 10.00%
I
9.00% - 11.00%
I
9.00% - 12.00%
I
10.00% - 14.00%
I
10.00% - 13.00%
I
12.00% - 15.00%
I
houston 6.00% - 7.00%
I
7.50% - 8.50%
I
7.50% - 8.50%
I
9.00% - 10.00% ↓ 9.50% - 10.00%
I
11.50% - 12.00%
I
Indianapolis 8.00% - 9.75% ↓ 8.00% - 9.75%
↓
9.50% - 11.00%
I
9.25% - 10.75%
I
10.00% - 12.75% N/a 9.75% - 11.25% N/a
Kansas City 8.25% - 8.50%
↓
8.00% - 9.00%
↓
9.50% - 10.00%
↓
9.50% - 10.00%
↓
11.00% - 12.00%
↓
11.00% - 12.00%
↓
Minneapolis 6.50% - 7.50%
↓
8.00% - 9.00%
↓
8.00% - 9.00%
I
9.50% - 10.50%
I
10.00% - 12.00% ↓ 11.50% - 13.50% ↓
san Antonio 6.50% - 7.00%
I
7.00% - 7.50%
I
8.00% - 8.75% ↓ 8.75% - 9.50% ↓ 10.00% - 11.00%
↓
11.00% - 12.00%
↓
st. Louis 8.50% - 9.50%
↓
9.25% - 10.25%
I
9.50% - 10.50%
↓
10.25% - 11.25%
I
11.00% - 14.00%
↓
12.25% - 15.00%
↓
CAP RATe FOReCAsT*Class A Class B Class C
stabilized Value Add stabilized Value Add stabilized Value AddAustinChicagoCincinnatiClevelandColumbusDallasDetroithoustonIndianapolisKansas CityMinneapolissan Antoniost. Louis
Decrease
Remain Flat
Increase
* Compared to 1st Half 2011
* Cap Rate Forecast represents the CBRe professional’s opinion of where cap rates are likely to trend in 1st half of 2012 in their local market.
In ThIs Issue:
Overview
Office
Multihousing
Retail
Industrial
hotel
Appendix
Cap Rate Survey February 2012
8
<< | >>In ThIs Issue:
Overview
Office
Multihousing
Retail
Industrial
hotel
Appendix
Office CBD | Western Region
Class A Class B Class Cstabilized Trend* Value Add Trend* stabilized Trend* Value Add Trend* stabilized Trend* Value Add Trend*
Albuquerque 8.00% - 8.25% N/a 8.00% - 8.50% N/a 8.75% - 9.25% ↓ 8.75% - 9.25% N/a 10.00% - 11.00% N/a 10.00% - 11.00% N/a
Denver 5.50% - 6.00%
I
6.75% - 7.00%
↓
6.75% - 7.00%
↓
8.00% - 8.50%
↓
8.00% - 8.50%
I
9.00% - 9.50%
I
Las Vegas 7.00% - 8.00% ↓ 9.00% - 10.00% ↓ 8.00% - 9.00% ↓ 10.00% - 11.00% ↓ 10.00% - 11.00% ↓ 11.00% - 12.00%
I
Los Angeles 5.50% - 6.00%
I
6.00% - 6.50%
I
6.00% - 7.00%
I
6.50% - 8.00%
I
7.50% - 8.50%
I
8.00% - 10.00%
I
Orange County 6.00% - 6.50%
I
7.25% - 8.00% ↓ 7.25% - 8.25%
I
8.25% - 9.25% ↓ 9.00% - 10.00% ↓ 9.25% - 11.00% ↓
Phoenix 6.50% - 7.00%
I
7.50% - 8.00%
I
7.50% - 8.00%
I
8.50% - 9.00%
I
8.50% - 9.00%
I
9.50% - 10.00%
I
Portland 6.25% - 7.00%
↓
7.00% - 7.50%
I
7.00% - 8.00%
I
7.50% - 8.00%
I
8.25% - 9.25%
↓
7.50% - 10.00%
I
sacramento 6.75% - 7.25%
↓
7.75% - 8.50%
↓
7.50% - 8.00%
↓
8.50% - 9.25%
↓
8.00% - 8.75%
↓
9.00% - 10.00%
↓
salt Lake City 7.80% - 8.00%
I
8.20% - 8.40%
I
8.00% - 8.50%
I
8.50% - 9.00%
↓
10.00% - 13.00% ↓ 12.00% - 15.00% ↓
san Diego 6.25% - 7.25%
I
6.75% - 7.75%
↓
7.50% - 8.00% ↓ 8.50% - 9.00% ↓ 7.75% - 8.75% ↓ 8.25% - 9.25% ↓
san Francisco 4.75% - 6.00%
↓
6.00% - 7.00%
I
6.00% - 7.50%
↓
6.75% - 8.75%
↓
8.00% - 10.00%
I
9.00% - 11.00%
I
seattle 5.50% - 5.75% ↓ 6.00% - 7.00%
I
6.50% - 7.00%
I
7.00% - 8.00%
I
8.25% - 9.00%
↓
9.25% - 10.00%
↓Decrease
Remain Flat
Increase
CAP RATe FOReCAsT*Class A Class B Class C
stabilized Value Add stabilized Value Add stabilized Value AddAlbuquerqueDenverLas VegasLos AngelesOrange CountyPhoenixPortlandsacramentosalt Lake Citysan Diegosan Franciscoseattle
* Compared to 1st Half 2011
* Cap Rate Forecast represents the CBRe professional’s opinion of where cap rates are likely to trend in 1st half of 2012 in their local market.
In ThIs Issue:
Overview
Office
Multihousing
Retail
Industrial
hotel
Appendix
Cap Rate Survey February 2012
9
<< | >>In ThIs Issue:
Overview
Office
Multihousing
Retail
Industrial
hotel
Appendix
Office Suburban | eastern Region
Class A Class B Class Cstabilized Trend* Value Add Trend* stabilized Trend* Value Add Trend* stabilized Trend* Value Add Trend*
Atlanta 6.75% - 7.25%
↓
7.50% - 8.50%
↓
7.75% - 8.75%
↓
8.75% - 9.50%
↓
9.75% - 10.50%
↓
10.50% - 11.50%
I
Baltimore 6.75% - 7.25%
I
7.75% - 8.25%
↓
8.20% - 8.60%
I
8.80% - 9.40%
↓
9.50% - 10.00%
I
11.00% - 12.00% ↓
Boston 6.50% - 7.50%
I
7.50% - 8.50%
I
7.50% - 8.50%
I
8.00% - 9.00%
I
9.00% - 10.00%
I
10.00% - 12.00%
I
Charlotte 7.25% - 8.00%
↓
8.00% - 8.50%
I
7.75% - 8.75%
I
8.75% - 9.50%
I
10.00% - 11.00% ↓ 11.00% - 12.00% ↓
Jacksonville 8.00% - 9.25% ↓ 11.00% - 13.00% ↓ 8.75% - 10.00%
↓
11.50% - 13.50% ↓ 10.50% - 12.75%
↓
12.00% - 14.50% ↓
Memphis 8.00% - 8.50% N/a 7.50% - 8.00% N/a 9.00% - 9.50% N/a 8.50% - 9.00% N/a 10.00% - 11.00% N/a 10.00% - 11.00% N/a
Miami 6.50% - 7.50%
I
7.50% - 8.50%
I
7.75% - 8.75% ↓ 8.75% - 9.75% I 9.00% - 10.00% I 10.25% - 11.25%
I
nashville 7.50% - 7.80%
I
7.75% - 8.00%
↓
8.50% - 9.00%
↓
9.00% - 9.50%
↓
10.00% - 10.50%
I
10.00% +
I
Orlando 7.50% - 8.00% ↓ 8.00% - 8.50%
I
8.25% - 8.75%
↓
8.50% - 9.00%
↓
9.25% - 9.75% ↓ 10.00% - 10.75% ↓
Philadelphia 7.00% - 7.50%
↓
8.00% - 8.50%
I
9.00% - 10.00%
↓
10.00% - 11.00%
I
10.50% - 12.00%
I
11.00% - 13.00%
I
Pittsburgh 7.50% - 8.00%
I
8.00% - 8.50%
I
8.50% - 9.00%
I
9.00% - 10.00%
I
11.00% - 12.00% ↓ 12.00% - 12.50% ↓
Raleigh 7.25% - 8.00%
↓
8.00% - 8.50%
↓
7.75% - 8.75%
↓
8.75% - 9.50%
I
10.00% - 11.00% I 11.00% - 12.00% ↓
Tampa 7.00% - 8.00%
I
8.00% - 9.00%
I
8.00% - 9.00%
I
8.75% - 9.75%
I
9.25% - 10.25%
I
10.00% - 12.00%
I Washington, DC 5.00% - 5.75%
↓7.00% - 7.50% ↓ 7.25% - 8.00% ↓ 8.00% - 8.50% ↓ 8.00% - 9.00% I 8.50% - 9.00% I
CAP RATe FOReCAsT*
Class A Class B Class C
stabilized Value Add stabilized Value Add stabilized Value AddAtlantaBaltimoreBostonCharlotteJacksonvilleMemphisMiaminashvilleOrlandoPittsburghPhiladelphiaRaleighTampaWashington, DC
Decrease
Remain Flat
Increase
* Compared to 1st Half 2011
* Cap Rate Forecast represents the CBRe professional’s opinion of where cap rates are likely to trend in 1st half of 2012 in their local market.
In ThIs Issue:
Overview
Office
Multihousing
Retail
Industrial
hotel
Appendix
Cap Rate Survey February 2012
10
<< | >>In ThIs Issue:
Overview
Office
Multihousing
Retail
Industrial
hotel
Appendix
Office Suburban | Central Region
CAP RATe FOReCAsT*Class A Class B Class C
stabilized Value Add stabilized Value Add stabilized Value AddAustinChicagoCincinnatiClevelandColumbusDallasDetroithoustonIndianapolisKansas CityMinneapolissan Antoniost. Louis
Class A Class B Class Cstabilized Trend* Value Add Trend* stabilized Trend* Value Add Trend* stabilized Trend* Value Add Trend*
Austin 6.50% - 7.25%
↓
7.50% - 8.25%
I
8.00% - 8.75%
I
8.50% - 9.25% ↓ 9.50% - 11.00% ↓ 11.00% - 12.00% ↓
Chicago 7.50% - 8.50%
I
8.25% - 9.00%
↓
8.50% - 9.75%
↓
9.25% - 10.25%
↓
9.50% - 10.75%
↓
10.25% - 12.75%
↓
Cincinnati 8.00% - 9.00%
I
8.50% - 9.50%
I
9.00% - 9.50%
↓
9.50% - 10.50%
I
10.00% - 11.00%
↓
10.50% - 12.00%
↓
Cleveland 8.75% - 9.25%
I
9.00% - 9.50%
↓
9.50% - 10.00%
I
10.00% - 10.50% ↓ 10.50% - 11.00%
I
11.00% - 12.00%
I
Columbus 5.50% - 6.50%
↓
6.50% - 7.50%
↓
7.50% - 8.50%
↓
7.50% - 8.50%
↓
8.50% - 9.50%
↓
8.50% - 9.50%
↓
Dallas 7.00% - 8.00%
↓
7.50% - 8.50%
↓
7.75% - 8.50%
↓
8.00% - 8.50%
↓
8.50% - 9.00%
↓
9.00% - 10.00%
↓
Detroit 8.50% - 10.00%
I
9.00% - 11.00%
I
9.00% - 12.00%
I
10.00% - 14.00%
I
10.00% - 13.00%
I
12.00% - 15.00%
I
houston 7.50% - 8.00% ↓ 8.00% - 8.50% ↓ 8.00% - 8.50%
I
9.00% - 10.00%
I
10.00% - 11.00% ↓ 11.00% - 12.00%
I
Indianapolis 8.75% - 9.50% ↓ 8.50% - 9.25%
↓
9.25% - 10.25%
I
9.25% - 10.50%
↓
9.50% - 11.00% N/a 9.75% - 12.75% N/a
Kansas City 7.75% - 8.50%
↓
7.50% - 8.25%
↓
9.00% - 10.00%
I
9.00% - 10.00%
↓
10.00% - 11.00%
↓
10.00% - 11.00%
↓
Minneapolis 6.25% - 7.75%
↓
9.00% - 10.00% ↓ 8.00% - 9.50%
↓
10.00% - 11.25%
I
10.00% - 11.50% ↓ 13.00% - 14.00% ↓
san Antonio 7.25% - 8.00% ↓ 8.00% - 8.75% ↓ 8.50% - 9.00% ↓ 9.25% - 9.75% ↓ 10.00% - 11.00%
↓
11.00% - 12.00%
↓
st. Louis 7.50% - 8.50%
↓
8.00% - 9.00%
↓
9.00% - 10.00% ↓ 9.00% - 10.00%
↓
10.50% - 12.00% I 10.00% - 15.00% I
Decrease
Remain Flat
Increase
* Compared to 1st Half 2011
* Cap Rate Forecast represents the CBRe professional’s opinion of where cap rates are likely to trend in 1st half of 2012 in their local market.

In ThIs Issue:
Overview
Office
Multihousing
Retail
Industrial
hotel
Appendix
Cap Rate Survey February 2012
11
<< | >>In ThIs Issue:
Overview
Office
Multihousing
Retail
Industrial
hotel
Appendix
Office Suburban | Western Region
Class A Class B Class Cstabilized Trend* Value Add Trend* stabilized Trend* Value Add Trend* stabilized Trend* Value Add Trend*
Albuquerque 8.00% - 8.25% ↓ 7.75% - 8.25% N/a 8.50% - 9.00% N/a 8.50% - 9.00%
I
10.00% - 11.00% N/a 10.00% - 11.00% ↓
Denver 6.50% - 7.00%
I
7.75% - 8.25%
I
8.00% - 8.50%
I
9.00% - 9.50%
I
9.00% - 10.00%
I
10.50% - 11.00%
I
Las Vegas 7.50% - 8.50% ↓ 9.50% - 10.50% ↓ 8.50% - 9.50% ↓ 10.50% - 11.50% ↓ 9.50% - 10.50%
↓
11.50% - 12.50% N/a
Los Angeles 5.50% - 7.00%
I
6.00% - 7.50%
I
6.50% - 7.50%
I
7.00% - 8.00%
I
7.50% - 9.00%
I
8.50% - 10.00%
I
Orange County 6.00% - 6.50%
↓
7.25% - 8.00%
I
7.25% - 8.25%
↓
8.25% - 9.25%
I
9.00% - 10.00% ↓ 9.25% - 11.00%
I
Phoenix 7.00% - 7.50%
↓
8.00% - 8.50%
↓
8.00% - 8.50%
I
9.00% - 9.50%
I
9.50% - 10.00%
I
10.50% - 11.00%
I
Portland 7.50% - 8.00%
↓
8.00% - 8.75%
I
8.50% - 9.25%
↓
9.25% - 10.25%
↓
9.00% - 10.00%
I
10.50% - 11.00%
I
sacramento 7.00% - 7.50%
↓
8.00% - 8.50%
↓
7.75% - 8.50%
↓
8.50% - 9.25%
↓
8.50% - 9.25%
↓
9.00% - 10.00% ↓
salt Lake City 7.80 % - 8.00%
I
8.20% - 8.40%
I
8.00% - 8.50%
I
8.50% - 9.00%
↓
10.00% - 13.00% ↓ 12.00% - 15.00% ↓
san Diego 6.00% - 7.00%
I
6.50% - 7.50%
I
6.75% - 7.75%
I
7.25% - 8.25%
I
7.50% - 8.50%
I
8.00% - 9.00%
I
san Francisco 5.75% - 6.75%
I
6.00% - 7.00%
↓
6.00% - 7.50%
↓
7.25% - 9.25%
↓
8.75% - 10.50%
↓
9.25% - 11.50%
↓
seattle 5.50% - 6.25% I 6.00% - 8.00%
I
6.50% - 7.50% I 7.00% - 8.00%
I
7.50% - 9.00% I 8.00% - 9.50%
↓
Decrease
Remain Flat
Increase
CAP RATe FOReCAsT*Class A Class B Class C
stabilized Value Add stabilized Value Add stabilized Value AddAlbuquerqueDenverLas VegasLos AngelesOrange CountyPhoenixPortlandsacramentosalt Lake Citysan Diegosan Franciscoseattle
* Compared to 1st Half 2011
* Cap Rate Forecast represents the CBRe professional’s opinion of where cap rates are likely to trend in 1st half of 2012 in their local market.
In ThIs Issue:
Overview
Office
Multihousing
Retail
Industrial
hotel
Appendix
Cap Rate Survey February 2012
12
<< | >>In ThIs Issue:
Overview
Office
Multihousing
Retail
Industrial
hotel
Appendix
Multihousing | Overview
Across all sectors of commercial real estate investment, multihousing is the sector that saw the earliest turnaround of investor interest as the positive trends in income fundamentals seen over the last two years had been widely expected. The stabilizing influence of the debt provided by the GSEs was an enormous help for market liquidity as well. Total transaction activity in 2011 came in at $53.8 billion according to figures from RCA, though this figure is still well off of the peak level of $93.8 billion in sales seen in 2006.
Across markets, the CBRE Cap Rate Survey paints a picture of healthy investor demand across a number of markets. In the 41 major markets surveyed, cap rates for Class A stabilized multihousing assets came in lower than 5.5% in 21 of these markets. This 5.5% level is interesting as this is the level at which our economists at CBRE Econometric Advisors are thinking that the Ten Year Treasury will peak once the economy is through this turbulent patch. These low levels relative to the Ten Year Treasury do not suggest that these assets are overpriced so much as they indicate that investors expect that the income growth seen in multihousing through 2011 will continue over the next few years.
Select from the list below to access the current multihousing cap rates and forecast.
Download a Complete Multihousing Current Cap Rates Chart (PDF)
Download a Complete Multihousing Cap Rate Forecast Chart (PDF)
In ThIs Issue:
Overview
Office
Multihousing
Retail
Industrial
hotel
Appendix
Cap Rate Survey February 2012
13
<< | >>In ThIs Issue:
Overview
Office
Multihousing
Retail
Industrial
hotel
Appendix
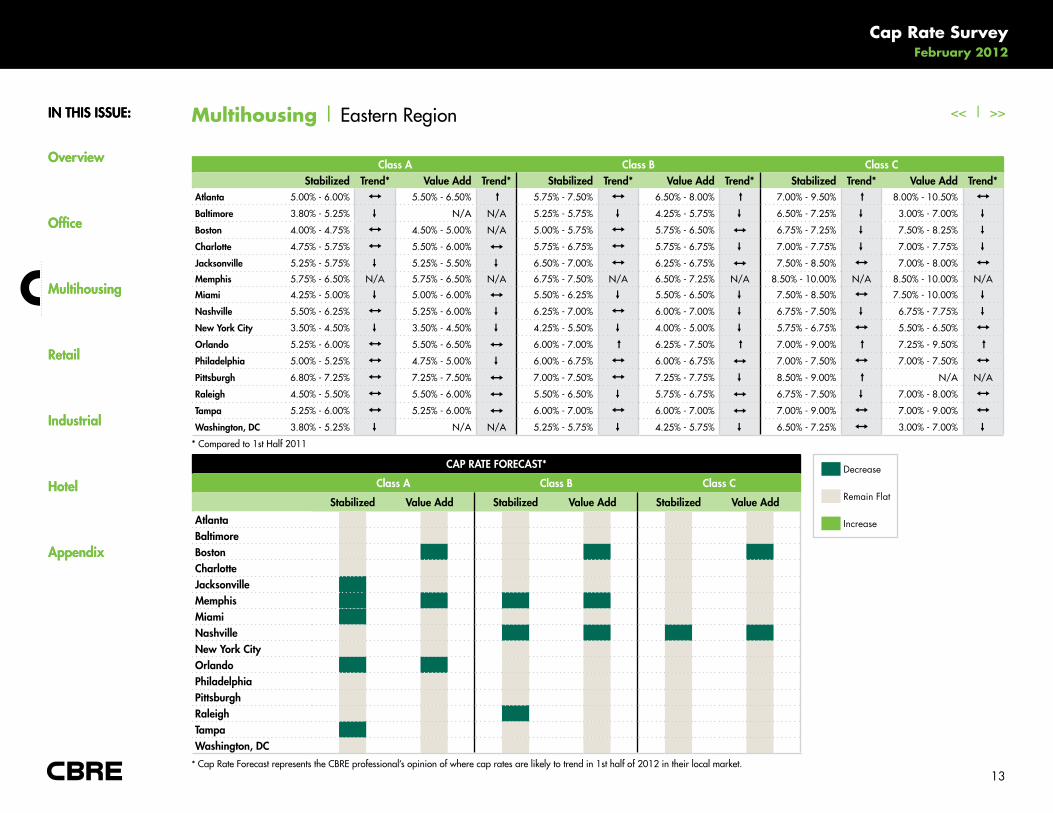
Multihousing | eastern Region
Class A Class B Class Cstabilized Trend* Value Add Trend* stabilized Trend* Value Add Trend* stabilized Trend* Value Add Trend*
Atlanta 5.00% - 6.00%
I
5.50% - 6.50% ↓ 5.75% - 7.50%
I
6.50% - 8.00% ↓ 7.00% - 9.50% ↓ 8.00% - 10.50%
I
Baltimore 3.80% - 5.25%
↓
N/a N/a 5.25% - 5.75%
↓
4.25% - 5.75%
↓
6.50% - 7.25%
↓
3.00% - 7.00%
↓
Boston 4.00% - 4.75%
I
4.50% - 5.00% N/a 5.00% - 5.75%
I
5.75% - 6.50% I 6.75% - 7.25%
↓
7.50% - 8.25%
↓
Charlotte 4.75% - 5.75%
I
5.50% - 6.00% I 5.75% - 6.75%
I
5.75% - 6.75%
↓
7.00% - 7.75%
↓
7.00% - 7.75%
↓
Jacksonville 5.25% - 5.75%
↓
5.25% - 5.50%
↓
6.50% - 7.00%
I
6.25% - 6.75% I 7.50% - 8.50%
I
7.00% - 8.00%
I
Memphis 5.75% - 6.50% N/a 5.75% - 6.50% N/a 6.75% - 7.50% N/a 6.50% - 7.25% N/a 8.50% - 10.00% N/a 8.50% - 10.00% N/a
Miami 4.25% - 5.00%
↓
5.00% - 6.00% I 5.50% - 6.25%
↓
5.50% - 6.50%
↓
7.50% - 8.50%
I
7.50% - 10.00%
↓
nashville 5.50% - 6.25%
I
5.25% - 6.00%
↓
6.25% - 7.00%
I
6.00% - 7.00%
↓
6.75% - 7.50%
↓
6.75% - 7.75%
↓
new York City 3.50% - 4.50%
↓
3.50% - 4.50%
↓
4.25% - 5.50%
↓
4.00% - 5.00%
↓
5.75% - 6.75%
I
5.50% - 6.50%
I
Orlando 5.25% - 6.00%
I
5.50% - 6.50% I 6.00% - 7.00% ↓ 6.25% - 7.50% ↓ 7.00% - 9.00% ↓ 7.25% - 9.50% ↓
Philadelphia 5.00% - 5.25%
I
4.75% - 5.00%
↓
6.00% - 6.75%
I
6.00% - 6.75% I 7.00% - 7.50%
I
7.00% - 7.50%
I
Pittsburgh 6.80% - 7.25%
I
7.25% - 7.50% I 7.00% - 7.50%
I
7.25% - 7.75%
↓
8.50% - 9.00% ↓ N/a N/a
Raleigh 4.50% - 5.50%
I
5.50% - 6.00% I 5.50% - 6.50%
↓
5.75% - 6.75% I 6.75% - 7.50%
↓
7.00% - 8.00%
ITampa 5.25% - 6.00%
I
5.25% - 6.00% I 6.00% - 7.00%I
6.00% - 7.00% I 7.00% - 9.00%I
7.00% - 9.00%I
Washington, DC 3.80% - 5.25%
↓
N/a N/a 5.25% - 5.75%
↓
4.25% - 5.75%
↓
6.50% - 7.25%
I
3.00% - 7.00%
↓
Decrease
Remain Flat
Increase
CAP RATe FOReCAsT*
Class A Class B Class C
stabilized Value Add stabilized Value Add stabilized Value Add
AtlantaBaltimoreBostonCharlotteJacksonvilleMemphisMiaminashvillenew York CityOrlandoPhiladelphiaPittsburghRaleighTampaWashington, DC
* Compared to 1st Half 2011
* Cap Rate Forecast represents the CBRe professional’s opinion of where cap rates are likely to trend in 1st half of 2012 in their local market.

In ThIs Issue:
Overview
Office
Multihousing
Retail
Industrial
hotel
Appendix
Cap Rate Survey February 2012
14
<< | >>In ThIs Issue:
Overview
Office
Multihousing
Retail
Industrial
hotel
Appendix
Multihousing | Central Region
CAP RATe FOReCAsT*Class A Class B Class C
stabilized Value Add stabilized Value Add stabilized Value AddAustinChicagoCincinnatiClevelandColumbusDallasDetroithoustonIndianapolisKansas CityMinneapolissan Antoniost. Louis
Class A Class B Class Cstabilized Trend* Value Add Trend* stabilized Trend* Value Add Trend* stabilized Trend* Value Add Trend*
Austin 4.75% - 5.75%
I
4.75% - 5.75% ↓ 6.00% - 6.75%
↓
6.00% - 6.75%
↓
6.50% - 7.25%
↓
6.50% - 7.25%
↓
Chicago 4.75% - 5.00%
I
4.50% - 4.75% I 6.25% - 6.50%
I
6.00% - 6.25% I 7.50% - 7.75% ↓ 7.25% - 7.50% ↓
Cincinnati 6.50% - 7.00%
I
7.00% - 7.50% I 7.75% - 8.25% ↓ 8.25% - 8.75% I 9.00% - 9.50%
↓
9.50% - 10.00%
↓
Cleveland 6.90% - 7.50%
↓
N/a N/a 9.00% - 10.00% N/a N/a N/a 9.00% - 10.50%
↓
11.00% - 12.00% ↓
Columbus 6.00% - 7.00%
I
6.25% - 7.25% I 7.00% - 8.00%
I
7.50% - 8.50%
↓
9.00% - 11.00%
I
12.00% - 16.00% ↓
Dallas 4.50% - 6.00%
↓
5.50% - 6.50% I 6.50% - 7.25%
I
7.00% - 8.00% I 8.00% - 10.00%
I
8.00% +
↓
Detroit 6.75% - 7.75%
↓
7.50% - 8.00%
↓
7.50% - 8.50%
↓
8.00% - 9.00%
↓
8.75% - 9.50%
↓
9.50% - 10.50%
↓
houston 5.00% - 6.00%
I
5.50% - 6.50% ↓ 6.50% - 7.50%
I
7.25% - 8.00% ↓ 8.00% - 9.00%
I
8.00% - 9.50%
I
Indianapolis 6.00% - 6.50%
I
5.50% - 6.25%
↓
7.00% - 7.50%
I
6.50% - 7.00% I 8.00% - 9.00%
I
8.00% - 12.00% ↓
Kansas City 5.50% - 6.50%
I
5.50% - 6.50% I 7.00% - 8.00%
I
6.50% - 7.00% I 8.50% - 10.00%
I
7.50% - 8.00%
↓
Minneapolis 5.00% - 5.50%
I
5.00% - 5.50%
↓
6.25% - 6.75%
I
6.25% - 7.00% I 7.00% - 7.50%
↓
7.00% - 7.50%
↓
san Antonio 5.25% - 6.00%
↓
5.25% - 6.25% N/a 6.00% - 7.00%
↓
6.25% - 7.25%
↓
7.00% - 8.00%
↓
7.00% - 8.25%
↓
st. Louis 5.50% - 6.50%
I
5.75% - 6.50%
I
6.75% - 7.50%
↓
7.00% - 7.50%
↓
8.50% - 9.00%
↓
9.50% - 10.00%
↓
Decrease
Remain Flat
Increase
* Compared to 1st Half 2011
* Cap Rate Forecast represents the CBRe professional’s opinion of where cap rates are likely to trend in 1st half of 2012 in their local market.
In ThIs Issue:
Overview
Office
Multihousing
Retail
Industrial
hotel
Appendix
Cap Rate Survey February 2012
15
<< | >>In ThIs Issue:
Overview
Office
Multihousing
Retail
Industrial
hotel
Appendix
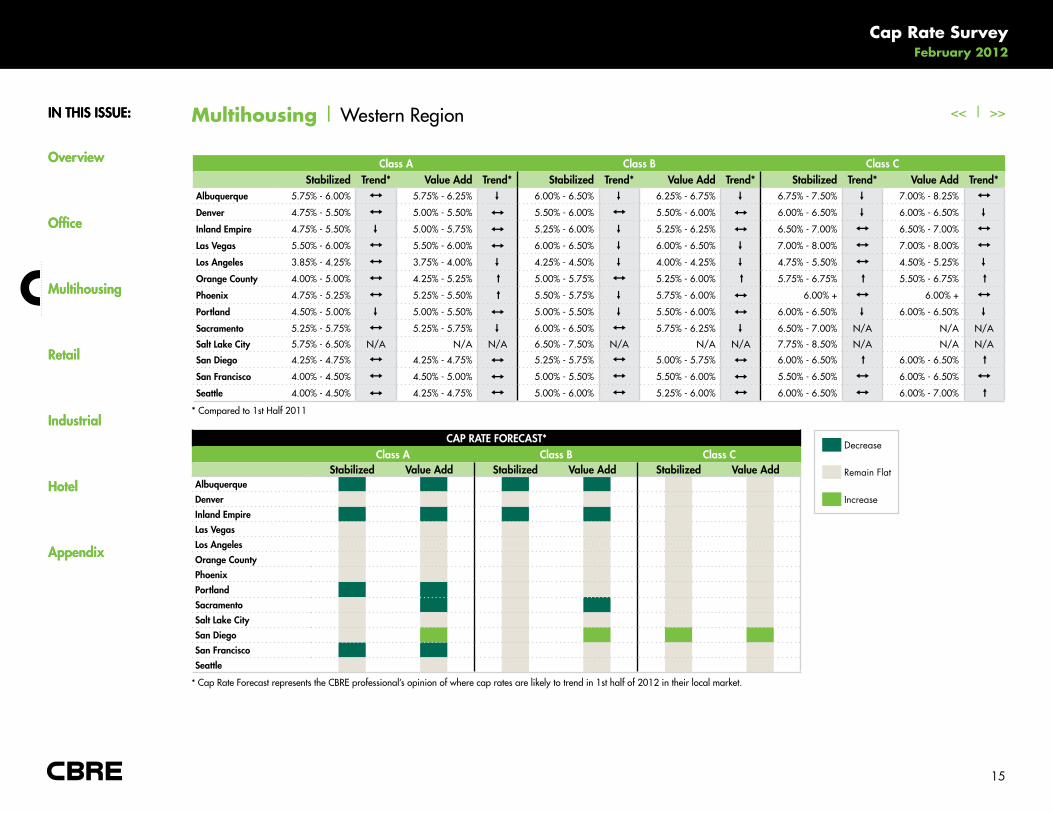
Multihousing | Western Region
CAP RATe FOReCAsT*Class A Class B Class C
stabilized Value Add stabilized Value Add stabilized Value AddAlbuquerqueDenverInland empireLas VegasLos AngelesOrange CountyPhoenixPortlandsacramentosalt Lake Citysan Diegosan Franciscoseattle
Class A Class B Class Cstabilized Trend* Value Add Trend* stabilized Trend* Value Add Trend* stabilized Trend* Value Add Trend*
Albuquerque 5.75% - 6.00%
I
5.75% - 6.25%
↓
6.00% - 6.50%
↓
6.25% - 6.75%
↓
6.75% - 7.50%
↓
7.00% - 8.25%
I
Denver 4.75% - 5.50%
I
5.00% - 5.50% I 5.50% - 6.00%
I
5.50% - 6.00% I 6.00% - 6.50%
↓
6.00% - 6.50%
↓
Inland empire 4.75% - 5.50%
↓
5.00% - 5.75% I 5.25% - 6.00%
↓
5.25% - 6.25% I 6.50% - 7.00%
I
6.50% - 7.00%
I
Las Vegas 5.50% - 6.00%
I
5.50% - 6.00% I 6.00% - 6.50%
↓
6.00% - 6.50%
↓
7.00% - 8.00%
I
7.00% - 8.00%
I
Los Angeles 3.85% - 4.25%
I
3.75% - 4.00%
↓
4.25% - 4.50%
↓
4.00% - 4.25%
↓
4.75% - 5.50%
I
4.50% - 5.25%
↓
Orange County 4.00% - 5.00%
I
4.25% - 5.25% ↓ 5.00% - 5.75%
I
5.25% - 6.00% ↓ 5.75% - 6.75% ↓ 5.50% - 6.75% ↓
Phoenix 4.75% - 5.25%
I
5.25% - 5.50% ↓ 5.50% - 5.75%
↓
5.75% - 6.00% I 6.00% +
I
6.00% +
I
Portland 4.50% - 5.00%
↓
5.00% - 5.50% I 5.00% - 5.50%
↓
5.50% - 6.00% I 6.00% - 6.50%
↓
6.00% - 6.50%
↓
sacramento 5.25% - 5.75%
I
5.25% - 5.75%
↓
6.00% - 6.50%
I
5.75% - 6.25%
↓
6.50% - 7.00% N/a N/a N/a
salt Lake City 5.75% - 6.50% N/a N/a N/a 6.50% - 7.50% N/a N/a N/a 7.75% - 8.50% N/a N/a N/a
san Diego 4.25% - 4.75%
I
4.25% - 4.75% I 5.25% - 5.75%
I
5.00% - 5.75% I 6.00% - 6.50% ↓ 6.00% - 6.50% ↓
san Francisco 4.00% - 4.50%
I
4.50% - 5.00% I 5.00% - 5.50%
I
5.50% - 6.00% I 5.50% - 6.50%
I
6.00% - 6.50%
I
seattle 4.00% - 4.50% I 4.25% - 4.75%
I
5.00% - 6.00%
I
5.25% - 6.00%
I
6.00% - 6.50%
I
6.00% - 7.00% ↓
Decrease
Remain Flat
Increase
* Compared to 1st Half 2011
* Cap Rate Forecast represents the CBRe professional’s opinion of where cap rates are likely to trend in 1st half of 2012 in their local market.
In ThIs Issue:
Overview
Office
Multihousing
Retail
Industrial
hotel
Appendix
Cap Rate Survey February 2012
16
<< | >>In ThIs Issue:
Overview
Office
Multihousing
Retail
Industrial
hotel
Appendix
Retail | Overview
The retail sector had been the laggard into the early stages of the recovery with investor interest in this sector comparatively muted into 2010
even as other sectors began to attract investor interest. With a bit of a rebound in retail sales and an end in the erosion to property-level
performance, the investment activity in the sector rebounded strongly in 2011. At $42.1 billion, total investment activity is up 89.1% from a
year earlier according to figures from RCA. This level is now 66% of the peak level of investment sales seen in 2007.
Across markets, the CBRE Cap Rate Survey shows a fairly consistent story with regards to the pricing of grocery anchored shopping centers
versus the Power Center format. Whether investors are active in the Class A, B or C segments of the market, Power Center cap rates are coming
in higher than their grocery-anchored equivalents; roughly 50 basis points across all classes. Regardless of asset class, investors see less risk
of ongoing shocks to grocery related retail and are willing to pay premiums for these assets.
Select from the list below to access the current neighborhood/community center (grocery anchored) retail cap rates and forecast.
Download a Complete Retail neighborhood/Community Center (Grocery Anchored) Current Cap Rates Chart (PDF)
Download a Complete Retail neighborhood/Community Center (Grocery Anchored) Cap Rate Forecast Chart (PDF)
Select from the list below to access the current power center retail cap rates and forecast.
Download a Complete Retail Power Center Current Cap Rates Chart (PDF)
Download a Complete Retail Power Center Cap Rate Forecast Chart (PDF)
In ThIs Issue:
Overview
Office
Multihousing
Retail
Industrial
hotel
Appendix
Cap Rate Survey February 2012
17
<< | >>In ThIs Issue:
Overview
Office
Multihousing
Retail
Industrial
hotel
Appendix
Retail Neighborhood/Community Center | eastern Region
CAP RATe FOReCAsT*
Class A Class B Class C
stabilized Value Add stabilized Value Add stabilized Value AddAtlantaBaltimore
BostonCharlotteJacksonvilleMemphisMiaminashvilleOrlandoPhiladelphiaPittsburghRaleighTampaWashington, DC
Class A Class B Class Cstabilized Value Add stabilized Value Add stabilized Value Add
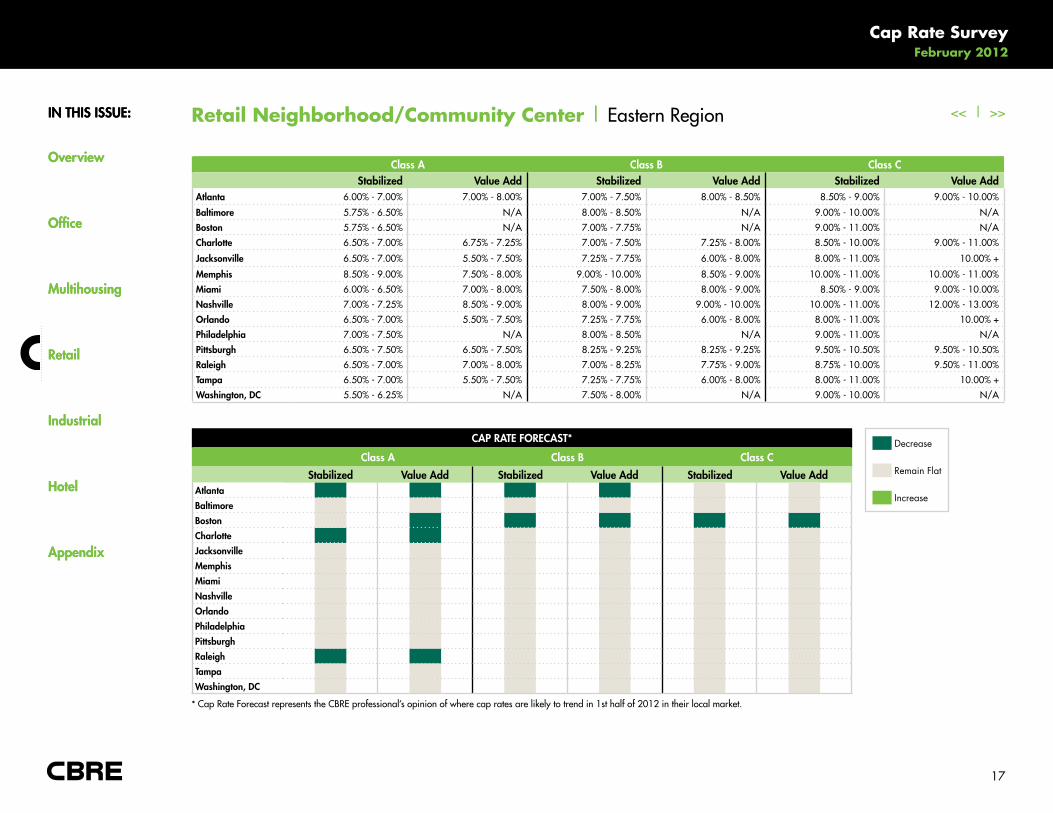
Atlanta 6.00% - 7.00% 7.00% - 8.00% 7.00% - 7.50% 8.00% - 8.50% 8.50% - 9.00% 9.00% - 10.00%
Baltimore 5.75% - 6.50% N/a 8.00% - 8.50% N/a 9.00% - 10.00% N/a
Boston 5.75% - 6.50% N/a 7.00% - 7.75% N/a 9.00% - 11.00% N/a
Charlotte 6.50% - 7.00% 6.75% - 7.25% 7.00% - 7.50% 7.25% - 8.00% 8.50% - 10.00% 9.00% - 11.00%
Jacksonville 6.50% - 7.00% 5.50% - 7.50% 7.25% - 7.75% 6.00% - 8.00% 8.00% - 11.00% 10.00% +
Memphis 8.50% - 9.00% 7.50% - 8.00% 9.00% - 10.00% 8.50% - 9.00% 10.00% - 11.00% 10.00% - 11.00%
Miami 6.00% - 6.50% 7.00% - 8.00% 7.50% - 8.00% 8.00% - 9.00% 8.50% - 9.00% 9.00% - 10.00%
nashville 7.00% - 7.25% 8.50% - 9.00% 8.00% - 9.00% 9.00% - 10.00% 10.00% - 11.00% 12.00% - 13.00%
Orlando 6.50% - 7.00% 5.50% - 7.50% 7.25% - 7.75% 6.00% - 8.00% 8.00% - 11.00% 10.00% +
Philadelphia 7.00% - 7.50% N/a 8.00% - 8.50% N/a 9.00% - 11.00% N/a
Pittsburgh 6.50% - 7.50% 6.50% - 7.50% 8.25% - 9.25% 8.25% - 9.25% 9.50% - 10.50% 9.50% - 10.50%
Raleigh 6.50% - 7.00% 7.00% - 8.00% 7.00% - 8.25% 7.75% - 9.00% 8.75% - 10.00% 9.50% - 11.00%
Tampa 6.50% - 7.00% 5.50% - 7.50% 7.25% - 7.75% 6.00% - 8.00% 8.00% - 11.00% 10.00% +
Washington, DC 5.50% - 6.25% N/a 7.50% - 8.00% N/a 9.00% - 10.00% N/a
Decrease
Remain Flat
Increase
* Cap Rate Forecast represents the CBRe professional’s opinion of where cap rates are likely to trend in 1st half of 2012 in their local market.
In ThIs Issue:
Overview
Office
Multihousing
Retail
Industrial
hotel
Appendix
Cap Rate Survey February 2012
18
<< | >>In ThIs Issue:
Overview
Office
Multihousing
Retail
Industrial
hotel
Appendix
Retail Neighborhood/Community Center | Central Region
Decrease
Remain Flat
Increase
CAP RATe FOReCAsT*
Class A Class B Class C
stabilized Value Add stabilized Value Add stabilized Value AddAustinChicago
CincinnatiClevelandColumbusDallasDetroithoustonIndianapolisKansas CityMinneapolissan Antoniost. Louis
Class A Class B Class Cstabilized Value Add stabilized Value Add stabilized Value Add
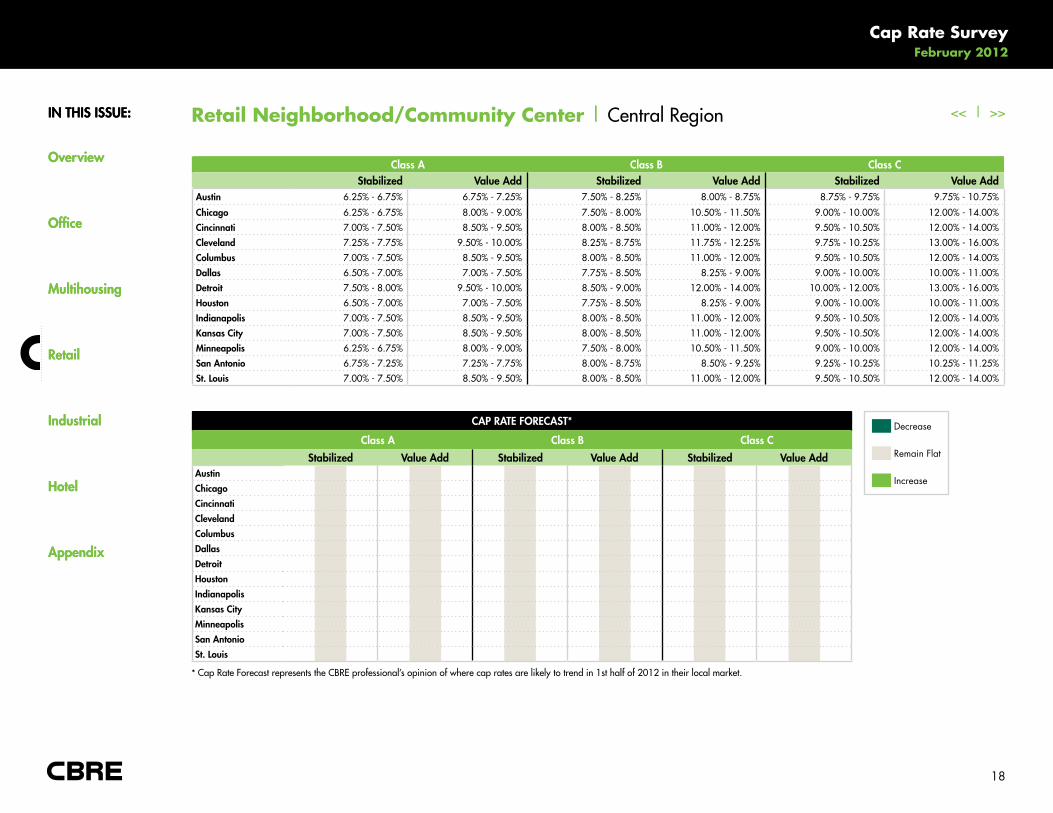
Austin 6.25% - 6.75% 6.75% - 7.25% 7.50% - 8.25% 8.00% - 8.75% 8.75% - 9.75% 9.75% - 10.75%
Chicago 6.25% - 6.75% 8.00% - 9.00% 7.50% - 8.00% 10.50% - 11.50% 9.00% - 10.00% 12.00% - 14.00%
Cincinnati 7.00% - 7.50% 8.50% - 9.50% 8.00% - 8.50% 11.00% - 12.00% 9.50% - 10.50% 12.00% - 14.00%
Cleveland 7.25% - 7.75% 9.50% - 10.00% 8.25% - 8.75% 11.75% - 12.25% 9.75% - 10.25% 13.00% - 16.00%
Columbus 7.00% - 7.50% 8.50% - 9.50% 8.00% - 8.50% 11.00% - 12.00% 9.50% - 10.50% 12.00% - 14.00%
Dallas 6.50% - 7.00% 7.00% - 7.50% 7.75% - 8.50% 8.25% - 9.00% 9.00% - 10.00% 10.00% - 11.00%
Detroit 7.50% - 8.00% 9.50% - 10.00% 8.50% - 9.00% 12.00% - 14.00% 10.00% - 12.00% 13.00% - 16.00%
houston 6.50% - 7.00% 7.00% - 7.50% 7.75% - 8.50% 8.25% - 9.00% 9.00% - 10.00% 10.00% - 11.00%
Indianapolis 7.00% - 7.50% 8.50% - 9.50% 8.00% - 8.50% 11.00% - 12.00% 9.50% - 10.50% 12.00% - 14.00%
Kansas City 7.00% - 7.50% 8.50% - 9.50% 8.00% - 8.50% 11.00% - 12.00% 9.50% - 10.50% 12.00% - 14.00%
Minneapolis 6.25% - 6.75% 8.00% - 9.00% 7.50% - 8.00% 10.50% - 11.50% 9.00% - 10.00% 12.00% - 14.00%
san Antonio 6.75% - 7.25% 7.25% - 7.75% 8.00% - 8.75% 8.50% - 9.25% 9.25% - 10.25% 10.25% - 11.25%
st. Louis 7.00% - 7.50% 8.50% - 9.50% 8.00% - 8.50% 11.00% - 12.00% 9.50% - 10.50% 12.00% - 14.00%
* Cap Rate Forecast represents the CBRe professional’s opinion of where cap rates are likely to trend in 1st half of 2012 in their local market.
In ThIs Issue:
Overview
Office
Multihousing
Retail
Industrial
hotel
Appendix
Cap Rate Survey February 2012
19
<< | >>In ThIs Issue:
Overview
Office
Multihousing
Retail
Industrial
hotel
Appendix
Retail Neighborhood/Community Center | Western Region
Decrease
Remain Flat
Increase
CAP RATe FOReCAsT*
Class A Class B Class C
stabilized Value Add stabilized Value Add stabilized Value AddAlbuquerqueDenverLas VegasLos AngelesOrange CountyPhoenixPortlandsacramentosalt Lake Citysan Diegosan Franciscoseattle
Class A Class B Class Cstabilized Value Add stabilized Value Add stabilized Value Add
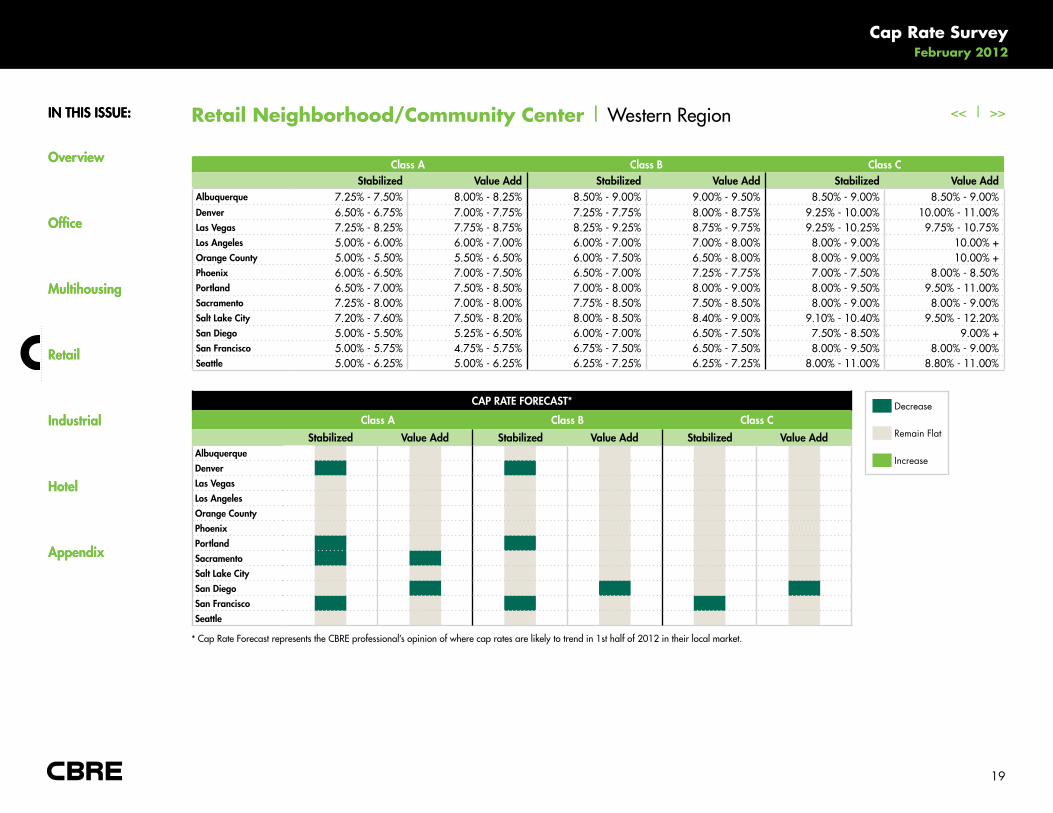
Albuquerque 7.25% - 7.50% 8.00% - 8.25% 8.50% - 9.00% 9.00% - 9.50% 8.50% - 9.00% 8.50% - 9.00%Denver 6.50% - 6.75% 7.00% - 7.75% 7.25% - 7.75% 8.00% - 8.75% 9.25% - 10.00% 10.00% - 11.00% Las Vegas 7.25% - 8.25% 7.75% - 8.75% 8.25% - 9.25% 8.75% - 9.75% 9.25% - 10.25% 9.75% - 10.75%Los Angeles 5.00% - 6.00% 6.00% - 7.00% 6.00% - 7.00% 7.00% - 8.00% 8.00% - 9.00% 10.00% +Orange County 5.00% - 5.50% 5.50% - 6.50% 6.00% - 7.50% 6.50% - 8.00% 8.00% - 9.00% 10.00% +Phoenix 6.00% - 6.50% 7.00% - 7.50% 6.50% - 7.00% 7.25% - 7.75% 7.00% - 7.50% 8.00% - 8.50%Portland 6.50% - 7.00% 7.50% - 8.50% 7.00% - 8.00% 8.00% - 9.00% 8.00% - 9.50% 9.50% - 11.00%sacramento 7.25% - 8.00% 7.00% - 8.00% 7.75% - 8.50% 7.50% - 8.50% 8.00% - 9.00% 8.00% - 9.00%salt Lake City 7.20% - 7.60% 7.50% - 8.20% 8.00% - 8.50% 8.40% - 9.00% 9.10% - 10.40% 9.50% - 12.20%san Diego 5.00% - 5.50% 5.25% - 6.50% 6.00% - 7.00% 6.50% - 7.50% 7.50% - 8.50% 9.00% +san Francisco 5.00% - 5.75% 4.75% - 5.75% 6.75% - 7.50% 6.50% - 7.50% 8.00% - 9.50% 8.00% - 9.00%seattle 5.00% - 6.25% 5.00% - 6.25% 6.25% - 7.25% 6.25% - 7.25% 8.00% - 11.00% 8.80% - 11.00%
* Cap Rate Forecast represents the CBRe professional’s opinion of where cap rates are likely to trend in 1st half of 2012 in their local market.
In ThIs Issue:
Overview
Office
Multihousing
Retail
Industrial
hotel
Appendix
Cap Rate Survey February 2012
20
<< | >>In ThIs Issue:
Overview
Office
Multihousing
Retail
Industrial
hotel
Appendix
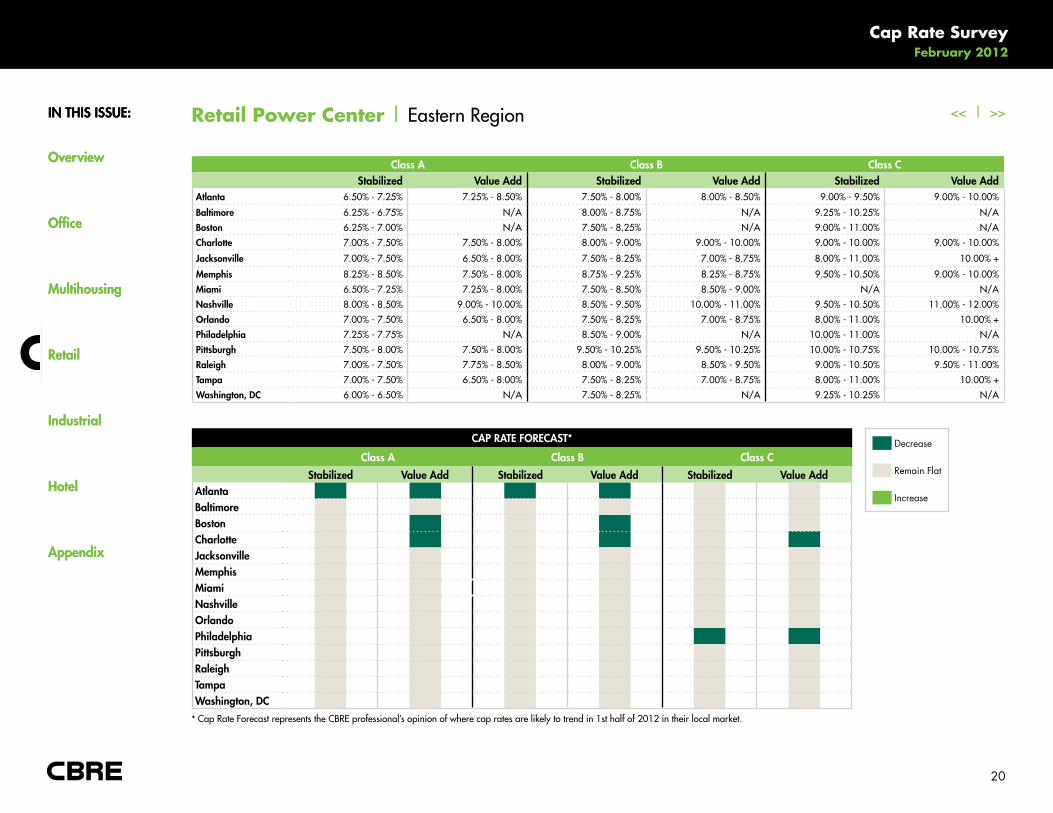
Retail Power Center | eastern Region
Decrease
Remain Flat
Increase
CAP RATe FOReCAsT*
Class A Class B Class C
stabilized Value Add stabilized Value Add stabilized Value AddAtlantaBaltimore BostonCharlotteJacksonvilleMemphisMiaminashvilleOrlandoPhiladelphiaPittsburghRaleighTampaWashington, DC
Class A Class B Class Cstabilized Value Add stabilized Value Add stabilized Value Add
Atlanta 6.50% - 7.25% 7.25% - 8.50% 7.50% - 8.00% 8.00% - 8.50% 9.00% - 9.50% 9.00% - 10.00%
Baltimore 6.25% - 6.75% N/a 8.00% - 8.75% N/a 9.25% - 10.25% N/a
Boston 6.25% - 7.00% N/a 7.50% - 8.25% N/a 9.00% - 11.00% N/a
Charlotte 7.00% - 7.50% 7.50% - 8.00% 8.00% - 9.00% 9.00% - 10.00% 9.00% - 10.00% 9.00% - 10.00%
Jacksonville 7.00% - 7.50% 6.50% - 8.00% 7.50% - 8.25% 7.00% - 8.75% 8.00% - 11.00% 10.00% +
Memphis 8.25% - 8.50% 7.50% - 8.00% 8.75% - 9.25% 8.25% - 8.75% 9.50% - 10.50% 9.00% - 10.00%
Miami 6.50% - 7.25% 7.25% - 8.00% 7.50% - 8.50% 8.50% - 9.00% N/a N/a
nashville 8.00% - 8.50% 9.00% - 10.00% 8.50% - 9.50% 10.00% - 11.00% 9.50% - 10.50% 11.00% - 12.00%
Orlando 7.00% - 7.50% 6.50% - 8.00% 7.50% - 8.25% 7.00% - 8.75% 8.00% - 11.00% 10.00% +
Philadelphia 7.25% - 7.75% N/a 8.50% - 9.00% N/a 10.00% - 11.00% N/a
Pittsburgh 7.50% - 8.00% 7.50% - 8.00% 9.50% - 10.25% 9.50% - 10.25% 10.00% - 10.75% 10.00% - 10.75%
Raleigh 7.00% - 7.50% 7.75% - 8.50% 8.00% - 9.00% 8.50% - 9.50% 9.00% - 10.50% 9.50% - 11.00%
Tampa 7.00% - 7.50% 6.50% - 8.00% 7.50% - 8.25% 7.00% - 8.75% 8.00% - 11.00% 10.00% +
Washington, DC 6.00% - 6.50% N/a 7.50% - 8.25% N/a 9.25% - 10.25% N/a
* Cap Rate Forecast represents the CBRe professional’s opinion of where cap rates are likely to trend in 1st half of 2012 in their local market.
In ThIs Issue:
Overview
Office
Multihousing
Retail
Industrial
hotel
Appendix
Cap Rate Survey February 2012
21
<< | >>In ThIs Issue:
Overview
Office
Multihousing
Retail
Industrial
hotel
Appendix
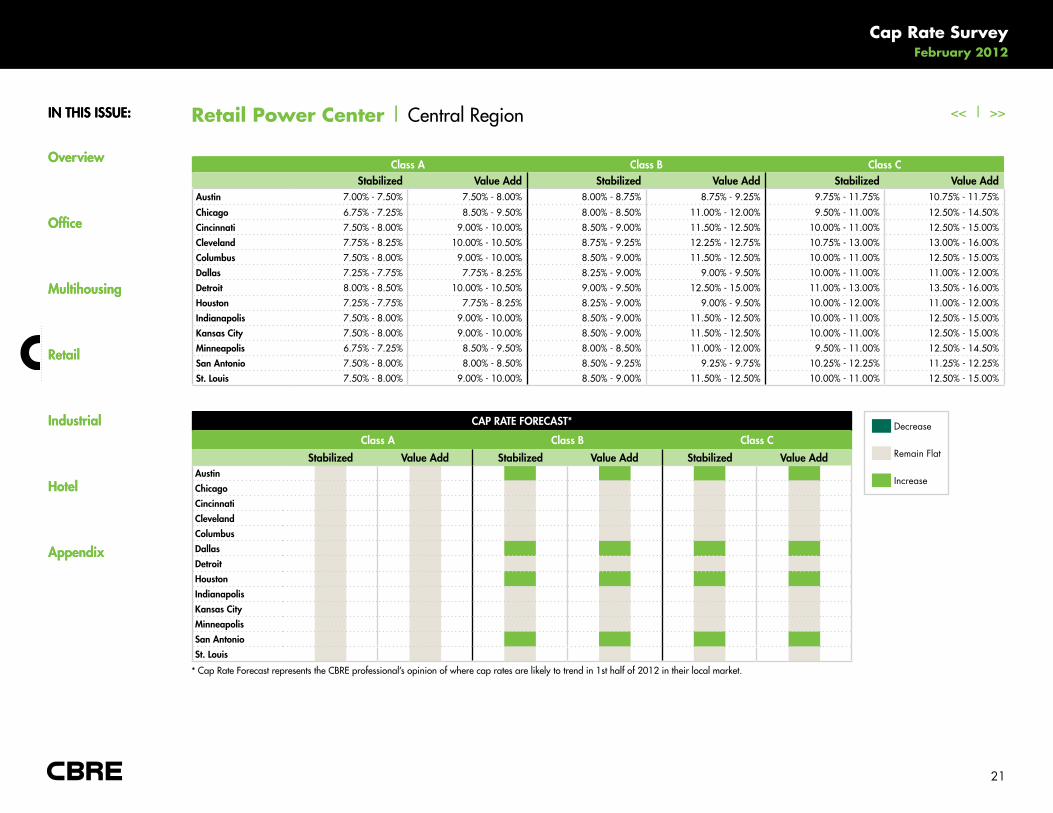
Retail Power Center | Central Region
Decrease
Remain Flat
Increase
CAP RATe FOReCAsT*
Class A Class B Class C
stabilized Value Add stabilized Value Add stabilized Value AddAustinChicagoCincinnatiClevelandColumbusDallasDetroithoustonIndianapolisKansas CityMinneapolissan Antoniost. Louis
Class A Class B Class Cstabilized Value Add stabilized Value Add stabilized Value Add
Austin 7.00% - 7.50% 7.50% - 8.00% 8.00% - 8.75% 8.75% - 9.25% 9.75% - 11.75% 10.75% - 11.75%
Chicago 6.75% - 7.25% 8.50% - 9.50% 8.00% - 8.50% 11.00% - 12.00% 9.50% - 11.00% 12.50% - 14.50%
Cincinnati 7.50% - 8.00% 9.00% - 10.00% 8.50% - 9.00% 11.50% - 12.50% 10.00% - 11.00% 12.50% - 15.00%
Cleveland 7.75% - 8.25% 10.00% - 10.50% 8.75% - 9.25% 12.25% - 12.75% 10.75% - 13.00% 13.00% - 16.00%
Columbus 7.50% - 8.00% 9.00% - 10.00% 8.50% - 9.00% 11.50% - 12.50% 10.00% - 11.00% 12.50% - 15.00%
Dallas 7.25% - 7.75% 7.75% - 8.25% 8.25% - 9.00% 9.00% - 9.50% 10.00% - 11.00% 11.00% - 12.00%
Detroit 8.00% - 8.50% 10.00% - 10.50% 9.00% - 9.50% 12.50% - 15.00% 11.00% - 13.00% 13.50% - 16.00%
houston 7.25% - 7.75% 7.75% - 8.25% 8.25% - 9.00% 9.00% - 9.50% 10.00% - 12.00% 11.00% - 12.00%
Indianapolis 7.50% - 8.00% 9.00% - 10.00% 8.50% - 9.00% 11.50% - 12.50% 10.00% - 11.00% 12.50% - 15.00%
Kansas City 7.50% - 8.00% 9.00% - 10.00% 8.50% - 9.00% 11.50% - 12.50% 10.00% - 11.00% 12.50% - 15.00%
Minneapolis 6.75% - 7.25% 8.50% - 9.50% 8.00% - 8.50% 11.00% - 12.00% 9.50% - 11.00% 12.50% - 14.50%
san Antonio 7.50% - 8.00% 8.00% - 8.50% 8.50% - 9.25% 9.25% - 9.75% 10.25% - 12.25% 11.25% - 12.25%
st. Louis 7.50% - 8.00% 9.00% - 10.00% 8.50% - 9.00% 11.50% - 12.50% 10.00% - 11.00% 12.50% - 15.00%
* Cap Rate Forecast represents the CBRe professional’s opinion of where cap rates are likely to trend in 1st half of 2012 in their local market.
In ThIs Issue:
Overview
Office
Multihousing
Retail
Industrial
hotel
Appendix
Cap Rate Survey February 2012
22
<< | >>In ThIs Issue:
Overview
Office
Multihousing
Retail
Industrial
hotel
Appendix
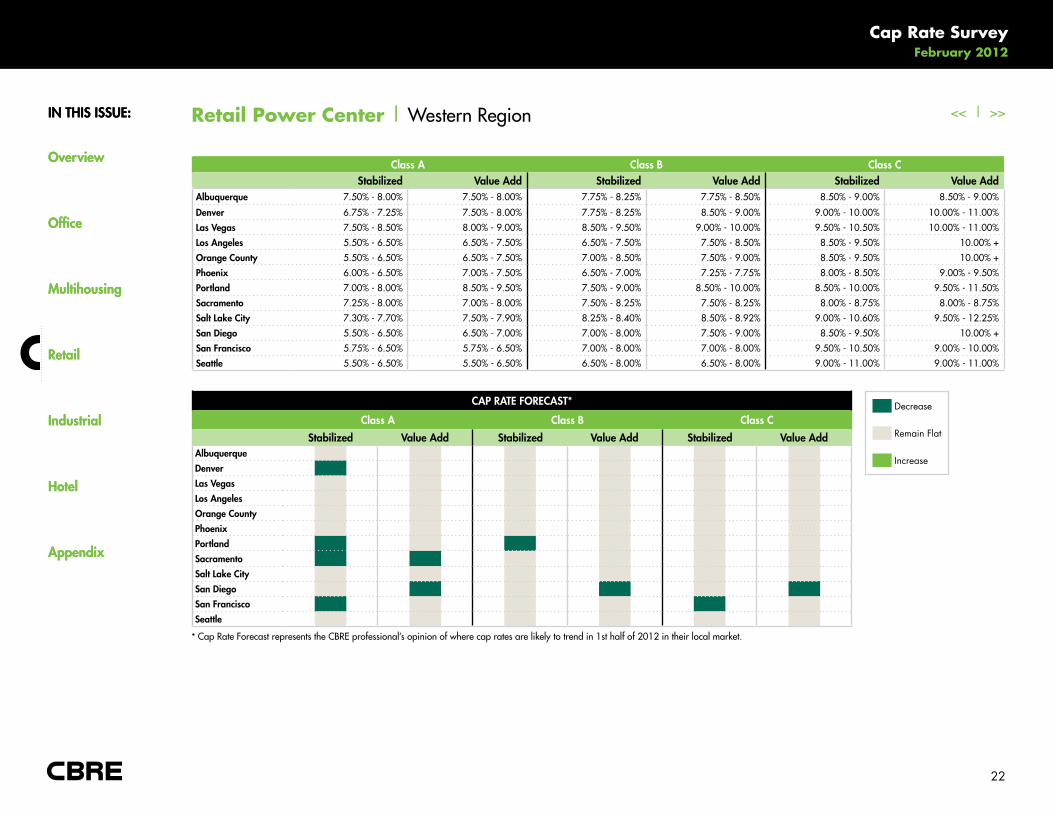
Retail Power Center | Western Region
Decrease
Remain Flat
Increase
CAP RATe FOReCAsT*
Class A Class B Class C
stabilized Value Add stabilized Value Add stabilized Value AddAlbuquerqueDenverLas VegasLos AngelesOrange CountyPhoenixPortlandsacramentosalt Lake Citysan Diegosan Franciscoseattle
Class A Class B Class Cstabilized Value Add stabilized Value Add stabilized Value Add
Albuquerque 7.50% - 8.00% 7.50% - 8.00% 7.75% - 8.25% 7.75% - 8.50% 8.50% - 9.00% 8.50% - 9.00%
Denver 6.75% - 7.25% 7.50% - 8.00% 7.75% - 8.25% 8.50% - 9.00% 9.00% - 10.00% 10.00% - 11.00%
Las Vegas 7.50% - 8.50% 8.00% - 9.00% 8.50% - 9.50% 9.00% - 10.00% 9.50% - 10.50% 10.00% - 11.00%
Los Angeles 5.50% - 6.50% 6.50% - 7.50% 6.50% - 7.50% 7.50% - 8.50% 8.50% - 9.50% 10.00% +
Orange County 5.50% - 6.50% 6.50% - 7.50% 7.00% - 8.50% 7.50% - 9.00% 8.50% - 9.50% 10.00% +
Phoenix 6.00% - 6.50% 7.00% - 7.50% 6.50% - 7.00% 7.25% - 7.75% 8.00% - 8.50% 9.00% - 9.50%
Portland 7.00% - 8.00% 8.50% - 9.50% 7.50% - 9.00% 8.50% - 10.00% 8.50% - 10.00% 9.50% - 11.50%
sacramento 7.25% - 8.00% 7.00% - 8.00% 7.50% - 8.25% 7.50% - 8.25% 8.00% - 8.75% 8.00% - 8.75%
salt Lake City 7.30% - 7.70% 7.50% - 7.90% 8.25% - 8.40% 8.50% - 8.92% 9.00% - 10.60% 9.50% - 12.25%
san Diego 5.50% - 6.50% 6.50% - 7.00% 7.00% - 8.00% 7.50% - 9.00% 8.50% - 9.50% 10.00% +
san Francisco 5.75% - 6.50% 5.75% - 6.50% 7.00% - 8.00% 7.00% - 8.00% 9.50% - 10.50% 9.00% - 10.00%
seattle 5.50% - 6.50% 5.50% - 6.50% 6.50% - 8.00% 6.50% - 8.00% 9.00% - 11.00% 9.00% - 11.00%
* Cap Rate Forecast represents the CBRe professional’s opinion of where cap rates are likely to trend in 1st half of 2012 in their local market.
In ThIs Issue:
Overview
Office
Multihousing
Retail
Industrial
hotel
Appendix
Cap Rate Survey February 2012
23
<< | >>In ThIs Issue:
Overview
Office
Multihousing
Retail
Industrial
hotel
Appendix
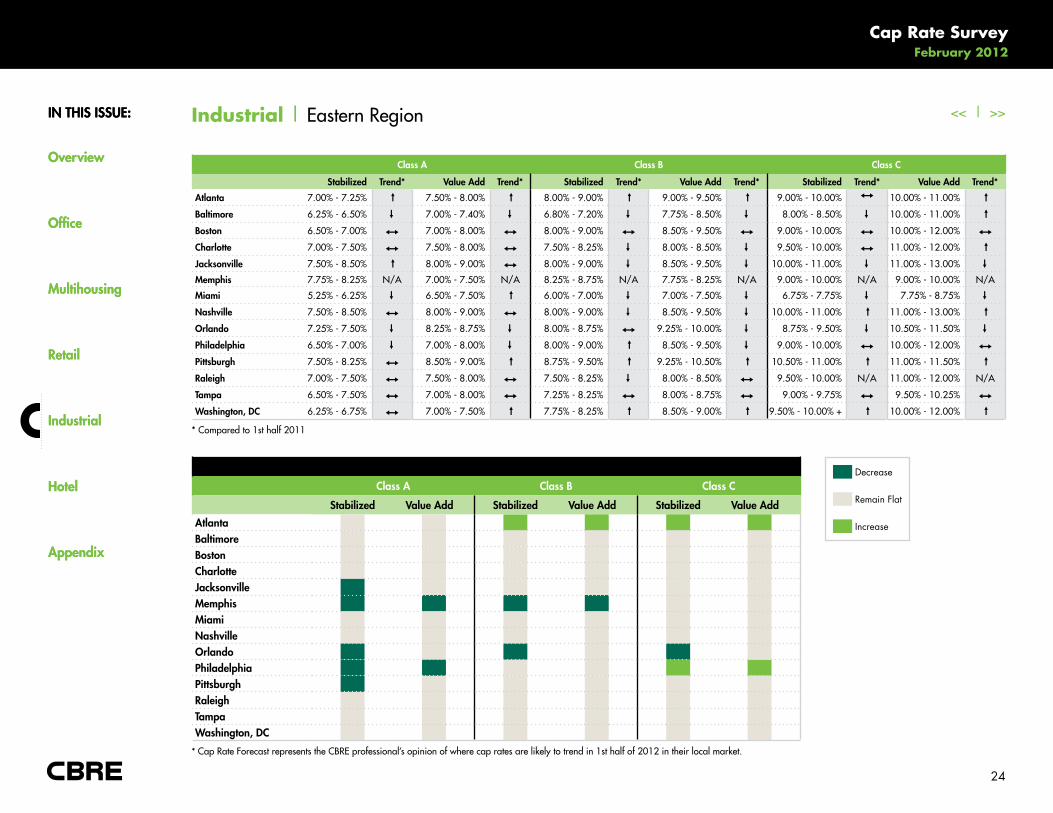
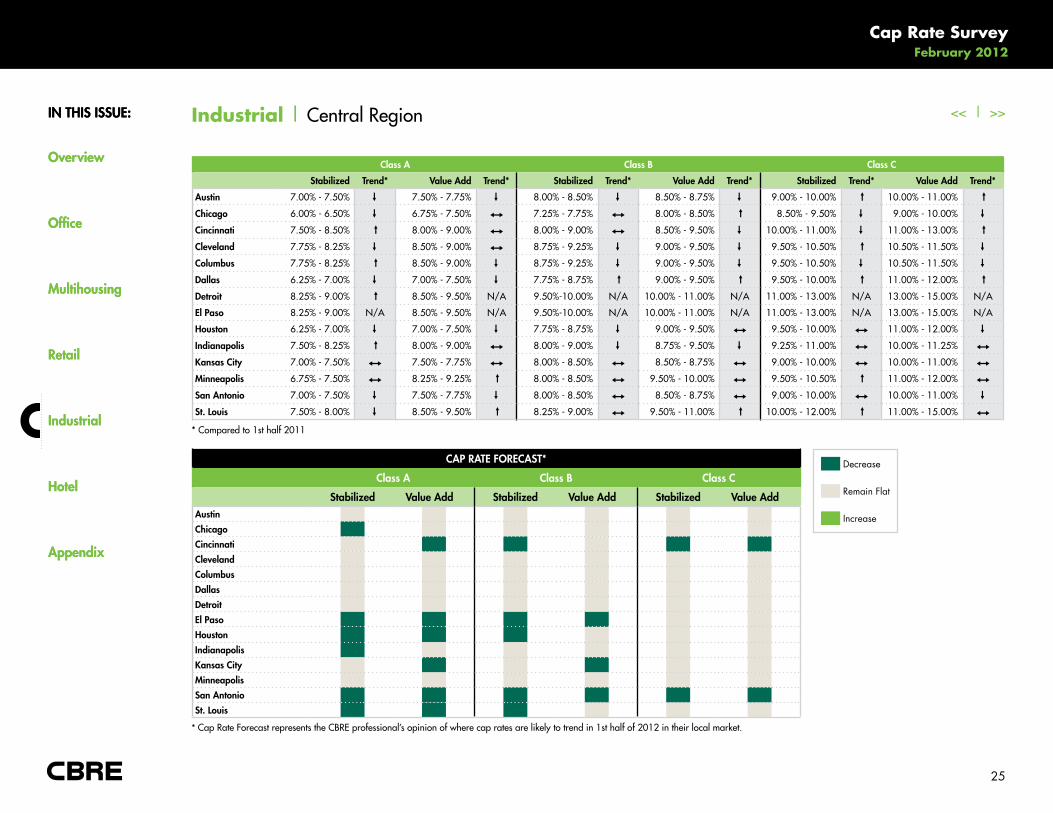
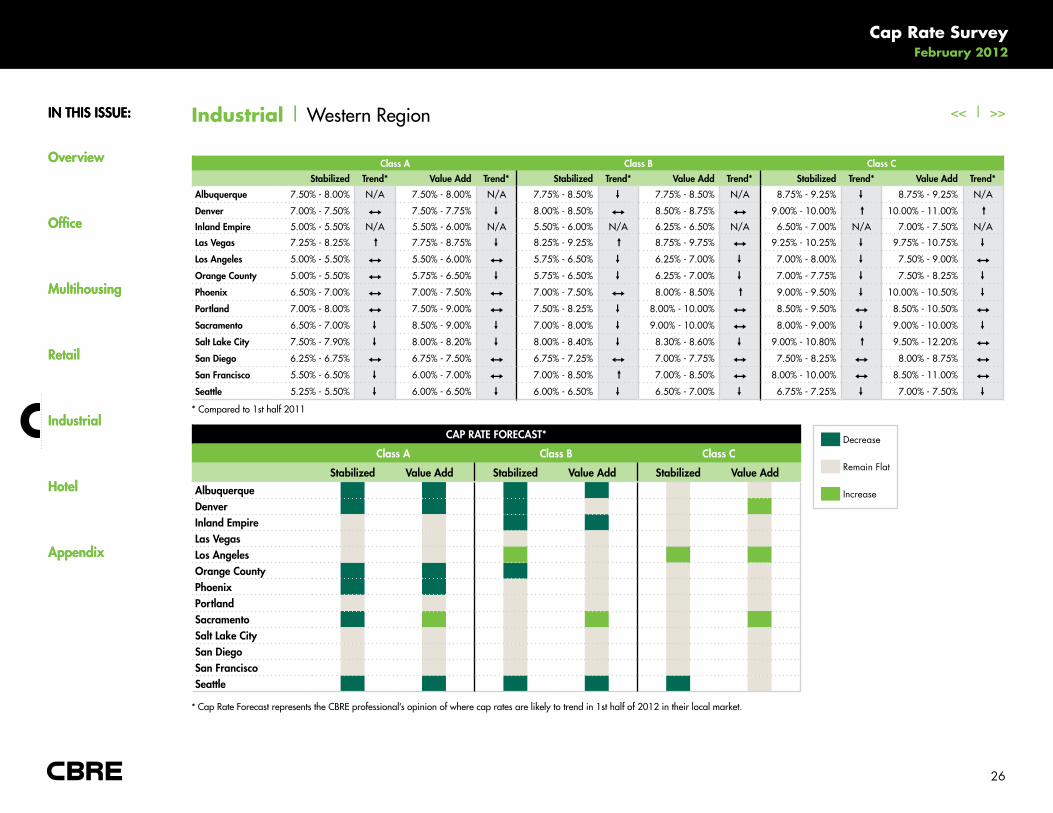
Industrial | Overview
Transaction activity in the industrial sector for 2011 was up 34.8% from a year earlier according to figures from RCA. With total investment
sales of $26.7 billion, the market is still at 46% of the peak level of investment activity seen in 2007. There is a clear investor interest for
particular types of industrial assets, the large modern distribution assets used in logistics operations. This preference helps explain why major
distribution hubs such as Los Angeles, the Inland Empire, and Chicago accounted for 31% of all investment sales in 2011.
This move towards investor demand for modern distribution assets can be seen in relative pricing across markets. There are a handful of markets
where these types of assets are clustered with markets like Dallas, Chicago, Los Angeles and the Inland Empire showing cap rates below 6.75%
for the highest quality assets in 2011 according to the CBRE Cap Rate Survey. By contrast, major manufacturing markets in the Midwest that
have faced economic restructuring saw cap rates for class A assets in the range from the mid 7% to the 8% level.
Select from the list below to access the current industrial cap rates and forecast.
Download a Complete Industrial Current Cap Rates Chart (PDF)
Download a Complete Industrial Cap Rate Forecast Chart (PDF)
In ThIs Issue:
Overview
Office
Multihousing
Retail
Industrial
hotel
Appendix
Cap Rate Survey February 2012
24
<< | >>In ThIs Issue:
Overview
Office
Multihousing
Retail
Industrial
hotel
Appendix
Industrial | eastern Region
Class A Class B Class C
stabilized Trend* Value Add Trend* stabilized Trend* Value Add Trend* stabilized Trend* Value Add Trend*
Atlanta 7.00% - 7.25% ↓ 7.50% - 8.00% ↓ 8.00% - 9.00% ↓ 9.00% - 9.50% ↓ 9.00% - 10.00%
I
10.00% - 11.00% ↓
Baltimore 6.25% - 6.50%
↓
7.00% - 7.40%
↓
6.80% - 7.20%
↓
7.75% - 8.50%
↓
8.00% - 8.50%
↓
10.00% - 11.00% ↓
Boston 6.50% - 7.00% I 7.00% - 8.00% I 8.00% - 9.00% I 8.50% - 9.50% I 9.00% - 10.00% I 10.00% - 12.00% I
Charlotte 7.00% - 7.50% I 7.50% - 8.00% I 7.50% - 8.25%
↓
8.00% - 8.50%
↓
9.50% - 10.00% I 11.00% - 12.00% ↓
Jacksonville 7.50% - 8.50% ↓ 8.00% - 9.00% I 8.00% - 9.00%
↓
8.50% - 9.50%
↓
10.00% - 11.00%
↓
11.00% - 13.00%
↓
Memphis 7.75% - 8.25% N/a 7.00% - 7.50% N/a 8.25% - 8.75% N/a 7.75% - 8.25% N/a 9.00% - 10.00% N/a 9.00% - 10.00% N/a
Miami 5.25% - 6.25%
↓
6.50% - 7.50% ↓ 6.00% - 7.00%
↓
7.00% - 7.50%
↓
6.75% - 7.75%
↓
7.75% - 8.75%
↓
nashville 7.50% - 8.50% I 8.00% - 9.00% I 8.00% - 9.00%
↓
8.50% - 9.50%
↓
10.00% - 11.00% ↓ 11.00% - 13.00% ↓
Orlando 7.25% - 7.50%
↓
8.25% - 8.75%
↓
8.00% - 8.75% I 9.25% - 10.00%
↓
8.75% - 9.50%
↓
10.50% - 11.50%
↓
Philadelphia 6.50% - 7.00%
↓
7.00% - 8.00%
↓
8.00% - 9.00% ↓ 8.50% - 9.50%
↓
9.00% - 10.00% I 10.00% - 12.00% I
Pittsburgh 7.50% - 8.25% I 8.50% - 9.00% ↓ 8.75% - 9.50% ↓ 9.25% - 10.50% ↓ 10.50% - 11.00% ↓ 11.00% - 11.50% ↓
Raleigh 7.00% - 7.50% I 7.50% - 8.00% I 7.50% - 8.25%
↓
8.00% - 8.50% I 9.50% - 10.00% N/a 11.00% - 12.00% N/a
Tampa 6.50% - 7.50% I 7.00% - 8.00% I 7.25% - 8.25% I 8.00% - 8.75% I 9.00% - 9.75% I 9.50% - 10.25% I
Washington, DC 6.25% - 6.75% I 7.00% - 7.50% ↓ 7.75% - 8.25% ↓ 8.50% - 9.00% ↓ 9.50% - 10.00% + ↓ 10.00% - 12.00% ↓
* Compared to 1st half 2011
Decrease
Remain Flat
Increase
Class A Class B Class C
stabilized Value Add stabilized Value Add stabilized Value Add
AtlantaBaltimoreBostonCharlotteJacksonvilleMemphisMiaminashvilleOrlandoPhiladelphiaPittsburghRaleighTampaWashington, DC
* Cap Rate Forecast represents the CBRe professional’s opinion of where cap rates are likely to trend in 1st half of 2012 in their local market.
In ThIs Issue:
Overview
Office
Multihousing
Retail
Industrial
hotel
Appendix
Cap Rate Survey February 2012
25
<< | >>In ThIs Issue:
Overview
Office
Multihousing
Retail
Industrial
hotel
Appendix
Industrial | Central Region
Class A Class B Class C
stabilized Trend* Value Add Trend* stabilized Trend* Value Add Trend* stabilized Trend* Value Add Trend*
Austin 7.00% - 7.50%
↓
7.50% - 7.75%
↓
8.00% - 8.50%
↓
8.50% - 8.75%
↓
9.00% - 10.00% ↓ 10.00% - 11.00% ↓
Chicago 6.00% - 6.50%
↓
6.75% - 7.50% I 7.25% - 7.75% I 8.00% - 8.50% ↓ 8.50% - 9.50%
↓
9.00% - 10.00%
↓
Cincinnati 7.50% - 8.50% ↓ 8.00% - 9.00% I 8.00% - 9.00% I 8.50% - 9.50%
↓
10.00% - 11.00%
↓
11.00% - 13.00% ↓
Cleveland 7.75% - 8.25%
↓
8.50% - 9.00% I 8.75% - 9.25%
↓
9.00% - 9.50%
↓
9.50% - 10.50% ↓ 10.50% - 11.50%
↓
Columbus 7.75% - 8.25% ↓ 8.50% - 9.00%
↓
8.75% - 9.25%
↓
9.00% - 9.50%
↓
9.50% - 10.50%
↓
10.50% - 11.50%
↓
Dallas 6.25% - 7.00%
↓
7.00% - 7.50%
↓
7.75% - 8.75% ↓ 9.00% - 9.50% ↓ 9.50% - 10.00% ↓ 11.00% - 12.00% ↓
Detroit 8.25% - 9.00% ↓ 8.50% - 9.50% N/a 9.50%-10.00% N/a 10.00% - 11.00% N/a 11.00% - 13.00% N/a 13.00% - 15.00% N/a
el Paso 8.25% - 9.00% N/a 8.50% - 9.50% N/a 9.50%-10.00% N/a 10.00% - 11.00% N/a 11.00% - 13.00% N/a 13.00% - 15.00% N/a
houston 6.25% - 7.00%
↓
7.00% - 7.50%
↓
7.75% - 8.75%
↓
9.00% - 9.50% I 9.50% - 10.00% I 11.00% - 12.00%
↓
Indianapolis 7.50% - 8.25% ↓ 8.00% - 9.00% I 8.00% - 9.00%
↓
8.75% - 9.50%
↓
9.25% - 11.00% I 10.00% - 11.25% I
Kansas City 7.00% - 7.50% I 7.50% - 7.75% I 8.00% - 8.50% I 8.50% - 8.75% I 9.00% - 10.00% I 10.00% - 11.00% I
Minneapolis 6.75% - 7.50% I 8.25% - 9.25% ↓ 8.00% - 8.50% I 9.50% - 10.00% I 9.50% - 10.50% ↓ 11.00% - 12.00% I
san Antonio 7.00% - 7.50%
↓
7.50% - 7.75%
↓
8.00% - 8.50% I 8.50% - 8.75% I 9.00% - 10.00% I 10.00% - 11.00%
↓st. Louis 7.50% - 8.00%
↓
8.50% - 9.50% ↓ 8.25% - 9.00% I 9.50% - 11.00% ↓ 10.00% - 12.00% ↓ 11.00% - 15.00% I
Decrease
Remain Flat
Increase
CAP RATe FOReCAsT*
Class A Class B Class C
stabilized Value Add stabilized Value Add stabilized Value AddAustinChicagoCincinnatiClevelandColumbusDallasDetroitel PasohoustonIndianapolisKansas City
Minneapolis
san Antonio
st. Louis
* Cap Rate Forecast represents the CBRe professional’s opinion of where cap rates are likely to trend in 1st half of 2012 in their local market.
* Compared to 1st half 2011
In ThIs Issue:
Overview
Office
Multihousing
Retail
Industrial
hotel
Appendix
Cap Rate Survey February 2012
26
<< | >>In ThIs Issue:
Overview
Office
Multihousing
Retail
Industrial
hotel
Appendix
Industrial | Western Region
CAP RATe FOReCAsT*
Class A Class B Class C
stabilized Value Add stabilized Value Add stabilized Value Add
Albuquerque DenverInland empireLas VegasLos AngelesOrange CountyPhoenixPortlandsacramento salt Lake City san Diego san Francisco seattle
Class A Class B Class Cstabilized Trend* Value Add Trend* stabilized Trend* Value Add Trend* stabilized Trend* Value Add Trend*
Albuquerque 7.50% - 8.00% N/a 7.50% - 8.00% N/a 7.75% - 8.50%
↓
7.75% - 8.50% N/a 8.75% - 9.25%
↓
8.75% - 9.25% N/a
Denver 7.00% - 7.50% I 7.50% - 7.75%
↓
8.00% - 8.50% I 8.50% - 8.75% I 9.00% - 10.00% ↓ 10.00% - 11.00% ↓
Inland empire 5.00% - 5.50% N/a 5.50% - 6.00% N/a 5.50% - 6.00% N/a 6.25% - 6.50% N/a 6.50% - 7.00% N/a 7.00% - 7.50% N/a
Las Vegas 7.25% - 8.25% ↓ 7.75% - 8.75%
↓
8.25% - 9.25% ↓ 8.75% - 9.75% I 9.25% - 10.25%
↓
9.75% - 10.75%
↓
Los Angeles 5.00% - 5.50% I 5.50% - 6.00% I 5.75% - 6.50%
↓
6.25% - 7.00%
↓
7.00% - 8.00%
↓
7.50% - 9.00% I
Orange County 5.00% - 5.50% I 5.75% - 6.50%
↓
5.75% - 6.50%
↓
6.25% - 7.00%
↓
7.00% - 7.75%
↓
7.50% - 8.25%
↓
Phoenix 6.50% - 7.00% I 7.00% - 7.50% I 7.00% - 7.50% I 8.00% - 8.50% ↓ 9.00% - 9.50%
↓
10.00% - 10.50%
↓
Portland 7.00% - 8.00% I 7.50% - 9.00% I 7.50% - 8.25%
↓
8.00% - 10.00% I 8.50% - 9.50% I 8.50% - 10.50% I
sacramento 6.50% - 7.00%
↓
8.50% - 9.00%
↓
7.00% - 8.00%
↓
9.00% - 10.00% I 8.00% - 9.00%
↓
9.00% - 10.00%
↓
salt Lake City 7.50% - 7.90%
↓
8.00% - 8.20%
↓
8.00% - 8.40%
↓
8.30% - 8.60%
↓
9.00% - 10.80% ↓ 9.50% - 12.20% I
san Diego 6.25% - 6.75% I 6.75% - 7.50% I 6.75% - 7.25% I 7.00% - 7.75% I 7.50% - 8.25% I 8.00% - 8.75% I
san Francisco 5.50% - 6.50%
↓
6.00% - 7.00% I 7.00% - 8.50% ↓ 7.00% - 8.50% I 8.00% - 10.00% I 8.50% - 11.00% I
seattle 5.25% - 5.50%
↓
6.00% - 6.50%
↓
6.00% - 6.50%
↓
6.50% - 7.00%
↓
6.75% - 7.25%
↓
7.00% - 7.50%
↓
Decrease
Remain Flat
Increase
* Cap Rate Forecast represents the CBRe professional’s opinion of where cap rates are likely to trend in 1st half of 2012 in their local market.
* Compared to 1st half 2011
In ThIs Issue:
Overview
Office
Multihousing
Retail
Industrial
hotel
Appendix
Cap Rate Survey February 2012
27
<< | >>In ThIs Issue:
Overview
Office
Multihousing
Retail
Industrial
hotel
Appendix
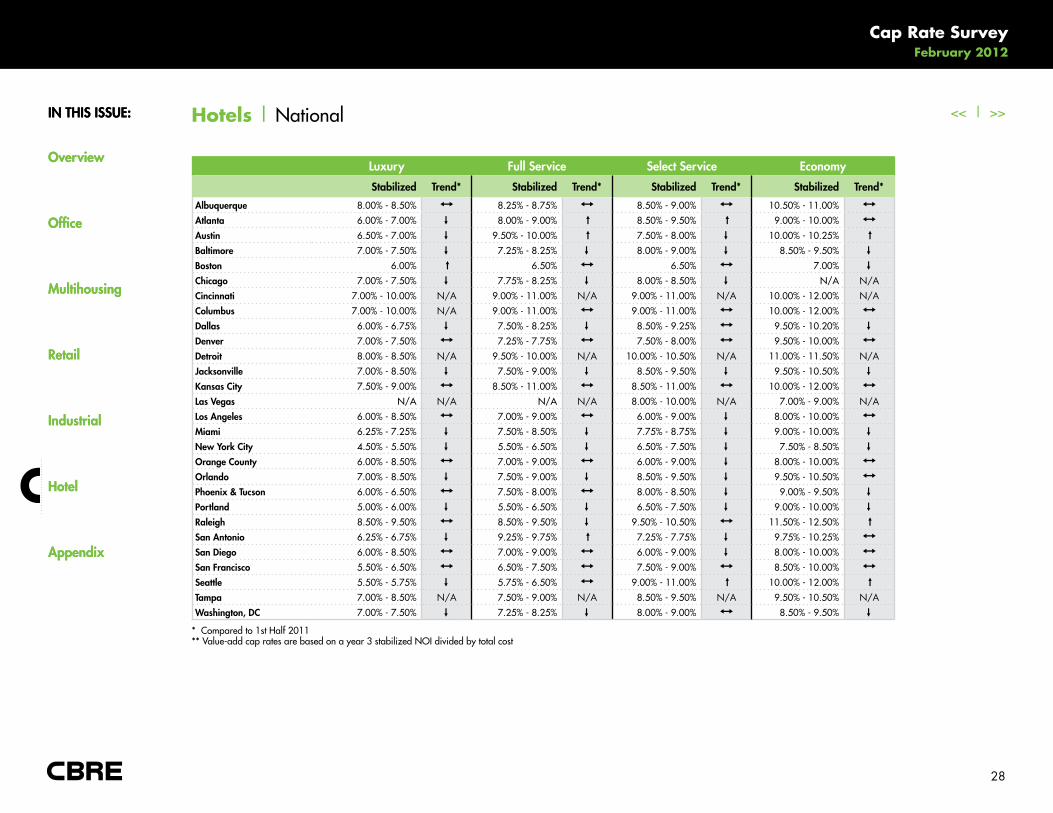
Hotels | Overview
The CBRE Cap Rate Survey provides information on the Hotel sector that is not really available elsewhere. With total transaction activity in
the sector representing roughly 7% of annual activity across all commercial property sectors, there simply often are not enough transactions to
develop reliable benchmarks of sales comparables.
Still, transaction activity grew quickly in 2011, nearly doubling from 2010. Investment sales came in at $19.3 billion in 2011 versus $9.8
billion in 2010 with investors excited by the ongoing income prospects as RevPar climbed. On a monthly basis, the pace of investment sales in
the hotel sector slowed early in the 4th quarter with November of 2011 actually lower than the pace set in 2010 as investors were still skittish
relative to the economic shocks seen late in the 3rd quarter with the U.S. credit downgrade. By December however sales were again higher
than the pace set in 2010 as investor skittishness faded.
The markets where investors are likely to face the lowest going-in cap rates today are those major centers of business activity which are also
attractive to investors in the office sector. Stabilized hotel cap rates are lowest in markets like New York, Boston, San Francisco and Seattle with
cap rate levels lower than 6% for the luxury segment.
Select from the list below to access the current hotels cap rates and forecast.
Download a Complete hotels Current Cap Rates Chart (PDF)
Download a Complete hotels Cap Rate Forecast Chart (PDF)
In ThIs Issue:
Overview
Office
Multihousing
Retail
Industrial
hotel
Appendix
Cap Rate Survey February 2012
28
<< | >>In ThIs Issue:
Overview
Office
Multihousing
Retail
Industrial
hotel
Appendix
Hotels | National
Luxury Full service select service economy
stabilized Trend* stabilized Trend* stabilized Trend* stabilized Trend*
Albuquerque 8.00% - 8.50% I 8.25% - 8.75% I 8.50% - 9.00% I 10.50% - 11.00% I
Atlanta 6.00% - 7.00%
↓
8.00% - 9.00% ↓ 8.50% - 9.50% ↓ 9.00% - 10.00% I
Austin 6.50% - 7.00%
↓
9.50% - 10.00% ↓ 7.50% - 8.00%
↓
10.00% - 10.25% ↓
Baltimore 7.00% - 7.50%
↓
7.25% - 8.25%
↓
8.00% - 9.00%
↓
8.50% - 9.50%
↓
Boston 6.00% ↓ 6.50% I 6.50% I 7.00%
↓
Chicago 7.00% - 7.50%
↓
7.75% - 8.25%
↓
8.00% - 8.50%
↓
N/a N/ACincinnati 7.00% - 10.00% N/A 9.00% - 11.00% N/A 9.00% - 11.00% N/A 10.00% - 12.00% N/AColumbus 7.00% - 10.00% N/A 9.00% - 11.00% I 9.00% - 11.00% I 10.00% - 12.00% I
Dallas 6.00% - 6.75%
↓
7.50% - 8.25%
↓
8.50% - 9.25% I 9.50% - 10.20%
↓
Denver 7.00% - 7.50% I 7.25% - 7.75% I 7.50% - 8.00% I 9.50% - 10.00% I
Detroit 8.00% - 8.50% N/A 9.50% - 10.00% N/A 10.00% - 10.50% N/A 11.00% - 11.50% N/AJacksonville 7.00% - 8.50%
↓
7.50% - 9.00%
↓
8.50% - 9.50%
↓
9.50% - 10.50%
↓
Kansas City 7.50% - 9.00% I 8.50% - 11.00% I 8.50% - 11.00% I 10.00% - 12.00% I
Las Vegas N/a N/A N/a N/A 8.00% - 10.00% N/A 7.00% - 9.00% N/ALos Angeles 6.00% - 8.50% I 7.00% - 9.00% I 6.00% - 9.00%
↓
8.00% - 10.00% I
Miami 6.25% - 7.25%
↓
7.50% - 8.50%
↓
7.75% - 8.75%
↓
9.00% - 10.00%
↓
new York City 4.50% - 5.50%
↓
5.50% - 6.50%
↓
6.50% - 7.50%
↓
7.50% - 8.50%
↓
Orange County 6.00% - 8.50% I 7.00% - 9.00% I 6.00% - 9.00%
↓
8.00% - 10.00% I
Orlando 7.00% - 8.50%
↓
7.50% - 9.00%
↓
8.50% - 9.50%
↓
9.50% - 10.50% I
Phoenix & Tucson 6.00% - 6.50% I 7.50% - 8.00% I 8.00% - 8.50%
↓
9.00% - 9.50%
↓
Portland 5.00% - 6.00%
↓
5.50% - 6.50%
↓
6.50% - 7.50%
↓
9.00% - 10.00%
↓
Raleigh 8.50% - 9.50% I 8.50% - 9.50%
↓
9.50% - 10.50% I 11.50% - 12.50% ↓
san Antonio 6.25% - 6.75%
↓
9.25% - 9.75% ↓ 7.25% - 7.75%
↓
9.75% - 10.25% I
san Diego 6.00% - 8.50% I 7.00% - 9.00% I 6.00% - 9.00%
↓
8.00% - 10.00% I
san Francisco 5.50% - 6.50% I 6.50% - 7.50% I 7.50% - 9.00% I 8.50% - 10.00% I
seattle 5.50% - 5.75%
↓
5.75% - 6.50% I 9.00% - 11.00% ↓ 10.00% - 12.00% ↓
Tampa 7.00% - 8.50% N/A 7.50% - 9.00% N/A 8.50% - 9.50% N/A 9.50% - 10.50% N/AWashington, DC 7.00% - 7.50%
↓
7.25% - 8.25%
↓
8.00% - 9.00% I 8.50% - 9.50%
↓
* Compared to 1st Half 2011** value-add cap rates are based on a year 3 stabilized NOI divided by total cost
In ThIs Issue:
Overview
Office
Multihousing
Retail
Industrial
hotel
Appendix
Cap Rate Survey February 2012
29
<< | >>In ThIs Issue:
Overview
Office
Multihousing
Retail
Industrial
hotel
Appendix
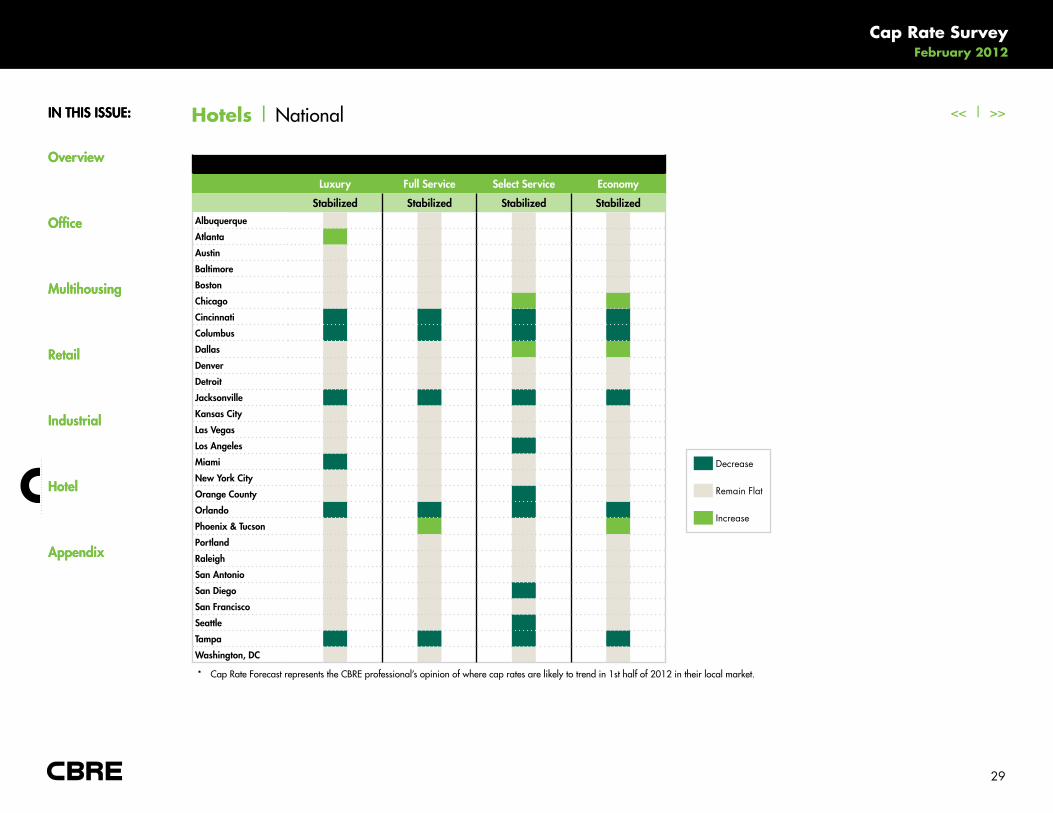
Hotels | National
Decrease
Remain Flat
Increase
Luxury Full service select service economy
stabilized stabilized stabilized stabilizedAlbuquerque
Atlanta
Austin
Baltimore
Boston
Chicago
Cincinnati
Columbus
Dallas
Denver
Detroit
Jacksonville
Kansas City
Las Vegas
Los Angeles
Miami
new York City
Orange County
Orlando
Phoenix & Tucson
Portland
Raleigh
san Antonio
san Diego
san Francisco
seattle
Tampa
Washington, DC
* Cap Rate Forecast represents the CBRe professional’s opinion of where cap rates are likely to trend in 1st half of 2012 in their local market.
In ThIs Issue:
Overview
Office
Multihousing
Retail
Industrial
hotel
Appendix
Cap Rate Survey February 2012
30
<< | >>In ThIs Issue:
Overview
Office
Multihousing
Retail
Industrial
hotel
Appendix
Cap Rates (Office, Industrial, Retail, and hotel)
Cap rate ranges were best estimates provided by CBRe professionals based on recent trades in their local market as well as recent interaction
with investors. the ranges represent those cap rates that a given property will trade at in this current market. Stabilized cap rates were based
on in-place NOI for the latest year before adjusted for reserves. value-add cap rates were based on projected stabilized NOI. actual cap rates
within each asset class will vary, occasionally outside of the stated ranges, based on asset/location quality and property-specific opportunities for
NOI enhancement.
Cap Rates (Multihousing only)
Cap rate ranges are based on an estimated NOI derived by annualizing the last 90-days of revenue and subtracting what buyers would estimate
as stabilized, year one expenses after adjustments for real estate taxes and reserves. actual cap rates within each asset class will vary, occasionally
outside of the stated ranges, based on asset/location quality and property-specific opportunities for NOI enhancement.
CBD
the Central Business District of a major city
Class A
Best-of-class product, attract larger, top quality tenants with 5- and 10-year leases, often newer construction
Class B
Older product, mostly 5-year leases, typically previously owned
Class C
typically an older building that offers space without amenities. attracts moderate to low income tenants.
Appendix | Definitions
In ThIs Issue:
Overview
Office
Multihousing
Retail
Industrial
hotel
Appendix
Cap Rate Survey February 2012
31
<< | >>In ThIs Issue:
Overview
Office
Multihousing
Retail
Industrial
hotel
Appendix
economy
Hotel chains that are priced within the 20.0-40.0% percentile in terms of average annual room rates according to Smith travel Research
Full service
a hotel property with more than 150 rooms, room service, an on-site restaurant and a concierge service.
Luxury
Hotel chains that are priced in the top 15.0% percentile in terms of average annual room rates according to Smith travel Research
neighborhood/Commercial Center (Grocery Anchored)
enclosed retail center that is anchored by a supermarket or other type of grocery store. Can range from 150K SF-350K SF
Power Center
Open-air retail center comprised of larger, brand name tenants. Limited CRu space and typically 400K+ SF or in a node of that size
select service
a hotel property with less than 150 rooms, no room service and no on-site restaurant or concierge service.
stabilized Property
a property that has an occupancy level at or above the local average under typical market conditions
suburban
Mainly residential area located within close proximity to a major city
Value-Add Property
an underperforming property that has an occupancy level below the local average under typical market conditions
Appendix | Definitions (continued)
© Copyright 2012 CBRE Information contained herein, including projections, has been obtained from sources believed to be reliable. While we do not doubt its accuracy, we have not verified it and make no guarantee, warranty or representation about it. It is your responsibility to confirm independently its accuracy and completeness. This information is presented exclusively for use by CBRE clients and professionals and all rights to the material are reserved and cannot be reproduced without prior written permission of the CBRE Global Chief Economist.
888.707.3908
www.cbre.com/capitalmarketswww.cbre.com/researchwww.cbre.com/valuation
CHRIS LUDEMANPresident
CBRE Capital Markets
JIM COSTELLOVice President, Investment Strategy Services
CBRE Econometric Advisors
BRIAN STOFFERSPresident
CBRE Capital Markets
RAY WONGExecutive Director, Americas
CBRE Research
ASIEH MANSOURHead of Research, Americas
CBRE Research
THOMAS MCDONNELLPresident
CBRE Valulation and Advisory Services
Recommended