CBCL in the assessment of psychopathology inFinnish children with intellectual disability
Terhi Koskentaustaa,*, Matti Iivanainenb,c, Fredrik Almqvistd
aDepartment of Psychiatry, Central Hospital of Paijat-Hame,
Keskussairaalankatu 7, 15850 Lahti, FinlandbDepartment of Child Neurology, Hospital for Children and Adolescents,
University of Helsinki, FinlandcRinnekoti Research Center, Espoo, Finland
dDepartment of Child Psychiatry, Hospital for Children and Adolescents,
University of Helsinki, Finland
Received 12 June 2003; received in revised form 7 November 2003; accepted 16 December 2003
Abstract
Structured checklists have been used to supplement psychiatric assessment of children
with normal intelligence, but for children with intellectual disability, only a few checklists
exist. We evaluated the Child Behavior Checklist (CBCL) in the assessment of psycho-
pathology in Finnish children with intellectual disability. The CBCL was completed by
parents or other carers of 90 children aged 6–13 years. Of the 118 CBCL problem items, the
lowest scores were for ‘Suicidal talks’ and ‘Alcohol, drugs’, and the highest score for ‘Acts
too young’. Total Problem, Internalizing, and Externalizing scores were highest among
children with moderate intellectual disability and lowest among those with profound
intellectual disability. Externalizing scores were significantly higher among children with
mild or moderate intellectual disability than among those with severe or profound
intellectual disability. Compared with the original normative samples, Total Problem scores
were higher in the present study. With a T-score cut-off point of 60, the rated frequency
of psychiatric disorders was 43%. We conclude that, despite certain limitations, the CBCL
can be used in the assessment of psychopathology among children with mild intellectual
disability but is less reliable for thosewithmoderate, severe,orprofound intellectualdisability.
# 2004 Elsevier Ltd. All rights reserved.
Keywords: Finnish children; psychopathology; intellectual disability; assessment; Child Behavior
Checklist
Research in Developmental Disabilities
25 (2004) 341–354
0891-4222/$ – see front matter # 2004 Elsevier Ltd. All rights reserved.
doi:10.1016/j.ridd.2003.12.001
* Corresponding author. Tel.: þ358-3-6336179.
E-mail address: [email protected] (T. Koskentausta).
1. Introduction
While emotional and behavioral problems are frequent among children with
intellectual disability (Bregman, 1991; Dykens, 2000), communication distur-
bances and other handicaps complicate the assessment of psychopathology in
these children. Structured checklists have been used to supplement psychiatric
assessment of children with normal intelligence, but for children with intellectual
disability, only a few checklists exist. Despite some restrictions in their applic-
ability, certain instruments for children with normal intelligence have been
applied in the assessment of children with intellectual disability.
The Child Behavior Checklist (CBCL; Achenbach, 1991) is a widely used
instrument in the assessment of emotional and behavioral problems of children
and adolescents. However, it has been used less often among children and
adolescents with intellectual disability. Hatton et al. (2002) found in a series
of 59 boys with Fragile-X syndrome that 49% had borderline or clinical problem
behavior. In children and adolescents with Down (n ¼ 23) and Fragile-X (n ¼ 12)
syndrome, Bargagna, Canepa, and Tinelli (2002) observed differences between
behavior profiles of these groups. The CBCL competence scores in both groups
were lower than average. Dekker, Koot, van der Ende, and Verhulst (2002)
reported that children with intellectual disability had significantly higher mean
scores on all CBCL scales than children without intellectual disability. In their
study, almost 50% of children with intellectual disability had a total problem
score in the deviant range compared with 18% of children without intellectual
disability.
The CBCL and the Psychopathology Instrument for Mentally Retarded Adults
(PIMRA) total scores have been found to be closely intercorrelated; likewise, the
CBCL Internalizing and Externalizing scores correlate with the PIMRA total
scores (Masi, Brovedani, Mucci, & Favilla, 2002).
The factorial validity of the CBCL has been evaluated by Borthwick-Duffy,
Lane, and Widaman (1997), who examined scores from the CBCL for 67 children
and adolescents with mental retardation. This factor analysis failed to confirm the
presence of the five first-order factors from the CBCL in their sample but did
provide evidence of more general broad-banded syndromes of Internalizing and
Externalizing problem behavior. Their results support the use of the CBCL for
children with intellectual disability.
The reliability of the CBCL for children with mild mental retardation has been
evaluated by Embregts (2000) using data on 42 children and youths. At item level,
mean kappas for inter-rater and test–retest reliability were .267 and .25, respec-
tively. At syndrome level, mean intra-class correlations for inter-rater and test–
retest reliability were .493 and .775, respectively. Embregts suggested that the
CBCL may not always represent a reliable checklist for the assessment of
psychopathology among children and youth with mental retardation.
Taking into account these disparate conclusions, our aim was to evaluate the
Finnish translation of the CBCL in the assessment of psychopathology in a
Finnish population of children with intellectual disability.
342 T. Koskentausta et al. / Research in Developmental Disabilities 25 (2004) 341–354
2. Method
2.1. Subjects
The subjects comprised children with intellectual disability born in 1982–1988
and residing in 1995 in the catchment area of the Paajarvi Rehabilitation Center,
Finland. The Paajarvi Rehabilitation Center provides services for persons with
intellectual disability residing in its catchment area, which includes 25 munici-
palities. Five of these are towns, with populations ranging from 16,000 to 95,000
inhabitants. The remaining 20 are smaller rural municipalities. The total popula-
tion base of this area in 1995 was about 337,000 inhabitants, approximately
28,000 of whom were born in 1982–1988.
The subjects were sought and identified from the patient register of the Paajarvi
Rehabilitation Center and regional hospitals and special schools. The number of
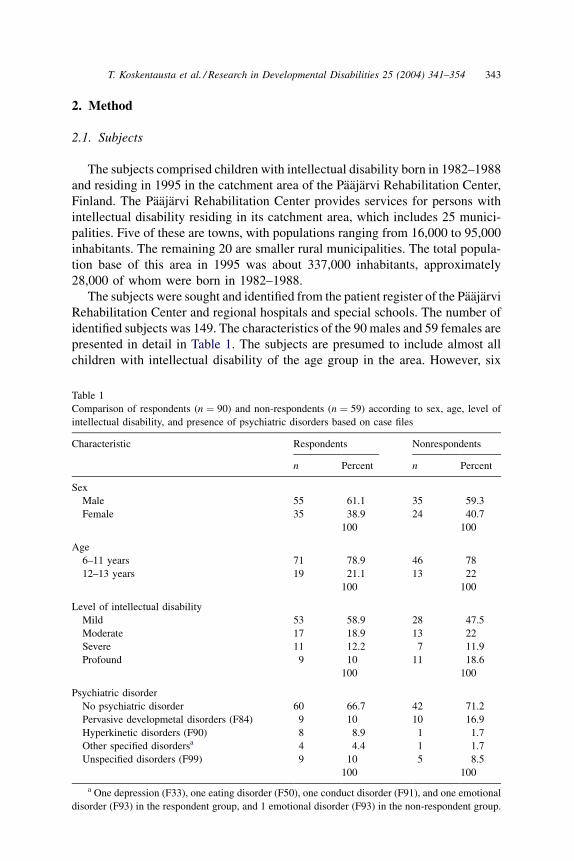
identified subjects was 149. The characteristics of the 90 males and 59 females are
presented in detail in Table 1. The subjects are presumed to include almost all
children with intellectual disability of the age group in the area. However, six
Table 1
Comparison of respondents (n ¼ 90) and non-respondents (n ¼ 59) according to sex, age, level of
intellectual disability, and presence of psychiatric disorders based on case files
Characteristic Respondents Nonrespondents
n Percent n Percent
Sex
Male 55 61.1 35 59.3
Female 35 38.9 24 40.7
100 100
Age
6–11 years 71 78.9 46 78
12–13 years 19 21.1 13 22
100 100
Level of intellectual disability
Mild 53 58.9 28 47.5
Moderate 17 18.9 13 22
Severe 11 12.2 7 11.9
Profound 9 10 11 18.6
100 100
Psychiatric disorder
No psychiatric disorder 60 66.7 42 71.2
Pervasive developmetal disorders (F84) 9 10 10 16.9
Hyperkinetic disorders (F90) 8 8.9 1 1.7
Other specified disordersa 4 4.4 1 1.7
Unspecified disorders (F99) 9 10 5 8.5
100 100
a One depression (F33), one eating disorder (F50), one conduct disorder (F91), and one emotional
disorder (F93) in the respondent group, and 1 emotional disorder (F93) in the non-respondent group.
T. Koskentausta et al. / Research in Developmental Disabilities 25 (2004) 341–354 343
additional children later identified as having intellectual disability were not
included.
2.2. Instrument
The assessment of psychopathology was based on the CBCL. The CBCL
(Achenbach, 1991) consists of competence items and 118 behavior problem
items. Behavior problem statements are scored by the parent on a three-level rating
scale, where 0 ¼ not true, 1 ¼ somewhat or sometimes true, and 2 ¼ very true or
often true. The checklist provides the Total Competence score and the Total
Problem score. The competence scales consist of Activities, Social, and School
Scales. The problem syndromes identified in the CBCL have been grouped by high-
order factor analyses into Internalizing and Externalizing dimensions of behavior.
The Internalizing factor includes the three syndromes of Withdrawn, Somatic
Complaints, and Anxious/Depressed, and the Externalizing factor the two syn-
dromes of Delinquent Behavior and Aggressive Behavior. In addition, four syn-
dromes known as Social Problems, Thought Problems, Attention Problems, and Sex
Problems are included in neither the Internalizing nor the Externalizing scales.
The test–retest reliability of the CBCL is high. The overall intraclass correla-
tion coefficient (ICC) is .996 for competence items and .952 for problem items.
The test–retest reliability for competence scales is .87 and for problem scales .89.
Inter-rater reliability between parents is .89 for competence scales and .65–.75 for
problem scales (Achenbach, 1991).
2.3. Procedure
The CBCL was mailed to the parents or other carers of 149 children. Completed
CBCLs were returned by parents or other carers of 93 children. Three checklists
were excluded because they were incomplete or unreliably completed. Thus,
checklists of 90 children were included. Of these, 82 were completed by parents
or foster parents,2 by othercarers, 2 by parents and teacher together, and 4 by teacher
alone. The distribution of sex, age, level of intellectual disability, or presence of a
psychiatricdisorderaccordingtocasefileswasnotsignificantlydifferentbetweenthe
90 respondents and the 59 non-respondents (Table 1).
In the analysis of results, the distribution of scores for individual problem items as
well as the scores for Competence Scales (Activities, Social, School, and Total
Competence scores) and Problem Scales (Total Problem score, Internalizing score,
and Externalizing score) was calculated. The cut-off point for the Total Problem
scoreforpsychiatricdisorderswas60,assuggestedbyAchenbach(1991).Theresults
were compared with the original CBCL normative samples (Achenbach, 1991).
To correlate the results of the CBCL with other checklists, the parents or carers
of the children were asked to complete the Developmental Behavior Checklist
(DBC; Einfeld & Tonge, 1994) and the AAMD Adaptive Behavior Scale (ABS;
Nihira, Foster, Shellhaas, & Leland, 1974). Completed DBCs were received for 80
and ABSs for 81 of the 90 children for whom the CBCL was completed.
344 T. Koskentausta et al. / Research in Developmental Disabilities 25 (2004) 341–354
Information on psychiatric diagnoses and symptoms was obtained from the
patient register and each case file. This information was analyzed by the first
author (T.K.). Previous psychiatric diagnoses were recorded and re-evaluated
according to information in case files. Some of the case files of the children with
no previous psychiatric diagnoses included information according to which the
child could be regarded as having a psychiatric disorder. The psychiatric
diagnoses were assessed based on ICD-10 criteria (Diagnostic Criteria for
Research), and the main categories are presented in Table 1.
2.4. Measurement of IQ range
The level of intellectual disability was defined in accordance with the ICD-10
criteria by intelligence quotient (IQ) as follows: IQ 50–69 as mild, IQ 35–49 as
moderate, IQ 20–34 as severe, and IQ < 20 as profound. Information on the level
of intellectual disability was obtained from case files. Psychological examinations
had previously been done for 84 children, and the tests most often used were
Wechsler Intelligence Scales for Children—Revised (WISC-R), Merrill–Palmer
Scale of Mental Tests, Leiter International Performance Scale, Cattell Infant
Intelligence Scale, and Vineland Social Maturity Scale.
Results of cognitive assessments were unavailable for six children, all of whom
presumablyhadintellectualdisability.Fourchildrenhadamotorandcommunication
disability due to cerebral palsy or inherited metabolic disease, and thus, could not be
tested. One child had Down syndrome and one child, for whom a psychological
examination had previously been performed but results were unavailable, had
intellectual disability of unknown etiology. All information in case files (e.g., motor,
communication, and self-help skills) was used to evaluate the level at which the
children operated. The AAMD Adaptive Behavior Scale (Nihira et al., 1974) was
completed by the parents of five of these children, and the score of the personal
independence part of the scale was consistent with the level of intellectual disability
determined as outlined above. The evaluated level of intellectual disability of these
six children was mild for 2, severe for 1, and profound for 3.
2.5. Data analysis
Statistical comparison was based on chi-square tests, Fisher’s exact tests,
unpaired t-tests, and single sample t-tests. Correlations with the ABS and the DBC
were calculated by simple linear regression.
3. Results
3.1. Competence scores
The responses to the competence items, especially the school scale, were
incomplete. Because of missing information in checklists, the Total Competence
T. Koskentausta et al. / Research in Developmental Disabilities 25 (2004) 341–354 345
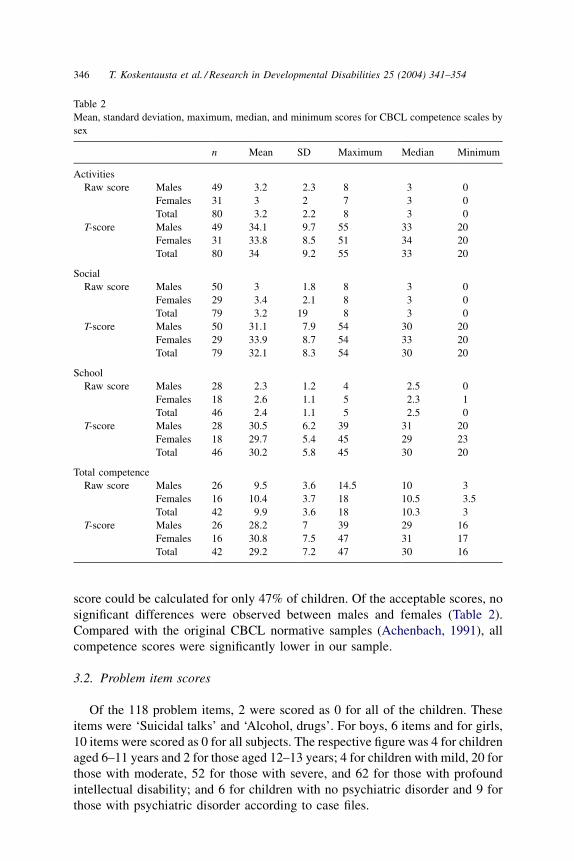
score could be calculated for only 47% of children. Of the acceptable scores, no
significant differences were observed between males and females (Table 2).
Compared with the original CBCL normative samples (Achenbach, 1991), all
competence scores were significantly lower in our sample.
3.2. Problem item scores
Of the 118 problem items, 2 were scored as 0 for all of the children. These
items were ‘Suicidal talks’ and ‘Alcohol, drugs’. For boys, 6 items and for girls,
10 items were scored as 0 for all subjects. The respective figure was 4 for children
aged 6–11 years and 2 for those aged 12–13 years; 4 for children with mild, 20 for
those with moderate, 52 for those with severe, and 62 for those with profound
intellectual disability; and 6 for children with no psychiatric disorder and 9 for
those with psychiatric disorder according to case files.
Table 2
Mean, standard deviation, maximum, median, and minimum scores for CBCL competence scales by
sex
n Mean SD Maximum Median Minimum
Activities
Raw score Males 49 3.2 2.3 8 3 0
Females 31 3 2 7 3 0
Total 80 3.2 2.2 8 3 0
T-score Males 49 34.1 9.7 55 33 20
Females 31 33.8 8.5 51 34 20
Total 80 34 9.2 55 33 20
Social
Raw score Males 50 3 1.8 8 3 0
Females 29 3.4 2.1 8 3 0
Total 79 3.2 19 8 3 0
T-score Males 50 31.1 7.9 54 30 20
Females 29 33.9 8.7 54 33 20
Total 79 32.1 8.3 54 30 20
School
Raw score Males 28 2.3 1.2 4 2.5 0
Females 18 2.6 1.1 5 2.3 1
Total 46 2.4 1.1 5 2.5 0
T-score Males 28 30.5 6.2 39 31 20
Females 18 29.7 5.4 45 29 23
Total 46 30.2 5.8 45 30 20
Total competence
Raw score Males 26 9.5 3.6 14.5 10 3
Females 16 10.4 3.7 18 10.5 3.5
Total 42 9.9 3.6 18 10.3 3
T-score Males 26 28.2 7 39 29 16
Females 16 30.8 7.5 47 31 17
Total 42 29.2 7.2 47 30 16
346 T. Koskentausta et al. / Research in Developmental Disabilities 25 (2004) 341–354
The number of items scored as 0 for more than 95% of children was 19. Eight
of these items were scored as 0 for more than 95% of the children in all subgroups
(boys and girls; children aged 6–11 years and those aged 12–13 years; children
with mild and those with moderate, severe, or profound intellectual disability; and
children with no psychiatric disorder and those with psychiatric disorder accord-
ing to case files). In addition to the two items mentioned in the previous
paragraph—‘Suicidal talks’ and ‘Alcohol, drugs’—the remaining six items were
‘Fears impulses’, ‘Hears things’, ‘Feels too guilty’, ‘Sets fires’, ‘Thinks about
sex’, and ‘Wishes to be opposite sex’.
In the total sample, the highest proportion of score 1 or 2 (94%) was for the
item ‘Acts too young’. The response to this item was 1 or 2 for more than 90% of
the children in all of the subgroups mentioned above.
Differences in item responses were statistically significant according to sex in
4 items, according to age in 1 item, according to level of intellectual disability in
16 items, and according to the presence of psychiatric disorder in 20 items
(Table 3).
Compared with the original CBCL normative samples (Achenbach, 1991), the
mean problem item scores for boys and girls aged 6–11 years were somewhat
different. Achenbach presents mean scores for non-referred boys and girls, and
referred boys and girls. The mean scores for about half of the items in the present
study were between these scores. The mean scores were lower than those of non-
referred children in 42 items for boys and in 47 items for girls, and higher than
those of referred children in 22 items for boys and in 19 items for girls. The items
with the lowest means compared with the normative samples were ‘Needs to be
perfect’ and ‘Self-conscious’, and those with the highest means compared with
the normative samples were ‘Acts too young’ and ‘Speech problem’.
3.3. Total Problem score and factor scores
The mean, maximum, median, and minimum scores and standard deviations
for Total Problem, Internalizing, and Externalizing scores are presented in Table 4.
The mean scores were not statistically different between girls and boys or children
aged 6–11 years and 12–13 years.
Total Problem, Internalizing, and Externalizing scores were highest among
children with moderate intellectual disability and lowest among those with
profound intellectual disability. Externalizing scores were significantly higher
among children with mild or moderate intellectual disability than among those
with severe or profound intellectual disability (Table 5). Total Problem and
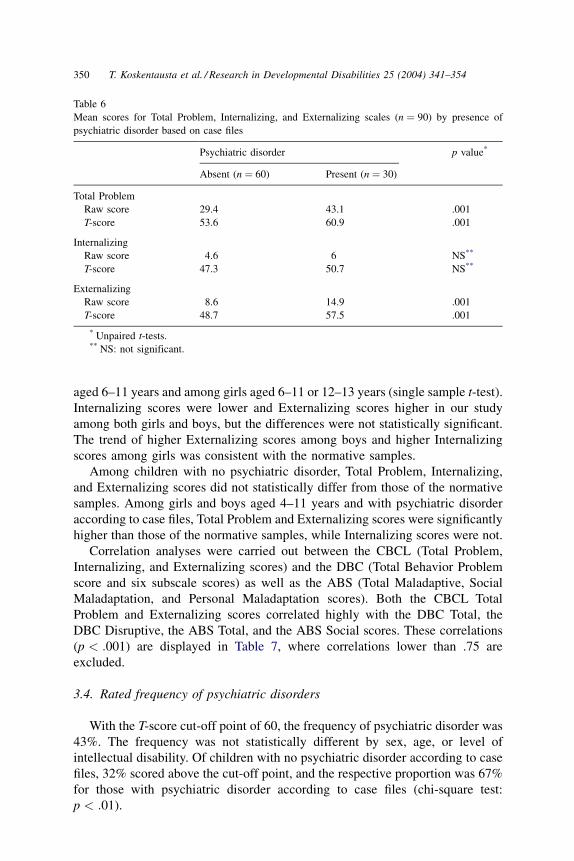
Externalizing scores were significantly higher among children with psychiatric
disorder compared with those with no established psychiatric disorder (Table 6).
These differences were also significant among the subgroup of children with mild
intellectual disability, but among those with moderate, severe, or profound
intellectual disability, only the Externalizing score was significantly different.
Compared with the original CBCL normative samples (Achenbach, 1991),
Total Problem scores were significantly higher in the present study among boys
T. Koskentausta et al. / Research in Developmental Disabilities 25 (2004) 341–354 347
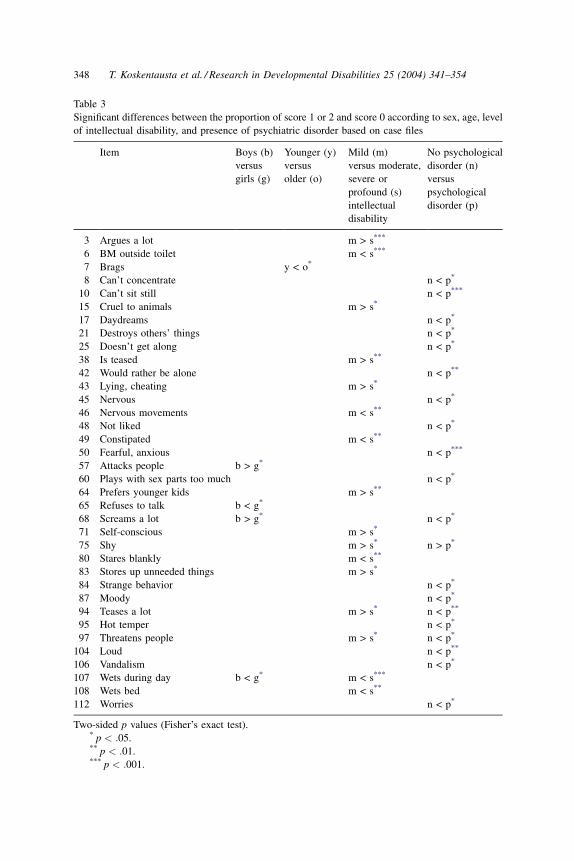
Table 3
Significant differences between the proportion of score 1 or 2 and score 0 according to sex, age, level
of intellectual disability, and presence of psychiatric disorder based on case files
Item Boys (b)
versus
girls (g)
Younger (y)
versus
older (o)
Mild (m)
versus moderate,
severe or
profound (s)
intellectual
disability
No psychological
disorder (n)
versus
psychological
disorder (p)
3 Argues a lot m > s***
6 BM outside toilet m < s***
7 Brags y < o*
8 Can’t concentrate n < p*
10 Can’t sit still n < p***
15 Cruel to animals m > s*
17 Daydreams n < p*
21 Destroys others’ things n < p*
25 Doesn’t get along n < p*
38 Is teased m > s**
42 Would rather be alone n < p**
43 Lying, cheating m > s*
45 Nervous n < p*
46 Nervous movements m < s**
48 Not liked n < p*
49 Constipated m < s**
50 Fearful, anxious n < p***
57 Attacks people b > g*
60 Plays with sex parts too much n < p*
64 Prefers younger kids m > s**
65 Refuses to talk b < g*
68 Screams a lot b > g* n < p*
71 Self-conscious m > s*
75 Shy m > s* n > p*
80 Stares blankly m < s**
83 Stores up unneeded things m > s*
84 Strange behavior n < p*
87 Moody n < p*
94 Teases a lot m > s* n < p**
95 Hot temper n < p*
97 Threatens people m > s* n < p*
104 Loud n < p**
106 Vandalism n < p*
107 Wets during day b < g* m < s***
108 Wets bed m < s**
112 Worries n < p*
Two-sided p values (Fisher’s exact test).* p < :05.** p < :01.*** p < :001.
348 T. Koskentausta et al. / Research in Developmental Disabilities 25 (2004) 341–354
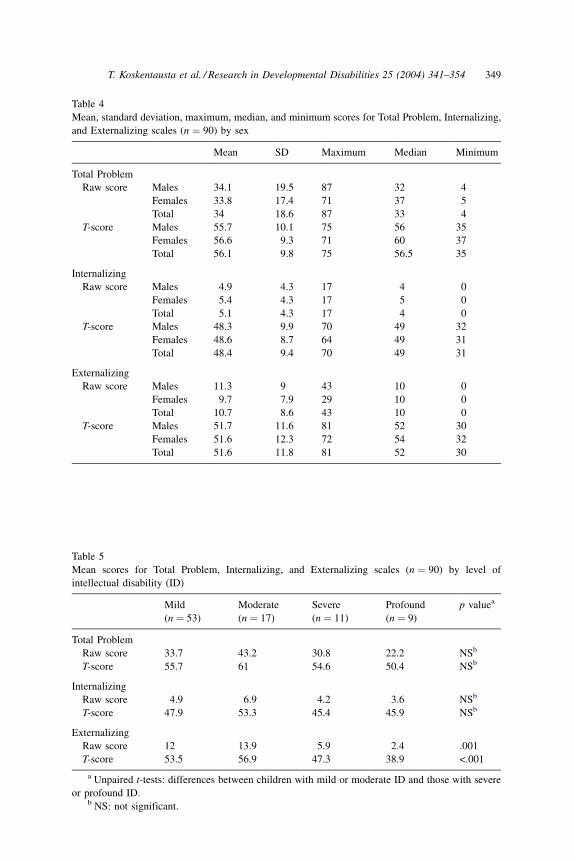
Table 4
Mean, standard deviation, maximum, median, and minimum scores for Total Problem, Internalizing,
and Externalizing scales (n ¼ 90) by sex
Mean SD Maximum Median Minimum
Total Problem
Raw score Males 34.1 19.5 87 32 4
Females 33.8 17.4 71 37 5
Total 34 18.6 87 33 4
T-score Males 55.7 10.1 75 56 35
Females 56.6 9.3 71 60 37
Total 56.1 9.8 75 56.5 35
Internalizing
Raw score Males 4.9 4.3 17 4 0
Females 5.4 4.3 17 5 0
Total 5.1 4.3 17 4 0
T-score Males 48.3 9.9 70 49 32
Females 48.6 8.7 64 49 31
Total 48.4 9.4 70 49 31
Externalizing
Raw score Males 11.3 9 43 10 0
Females 9.7 7.9 29 10 0
Total 10.7 8.6 43 10 0
T-score Males 51.7 11.6 81 52 30
Females 51.6 12.3 72 54 32
Total 51.6 11.8 81 52 30
Table 5
Mean scores for Total Problem, Internalizing, and Externalizing scales (n ¼ 90) by level of
intellectual disability (ID)
Mild
(n ¼ 53)
Moderate
(n ¼ 17)
Severe
(n ¼ 11)
Profound
(n ¼ 9)
p valuea
Total Problem
Raw score 33.7 43.2 30.8 22.2 NSb
T-score 55.7 61 54.6 50.4 NSb
Internalizing
Raw score 4.9 6.9 4.2 3.6 NSb
T-score 47.9 53.3 45.4 45.9 NSb
Externalizing
Raw score 12 13.9 5.9 2.4 .001
T-score 53.5 56.9 47.3 38.9 <.001
a Unpaired t-tests: differences between children with mild or moderate ID and those with severe
or profound ID.b NS: not significant.
T. Koskentausta et al. / Research in Developmental Disabilities 25 (2004) 341–354 349
aged 6–11 years and among girls aged 6–11 or 12–13 years (single sample t-test).
Internalizing scores were lower and Externalizing scores higher in our study
among both girls and boys, but the differences were not statistically significant.
The trend of higher Externalizing scores among boys and higher Internalizing
scores among girls was consistent with the normative samples.
Among children with no psychiatric disorder, Total Problem, Internalizing,
and Externalizing scores did not statistically differ from those of the normative
samples. Among girls and boys aged 4–11 years and with psychiatric disorder
according to case files, Total Problem and Externalizing scores were significantly
higher than those of the normative samples, while Internalizing scores were not.
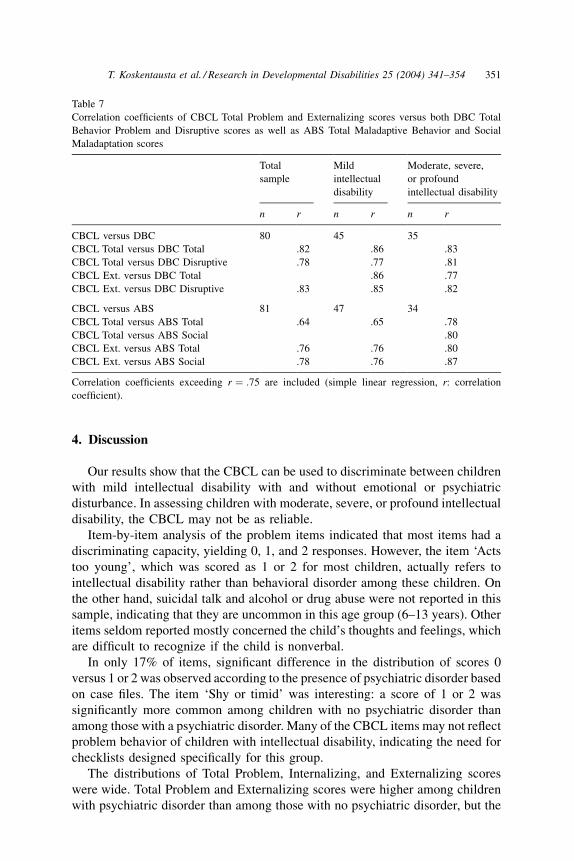
Correlation analyses were carried out between the CBCL (Total Problem,
Internalizing, and Externalizing scores) and the DBC (Total Behavior Problem
score and six subscale scores) as well as the ABS (Total Maladaptive, Social
Maladaptation, and Personal Maladaptation scores). Both the CBCL Total
Problem and Externalizing scores correlated highly with the DBC Total, the
DBC Disruptive, the ABS Total, and the ABS Social scores. These correlations
(p < :001) are displayed in Table 7, where correlations lower than .75 are
excluded.
3.4. Rated frequency of psychiatric disorders
With the T-score cut-off point of 60, the frequency of psychiatric disorder was
43%. The frequency was not statistically different by sex, age, or level of
intellectual disability. Of children with no psychiatric disorder according to case
files, 32% scored above the cut-off point, and the respective proportion was 67%
for those with psychiatric disorder according to case files (chi-square test:
p < :01).
Table 6
Mean scores for Total Problem, Internalizing, and Externalizing scales (n ¼ 90) by presence of
psychiatric disorder based on case files
Psychiatric disorder p value*
Absent (n ¼ 60) Present (n ¼ 30)
Total Problem
Raw score 29.4 43.1 .001
T-score 53.6 60.9 .001
Internalizing
Raw score 4.6 6 NS**
T-score 47.3 50.7 NS**
Externalizing
Raw score 8.6 14.9 .001
T-score 48.7 57.5 .001
* Unpaired t-tests.** NS: not significant.
350 T. Koskentausta et al. / Research in Developmental Disabilities 25 (2004) 341–354
4. Discussion
Our results show that the CBCL can be used to discriminate between children
with mild intellectual disability with and without emotional or psychiatric
disturbance. In assessing children with moderate, severe, or profound intellectual
disability, the CBCL may not be as reliable.
Item-by-item analysis of the problem items indicated that most items had a
discriminating capacity, yielding 0, 1, and 2 responses. However, the item ‘Acts
too young’, which was scored as 1 or 2 for most children, actually refers to
intellectual disability rather than behavioral disorder among these children. On
the other hand, suicidal talk and alcohol or drug abuse were not reported in this
sample, indicating that they are uncommon in this age group (6–13 years). Other
items seldom reported mostly concerned the child’s thoughts and feelings, which
are difficult to recognize if the child is nonverbal.
In only 17% of items, significant difference in the distribution of scores 0
versus 1 or 2 was observed according to the presence of psychiatric disorder based
on case files. The item ‘Shy or timid’ was interesting: a score of 1 or 2 was
significantly more common among children with no psychiatric disorder than
among those with a psychiatric disorder. Many of the CBCL items may not reflect
problem behavior of children with intellectual disability, indicating the need for
checklists designed specifically for this group.
The distributions of Total Problem, Internalizing, and Externalizing scores
were wide. Total Problem and Externalizing scores were higher among children
with psychiatric disorder than among those with no psychiatric disorder, but the
Table 7
Correlation coefficients of CBCL Total Problem and Externalizing scores versus both DBC Total
Behavior Problem and Disruptive scores as well as ABS Total Maladaptive Behavior and Social
Maladaptation scores
Total
sample
Mild
intellectual
disability
Moderate, severe,
or profound
intellectual disability
n r n r n r
CBCL versus DBC 80 45 35
CBCL Total versus DBC Total .82 .86 .83
CBCL Total versus DBC Disruptive .78 .77 .81
CBCL Ext. versus DBC Total .86 .77
CBCL Ext. versus DBC Disruptive .83 .85 .82
CBCL versus ABS 81 47 34
CBCL Total versus ABS Total .64 .65 .78
CBCL Total versus ABS Social .80
CBCL Ext. versus ABS Total .76 .76 .80
CBCL Ext. versus ABS Social .78 .76 .87
Correlation coefficients exceeding r ¼ :75 are included (simple linear regression, r: correlation
coefficient).
T. Koskentausta et al. / Research in Developmental Disabilities 25 (2004) 341–354 351
difference in the Internalizing score was not significant. An explanation for this
may be that internalizing symptoms of depression, for example, which often fail
to be recognized in children with normal intelligence, are even more likely to go
unrecognized in a nonverbal child.
The incomplete response to the competence section for the majority of children
is probably due to differences between children with normal intelligence and
those with intellectual disability in daily environment and activities: most
children and adolescents with intellectual disability in Finland attend special
schools with special educational schemes, and their possibilities for activities and
peer contacts outside school are limited. This situation may also partly explain the
low competence scores in the acceptable checklists, a finding consistent with that
of Bargagna et al. (2002).
Of the 30 children with psychiatric disorder, 20 scored above the CBCL cut-off
point, corresponding to a sensitivity of .667, and of the 60 children with no
psychiatric disorder according to case files, 41 scored below the cut-off point,
corresponding to a specificity of .683. Methodological differences in measure-
ments probably decrease these figures: assessment of psychiatric disorders in the
present study was based on all notes over the entire time period of the case files,
and previous medication and other interventions presumably also affect the
manifestation of a psychiatric disorder. Consequently, the child’s current problem
score may have fallen below the cut-off point of the checklist, which is intended to
measure disturbance only over the past six months. On the other hand, psychiatric
diagnoses based on case files may be underestimated because case files generally
include data on the child’s behavior only if behavior is the main concern at the
visit.
The rated frequency of psychiatric disorders among children with intellectual
disability, 43%, is similar to that of other recent studies based on checklists
(Cormack, Brown, & Hastings, 2000 (50%); Dekker et al., 2002 (50%); Einfeld &
Tonge, 1996 (41%); Linna et al., 1999 (32%)). In another study based mostly on
the same sample as the present study and assessed with the DBC, the rated
frequency of psychiatric disorders was 34% (Koskentausta & Almqvist, 2004).
Psychiatric disorders have frequently been reported to be more common
among intellectually disabled males than females (Gillberg, Persson, Grufman,
& Themner, 1986; Hardan & Sahl, 1997; Jacobson, 1990; Strømme & Diseth,
2000) and among children with severe intellectual disability (IQ < 50) than
among those with mild disability (Gillberg et al., 1986). However, Einfeld and
Tonge (1996) found no differences between the sexes, a result supported by our
study. Children with moderate intellectual disability were found to suffer most
from psychiatric disorders. This finding may be explained by the frequency of
psychiatric disorders actually increasing with decreasing IQ, and questionnaires
such as the CBCL fail to reveal all disorders among children with profound
intellectual disability.
While the population of the study area is fairly representative of the population
in Finland overall, it does not optimally represent the largest urban populations.
The study sample included virtually all children with intellectual disability of the
352 T. Koskentausta et al. / Research in Developmental Disabilities 25 (2004) 341–354
age cohort in the area, but the respondents comprised only about 60% of the
original sample. However, because the distribution of sex, age, level of intellec-
tual disability, and presence of psychiatric disorder according to case files was not
significantly different between respondents and non-respondents, the bias is
evidently small.
The CBCL had some limitations in its applicability for assessing children with
intellectual disability. The competence section of the CBCL does not accurately
describe daily life activities of children with moderate, severe, or profound
intellectual disability. Certain problem items do not measure the problem
behavior of children with intellectual disability sufficiently well, whereas pro-
blems typical of children with intellectual disability, such as motor and com-
munication limitations, are ignored in the checklist. The CBCL reveals
externalizing behavior of children with intellectual disability better than inter-
nalizing behavior, and the latter may be overlooked if assessment is based only on
the checklist. Similar to most checklists, the CBCL is more suited for children
with mild intellectual disability than for those with moderate, severe or profound
intellectual disability. Taking these limitations into account, the CBCL can be
recommended for use in the assessment of psychopathology among children and
adolescents with mild intellectual disability in Finland.
Acknowledgments
This study was supported by the Paajarvi Rehabilitation Center, Lammi,
Finland, the Research Foundation of Child Psychiatry, Finland, the Rinnekoti
Research Foundation, Espoo, Finland, and the Foundation of the Children’s
Castle, Helsinki, Finland.
References
Achenbach, T. M. (1991). Manual for the Child Behavior Checklist/4-18 and 1991 profile.
Burlington, VT: Department of Psychiatry, University of Vermont.
Bargagna, S., Canepa, G., & Tinelli, F. (2002). Social adjustment in children with Down
mental retardation (MRD) and Fragile-X mental retardation (MRX). Panminerva Medica, 44,
7–10.
Borthwick-Duffy, S. A., Lane, K. L., & Widaman, K. F. (1997). Measuring problem behaviors in
children with mental retardation: Dimensions and predictors. Research in Developmental
Disability, 18, 415–433.
Bregman, J. D. (1991). Current developments in the understanding of mental retardation. Part II:
Psychopathology. Journal of American Academy of Child and Adolescent Psychiatry, 30,
861–872.
Cormack, K. F. M., Brown, A. C., & Hastings, R. P. (2000). Behavioural and emotional difficulties in
students attending schools for children and adolescents with severe intellectual disability. Journal
of Intellectual Disability Research, 44, 124–129.
Dekker, M. C., Koot, H. M., van der Ende, J., & Verhulst, F. C. (2002). Emotional and behavioral
problems in children and adolescents with and without intellectual disability. Journal of Child
Psychology and Psychiatry, 43, 1087–1098.
T. Koskentausta et al. / Research in Developmental Disabilities 25 (2004) 341–354 353
Dykens, E. M. (2000). Annotation: Psychopathology in children with intellectual disability. Journal
of Child Psychology and Psychiatry, 41, 407–417.
Einfeld, S. L., & Tonge, B. J. (1994). Manual for the Developmental Behaviour Checklist: Primary
carer version (DBC-P). Melbourne, Australia: Centre for Developmental Psychiatry, Monash
University.
Einfeld, S. L., & Tonge, B. J. (1996). Population prevalence of psychopathology in children and
adolescents with intellectual disability: II epidemiological findings. Journal of Intellectual
Disability Research, 40, 99–109.
Embregts, P. J. (2000). Reliability of the Child Behavior Checklist for the assessment of behavioral
problems of children and youth with mild mental retardation. Research in Developmental
Disabilities, 21, 31–41.
Gillberg, C., Persson, E., Grufman, M., & Themner, U. (1986). Psychiatric disorders in mildly and
severely mentally retarded urban children and adolescents: Epidemiological aspects. British
Journal of Psychiatry, 149, 68–74.
Hardan, A., & Sahl, R. (1997). Psychopathology in children and adolescents with developmental
disorders. Research in Developmental Disabilities, 18, 369–382.
Hatton, D. D., Hooper, S. R., Bailey, D. B., Skinner, M. L., Sullivan, K. M., & Wheeler, A. (2002).
Problem behavior in boys with fragile X syndrome. American Journal of Medical Genetics., 108,
105–116.
Jacobson, J. W. (1990). Do some mental disorders occur less frequently among persons with mental
retardation? American Journal of Mental Retardation, 94, 596–602.
Koskentausta, T., & Almqvist, F. (2004). Developmental Behaviour Checklist (DBC) in the
assessment of psychopathology in Finnish children with intellectual disability. Journal of
Intellectual & Developmental Disability, 29, 27–39.
Linna, S.-L., Moilanen, I., Ebeling, H., Piha, J., Kumpulainen, K., Tamminen, T. et al. (1999).
Psychiatric symptoms in children with intellectual disability. European Child and Adolescent
Psychiatry, 8(Suppl. 4), 77–82.
Masi, G., Brovedani, P., Mucci, M., & Favilla, L. (2002). Assessment of anxiety and depression in
adolescents with mental retardation. Child Psychiatry and Human Development, 32, 227–237.
Nihira, K., Foster, R., Shellhaas, M., & Leland, H. (1974). AAMD Adaptive Behavior Scale.
Washington DC: American Association of Mental Deficiency.
Strømme, P., & Diseth, T. (2000). Prevalence of psychiatric diagnoses in children with mental
retardation: Data from a population-based study. Developmental Medicine and Child Neurology,
42, 266–270.
354 T. Koskentausta et al. / Research in Developmental Disabilities 25 (2004) 341–354
Recommended