Binama Maxime.Int. Journal of Engineering Research and Applications www.ijera.com
ISSN: 2248-9622, Vol. 6, Issue 5, (Part - 1) May 2016, pp.52-63
www.ijera.com 52|P a g e
Cavitation Effects in Centrifugal Pumps- A Review
Maxime Binamaa, Alex Muhirwaa,b, Emmanuel Bisengimanac
a(Power Engineering and Engineering Thermophysics, Harbin Institute of Technology, 150001 China) b(Mechanical Engineering Department, Integrated Polytechnic Regional Centre-Kigali, 6579 Kigali-Rwanda ) c(Mechanical Engineering Department, Harbin Institute of Technology, 150001 China)
ABSTRACT
Cavitation is one of the most challenging fluid flow abnormalities leading to detrimental effects on both the
centrifugal pump flow behaviors and physical characteristics. Centrifugal pumps’ most low pressure zones are the
first cavitation victims, where cavitation manifests itself in form of pitting on the pump internal solid walls,
accompanied by noise and vibration, all leading to the pump hydraulic performance degradation. In the present
article, a general description of centrifugal pump performance and related parameters is presented. Based on the
literature survey, some light were shed on fundamental cavitation features; where different aspects relating to
cavitation in centrifugal pumps were briefly discussed.
Keywords: Cavitation, Centrifugal pump, Performance,
I. INTRODUCTION 1.1. Centrifugal pumps
The Centrifugal pump, as any other dynamic
pump, is used to move the fluid from one point to
another in a system, by simply adding momentum to
it. It is mainly composed of two important parts which
are: 1) The impeller and 2) the volute casing. The
fluid axially enters the impeller eye where it is spread
radially towards inter-blades flow areas, and gets
tangentially whirled by the effect of the rotating
impellers vanes. The fluid momentum is increased
while passing between the fastly rotating impeller
blades, until it reaches the impeller exit zone
whereby, by means of the in-place pump volute, the
acquired fluid high velocity is converted to a pressure
increase enough to overcome the required Head. The
impeller blades rotating motion, continuously creates
the vacuum at the impeller eye, which then results in
a continuous suction of the fluid from the inlet pipe
towards the impeller eye. In other words, centrifugal
pumps add energy to the flowing fluid striving to get
to the destination point. The added energy is a result
of power conversion from the engine driven drive
shaft’s mechanical power to the fluid hydraulic
power.
Because of different losses within the pump or
outside during the energy transfer process, such as
disc friction, shock losses, mixing, change in
direction of fluid, separation, bearing losses,
turbulence, and leakage losses, the fluid-acquired
hydraulic energy (water horsepower) is always
smaller than the shaft transmitted energy (Brake
horsepower).
Figure1. Power losses in centrifugal pumps
This difference brings an idea of centrifugal
pump performance in terms of Efficiency as shown
by the here down shown 2D formulas.
T
gQH
bhp
Pw
(1)
Where 𝜂, ρ, g, Q, H, ⍵, T, and 𝑃𝑊 stand for
pump efficiency, density, gravity acceleration, flow
rate, head, rotational speed, and hydraulic Energy
respectively. Considering the pump efficiency as a
unity (η=1), the theoretical head H linearly varies
with the pump discharge capacity Q as follows:
(2)
Where𝑢22 𝑔⁄ is the pump shutoff head value.
Qgg
Hbr
uu22
22
2
2
2
cot
RESEARCH ARTICLE OPEN ACCESS
Binama Maxime.Int. Journal of Engineering Research and Applications www.ijera.com
ISSN: 2248-9622, Vol. 6, Issue 5, (Part - 1) May 2016, pp.52-63
www.ijera.com 53|P a g e
Figure2.Head losses in centrifugal pump
In practice, the pump efficiency is never a
unity; it will always fall below a unity. For instance
the measured shutoff centrifugal pump head usually
comes to 60% or below the theoretical value [1]. Due
to the complexity of centrifugal pump fluid flow, it is
hard to accurately predict its performance parameters
on a theoretical basis. Designers have rather opted to
experimentally measure these parameters through
tests, where the resulting pump characteristics have
been presented in form of graphs. The experimentally
found actual developed head ha, the fluid gained
power Pf, and the overall efficiency are here down
presented.
PPha
12
hP afQ
bhp
Qha
(3)
Pump performance parameters are usually
given in form of graphs where the pump brake
horsepower, the developed head, and the efficiency
are plotted against the delivered capacity Q.
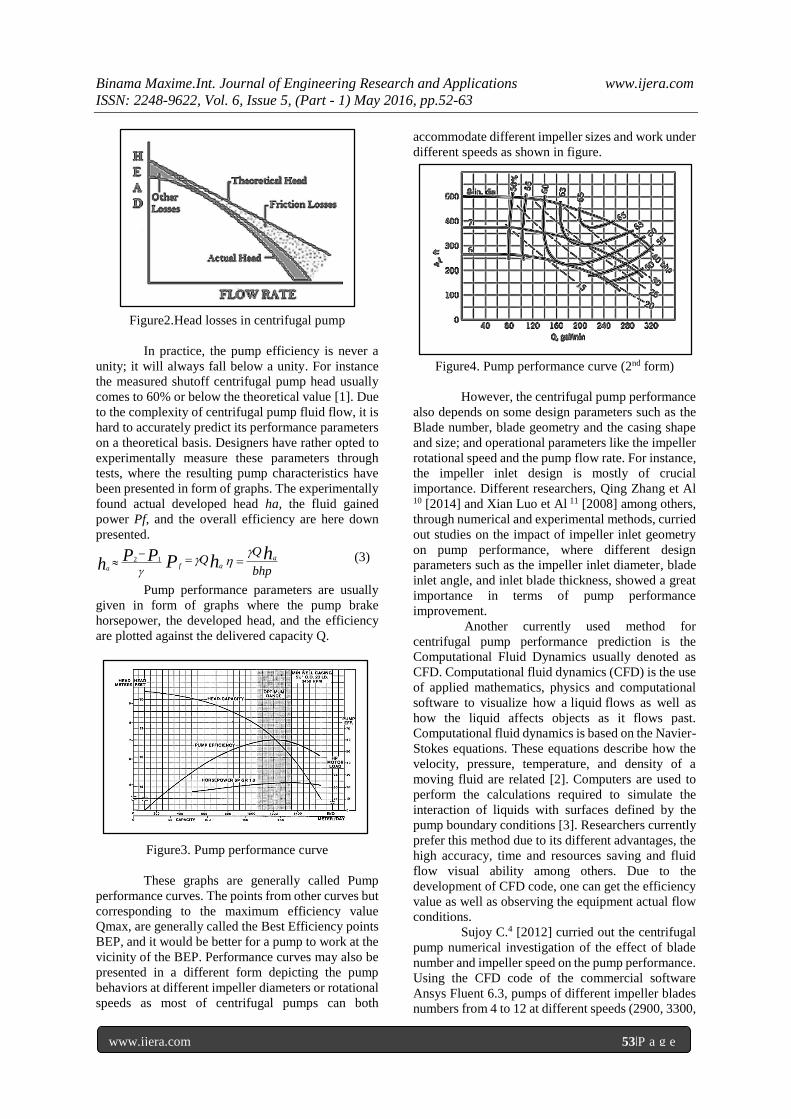
Figure3. Pump performance curve
These graphs are generally called Pump
performance curves. The points from other curves but
corresponding to the maximum efficiency value
Qmax, are generally called the Best Efficiency points
BEP, and it would be better for a pump to work at the
vicinity of the BEP. Performance curves may also be
presented in a different form depicting the pump
behaviors at different impeller diameters or rotational
speeds as most of centrifugal pumps can both
accommodate different impeller sizes and work under
different speeds as shown in figure.
Figure4. Pump performance curve (2nd form)
However, the centrifugal pump performance
also depends on some design parameters such as the
Blade number, blade geometry and the casing shape
and size; and operational parameters like the impeller
rotational speed and the pump flow rate. For instance,
the impeller inlet design is mostly of crucial
importance. Different researchers, Qing Zhang et Al
10 [2014] and Xian Luo et Al 11 [2008] among others,
through numerical and experimental methods, curried
out studies on the impact of impeller inlet geometry
on pump performance, where different design
parameters such as the impeller inlet diameter, blade
inlet angle, and inlet blade thickness, showed a great
importance in terms of pump performance
improvement.
Another currently used method for
centrifugal pump performance prediction is the
Computational Fluid Dynamics usually denoted as
CFD. Computational fluid dynamics (CFD) is the use
of applied mathematics, physics and computational
software to visualize how a liquid flows as well as
how the liquid affects objects as it flows past.
Computational fluid dynamics is based on the Navier-
Stokes equations. These equations describe how the
velocity, pressure, temperature, and density of a
moving fluid are related [2]. Computers are used to
perform the calculations required to simulate the
interaction of liquids with surfaces defined by the
pump boundary conditions [3]. Researchers currently
prefer this method due to its different advantages, the
high accuracy, time and resources saving and fluid
flow visual ability among others. Due to the
development of CFD code, one can get the efficiency
value as well as observing the equipment actual flow
conditions.
Sujoy C.4 [2012] curried out the centrifugal
pump numerical investigation of the effect of blade
number and impeller speed on the pump performance.
Using the CFD code of the commercial software
Ansys Fluent 6.3, pumps of different impeller blades
numbers from 4 to 12 at different speeds (2900, 3300,

Binama Maxime.Int. Journal of Engineering Research and Applications www.ijera.com
ISSN: 2248-9622, Vol. 6, Issue 5, (Part - 1) May 2016, pp.52-63
www.ijera.com 54|P a g e
and 3700 rpm) were simulated, only to finally find
that the pump head had been increasing with the
increase in both the blades number and pump speed,
whereas the efficiency was a bit complex with the 10
bladed impeller as the one with higher efficiency.
Pandey K.M5 [2012] studied the influence of
blades number variation on the pump performance
keeping the impeller diameter and speed constant for
all models. Using the standard k-Ɛ turbulence model
and SIMPLEC algorithm to solve the RANS
equations in Ansys Fluent software; the flow through
impellers of six, eight, and nine blades at the speed of
2500 rpm was studied. Both the pump head and static
pressure increased with the blade number but the
efficiency variation was complicated with specific
optimum values for each model.
Houlin L.6 [2010] also studied the influence
of the impeller blades number on the pump
performance through numerical simulation with
Ansys Fluent, and experiments. Through a
comparative scheme between the two methods, the
flow through the model pumps with 4, 5, 6, and 7
blades at a specific speed of 92.7 was studied. The
maximum deviation in the prediction results for the
head, net positive suction head, and efficiency were
4.83%, 0.36m, and 3.9% respectively. The developed
head increased with the blades number while the
efficiency was complicated.
Ahmed A.7 [2014] curried out a numerical
simulation using CFD to investigate the effect of
volute geometry on the pump performance.
Simulation results were compared to the experimental
data where finally the agreement between both
methods results was noticed. The pump head was
found to increase with pump volute cross-sectional
area. Patel M.G.8 [2013] used three pumps models at
different specific speeds to investigate the effect of
impeller blade exit angle on centrifugal pump
performance. The Gulich mathematical model was
first validated with the manufacturer’s H-Q curve
before being used in their research. After validation,
this method helped find out that both the head and
pump efficiency increased with the impeller exit
angle.
1.2. Cavitation
Cavitation is defined as the process of
formation of the vapor phase in a liquid when it is
subjected to reduced pressures at constant ambient
temperature [9]. When the fluid vapor drops below its
vapor pressure (𝑃𝑉), there is formation of gas bubbles
which, with the continuous pressure drop grow
progressively and finally collapse when they get to
higher pressure zones, the phenomena which is
generally called “cavitation”.
From the continuum mechanics view angle,
cavitation can be defined as the breaking of a fluid
medium under excessive stress or tension [12]. As
shown in the Thermodynamic diagram of Phase
change, there is a big difference in driving mechanism
between cavitation and boiling.
Figure5. Thermodynamic diagram of Phase change
Boiling is the bubble formation in the liquid
as a result of the increase of the fluid temperature to
specific values at a constant pressure whereas
cavitation is now a result of the fluid pressure
decrease under its vapor pressure at an approximately
constant temperature.
1.2.1. Typical cavitation occurrence situations
Here down are some of situations where
cavitation phenomenon is more likely to occur in the
fluid flow.
A. The wall geometry at the fluid flow zones imposes
high velocities and a subsequent pressure drop due
gradual decrease in flow area. This is the case of flow
constriction in fluid ducts and pump impellers.
B. The shearing between two neighboring flows
having very different velocities entails large turbulent
fluctuations of the pressure: that is the case for jets
and wakes. [12]
C. The high unsteadiness character of certain flows
which as a result increase the fluid flow temporal
acceleration terms, thus pressure drop in the fluid
flow.
D. The roughness at the fluid flow wall boundary,
which results in formation of wakes and subsequent
attached cavities.
E. Presence of water in interstices due the inaccurate
joining between two or more pieces in a mechanical
system. There is high probability of cavitation
occurrence when the interstice walls start to move.
F. The influence of moving solid bodies having sharp
edges immersed in the liquid. The acquired fluid
acceleration at these edges produces a pressure drop,
thus high chances of cavitation occurrence.
1.2.2. Cavitation types
The cavitation phenomenon is generally
characterized by the formation and growth of vapor
bubbles in the fluid flow. The fluid-vapor interface
can be under different shapes on which cavitation

Binama Maxime.Int. Journal of Engineering Research and Applications www.ijera.com
ISSN: 2248-9622, Vol. 6, Issue 5, (Part - 1) May 2016, pp.52-63
www.ijera.com 55|P a g e
classification is based. Different cavitation patterns
are here down presented.
A. Traveling cavitation
In this type of cavitation, the micro bubbles
otherwise called cavitation nuclei are curried along
the flow field until they get to the flow’s lower
pressure zones, where they become macroscopic
cavitation bubbles before collapsing at pressure
recovery zones. The developed bubbles are usually in
complex shapes mainly from their interactions with
neighboring walls or other bubbles
Figure6. Traveling Bubble Cavitation on the
Hydrofoil Suction Side
B. Attached cavitation
Contrary to the above presented traveling
cavitation, the attached cavitation stays at the same
location attached on a wall. This does not mean that
the flow is steady. Actually, cavitation is almost
always the source of unsteadiness which may be quite
strong. In the down presented case of attached
cavitation, the main source of unsteadiness originated
in the rear part of the cavity [13].
Figure7. Leading Edge Cavity on a Foil Suction Side
C. Vortex Cavitation
This type of cavitation is the mostly found in
marine propellers. It is found at the vortex core
generated by the secondary flow at the blade tip. The
blade tip second flow is a result of the pressure
difference between the vane pressure and suction side.
The pressure at the generated tip vortex is much lower
than pressure far away in the same fluid making it
vulnerable to cavitation phenomenon.
Figure8. Vortex Cavitation Generated by a Propeller
(Courtesy of DGA/BEC)
D. Shear Cavitation
Such a cavitation is observed in the wake of
bluff bodies or in submerged liquid jets; Figure below
presents a typical image of cavitation in the wake of
a wedge.
Figure9. An Example of Cavitation in the Wake of a
Bluff Body
1.2.4. Cavitation mechanism
A. Fluid nucleation
Nucleation is a physical process in which a
change of state for example, liquid to solid, occurs in
a substance around certain focal weak points, known
as nuclei [14].
Some of conditions which cause the fluid
nucleation are: 1) Formation of gaps between the
liquid molecules which is called “Homogeneous
nucleation”. 2) Formation of gaps between container
and the liquid’s molecules resulting in
“Heterogeneous nucleation”. 3) Presence of micro
bubbles in the liquid, which eventually grow to macro
sizes with the increase of the applied tensions. 4)
Development of bubbles in the fluid from the outside
radiations.
B. Cavitation inception
Cavitation inception is all about how close is
the fluid pressure to its vapor pressure. This closeness
is mostly measured through a constant called

Binama Maxime.Int. Journal of Engineering Research and Applications www.ijera.com
ISSN: 2248-9622, Vol. 6, Issue 5, (Part - 1) May 2016, pp.52-63
www.ijera.com 56|P a g e
“cavitation number”. When the cavitation number is
reduced to certain specific values, bubbles start to
form and the related cavitation number is termed as
inception cavitation number (σi). Further decrease
below this value results in the increase in bubble
number and size.
C. Bubble growth
The single bubble growth to its maximum
radius (size) is governed by the Rayleigh-Plesset
equation or its variations. This equation gives out the
relationship between the bubble radius variation and
the surrounding fluid pressure.
2
2
2
43 2
2
B L
L L
t t R dR SR
R dt R
dRP P ddt dt
(4)
This equation is based on assumptions like spherical
bubble symmetry and the absence of all thermal
effects.
D. Bubble collapse
At the last stage of bubble collapse, the
bubble is generally more unstable; which results in a
development of a re-entrant jet.
Figure10. Steps of the re-entrant jet development in
a collapsing bubble
Figure11. Collapsing bubble shape by Plesset (solid
lines) and Lauterborn (points)
When it is situated closer to the solid wall,
the re-entrant jet is formed from the bubble’s furthest
side from the wall, oriented inwards, towards the solid
boundary and hit the wall with very high speeds
enough to remove the material. Figure11 compares
re-entrant jets as measured by Lauterborn and Bolle38
[1975] and plesset and Chapman39 [1971].On the
other side, when the bubble is situated near the fluid
free surface, the generated re-entrant jet is oriented
away from the free surface.
1.2.5. Cavitation damage and its basic principles
Cavitation damage is the most recognized
cavitation detrimental effect. It is known to remove
materials from the flow boundary surfaces however
hard or tough the material can be.
Figure12. Cavitation erosion in a centrifugal pump
impeller
Solid materials like metals, glass, rubber,
quartz, and plastic, can all be damaged by cavitation.
Cavitation damaged is mostly manifested from four
basic principles [15, 16]: 1. The smaller the molecular
size of the liquid is and the lower the viscosity, the
easier it is for the liquid to penetrate into the surface
pores of the metal, thus the penetration of water into
the surface of the metal is deeper than in the case of
oils. 2. The greater the pressure, the deeper and
quicker the liquid penetrates into the pores of the
material. 3. The smaller the area of the pore the
greater the pressure produced when the vapor bubbles
collapse. 4. The higher the frequency of vibration, the
more intensive is the destruction of the surface layer
of the metal.
1.2.6. Cavitation detection
Cavitation is a very high speed phenomenon
at a point of not being easily perceived by a human
eye; this has been complicating the adequate
understanding about its mechanism. The individual
process happens very fast that none of its stages
(bubble formation, growth, and collapse) can be
detected unless sophisticated devices and methods are
used. Moreover, cavitation occurs in mostly hidden
places where it is very difficult to find a way in, thus
it’s practically inaccessible unless special technics are
used. As a result, most of the early cavitation studies
have been focusing on its theoretical and numerical
details rather than observational ones. Presently,
various cavitation detection methods have been
developed where a big number of them are mainly
founded on cavitation indirect observation; some of
them are: Indirect observation by determining the
effect of cavitation on the performance of a piece of
equipment, Indirect observation by measuring the

Binama Maxime.Int. Journal of Engineering Research and Applications www.ijera.com
ISSN: 2248-9622, Vol. 6, Issue 5, (Part - 1) May 2016, pp.52-63
www.ijera.com 57|P a g e
effect of cavitation on the distribution of pressure
over the boundary at which cavitation occurs, Indirect
observation by sensing the noise emitted by
cavitation[17],Indirect observation by allowing
cavitation to scatter laser-beam light into a
photocell[15],Cavitation susceptibility
meters[18][19][20], and Direct observation by visual
and photographic means[21][22]. Each of the above
mentioned cavitation detection methods, have their
advantages and their drawbacks, depending on how
effective they can be during cavitation measurement.
II. CAVITATION IN
CENTRIFUGALPUMPS 2.1. Theory
In the suction zone of a centrifugal pump the
rotational effect of the blades is increasingly imposed
on the liquid as it nears the impeller. This gives rise
to the tangential velocity component which together
with the axial velocity component results in
increasing the absolute velocity, and decreasing static
pressure [23][34-35][27],.
The liquid from the impeller eye goes to the
leading edge and then to the pressure or suction side
of the blade where pressure seems to decrease again
on the blade suction side until the blade differential
pressure will be established. If the suction pressure
falls below the fluid vapor pressure, there will be
formation of vapor bubbles which will be eventually
carried within the flow to only explode at
comparatively high pressure zones. This happens at a
very high speed; and is mostly a function of the flow
velocity change, pressure gradient, liquid physical
properties, and the closeness to the pump walls. The
flow complexity in the impeller inter-blade passages
is not only caused by the induced centripetal forces
but also by its three-dimensionality. Tests, [23-29],
have clearly demonstrated the turbulence influence on
cavitation phenomenon through its pressure
pulsations, particularly, at cavitation inception.
Recently, cavitation bubbles have been proved to not
concentrically collapse. There is an indentation which
comes in for bubbles closer to the wall, before the
implosion. For bubbles in the main stream, the
indentation happens at high pressure zones. As this
indentation keeps on growing, there is formation of
the micro-jet which then divides the bubble into two
or more parts. If the bubble was closer or attached to
pump wall, this micro-jet hits the wall surface with
very high velocities enough to remove the material.
The cavitation damage to the wall surface results is a
sponge-like structure. Cavitation doesn’t take place
only in the impeller passages, its damages can also be
found at the diffuser blades and in the volute passage
as well. At the inception stage, bubbles implode at the
impeller passages. At the fully developed stage, the
rest of bubbles which are carried by the flow, go on
to explode at the outer regions like diffuser and volute
passages.
Figure12. Impeller most low pressure zones
Low pressure zones are the most vulnerable
in the pump; for instance, the back face of the blade
inlet is mostly attacked due to its sudden flow velocity
increase resulting in pressure decrease and thus
bubbles formation.
2.2. Cavitation parameters
From different already published literature,
it is commonly known that cavitation occurs when the
fluid pressure drops to its Vapor pressure𝑃𝑉. However,
due to so many factors, this hypothesis is not always
correct. The flow static pressure in a non
dimensionalized form is given by the pressure
coefficient𝐶𝑃.
1
22
P
P PC
U
(5)
Where 𝑃1 and U are the reference static
pressure and tip velocity at the inlet, with 𝑈 = 𝛺𝑅𝑇1.
The value of the pressure coefficient at the zones of
lowest pressure in the flow is given by:
1
2
2
MIN
PMIN
P PC
U
(6)
Where 𝑃𝑀𝐼𝑁 is the flow minimum pressure,
𝐶𝑃𝑀𝐼𝑁 is a negative value depending on the pump
geometry and the Reynolds Number𝑅𝑒 = 2𝛺𝑅𝑇12 𝜌𝑔⁄ .
The value of the static pressure 𝑃1at which cavitation
will occur (𝑃𝑀𝐼𝑁 = 𝑃𝑉) is given by:
CUPP PVCAV min
2
1 2
1
(7)
Now the most commonly used cavitation
parameters is the cavitation number which is given by:
U
PP V
2
1
2
1
(8)
The cavitation coefficient value corresponding to the
first cavitation inception is defined as:
(9)
Combining the above presented equations, it’s
clear that 𝜎𝑖 = −𝐶𝑃𝑀𝐼𝑁. The second parameter which
is generally used is the pump suction specific speed.
To finally come to it, let’s pass through some
specially used terminologies.
U
PP VCAV
i2
1
2
1

Binama Maxime.Int. Journal of Engineering Research and Applications www.ijera.com
ISSN: 2248-9622, Vol. 6, Issue 5, (Part - 1) May 2016, pp.52-63
www.ijera.com 58|P a g e
The pump Net Positive Suction Pressure
(NPSP) is given by 𝑃1𝑇 − 𝑃𝑉 where 𝑃1
𝑇 is the total
pressure at the pump inlet and is given by:
2
11 2
1 PP
T (10)
The pump Net positive Suction Energy (NPSE)
is defined as𝑃1𝑇 − 𝑃𝑉 𝜌⁄ and the pump Net Positive
Suction Head (NPSH) is given as 𝑃1𝑇 − 𝑃𝑉 𝜌𝑔 ⁄ and
finally the suction specific speed S given as: 1
2
3
4
SQ
NPSE
(11)
The third mostly used parameter is the Thoma
cavitation number 𝜎𝑇𝐻 which is given as:
1
2 1
T
V
T TTH
P PP P
(12)
Where𝑃2𝑇 − 𝑃1
𝑇is the total pump pressure rise.
The lastly presented parameter in this literature, is the
blade blockage factor or coefficient, i.e. B. It is a
particularly important parameter in pump flows. It is
defined as:
1
1
2
2u
Bz
rr
(13)
Where 𝑟1, z, and𝛿𝑢 stand for blade inlet radius,
blades number, and the blade thickness respectively
2.3. Types of impeller cavitation
Cavitation in pumps can take different forms
depending mainly on the pump flow rate and the flow
inlet velocity angle at the blade leading edge, which
strongly affects the pressure distribution on the blades
at the inlet [36]. It is worth to note that the here-down
presented pump cavitation classification is arbitrary,
therefore, there may occur some cases which may not
readily fall within this classification’s reach. When
the suction pressure is continually decreased (NPSH
decreased), the first cavitation inception occurs at the
intersection of the blade leading edge and the tip thus
leading to a “tip vortex cavitation” occurrence.
Lowering the cavitation number a bit farther, there is
formation of traveling bubble cavitation at the blades
suction sides. This type is otherwise referred to as
“bubble cavitation”. This type of cavity corresponds
to a low incidence angle of the flow and depending on
the design of the impeller, the minimum of pressure
at the impeller throat [36].
Figure13. Travelling cavitation
Further reduction results in the bubbles
combination which gives rise to the attached
cavitation at the blades suction side. This type is often
referred to as “blade cavitation” in pumps.
Figure14. Blade cavitation on the centrifugal
impeller’s suction side
Finally, it is valuable to create the catch-all
term “backflow cavitation” to refer to the cavitating
bubbles and vortices that occur in the annular region
of backflow upstream of the inlet plane when the
pump is required to operate in a loaded condition
below the design flow rate. To the observer, this can
often represent the most visible form of cavitation.
[37].
Figure15. Lateral view of impeller tip leakage and
backflow
2.4. Cavitation and pump performance
To avoid the cavitation occurrence in the
pump, a pressure reserve compared to the fluid vapor
pressure is required at the impeller suction zone. This
pressure difference between the inlet suction pressure
and the fluid vapor pressure is otherwise called the
Net Positive Suction Head or NPSH, which is
generally measured in meters (m).
(14)
Subscripts, 1 and v stand for suction side and
the vapor phase, respectively. The NPSH has two
aspects; the Net Positive Suction Head Available
(NPSHa) and the Net Positive Suction Head Required
(NPSHr). The later must be smaller than the first.
1 VNPSHg
P P

Binama Maxime.Int. Journal of Engineering Research and Applications www.ijera.com
ISSN: 2248-9622, Vol. 6, Issue 5, (Part - 1) May 2016, pp.52-63
www.ijera.com 59|P a g e
The rotation of the impeller, during the
pump operation creates a vacuum at the eye, sucking
the liquid from the inlet pipe to let it enter the eye.
The NPSHa is then defined as the energy measure
with which the liquid enters the pump from the inlet
pipe. For every flow rate and rotational speed, every
pump must be having a specifically predefined Head
at the pump suction zone to prevent cavitation
occurrence at the pump inlet. This Head measure is
referred to as Net Positive Suction Head Required,
NPSHr. Its empirical formula is as follows:
(15)
Where𝑉𝑅 stands for the radial velocity and
respective values of𝐾𝑎 and𝐾𝑏are 1.0 to 1.2 and 0.1 to
0.3. PearsallTheoretical work, [30], showed how to
get an optimum cavitation pump performance; he
emphasized that the choice of pump speed, correct
size and geometry are the main factors to consider
when it comes to pump cavitation performance
analysis, rather than any other details. He by the way
suggested a new method of calculating the optimum
pump inlet diameter. He also proposed another
NPSHr formula where the blade cavitation coefficient,
had to be taken into account. Both his formulas are
here-down presented.
1
3
1
1
2
1.372
2 1 1
1t
b QD
b
2 2
1 11.042 2
RNPSHr b bg g
V U
(16)
Where σb stands for blade cavitation
coefficient, Dt1, Q, λ, and ω, are the inlet tip diameter,
the flow rate, the hub to tip ration, and the rotational
speed; respectively. The Pearsall’s Optimum Inlet
Diameter formula shows that large eye diameters are
required for low suction pressure pumps as the inlet
diameter increase may be influenced by the increase
of the blade cavitation coefficient.
In the past years, different methods have
been used to clearly define centrifugal pump
cavitation mechanism and its limits. Two technics
have been under usage until now:1)the pump capacity
upper limit for given NPSH and speed, and 2)the
NPSH lower limit for given pump capacity and speed.
The second statement is the one widely adopted
whereby cavitation occurrence is mostly diagnosed
through the drop in head and pump efficiency.
Because of the difficulty of determining the
exact condition when this change takes place, it is
often the practice to define required NPSH as that
value where a drop of 3 percent in head will have
taken place; NPSHR at given capacity and speed is
NPSH3 which is that NPSH at which the head will
have been reduced by 3 percent [31].Cavitation in
centrifugal pumps is mostly detected through its
detrimental effects such as pump hydraulic
performance drop and pump physical structure
damages. Figure 14.AShows the gradual increase in
pump capacity at constant NPSH and Speed, and the
usual subsequent Head curve, where at a certain pump
capacity value, the head curve deviates from normal
and drops straight downwards, marking the
performance breakdown starting point. Any farther
increase in pump capacity may result in a fully
developed cavitation leading to pump walls damages
and other effects.
Figure14. Cavitation effect on pump H-Q curve (A)
and H-NPSH curve (B)
Also, as shown in the Figure 15, from
different experimental observations [24, 25, 32],
cavitation inception was shown to start at point A.
The figure shows a continuously decreasing NPSH at
constant flow and speed where from point A; the
cavitation grows big until point B where the
performance starts being affected, and proceeds to C
where there is a complete performance breakdown.
This critical performance breakdown is
generally considered as a point where there will be a
3% head drop(Fig.14.B), which is not always correct
as the exact values depend very much on the shape of
the characteristic curve, which can also be influenced
by experimental errors.[33,30]. Moreover, the
position of the point by which the pump performance
will start being affected is of a questionable truth.
However for safety reasons, point B and points in its
vicinity have been considered, which actually
marches the cavitation noise characteristic curve as
presented in figure 15. This curve shows a sudden
2 2
1 1
2 2
R
a bNPSHr
g g
V UK K
(A)
(B)
Binama Maxime.Int. Journal of Engineering Research and Applications www.ijera.com
ISSN: 2248-9622, Vol. 6, Issue 5, (Part - 1) May 2016, pp.52-63
www.ijera.com 60|P a g e
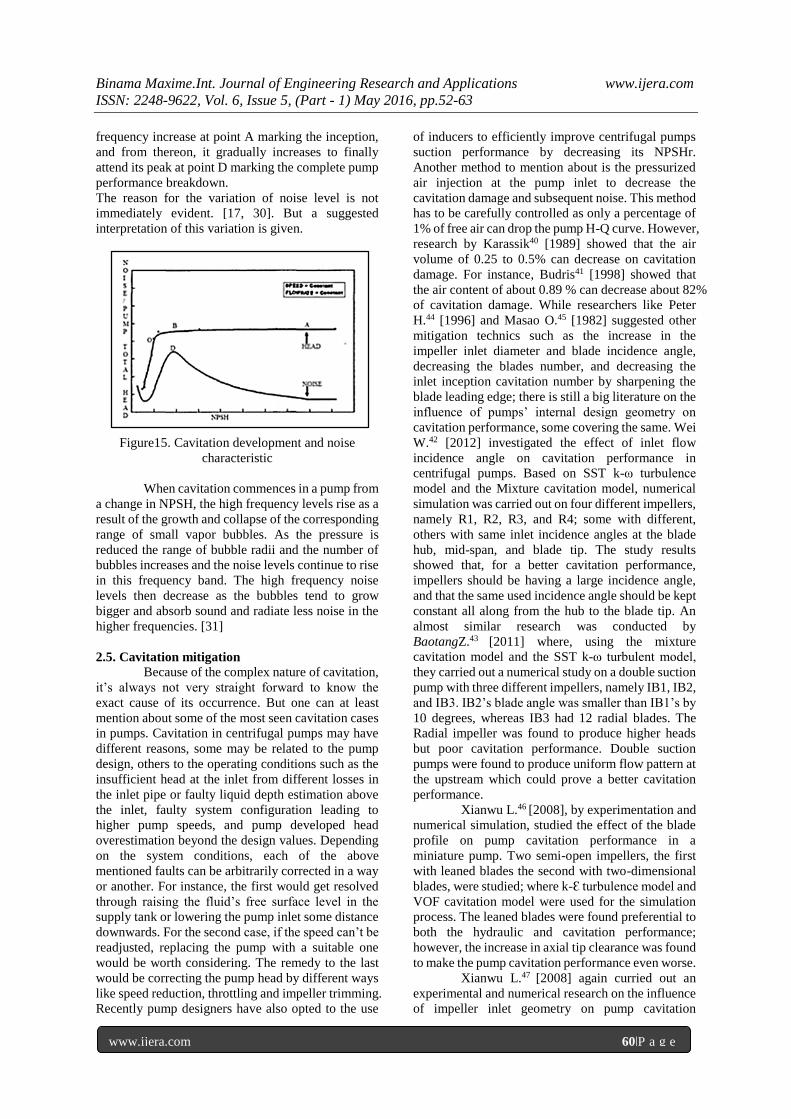
frequency increase at point A marking the inception,
and from thereon, it gradually increases to finally
attend its peak at point D marking the complete pump
performance breakdown.
The reason for the variation of noise level is not
immediately evident. [17, 30]. But a suggested
interpretation of this variation is given.
Figure15. Cavitation development and noise
characteristic
When cavitation commences in a pump from
a change in NPSH, the high frequency levels rise as a
result of the growth and collapse of the corresponding
range of small vapor bubbles. As the pressure is
reduced the range of bubble radii and the number of
bubbles increases and the noise levels continue to rise
in this frequency band. The high frequency noise
levels then decrease as the bubbles tend to grow
bigger and absorb sound and radiate less noise in the
higher frequencies. [31]
2.5. Cavitation mitigation
Because of the complex nature of cavitation,
it’s always not very straight forward to know the
exact cause of its occurrence. But one can at least
mention about some of the most seen cavitation cases
in pumps. Cavitation in centrifugal pumps may have
different reasons, some may be related to the pump
design, others to the operating conditions such as the
insufficient head at the inlet from different losses in
the inlet pipe or faulty liquid depth estimation above
the inlet, faulty system configuration leading to
higher pump speeds, and pump developed head
overestimation beyond the design values. Depending
on the system conditions, each of the above
mentioned faults can be arbitrarily corrected in a way
or another. For instance, the first would get resolved
through raising the fluid’s free surface level in the
supply tank or lowering the pump inlet some distance
downwards. For the second case, if the speed can’t be
readjusted, replacing the pump with a suitable one
would be worth considering. The remedy to the last
would be correcting the pump head by different ways
like speed reduction, throttling and impeller trimming.
Recently pump designers have also opted to the use
of inducers to efficiently improve centrifugal pumps
suction performance by decreasing its NPSHr.
Another method to mention about is the pressurized
air injection at the pump inlet to decrease the
cavitation damage and subsequent noise. This method
has to be carefully controlled as only a percentage of
1% of free air can drop the pump H-Q curve. However,
research by Karassik40 [1989] showed that the air
volume of 0.25 to 0.5% can decrease on cavitation
damage. For instance, Budris41 [1998] showed that
the air content of about 0.89 % can decrease about 82%
of cavitation damage. While researchers like Peter
H.44 [1996] and Masao O.45 [1982] suggested other
mitigation technics such as the increase in the
impeller inlet diameter and blade incidence angle,
decreasing the blades number, and decreasing the
inlet inception cavitation number by sharpening the
blade leading edge; there is still a big literature on the
influence of pumps’ internal design geometry on
cavitation performance, some covering the same. Wei
W.42 [2012] investigated the effect of inlet flow
incidence angle on cavitation performance in
centrifugal pumps. Based on SST k-ω turbulence
model and the Mixture cavitation model, numerical
simulation was carried out on four different impellers,
namely R1, R2, R3, and R4; some with different,
others with same inlet incidence angles at the blade
hub, mid-span, and blade tip. The study results
showed that, for a better cavitation performance,
impellers should be having a large incidence angle,
and that the same used incidence angle should be kept
constant all along from the hub to the blade tip. An
almost similar research was conducted by
BaotangZ.43 [2011] where, using the mixture
cavitation model and the SST k-ω turbulent model,
they carried out a numerical study on a double suction
pump with three different impellers, namely IB1, IB2,
and IB3. IB2’s blade angle was smaller than IB1’s by
10 degrees, whereas IB3 had 12 radial blades. The
Radial impeller was found to produce higher heads
but poor cavitation performance. Double suction
pumps were found to produce uniform flow pattern at
the upstream which could prove a better cavitation
performance.
Xianwu L.46 [2008], by experimentation and
numerical simulation, studied the effect of the blade
profile on pump cavitation performance in a
miniature pump. Two semi-open impellers, the first
with leaned blades the second with two-dimensional
blades, were studied; where k-Ɛ turbulence model and
VOF cavitation model were used for the simulation
process. The leaned blades were found preferential to
both the hydraulic and cavitation performance;
however, the increase in axial tip clearance was found
to make the pump cavitation performance even worse.
Xianwu L.47 [2008] again curried out an
experimental and numerical research on the influence
of impeller inlet geometry on pump cavitation
Binama Maxime.Int. Journal of Engineering Research and Applications www.ijera.com
ISSN: 2248-9622, Vol. 6, Issue 5, (Part - 1) May 2016, pp.52-63
www.ijera.com 61|P a g e
performance. Five different impellers were studied
where the blade inlet angle and blade leading edge
were being gradually extended. The numerical
simulation was conducted based on RNG k-Ɛ
turbulence model and the VOF cavitation model. The
pump inlet geometry proved to be influential when it
comes to centrifugal pump performance, where larger
blade leading edge and blade inlet angle positively
affected the pump hydraulic performance and
cavitation performance respectively.
III. CONCLUSION Cavitation phenomenon is globally
understood like formation of vapor bubbles in the
fluid flow from a pressure drop below its vapor
pressure. Due to its speedy and complex nature,
cavitation detection requires sophisticated methods;
otherwise it can only be noticed by its effects on the
equipment like unusual noise, vibrations and material
damage. In fluid machinery, based on the system
physical and working conditions, Cavitation can
appear under different forms, which after getting to
its full development, present almost similar effects on
the system characteristics. In centrifugal pumps,
cavitation performance mostly depends on the
impeller geometrical design such that, any geometry
modification can result in a totally different
performance. Therefore, the design process requires a
more careful control, such that, through experimental
and numerical methods, the centrifugal pump’s
performance can be well predicted where cavitation
can be decreased to acceptable levels if not
completely eliminated.
REFERENCES [1] Fox, Robert W., Alan T. McDonald, and
Philip J.Pritchard. Introduction to fluid
mechanics. Vol. 7, (New York: John Wiley
& Sons, 1985)
[2] http://whatis.techtarget.com/definition/com
putational-fluid-dynamics-CFD
[3] NGH, Vijaypratap R., M. J. Zinzuvadia, and
Saurin M. Sheth."Parametric Study and
Design Optimization of Centrifugal Pump
Impeller-A Review." Int. Journal of
Engineering Research and
Applications (2014): 2248-9622.
[4] Chakraborty, Sujoy, K. M. Pandey, and B.
Roy."Numerical Analysis on Effects of
Blade Number Variations on Performance of
Centrifugal Pumps with Various Rotational
Speeds." International Journal of Current
Engineering and Technology 2, no. 1
(2012): 143-152.
[5] Pandey, K. M., A. P. Singh, and Sujoy
Chakraborty. "Numerical studies on effects
of blade number variations on performance
of centrifugal pumps AT 2500 rpm." Journal
of Environmental Research And
Development 6, no. 3A (2012).
[6] Liu, Houlin, Wang Yong, Yuan Shouqi, Tan
Minggao, and Wang Kai."Effects of Blade
Number on Characteristics of Centrifugal
Pumps." Chinese Journal of Mechanical
Engineering 23 (2010): 1-5.
[7] Al-Obaidi, Ahmed, Suman Pradhan,
Taimoor Asim, Rakesh Mishra, and Karina
Zala. Numerical studies of the velocity
distribution within the volute of a centrifugal
pump.(2014).
[8] Patel, M. G., and A. V. Doshi."Effect of
Impeller Blade Exit Angle on the
Performance of Centrifugal Pump." Int J.
Emerging Technology and Advanced
Engineering 3, no. 1 (2013): 91-99.
[9] Eisenberg, Phillip. On the mechanism and
prevention of cavitation. Navy Department,
David W. Taylor Model Basin, 1950.
[10] Zhang, Qing, Hai Zhou, Qingpeng Gao, and
Zhixiang Cui. "Analysis of effects of
impeller inlet width on the performance of
centrifugal pump." Journal of Chemical &
Pharmaceutical Research 6, no. 5 (2014).
[11] Luo, Xianwu, Yao Zhang, Junqi Peng,
Hongyuan Xu, and Weiping Yu."Impeller
inlet geometry effect on performance
improvement for centrifugal pumps."Journal
of Mechanical Science and Technology 22,
no. 10 (2008): 1971-1976.
[12] Michel, J.M., introduction to cavitation and
supercavitation, (Centre national de la
recherché scientifique grenoble (france) lab
de ecoulements geophysiques/industriels,
2001)
[13] Franc, Jean-Pierre. Physics and control of
cavitation.(Grenoble univ. (France), 2006)
[14] [14]http://www.wisegeek.org/what-
isnucleation.htm. [Cited 2015 February]
[15] Knapp, Robert Talbot, James W. Daily, and
Frederick G. Hammitt, Cavitation, (1979).
[16] Lazarkiewicz, Stephen, and A.T Troslanski,
Impeller pumps, (1965).
[17] Deeprose, W. M., N. W. King, P. J.
McNulty, and Ian Stewart Pearsall,
Cavitation noise, flow noise and erosion,
Cavitation Conference, Institution
Mechanical Engineers, pp. 373-381. 1974
[18] Oldenziel, D. M. "A new instrument in
cavitation research: the cavitation
susceptibility meter." Journal of Fluids
Engineering 104, no. 2 (1982): 136-141.
[19] D’Agostino, L., and A. J. Acosta. "A
cavitation susceptibility meter with optical
cavitation monitoring—Part One: Design
concepts." Journal of fluids
engineering 113, no. 2 (1991): 261-269.

Binama Maxime.Int. Journal of Engineering Research and Applications www.ijera.com
ISSN: 2248-9622, Vol. 6, Issue 5, (Part - 1) May 2016, pp.52-63
www.ijera.com 62|P a g e
[20] D’Agostino, L., and A. J. Acosta. "A
cavitation susceptibility meter with optical
cavitation monitoring—part two:
experimental apparatus and results." Journal
of fluids engineering 113, no. 2 (1991): 270-
277.
[21] Okamura, T., and H. Miyashiro., Cavitation
in centrifugal pumps operating at low
capacities, ASME Symp. on Polyphase Flow
in Turbomachinery, vol. 243, p. 252. 1978.
[22] Minami, Shungo, and Kyoji Kawaguchi.
Experimental Study on Cavitation in
Centrifugal Pump Impellers." Bulletin of
JSME 3, no. 9 (1960): 19-29.
[23] SI HI PUMPS LTD., Basic principles for the
design of centrifugal of pump
installations(SIHI Group, West Germany,
1980)
[24] Okamura, T., and H. Miyashiro., Cavitation
in centrifugal pumps operating at low
capacities, ASME Symp.onPolyphase Flow
in Turbomachinery. Vol. 243.P. 252. 1978.
[25] Minami, Shungo, and Kyoji Kawaguchi.
Experimental Study on Cavitation in
Centrifugal Pump Impellers." Bulletin of
JSME 3, no. 9 (1960): 19-29.
[26] Franz, R., A. J. Acosta, C. E. Brennen, and
T. K. Caughey. "The rotordynamic forces on
a centrifugal pump impeller in the presence
of cavitation." Journal of Fluids
Engineering 112, no. 3 (1990): 264-271.
[27] Kenkermath, D., and A. Thiruvengadam.,
Analysis and characterization of particles
produced by cavitation erosion. Proceedings
of Cavitation (1974): 285-295.
[28] Mansell, Cecil John., Impeller cavitation
damage on a pump operating below its rated
discharge. Proc. of Conf. on Cavitation, Inst.
of Mech. Eng. Vol. 185. 1974.
[29] SPP GROUP LTD. Cavitation and NPSH
data sheets, SPP Group Ltd, Data sheets
0950-0953.
[30] Pearsall, Ian. Stewart, Design of pump
impellers for optimum cavitation
performance, Proceedings of the Institution
of Mechanical Engineers 187.1 (1973): 667-
678.
[31] Poullikkas, Andreas, Two phase flow and
cavitation in centrifugal pump: a theoretical
and experimental investigation, PhD diss., ©
Andreas Poullikkas, 1992.
[32] Kasai, Taijirõ, and Yasuo Takamatsu, Study
of Cavitation Aspect and Suction
Performance of Centrifugal Pumps(Kyushu
University, Faculty of Engineering, 1965)
[33] M. Sutton. Comparison of the commonly
used parameters involving pump
NPSH(BHRA, TN 831, Nov 1964)
[34] Turton, Robert Keith. Principles of turbo
machinery(Springer Science & Business
Media, 2012)
[35] Stepanoff, A. J., Centrifugal and axial flow
pumps: theory, design and application (John
Wiley, 1957)
[36] Avellan, Francois. "Introduction to
cavitation in hydraulic machinery." The 6th
International Conference on Hydraulic
Machinery and Hydrodynamics, Timisoara,
Romania. 2004.
[37] Brennen, Christopher E. Hydrodynamics of
pumps. Cambridge University Press, 2011.
[38] Lauterborn, W., and H. Bolle., Experimental
investigations of cavitation-bubble collapse
in the neighborhood of a solid boundary,
Journal of Fluid Mechanics72, no. 02
(1975): 391-399.
[39] Plesset, Milton S., and Richard B.
Chapman., Collapse of an initially spherical
vapor cavity in the neighborhood of a solid
boundary, Journal of Fluid Mechanics 47,
no. 02 (1971): 283-290.
[40] Karassik, Igor J., Centrifugal Pump Clinic,
(Marcel Dekker, Inc., New York, NY, 1989)
[41] Budris, Allan R., and Mayleben, Philip A.,
Effects of Entrained Air, NPSH Margin, and
Suction Piping on Cavitation in Centrifugal
Pumps,Proceedings of the 15th International
Pump Users Symposium, March 1998.
[42] Wei, W., X. W. Luo, B. Ji, B. T. Zhuang, and
H. Y. Xu.Cavitating flow investigation
inside centrifugal impellers for a condensate
pump,IOP Conference Series: Earth and
Environmental Science, vol. 15, no. 3, p.
032061. IOP Publishing, 2012.
[43] Zhuang, Baotang, Xianwu Luo, Lei Zhu,
Xin Wang, and Hongyuan Xu. Cavitation in
a shaft-less double suction centrifugal
miniature pump., International Journal of
Fluid Machinery and Systems 4, no. 1
(2011): 191-198.
[44] Hergt, Peter, Alexander Nicklas, Gerhard
Mollenkopf, and S. Brodersen. "The suction
performance of centrifugal pumps
possibilities and limits of
improvements, Proceedings of the
international pump users symposium, pp.
13-26. Texas A&M University system,
1996.
[45] Oshima, Masao, Haneda Plant, and Ota-ku
Haneda., Inlet Flow and Aspects of
Cavitation in Centrifugal Impellers,
Proceedings of the Eleventh
Turbomachinery Symposium,
Turbomachinery Laboratories, Department
of Mechanical Engineering, Texas A&M

Binama Maxime.Int. Journal of Engineering Research and Applications www.ijera.com
ISSN: 2248-9622, Vol. 6, Issue 5, (Part - 1) May 2016, pp.52-63
www.ijera.com 63|P a g e
University, College Station, Texas, p. 11.
1982.
[46] Luo, Xianwu, Shuhong Liu, Yao Zhang, and
Hongyuan Xu., Cavitation in semi-open
centrifugal impellers for a miniature
pump, Frontiers of Energy and Power
Engineering in China 2, no. 1 (2008): 31-35.
[47] Luo, Xianwu, Yao Zhang, Junqi Peng,
Hongyuan Xu, and Weiping Yu., Impeller
inlet geometry effect on performance
improvement for centrifugal pumps, Journal
of Mechanical Science and Technology 22,
no. 10 (2008): 1971-1976.
Recommended