Catalytic Decomposition of Hydrogen Peroxide by Ferric Ion in Dilute Sulfuric Acid Solutions
L.E. EARY
Hydrogen peroxide decomposition in acidic solutions is catalyzed by the free ferric ion, Fe >. The following rate law for this reaction is determined by the initial rate method in solutions similar to those used for acidic in situ uranium leaching:
(mH,O,) (mFe 3-) -(dmH2o:/dt)25 oc = k
(mu-)
where k = 4.3 • 10 -3 s -1 at 25 ~ From 25 ~ to 50 ~ the activation energy is 85.6 kJ/mol. The decomposition of hydrogen peroxide proceeds by a particular redox reaction sequence that depends on the ratio of the concentrations of hydrogen peroxide to free ferric ion. The rate law determined here is consistent with the form derived from the redox sequence for the case where the ratio of hydrogen peroxide to free ferric ion concentration is greater than 1.0. The magnitude of the rate constant indicates that the decomposition of hydrogen peroxide may cause rapid loss of this oxidant in leaching solutions containing ferric ion.
I. INTRODUCTION
H Y D R O G E N peroxide has been used to provide the oxidizing capacity of lixiviants for the in situ leaching of sandstone-type uranium deposits. In experimental studies that used solutions similar to those expected for in situ leaching conditions, the rate of uraninite (UO2-U3Os) dis- solution has been found to be more rapid in both basic ~ and acidic: solutions containing hydrogen peroxide than in solu- tions containing other oxidants such as dissolved oxygen, 3 ferric ion, 4 and sodium perchlorate, s Any advantages in ura- ninite dissolution rate, however, are offset by the fact that during in situ leaching, a considerable portion of the added H202 is likely to be consumed by the oxidation of iron sulfides and organic material that are commonly present in sandstone-type uranium deposits.67 Also, experimental and field observations indicate that H202 rapidly decomposes soon after injection into uranium ores, s-l~ thereby quickly reducing the oxidizing capacity of the lixiviant.
Hydrogen peroxide decomposes according to the over- all reaction:
2H202(1) = 2H20(1) + O2(g) [1]
where (1) and (g) refer to the liquid and gaseous molecular species, respectively. The rate of this reaction is catalyzed by metal ions 11 such as Fe 3+, Cu >, and Co 3+. Of these, the ferric ion is undoubtedly the most abundant catalytically active metal ion present during the acidic leaching of ura- nium ores. Concentrations up to 100 ppm total dissolved iron are reported by Tweeton, et al. p- from an in situ ura- nium leaching operation that used solutions containing dilute sulfuric acid, pH = 1.5 to 2.0, and hydrogen per- oxide. However, H202 decomposition may take place in slightly acidic to strongly basic solutions, as well. It has been shown by Eligwe, et a l ) 3 that the addition of ferrous
L.E. EARY, formerly a Graduate Student with the Department of Geo- chemastry and Mineralogy, Pennsylvania State University, is now Research Scientist with Battelle Pacific Northwest Laboratory, Rlchland, WA 99352.
Manuscript submitted March 20, 1984.
ions to H202 solutions with pH between 4.0 and 6.0 caused a significant decrease in the rate of uranium extraction from a New Mexico ore. As suggested by Eligwe, et al., J3 the observed rate decrease was probably a result of the rapid consumption of the H,O2 in reactions with ferrous ions to form ferric species. Although the aqueous ferric species are limited to low concentrations above a pH of about 3.5 by the low solubility of ferric hydroxide, H20: decomposition has also been shown to be promoted by freshly precipitated ferric hydroxides ~ in solutions with pH values between 4.3 and 11.3.
In acidic solutions, dissolved iron is produced in situ by the oxidation of iron sulfides, as in the oxidation of pyrite by H202:
2FeS2 + 15H20: = 2Fe~" + 4(SO4-),
+ 14820(1) + 2H + , [2]
where the subscript t refers to the total ferric or sulfate species, respectively. Ferric ions produced by such reactions will catalyze the decomposition reaction of H:O> A series of experiments was conducted to determine the rate of this decomposition reaction and the rate dependencies on the concentrations of ferric ion, hydrogen peroxide, and hydro- gen ion in dilute sulfuric acid solutions with pH between 1.38 and 2.20.
II. EXPERIMENTS
The rate experiments were conducted in 800 ml open glass kettles that were immersed in a constant temperature bath. Between 25 ~ and 50 ~ the temperature in the bath could be controlled to -+ 1 ~ Magnetic stirrers and Teflon stir bars were used to keep the solutions well mixed. Rea- gent grade Fez(SOa)3 �9 nH20 was used to provide the ferric species in the run solutions. The pH was adjusted initially by the dropwise addition of sulfuric acid. Distilled, deionized water was used in all experiments.
The pH was measured with a standardized combination- reference electrode. Hydrogen peroxide concentrations
METALLURGICAL TRANSACTIONS B VOLUME 16B JUNE 1985 181
were determined colorimetrica]ly by the intensity of the yellow color produced upon the addition of H202 to a ti- tanium sulfate reagent.t4 Concentrations of ferrous, ferric, and total dissolved iron were also determined with col- orimetric methods. Total iron was determined from the color density of the ferrous-orthophenanthroline complex after reducing all dissolved iron to the ferrous state with hydroxy- lamine hydrochloride. ~ The concentrations of only the fer- rous ions in the presence of ferric were determined by the method of Tamura, et al . ~6 In this method, the reducing agent was not added, Instead, fluoride, as ammonium fluo- ride, was added to complex the ferric ions. With the ferric ions masked by the fluoride, the concentrations of only the ferrous ions were determined with the colored ferrous- or thophenanthrol ine complex . After the determinat ions of ferrous and total iron, ferric was calculated from the difference.
Rate experiments were started by adding a measured quantity of a standardized 30 pct H202 reagent to ferric sulfate solutions of known pH. The rate of H 2 0 2 decom- position was measured by withdrawing 1.0 ml samples from the kettles at known time intervals to determine the remain- ing HzO2 concentration. Samples were added directly to prepared solutions of the titanium sulfate reagent to reduce the time between extraction and the determination of the H202 concentration. The color of the H202-titanium sul- fate complex was found to be stable for up to one hour in solutions containing ferric ions, but H202 determinations were completed within 5 minutes after sample extraction to minimize the effects of any continued decomposition. Ferrous determinations were also done immediately after sample withdrawal. However, ferrous concentrations were always below the detection limit of about 0.1 ppm. Total dissolved iron concentrations were determined at a Inter time. Most of the rate experiments lasted from 2 to 14 hours, but a few were extended to longer times to observe devia- tions from the initial rates of H202 decomposition.
The concentration dependencies or reaction orders of the rate of H202 decomposit ion were determined by the ini t ial
rate method.~6 According to this method, the concentrations of each of the reactants, HzO2, ferric ion, and hydrogen ion were varied in turn while the other two concentrations re- mained effectively constant. Plots of the logarithm of the decomposition rate v s the logarithm of the concentration of the reactant that was varied were used to determine the rate dependence on that particular reactant.
In the dilute sulfuric acid solutions used in the experi- ments, ferric ion was present both as the uncomplexed free ion and as ferric sulfate and hydroxide complexes. The effects of ferric speciation on the rate of H202 decom- position were not examined, but previous studies H'18 have suggested that it is only the free ferric ion, Fe 3+, that is the active catalytic agent promoting H202 breakdown. Con- sequently, the rate dependencies are given here in terms of the concentrations of free ferric ion and hydrogen ion. In order to calculate the distributions of the free ions and aque- ous complexes for this system, a version of the computer code of Cathles and Breen ~9 was used, Activity coefficients were calculated by this code with the extended Debye- Huckel equation. An example of the distribution of the ferric species at pH less than 3.5 is shown in Figure 1. The con- centration units used are in terms of molality: i . e . , mFe 3+ refers to the molality of the free ferric ion. The reactions and equilibrium constants used to construct this diagram are given in Table I.
The decomposi t ion rate experiments were conducted over a range of solution compositions: 1.8 x 10 . 3 tO 1.7 X 10-: m H 2 0 2 . 3 6 x 10 - ; to 1,3 • 10 -2 mFe~-. 8.4 x 10 . 3
g
la.
| i i i i i
t - . Fe 3" , l ""./ IFeSO 4
~ I �9 \ / ',, , i ' . . -.
),' ",, o X 7( "",, '* / \ .,' ", _. .~+"
/ \ / ",, F~OH. L.-- / \,'" '-, e(SO, L
o / \ -, . ,z_..~:- -=. / ---~-._~ N , , \ _ . D . . , , ~ " ' - . . . . . - ". . . . . . ',,,'-
~ . -"F,(OH); , , , ~
0.0 I.O 2.0 3.0 pH
Fig. 1--Distribution of the femc species for the Fe~--SO.]--H:O system at 25 ~ w~th 10 -" 7~ m Fe~- and tv,,o concentratmns of sulfate The solid and dashed lines correspond to total sulfate concentratmns of 10 138 and 10-2 '~ m, respectlvel~
Table I. Reactions, Equilibrium Constants, and References for the Fe,3+-SO]--H20 System. In Column 3, ~ Is an Adjustable Parameter Corresponding to the Size of the Ion
That Is Required in the Extended Debye-Huckel Equation for Calculating Activity Coefficients.
Reaction log K (25 ~ d X 10 l~ (Angstroms) Reference
H + + SO]- = HSO2 Fe 3+ + SO] = FeSO2
Fe 3t- 4- 2804 = Fe(SO4) 2 Fe 3+ + HSO4 = FeHSO] + Fe 3+ + H20 = FeOH 2+ + H + Fe 3+ + 2H20 = Fe(OH) + + 2H + 2Fe 3. + 2 H 2 0 = Fez(OH) 4+ + 2}t +
1.99 9 (H+) ~ Smith and Martell 2~ 4.04 9 (Fe3-) a Smith and Martell 2~
5 (FeSO2)" 5,38 7 (Fe(SO,)i) r Wagman, et al, 2~
0.6 7 (FeHSOj+) c Sapieszko, et a l ) 2
-2 .19 5 (FeOH:*) ~ Smith and Martell 2~ -5 .67 5.4 (Fe(OH)~) ~ Smith and Martell 2~ -2 .95 11 (Fe:(OH)~+) ~ Smith and Martell 2~
~Truesdel[ and Jones -~ bStumm and Morgan 2~ Cestlmated
182--VOLUME 16B, JUNE 1985 METALLL RGICAL TRANSACTIONS B
to 5.0 x 10 -2 m(SO ] ),, and pH = 1.38 to 2.20. The con- centrations of the free ferric and hydrogen ions were calcu- lated by the iron distribution program for each experiment. For the above ranges of solution composition, the concen- trations of free ferric ion were generally equal to about 5 pct of the total ferric concentration. Hydrogen ion concentra- tions were close to values that would be approximated from the pH of the solutions.
III. RESULTS A N D D I S C U S S I O N
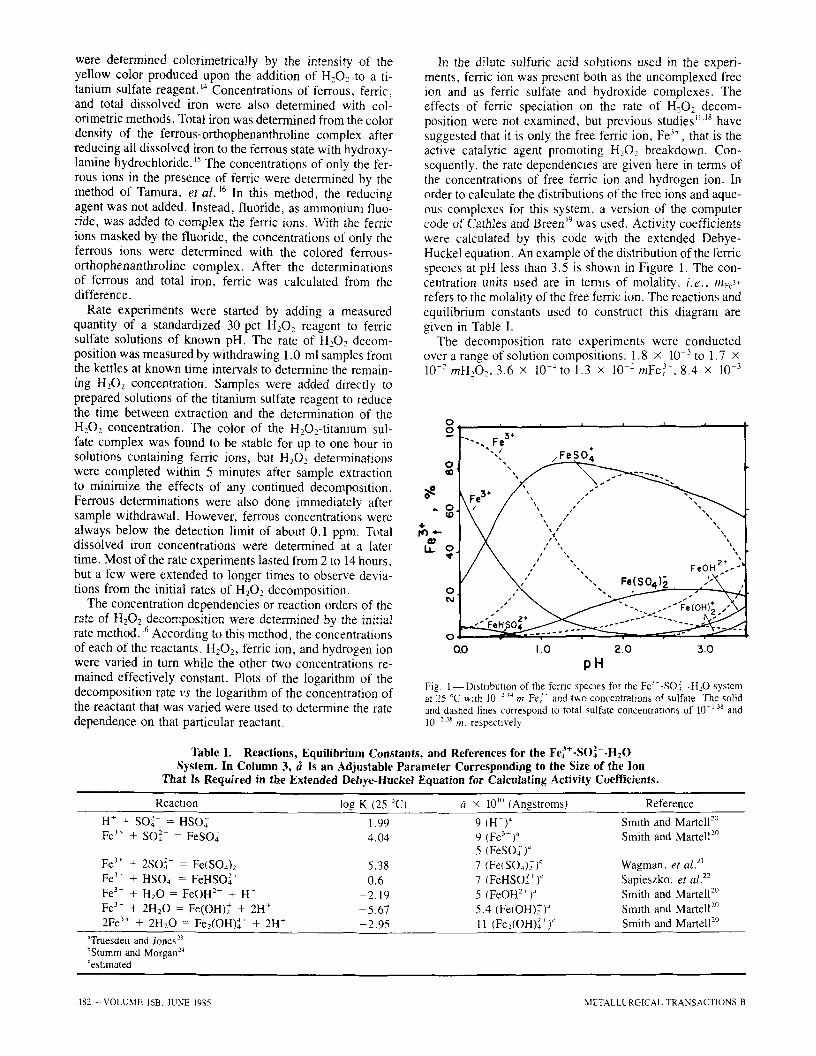
In general, the rates of H202 decomposition were ob- served to be fairly rapid. Typical results of the H202 concen- tration change as a function of time are shown in Figure 2. The measured change in H202 concentration was a linear
O
~o "- O • C~
Fig
I I I L I l I I I I
i i ~ 0 0 4
0 0.0013
0 -- 00.0030
O
~176 S 10 l's 20 25 ao
T I M E , H O U R S 2 - - T y p i c a l experimental results showing the decrease in H:O2 con-
centrat lon with time for three molal concentratmns of Fe 3~ at pH = I 8 and 25 ~
function of time for an initial period, before the decom- position rate slowed significantly. Initial rates were deter- mined from the slopes of plots of H202 concentration v s
time for the initial period when the linear relationship was clearly observed. Slopes were calculated by linear re- gression of this rate data. Depending on the reactant concen- trations, the initial period of linear change in H202 lasted from 2 to about 12 hours before deviations to slower decom- position rates were obvious.
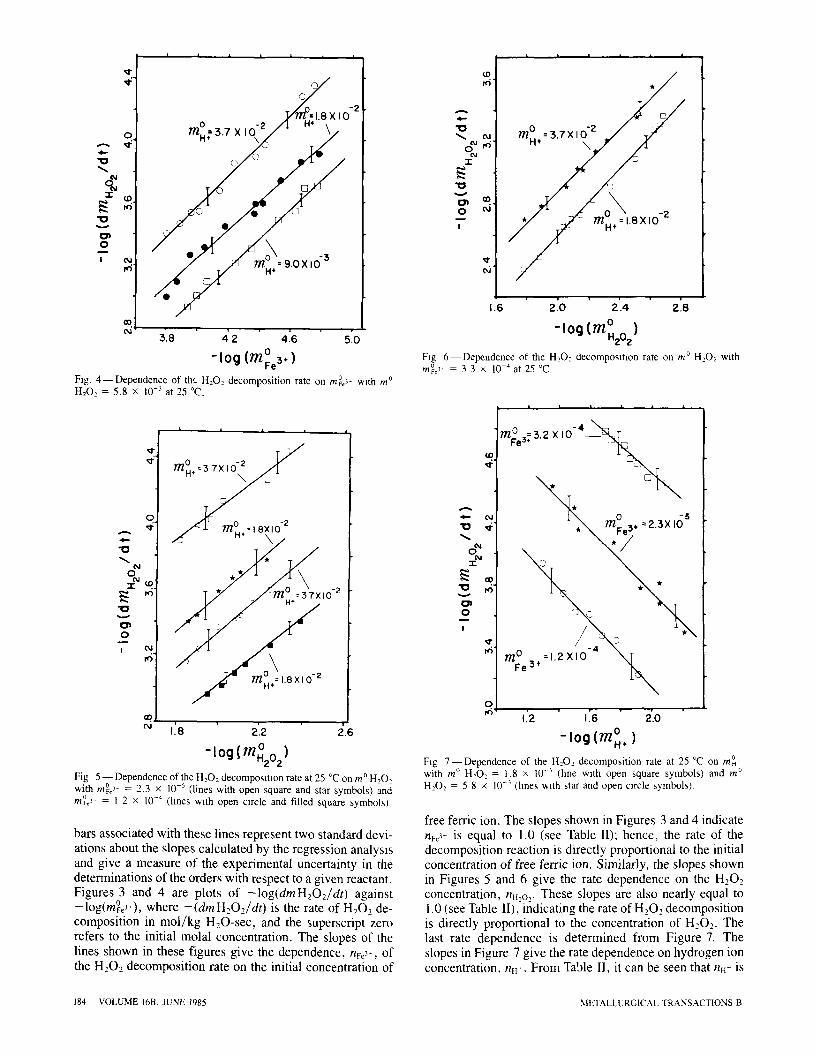
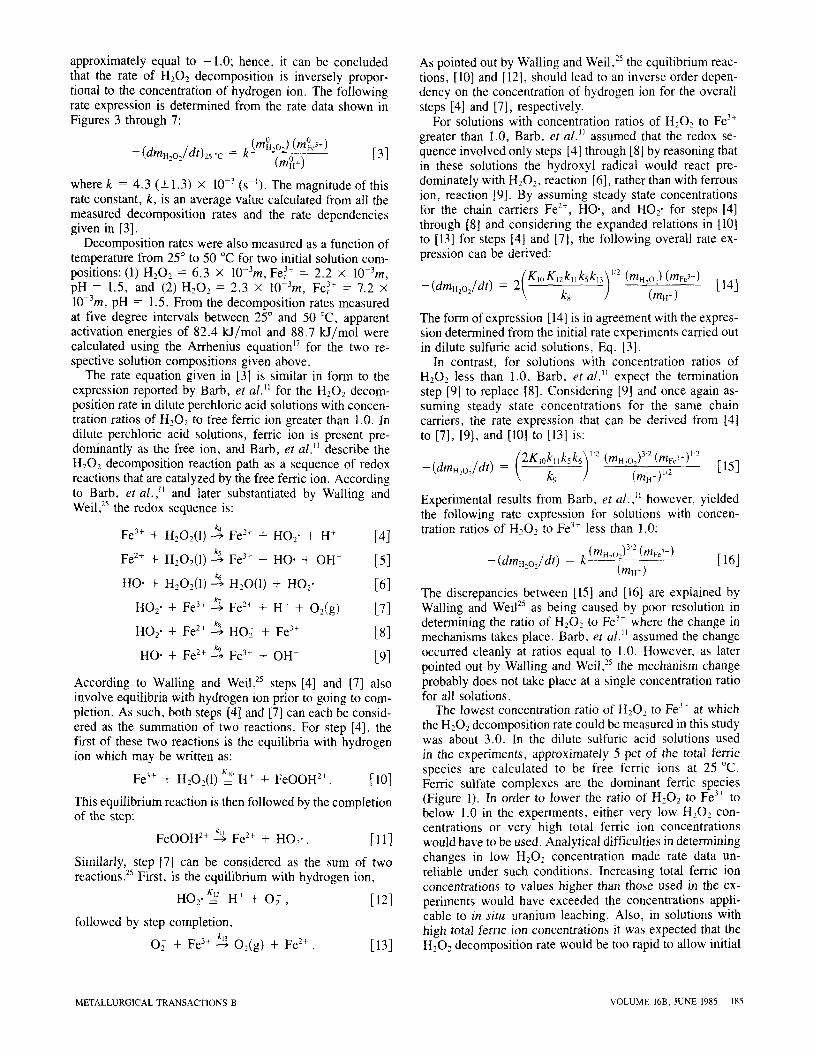
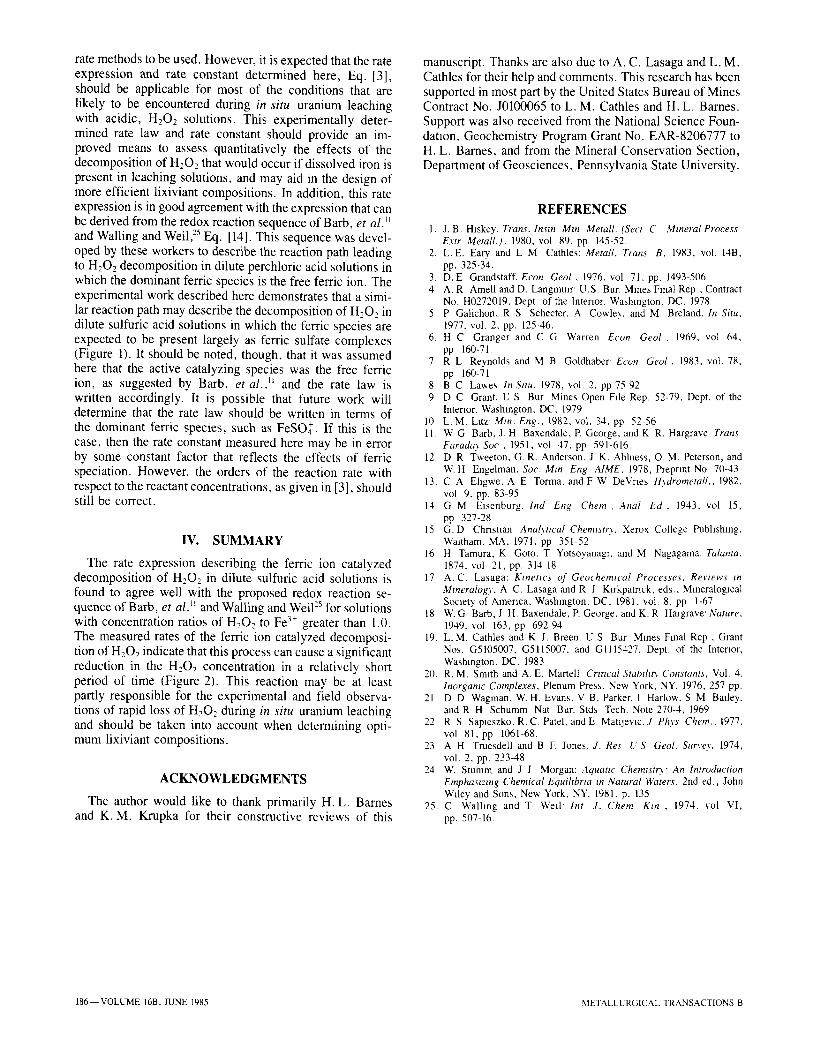
The initial rates as a function of each of the reactant concentrations were used to determine the form of the rate law describing H202 decomposition. The log-log plots from which the rate dependencies on reactant concentrations were determined are shown in Figures 3 through 7. A com- plete summary of these rate dependencies and the reactant concentrations in the experimental solutions is given in Table II. The slopes and intercepts of the lines shown in Figures 3 through 7 were calculated by linear regression of the logarithm of the H202 decomposition rate as a function of the logarithm of the reactant concentrations. The error
O
A
tO o ~ Od - r
"O
On O
t%l i r6
m~
~ 5.7 X IO -2
3.0 3'.4 318
-log(m~e3,) Fig. 3 - - D e p e n d e n c e of the H , O - d e c o m p o s m o n rate on m~e3- with m ~ HzO2 = I 8 x 1 0 - 3 a t 2 5 ~
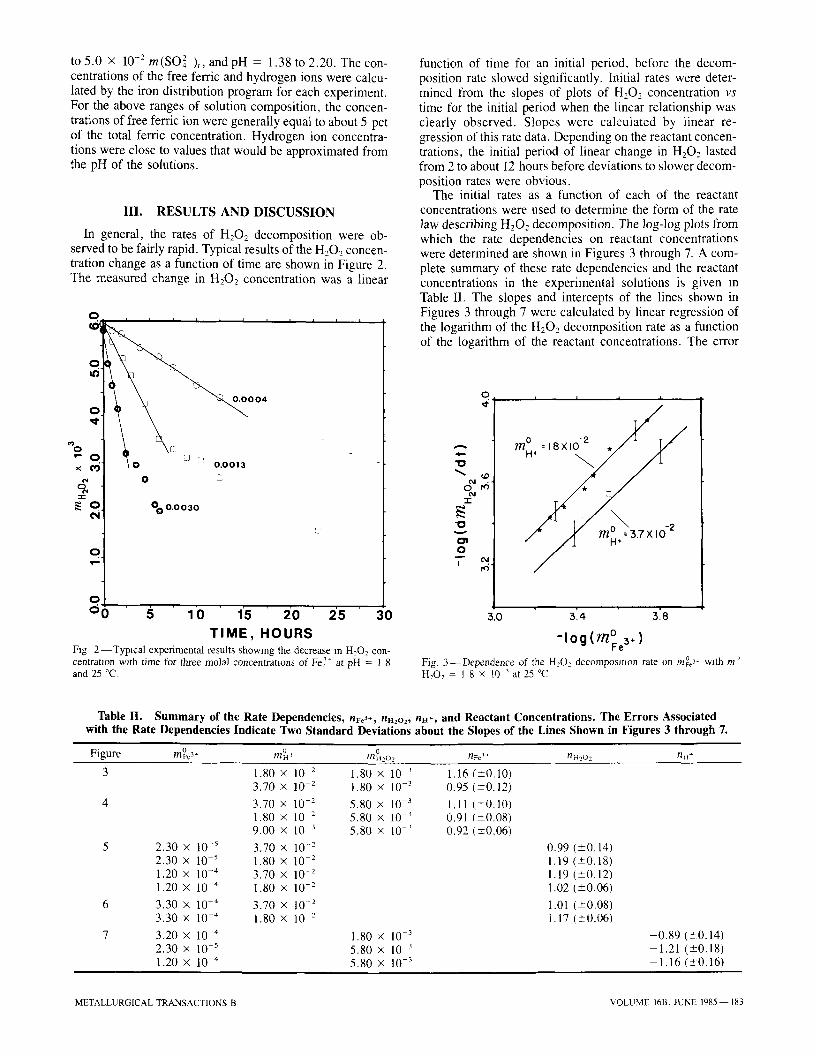
Table II. Summary of the Rate Dependencies, rife3+, nnzoz, nn*, and Reactant Concentrations. The Errors Associated with the Rate Dependencies Indicate Two Standard Deviations about the Slopes of the Lines Shown in Figures 3 through 7.
Figure m~162 * m~ + o nH~ /~H202 ~Fe 3. ~'2H202
3 1.80 x 10 2 1.80 x 10 -3 3.70 • 10 2 1.80 • 10 -3
4 3.70 x 10 2 5.80 x 10 3 1.80 x 10 2 5.80 X 10 -3
9.00 • 10 3 5.80 X 10 -3
5 2.30 x 10 -5 3.70 x 10 -2 2.30 x 10 -5 1.80 x 10 -2 1.20 • 10 -4 3.70 x 10 -2 1.20 x 10 -4 1.80 x 10 -2
6 3.30 • 10 -4 3.70 • 10 -2 3.30 x 10 -'~ 1.80 x 10 2
7 3.20 • 10 -4 2.30 • 10 -5 1.20 x 10 .4
1.80 x 10 3 5.80 x 10 3 5.80 x 10 .3
1.16 (_+0.10) 0.95 (_+0.12)
1.11 (+_0.10) 0.91 (_+0.08) 0.92 (+0.06)
0.99 (_+0.14) 1.19 (_+0.18) 1.19 (_+0.12) 1.02 (+-0.06)
1.01 (_+0.08) 1.17 (_+0.06)
-0 .89 (+__0.14) -1.21 (+0.18) -1 .16 (+0.16)
METALLURGICAL TRANSACTIONS B VOLUME 16B, JUNE 1985-- 183
q:-
o
0,,I 1,5
I I I I I I I
~ . 8 ' ~ X i 0 -2
/ . . . . - , / 3'.8 ,i z . ;6 s:o
0 -log (~"/Fe3+)
Fig. 4 - - D e p e n d e n c e of the H20_, decomposit ion rate on m ~ ~ with m ~ H202 = 5.8 • 10 -3 at 25 ~
O
A
O
v
O
,6
l I I I
m~ -2
10-2
J - m~.:,.sx,o 2
d8 s 2.6
-log (m~2o2) Fig 5 - - D e p e n d e n c e of the H202 decomposit ion rate at 25 ~ on m ~ H202 with m%> = 2.3 • I0 -s (lines with open square and star symbols) and m~3* = 1 2 • I0 -4 (hnes wlth open mrcle and filled square symbols)
bars associated with these lines represent two standard devi- ations about the slopes calculated by the regression analysis and give a measure of the experimental uncertainty in the determinations of the orders with respect to a given reactant. Figures 3 and 4 are plots of -log(dmH~O2/dt) against -log(m%3-), where -(dmHeO2/dt) is the rate of H202 de- composition in mol/kg H20-sec, and the superscript zero refers to the initial molal concentration. The slopes of the lines shown in these figures give the dependence, nF~3-, of the H202 decomposition rate on the initial concentration of
I I l I I I
"O cu T//H+=3.7XIO-2 : . 5 \ ~-
-r
!
s.o z:o s s
-log (m~ Fig 6 - - D e p e n d e n c e of the U~O2 decomposatlon rate on m ~ H,O2 with m~ - = 3 3 x 10 4 a t 2 5 o c
I f i I I I
/7,/0 3~3. 2 X I 0 - 4 \T
�9 . - tM Fe3, = 2.3X I0 5 " 0 ,4" - . ~ rg/
o: I
2 ~ _o
!
"5 /7/0 = I . 2X lO T M ~ T Fe3+
o 1:2 1:6 "2".0 0 -log (mH+)
Ftg 7 - - D e p e n d e n c e of the H_,O_~ decomposit ion rate at 25 ~ on m ~ with m v H:O: = 1.8 x 10 -3 (hne with open square symbols) and m ~ H202 = 5 8 • l0 -3 (hnes ~]th star and open circle symbols).
free ferric ion. The slopes shown in Figures 3 and 4 indicate nve> is equal to 1.0 (see Table II); hence, the rate of the decomposition reaction is directly proportional to the initial concentration of free ferric ion. Similarly, the slopes shown in Figures 5 and 6 give the rate dependence on the H202 concentration, nil,o,. These slopes are also nearly equal to 1.0 (see Table II),-indicating the rate of H202 decomposition is directly proportional to the concentration of H202. The last rate dependence is determined from Figure 7. The slopes in Figure 7 give the rate dependence on hydrogen ion concentration, nil-. From Table II, it can be seen that n.- is
t84 VOLUME 16B, JUNE 1985 METALLURGICAL TRANSACTIONS B
approximately equal to -1 .0 ; hence, it can be concluded that the rate of H202 decomposition is inversely propor- tional to the concentration of hydrogen ion. The following rate expression is determined from the rate data shown in Figures 3 through 7:
0 0 3 k (mH2o2) (mFe ") - (dmn2o:/dt)25 ~ = (mO~) [3]
where k = 4.3 (+ 1.3) x 10 -3 (s-l). The magnitude of this rate constant, k, is an average value calculated from all the measured decomposition rates and the rate dependencies given in [3].
Decomposition rates were also measured as a function of temperature from 25 ~ to 50 ~ for two initial solution com- positions: (1) H202 = 6.3 x 10⁻³m, Fe~ + = 2.2 x 10⁻³m, pH = 1.5, and (2) H202 = 2.3 x 10⁻³m, Fe~* = 7.2 x 10⁻³m, pH = 1.5. From the decomposition rates measured at five degree intervals between 25 ~ and 50 ~ apparent activation energies of 82.4 kJ/mol and 88.7 kJ/mol were calculated using the Arrhenius equation ~7 for the two re- spective solution compositions given above.
The rate equation given in [3] is similar in form to the expression reported by Barb, et al. n for the H202 decom- position rate in dilute perchloric acid solutions with concen- tration ratios of H202 to free ferric ion greater than 1.0. In dilute perchloric acid solutions, ferric ion is present pre- dominantly as the free ion, and Barb, et a lY describe the H202 decomposition reaction path as a sequence of redox reactions that are catalyzed by the free ferric ion. According to Barb, et al.," and later substantiated by Walling and Weil, 25 the redox sequence is:
k4 Fe 3+ + H202(1) ~ Fe e+ + HO2" + H + [4]
k5 Fe3+ Fe z+ + H202(1)~ + HO. + OH [5] k6
HO. + H202(1)--~ H20(1) + HO2" [6]
HO2" + Fe > k7 H+ --~ Fe > + + O2(g) [7]
HO2" + Fe z+ k8 Fe3+ HO_~ + [8]
HO" + Fe z+ k~ Fe3+ + OH [9]
According to Walling and Weil, 25 steps [4] and [7] also involve equilibria with hydrogen ion prior to going to com- pletion. As such, both steps [4] and [7] can each be consid- ered as the summation of two reactions. For step [4], the first of these two reactions is the equilibria with hydrogen ion which may be written as:
Fe 3+ + H202(1)x,0= H+ + FeOOH2 +. [10]
This equilibrium reaction is then followed by the completion of the step:
FeOOH 2+ ~ Fe > + HO2". [11]
Similarly, step [7] can be considered as the sum of two reactions) s First, is the equilibrium with hydrogen ion,
HO2- K~2= H* + O~- , [12]
followed by step completion,
O2 + Fe 3+ ~2~ O2(g) + Fe 2+ . [13]
As pointed out by Walling and Weil, 25 the equilibrium reac- tions, [10] and [12], should lead to an inverse order depen- dency on the concentration of hydrogen ion for the overall steps [4] and [7], respectively.
For solutions with concentration ratios of H202 to Fe 3+ greater than 1.0, Barb, et al." assumed that the redox se- quence involved only steps [4] through [8] by reasoning that in these solutions the hydroxyl radical would react pre- dominately with H202, reaction [6], rather than with ferrous ion, reaction [9]. By assuming steady state concentrations for the chain carriers Fe 2+, HO., and HO2" for steps [4] through [8] and considering the expanded relations in [10] to [13] for steps [4] and [7], the following overall rate ex- pression can be derived:
-(dmn2o,/dt) = 2(Kl~ v2 (m~,o,) (mFe 3.) [14] - ~ / (m.-)
The form of expression [14] is in agreement with the expres- sion determined from the initial rate experiments carried out in dilute sulfuric acid solutions, Eq. [3].
In contrast, for solutions with concentration ratios of H202 less than 1.0. Barb, et al." expect the termination step [9] to replace [8]. Considering [9] and once again as- suming steady state concentrations for the same chain carriers, the rate expression that can be derived from [4] to [7], [9], and [10] to [13] is:
- (dmmof fd t ) = (2Kl~ 1'2 (mH2~ (gt/Fe3")l'2 [15] - - \ k9 / ( m . - ) la
Experimental results from Barb, et al., n however, yielded the following rate expression for solutions with concen- tration ratios of H202 to Fe 3. less than 1.0:
- ( d m m o f f d t ) = k (mH2~ (tnFe'-) [16] - - ( m . - )
The discrepancies between [15] and [16] are explained by Walling and Well 25 as being caused by poor resolution in determining the ratio of H202 to Fe > where the change in mechanisms takes place. Barb, et al. u assumed the change occurred cleanly at ratios equal to 1.0. However, as later pointed out by Walling and Weil, 25 the mechanism change probably does not take place at a single concentration ratio for all solutions.
The lowest concentration ratio of H202 to Fe 3. at which the H2OR decomposition rate could be measured in this study was about 3.0. In the dilute sulfuric acid solutions used in the experiments, approximately 5 pct of the total ferric species are calculated to be free ferric ions at 25 ~ Ferric sulfate complexes are the dominant ferric species (Figure 1). In order to lower the ratio of H202 to Fe 3+ to below 1.0 in the experiments, either very low H202 con- centrations or very high total ferric ion concentrations would have to be used. Analytical difficulties in determining changes in low H202 concentration made rate data un- reliable under such conditions. Increasing total ferric ion concentrations to values higher than those used in the ex- perinaents would have exceeded the concentrations appli- cable to in situ uranium leaching. Also, in solutions with high total ferric ion concentrations it was expected that the H20,. decomposition rate would be too rapid to allow initial
METALLURGICAL TRANSACTIONS B VOLUME 16B, JUNE 1985- - 185
rate methods to be used. However, it is expected that the rate expression and rate constant determined here, Eq. [3], should be applicable for most of the conditions that are likely to be encountered during in s i tu uranium leaching with acidic, H202 solutions. This experimentally deter- mined rate law and rate constant should provide an im- proved means to assess quantitatively the effects of the decomposition of H202 that would occur if dissolved iron is present in leaching solutions, and may aid in the design of more efficient lixiviant compositions. In addition, this rate expression is in good agreement with the expression that can be derived from the redox reaction sequence of Barb, e t al . H and Walling and Well, 25 Eq. [14]. This sequence was devel- oped by these workers to describe the reaction path leading to H202 decomposition in dilute perchloric acid solutions in which the dominant ferric species is the free ferric ion. The experimental work described here demonstrates that a simi- lar reaction path may describe the decomposition of H202 in dilute sulfuric acid solutions in which the ferric species are expected to be present largely as ferric sulfate complexes (Figure 1). It should be noted, though, that it was assumed here that the active catalyzing species was the free ferric ion, as suggested by Barb, e t a l . , H and the rate law is written accordingly. It is possible that future work will determine that the rate law should be written in terms of the dominant ferric species, such as FeSO2. If this is the case, then the rate constant measured here may be in error by some constant factor that reflects the effects of ferric speciation. However, the orders of the reaction rate with respect to the reactant concentrations, as given in [3], should still be correct.
IV. SUMMARY
The rate expression describing the ferric ion catalyzed decomposition of HzO 2 in dilute sulfuric acid solutions is found to agree well with the proposed redox reaction se- quence of Barb, et al . H and Walling and Well 25 for solutions with concentration ratios of H202 to Fe 3+ greater than 1.0. The measured rates of the ferric ion catalyzed decomposi- tion of H202 indicate that this process can cause a significant reduction in the H202 concentration in a relatively short period of time (Figure 2). This reaction may be at least partly responsible for the experimental and field observa- tions of rapid loss of H202 during in s i tu uranium leaching and should be taken into account when determining opti- mum lixiviant compositions.
ACKNOWLEDGMENTS
The author would like to thank primarily H.L. Barnes and K.M. Krupka for their constructive reviews of this
manuscript. Thanks are also due to A. C. Lasaga and L. M. Cathles for their help and comments. This research has been supported in most part by the United States Bureau of Mines Contract No. J0100065 to L. M. Cathles and H. L. Barnes. Support was also received from the National Science Foun- dation, Geochemistry Program Grant No. EAR-8206777 to H.L. Barnes, and from the Mineral Conservation Section, Department of Geosciences, Pennsylvania State University.
1.
2.
3. 4
5
6.
7
8 9
10 11.
12.
13.
14
15
16
17
18
19,
20.
21
22
23
24
25.
REFERENCES
J. B. Hlskey. Trans. lnstn Mm Metall. (Sect C Mineral Process Extr Metall.). 1980, vol 89, pp 145-52. L.E. Eary and L M Cathles: Metall. Trans B, 1983, vol. 14B, pp. 325-34. D. E Grandstaff. Econ Geol , 1976, vol 71, pp. 1493-506 A. R Amell and D. Langmulr' U.S. Bur. Mines Final Rep , Contract No. H0272019, Dept. of the Interior, Washington. DC, 1978 P Gatichon, R S Schecter, A Cowle~. and M Breland. In Situ. 1977. vol. 2, pp. 125-46. H C Granger and C G Warren Econ Geol 1969, vol 64, pp 160-71. R.L Reynolds and M B Goldhaber' Econ Geol 1983, vol. 78, pp 160-71 B C Lawes In &tu, 1978, vol. 2. pp 75-92 D C Grant. U S Bur Mines Open File Rep. 52-79, Dept. of the Interior. Washington. DC, 1979 L .M. Lttz' Mm. Eng., 1982, vol. 34, pp. 52-56 W G Barb, J. H Baxendale, P. George, and K R. Hargrave Trans Faradm Soe , 1951, vol 47. pp 591-616. D R Tweeton, G. R. Anderson, J K. Ahlness, O. M. Peterson, and W. H Engelman. Soc. Mm Eng AIME, 1978, Preprmt No 70-43 C A Ehgwe, A E Torma, and F W DeVnes H)drometall., 1982, vol 9, pp. 83-95 G M Elsenburg. lnd Eng Chem, Anal E d . 1943, vol 15, pp 327-28 G. D Chnstlan Anah'twal Chemtstr). Xerox College Pubhshlng, Waltham. MA, 1971, pp 351-52 H Tamura, K Goto. T Yotsoyanagl, and M Nagagama. Talanta, 1874. vol 21, pp. 314-18 A .C . Lasaga: Kmettcs of Geochemwal Processes, Revzews t n
Mineralogy, A C. Lasaga and R J Klrkpamck. eds,, Mineralogical Society of Amenca, Washington, DC. 1981, ,~ol. 8, pp 1-67. W. G Barb, J H. Baxendale, R George. and K. R Hargrave' Nature, 1949. vol 163, pp 692-94 L.M. Cathles and K J. Breen. U.S Bur Mines Final Rep , Grant Nos. G5105007, G5115007, and Gl115427, Dept. of the Interior, Washington, DC, 1983 R.M. Smith and A.E. Martell Crmcal Sta&ho Constants, Vol. 4. lnorgamc Complexes, Plenum Press. New York, NY, 1976, 257 pp. D D Wagman, W. H. Evans, V B. Parker, I Harlow, S M Bailey, and R H Schumm Nat Bur. Stds Tech. Note 270-4, 1969 R S Sapleszko, R. C. Patel, and E. Matljevlc. J Phvs Chem., 1977, vol 81, pp 1061-68. A H Truesdell and B E Jones. J. Res U S Geol. Survey, 1974, vol. 2, pp. 233-48 W. Stumm and J J Morgan: Aquauc Chemtstr~" An Introduction Emphastzmg Chemical Equihbrta m Natural Waters, 2nd ed., John Wdey and Sons, New York, NY, 1981, p. 135 C Walhng and T Well' Int J. Chem K m , 1974, vol VI, pp. 507-16.
186 VOLUME 16B, JUNE 1985 METALLURGICAL TRANSACTIONS B
Recommended