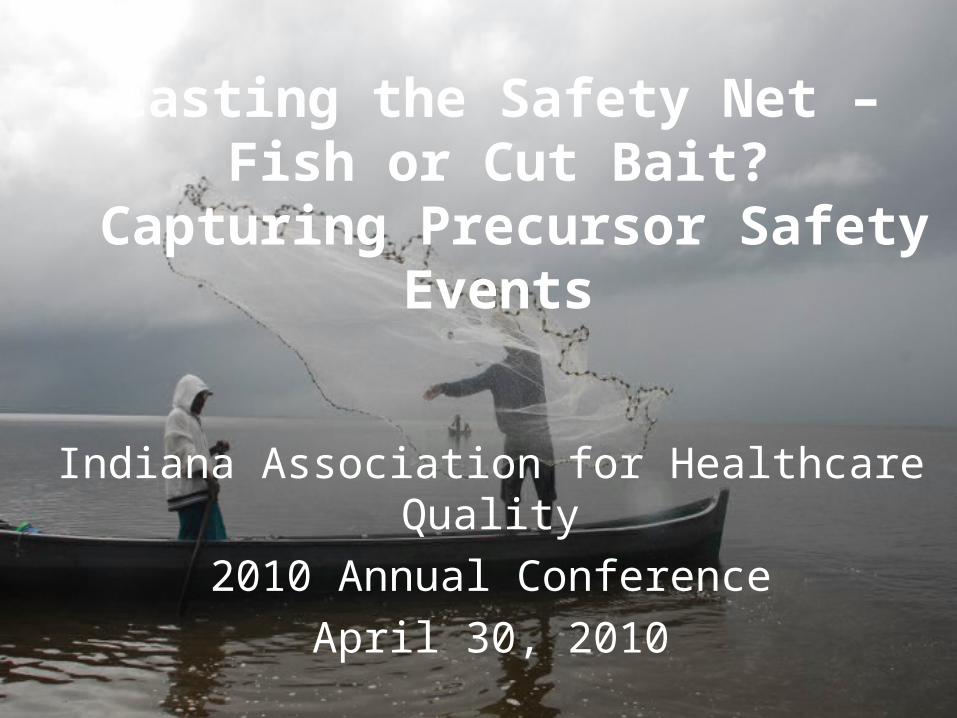
Casting the Safety Net – Fish or Cut Bait?
Capturing Precursor Safety Events
Indiana Association for Healthcare Quality
2010 Annual Conference
April 30, 2010
Martha Boutin White, RN, BSN, MBA,
Patient Safety Officer
Memorial University Medical Center
Savannah, GA
Sherry L. Sweek, RHIA, CPHQ, CPMSM,
Director of Quality Improvement
Southeast Georgia Health System
Brunswick, GA
Objectives
• Define Precursor Safety Events including errors of omission
• Explain leverage points introduced to increase reporting and decrease errors
• Share results and data analysis
• Review lessons learned
• Discuss next steps and recommendations
Overview• Memorial’s safety journey
• 2008 Safety refocus
• Precursor safety events project
• How we got started
• Problems we encountered
• Current safety performance
• Next steps

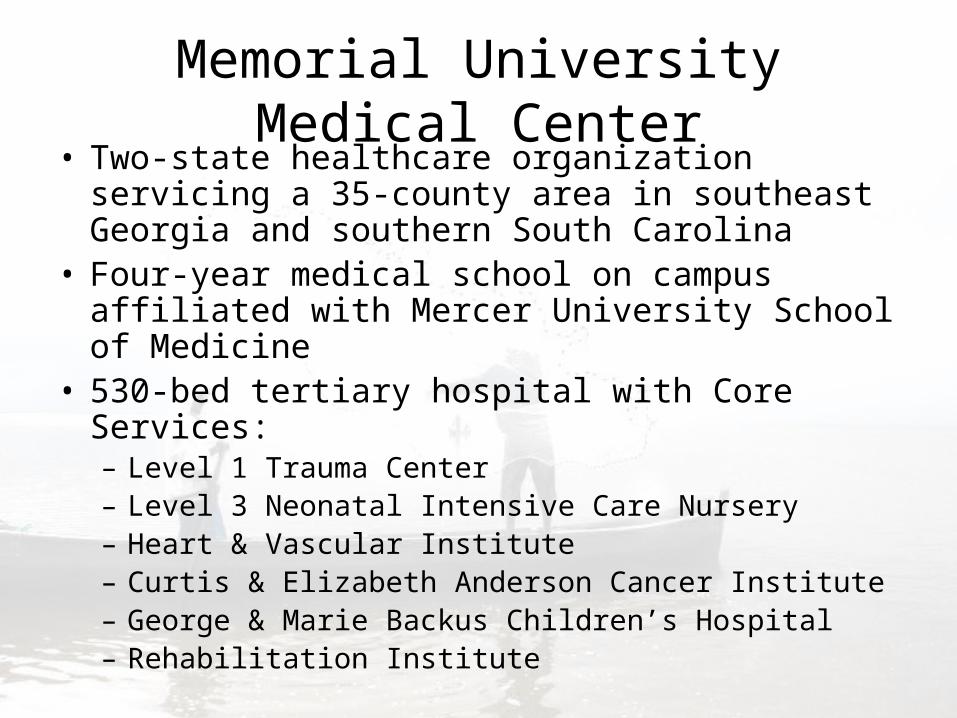
Memorial University Medical Center• Two-state healthcare organization servicing a
35-county area in southeast Georgia and southern South Carolina
• Four-year medical school on campus affiliated with Mercer University School of Medicine
• 530-bed tertiary hospital with Core Services:– Level 1 Trauma Center– Level 3 Neonatal Intensive Care Nursery– Heart & Vascular Institute– Curtis & Elizabeth Anderson Cancer Institute – George & Marie Backus Children’s Hospital– Rehabilitation Institute
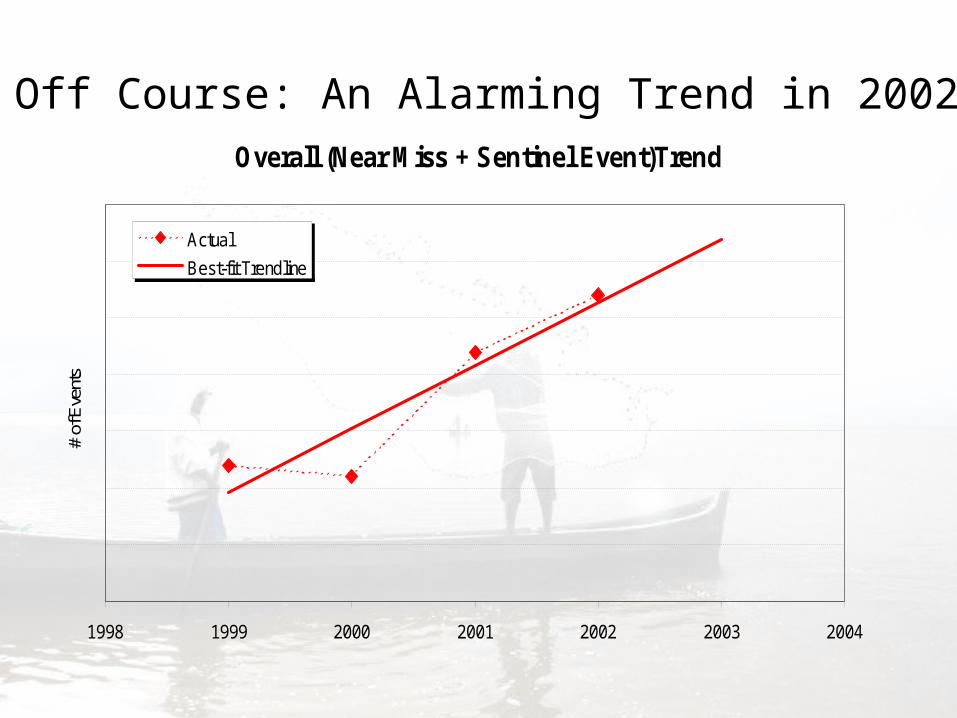
Off Course: An Alarming Trend in 2002Overall (Near Miss + Sentinel Event)Trend
1998 1999 2000 2001 2002 2003 2004
# of
Eve
nts
Actual
Best-fit Trendline
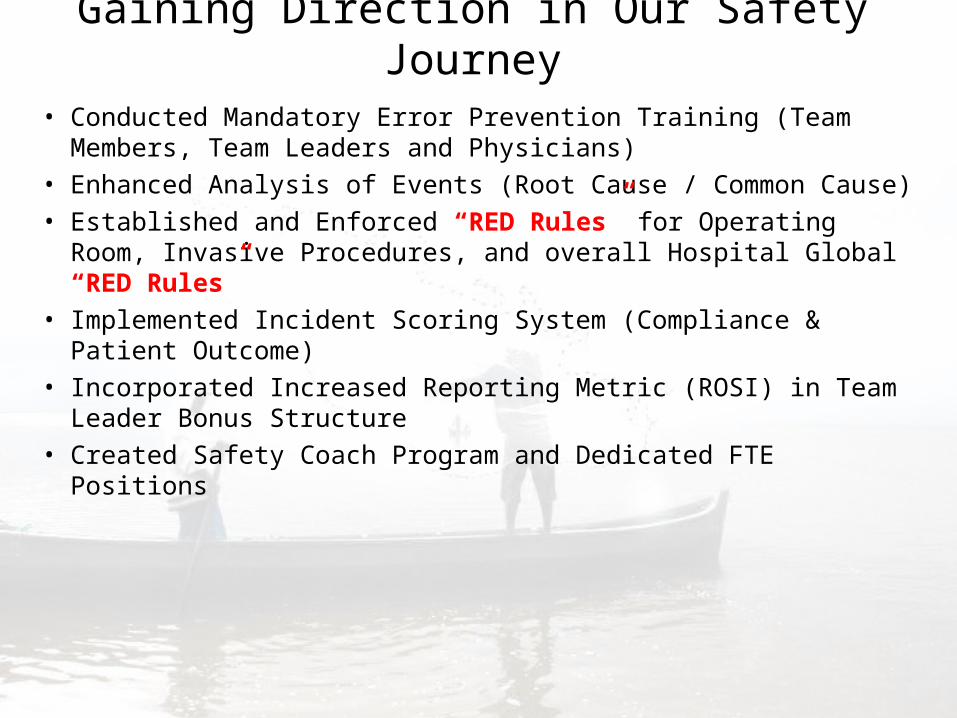
Gaining Direction in Our Safety Journey• Conducted Mandatory Error Prevention Training (Team
Members, Team Leaders and Physicians)• Enhanced Analysis of Events (Root Cause / Common Cause)• Established and Enforced “RED Rules” for Operating Room,
Invasive Procedures, and overall Hospital Global “RED Rules” • Implemented Incident Scoring System (Compliance & Patient
Outcome)• Incorporated Increased Reporting Metric (ROSI) in Team Leader
Bonus Structure• Created Safety Coach Program and Dedicated FTE Positions
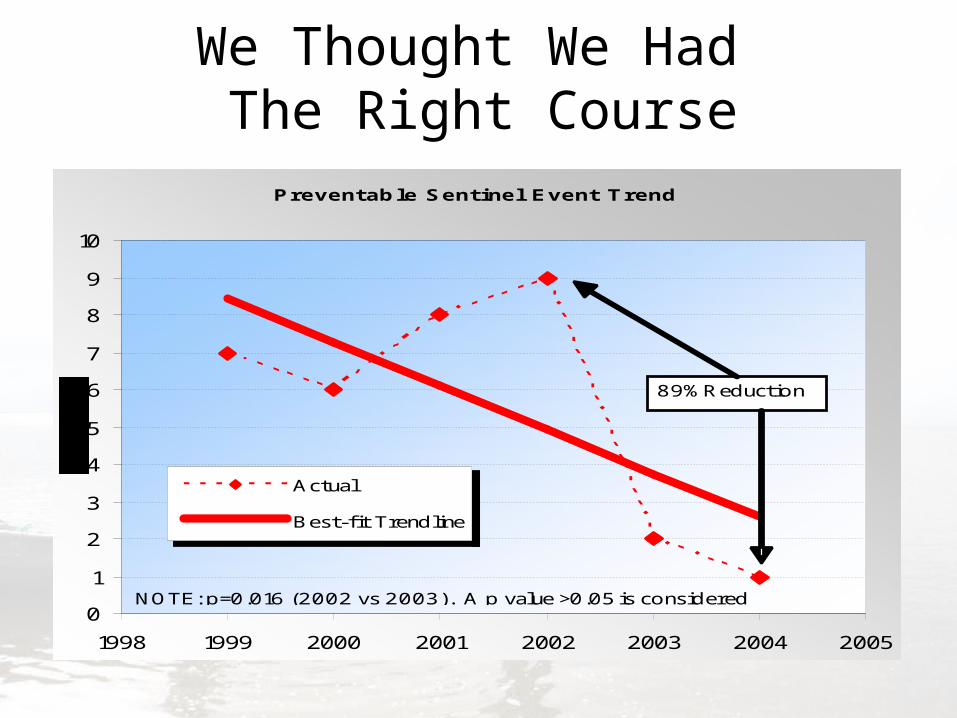
We Thought We Had The Right CoursePreventable Sentinel Event Trend
0
1
2
3
4
5
6
7
8
9
10
1998 1999 2000 2001 2002 2003 2004 2005
Actual
Best-fit Trendline
89% Reduction
NOTE: p=0.016 (2002 vs 2003). A p value >0.05 is considered
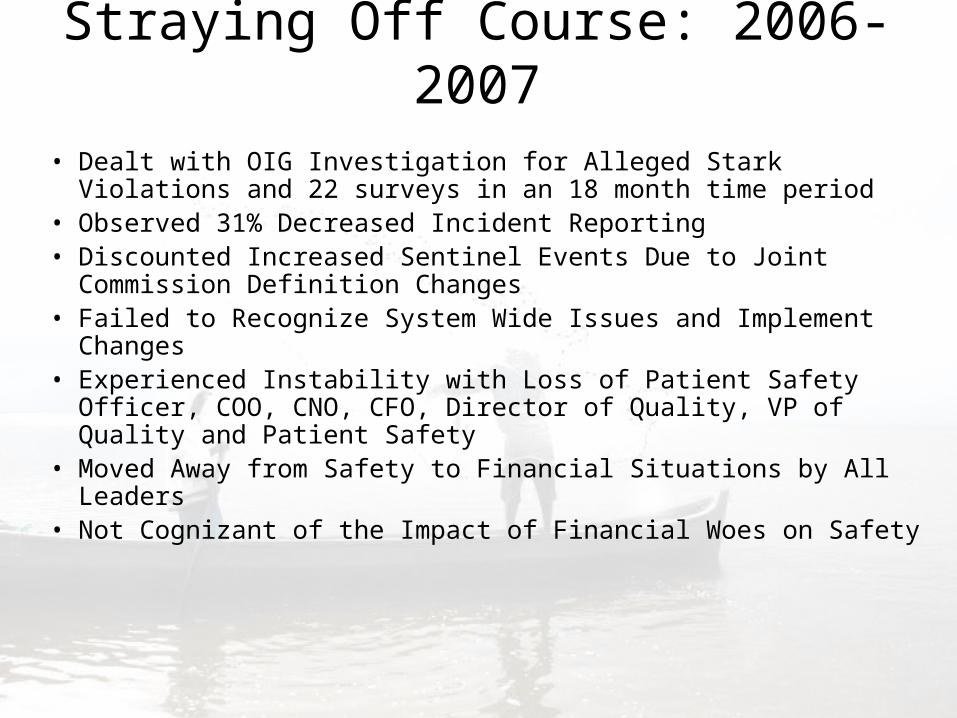
Straying Off Course: 2006-2007• Dealt with OIG Investigation for Alleged Stark Violations and 22
surveys in an 18 month time period• Observed 31% Decreased Incident Reporting• Discounted Increased Sentinel Events Due to Joint Commission
Definition Changes• Failed to Recognize System Wide Issues and Implement
Changes• Experienced Instability with Loss of Patient Safety Officer, COO,
CNO, CFO, Director of Quality, VP of Quality and Patient Safety• Moved Away from Safety to Financial Situations by All Leaders• Not Cognizant of the Impact of Financial Woes on Safety
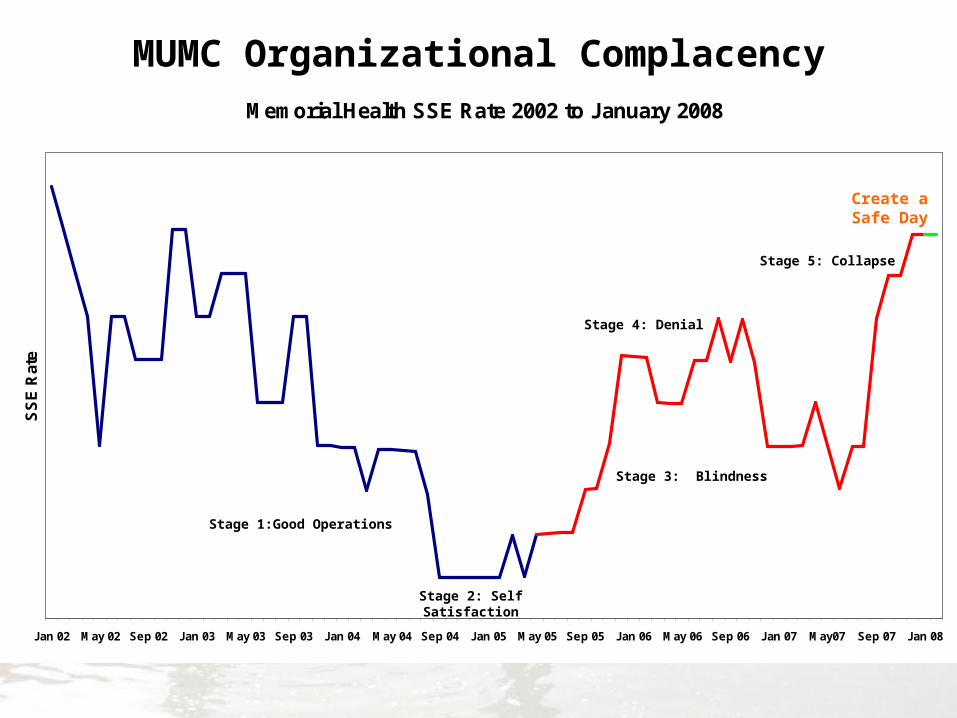
Memorial Health SSE Rate 2002 to January 2008
Jan 02 May 02 Sep 02 Jan 03 May 03 Sep 03 Jan 04 May 04 Sep 04 Jan 05 May 05 Sep 05 Jan 06 May 06 Sep 06 Jan 07 May07 Sep 07 Jan 08
SS
E R
ate
Stage 1:Good Operations
Stage 2: Self Satisfaction
Stage 5: Collapse
Stage 3: Blindness
Stage 4: Denial
Create a Safe Day
MUMC Organizational Complacency
When Did We Fish?
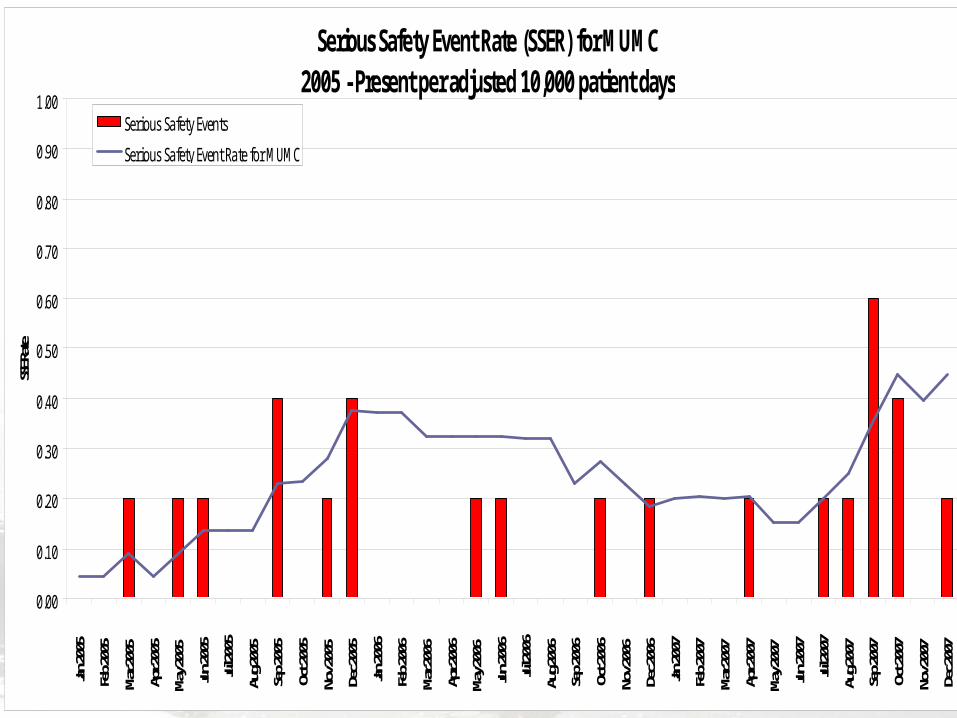
Serious Safety Event Rate (SSER) for MUMC2005 - Present per adjusted 10,000 patient days
0.00
0.10
0.20
0.30
0.40
0.50
0.60
0.70
0.80
0.90
1.00Jan
2005
Feb 2
005
Mar 2
005
Apr 2
005
May 2
005
Jun 20
05Jul
2005
Aug 2
005
Sep 2
005
Oct 2
005
Nov 2
005
Dec 2
005
Jan 20
06Fe
b 200
6Ma
r 200
6Ap
r 200
6Ma
y 200
6Jun
2006
Jul 20
06Au
g 200
6Se
p 200
6Oc
t 200
6No
v 200
6De
c 200
6Jan
2007
Feb 2
007
Mar 2
007
Apr 2
007
May 2
007
Jun 20
07Jul
2007
Aug 2
007
Sep 2
007
Oct 2
007
Nov 2
007
Dec 2
007
SSE Ra
te
0
1
2
3
4
5
# SSE
Serious Safety Events
Serious Safety Event Rate for MUMC
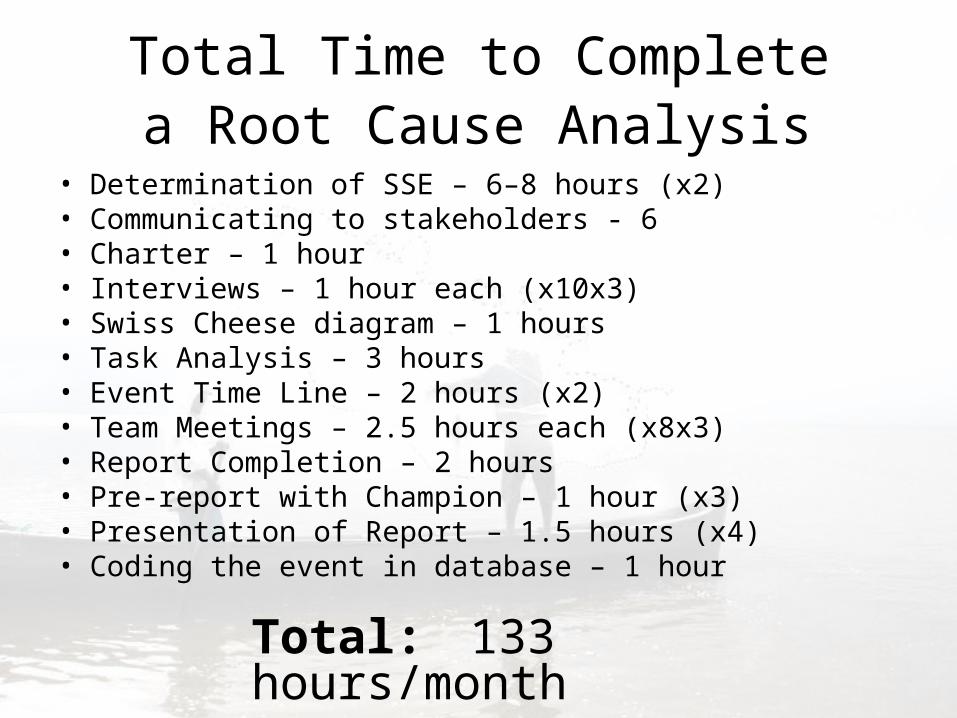
Total Time to Complete a Root Cause Analysis
• Determination of SSE – 6–8 hours (x2)• Communicating to stakeholders - 6• Charter – 1 hour• Interviews – 1 hour each (x10x3)• Swiss Cheese diagram – 1 hours• Task Analysis – 3 hours• Event Time Line – 2 hours (x2)• Team Meetings – 2.5 hours each (x8x3)• Report Completion – 2 hours• Pre-report with Champion – 1 hour (x3)• Presentation of Report – 1.5 hours (x4)• Coding the event in database – 1 hour
Total: 133 hours/month

“We’re gonna know all there is to know about the PSE business”
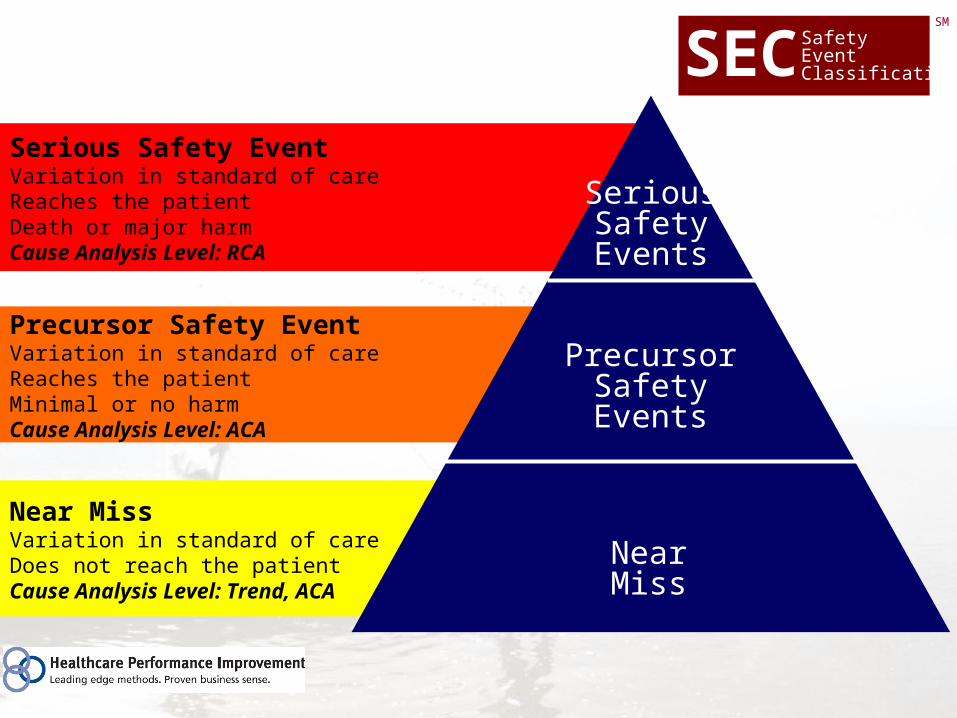
Serious Safety EventVariation in standard of careReaches the patientDeath or major harmCause Analysis Level: RCA
Precursor Safety EventVariation in standard of careReaches the patientMinimal or no harmCause Analysis Level: ACA
Near MissVariation in standard of careDoes not reach the patientCause Analysis Level: Trend, ACA
PrecursorSafetyEvents
SeriousSafetyEvents
Near Miss
SafetyEventClassificationSEC
SM
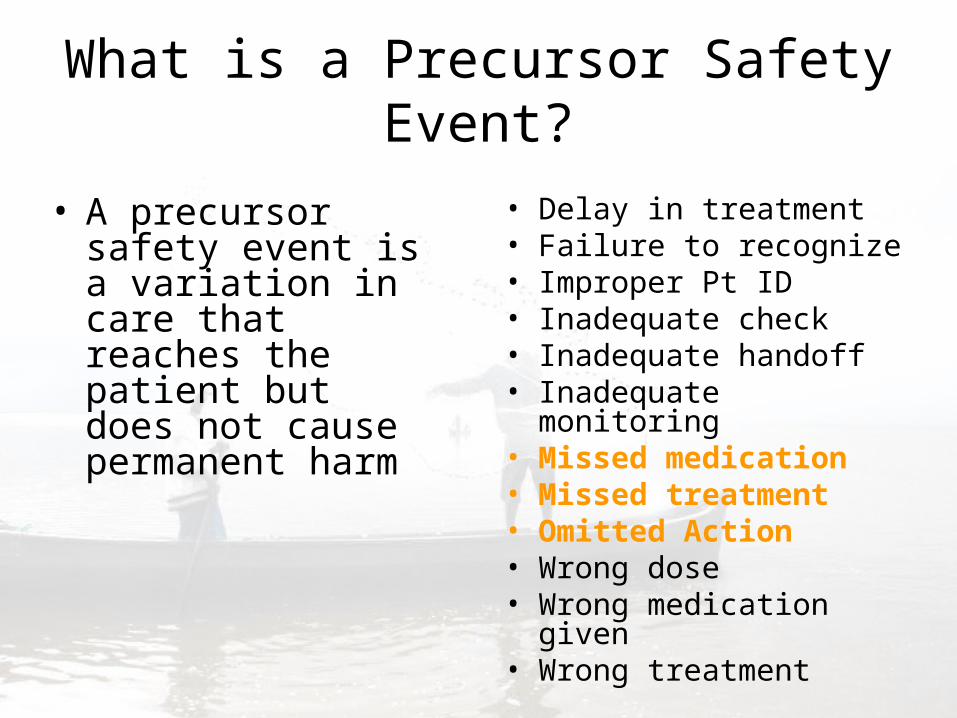
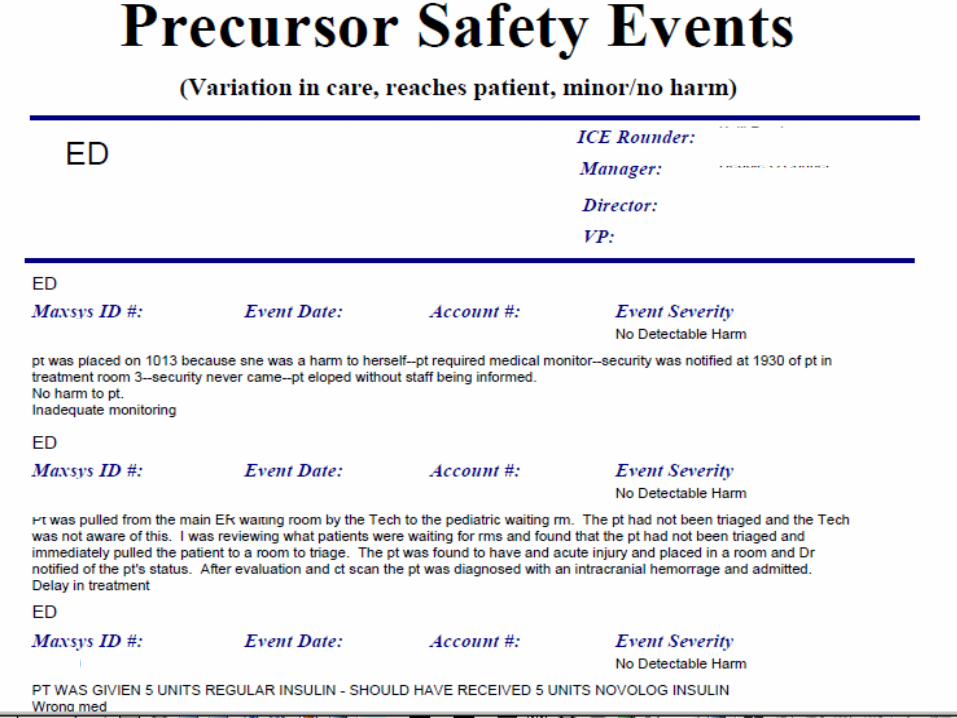
What is a Precursor Safety Event?
• A precursor safety event is a variation in care that reaches the patient but does not cause permanent harm
• Delay in treatment • Failure to recognize• Improper Pt ID• Inadequate check• Inadequate handoff• Inadequate monitoring• Missed medication• Missed treatment• Omitted Action• Wrong dose• Wrong medication given • Wrong treatment
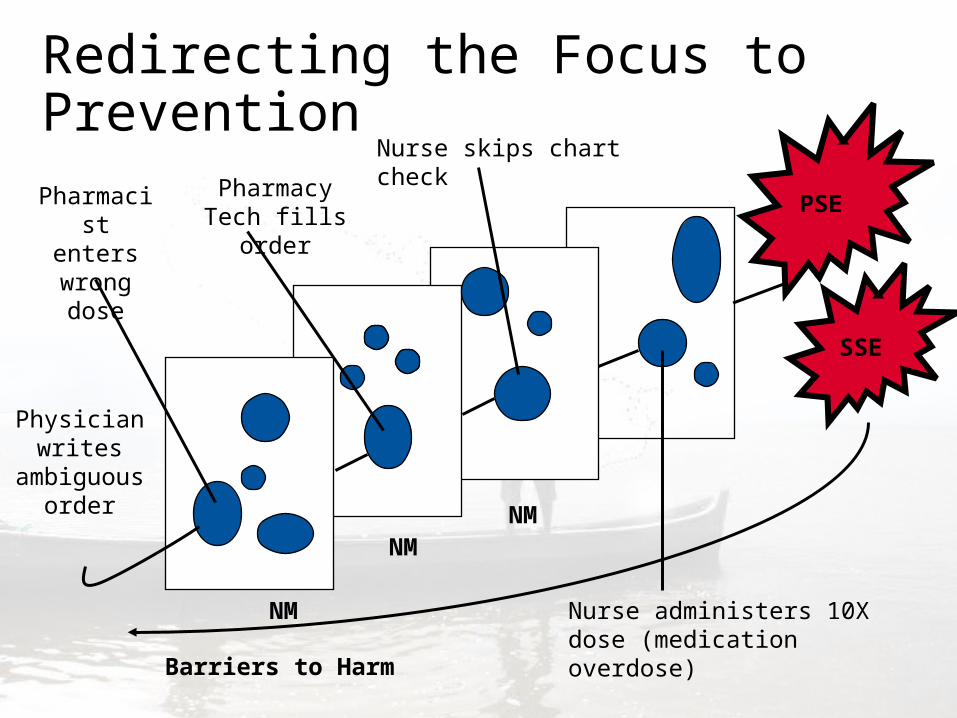
Redirecting the Focus to Prevention
Physician writes
ambiguous order
Pharmacist enters
wrong dose
Nurse administers 10X dose (medication overdose)
Pharmacy Tech fills order
SSE
PSE
NMNM
NM
Nurse skips chart check
Barriers to Harm
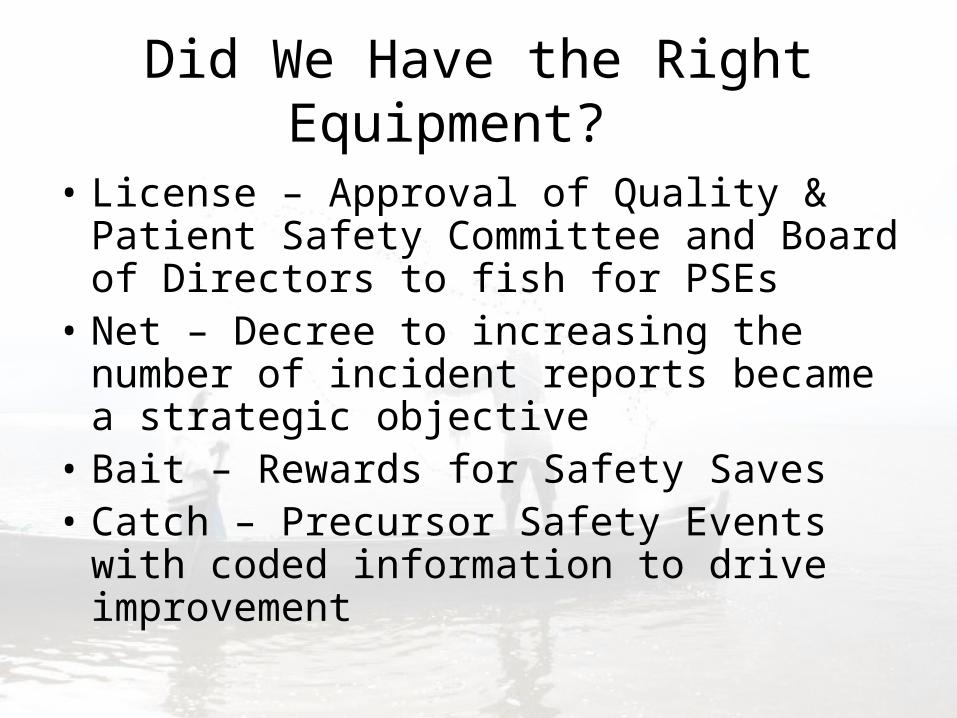
Did We Have the Right Equipment?
• License – Approval of Quality & Patient Safety Committee and Board of Directors to fish for PSEs
• Net – Decree to increasing the number of incident reports became a strategic objective
• Bait – Rewards for Safety Saves • Catch – Precursor Safety Events with
coded information to drive improvement

We Bought a Trawler...on Credit
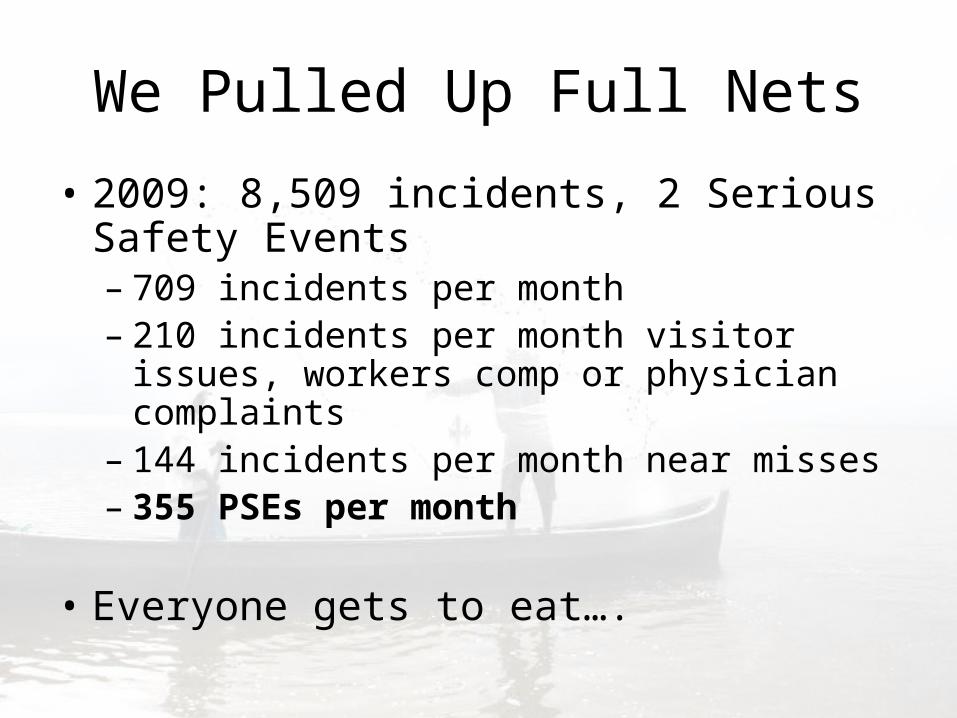
We Pulled Up Full Nets
• 2009: 8,509 incidents, 2 Serious Safety Events– 709 incidents per month– 210 incidents per month visitor issues,
workers comp or physician complaints– 144 incidents per month near misses– 355 PSEs per month
• Everyone gets to eat….

Beware of Shifting Tides
• Fishy Headlines – Paradigm Shift Required– Risk Management Shares Information and
Promotes Transparency – No Compass on How to Navigate– Internal Sonar Better Than Nothing
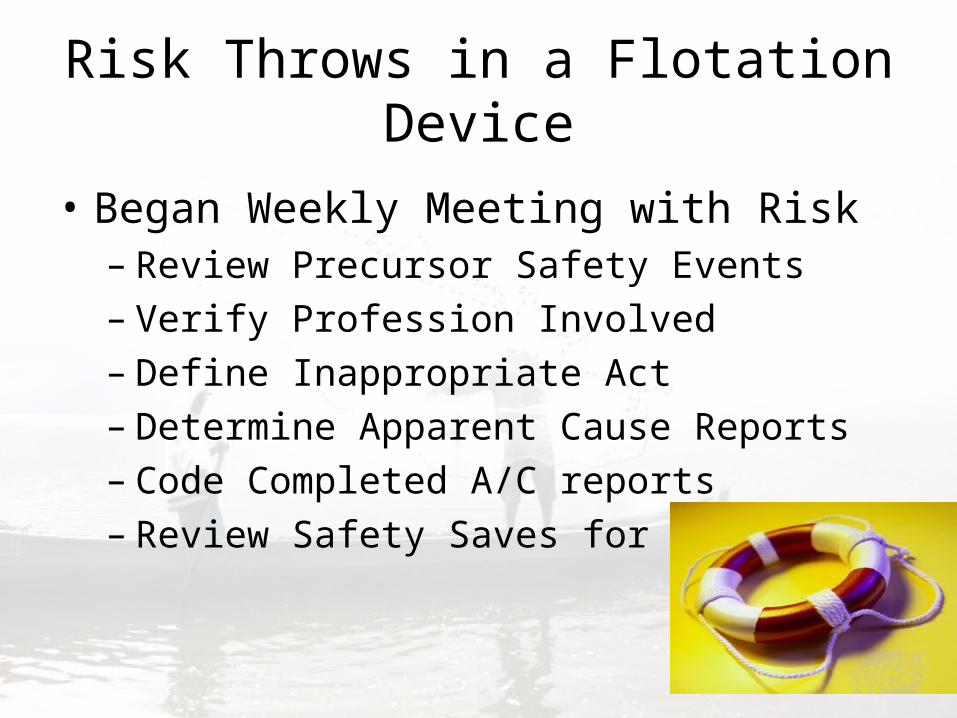
Risk Throws in a Flotation Device
• Began Weekly Meeting with Risk – Review Precursor Safety Events – Verify Profession Involved– Define Inappropriate Act – Determine Apparent Cause Reports– Code Completed A/C reports– Review Safety Saves for PSEs
Back on Dry Land…
• Assign Apparent Cause Reports in Safety Database
• Have Management Engineers Customize Database to House PSE information
• Compile Safety Saves and Produce Certificates
What’s Our Catch?
Is It a Keeper?
• WHEN I HAD FINISHED, I BROUGHT pt. N WAS NO LONGER WITH PT AND PT WAS NOT MONITORED. PT INITIALLY CAME TO ER FOR TRAUMA TO FACE/HEAD FROM FALL. PT WAS NOT AWAKE, OR COMMUNICATIVE WITH ME WHEN I BROUGHT HER TO THE SCANNER. I WAS ABOUT TO GET ASSISTANCE WITH MOVING THE PT WHEN SHE coded
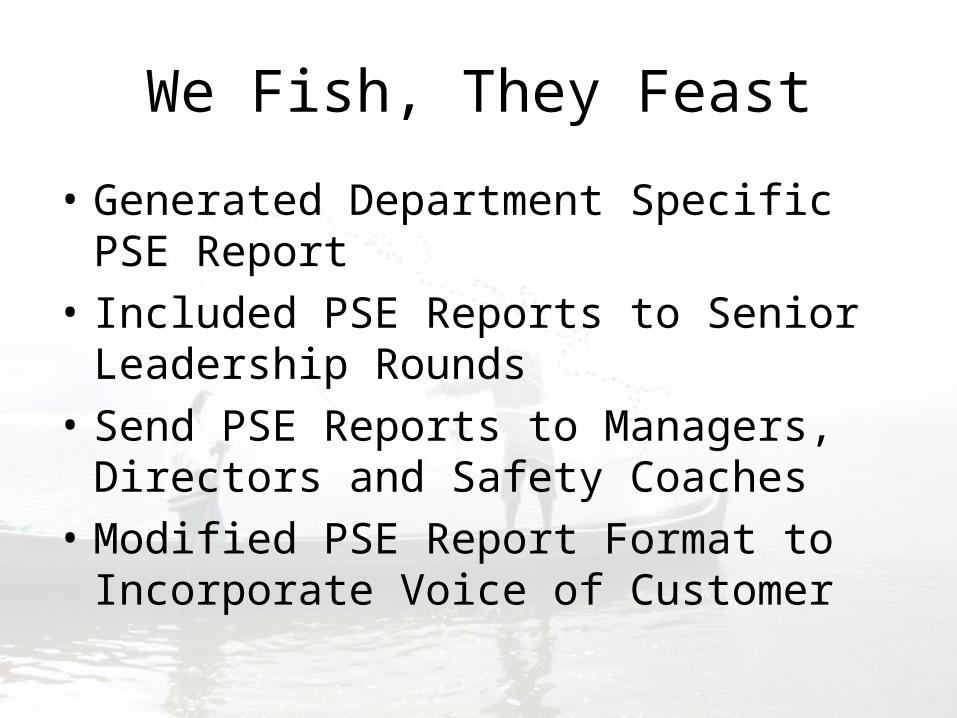
We Fish, They Feast
• Generated Department Specific PSE Report
• Included PSE Reports to Senior Leadership Rounds
• Send PSE Reports to Managers, Directors and Safety Coaches
• Modified PSE Report Format to Incorporate Voice of Customer
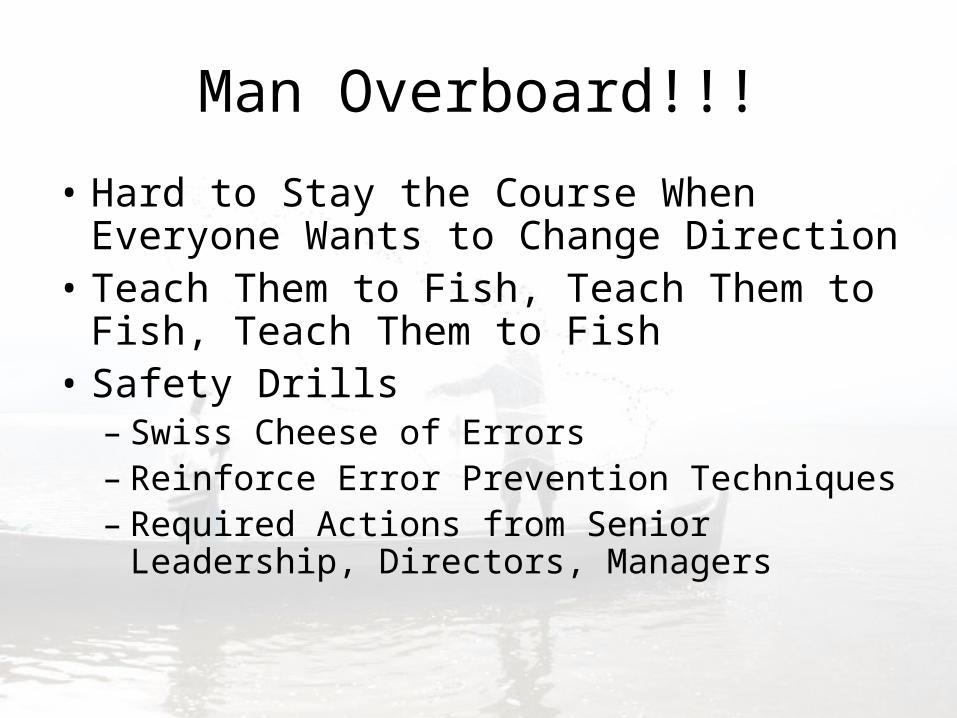
Man Overboard!!!
• Hard to Stay the Course When Everyone Wants to Change Direction
• Teach Them to Fish, Teach Them to Fish, Teach Them to Fish
• Safety Drills– Swiss Cheese of Errors– Reinforce Error Prevention Techniques– Required Actions from Senior Leadership,
Directors, Managers
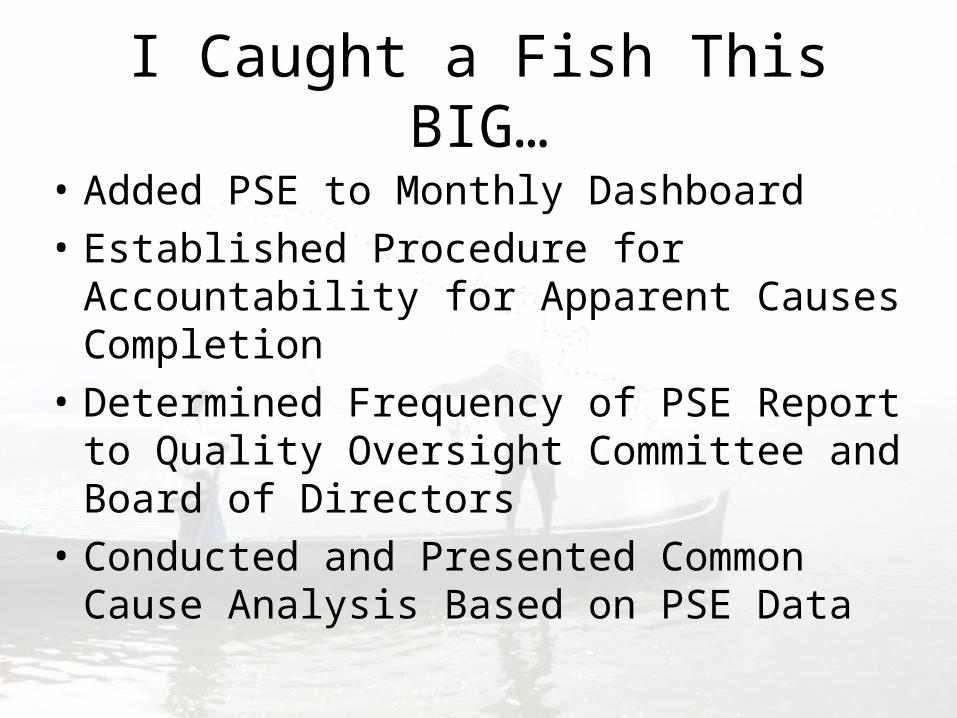
I Caught a Fish This BIG…
• Added PSE to Monthly Dashboard
• Established Procedure for Accountability for Apparent Causes Completion
• Determined Frequency of PSE Report to Quality Oversight Committee and Board of Directors
• Conducted and Presented Common Cause Analysis Based on PSE Data
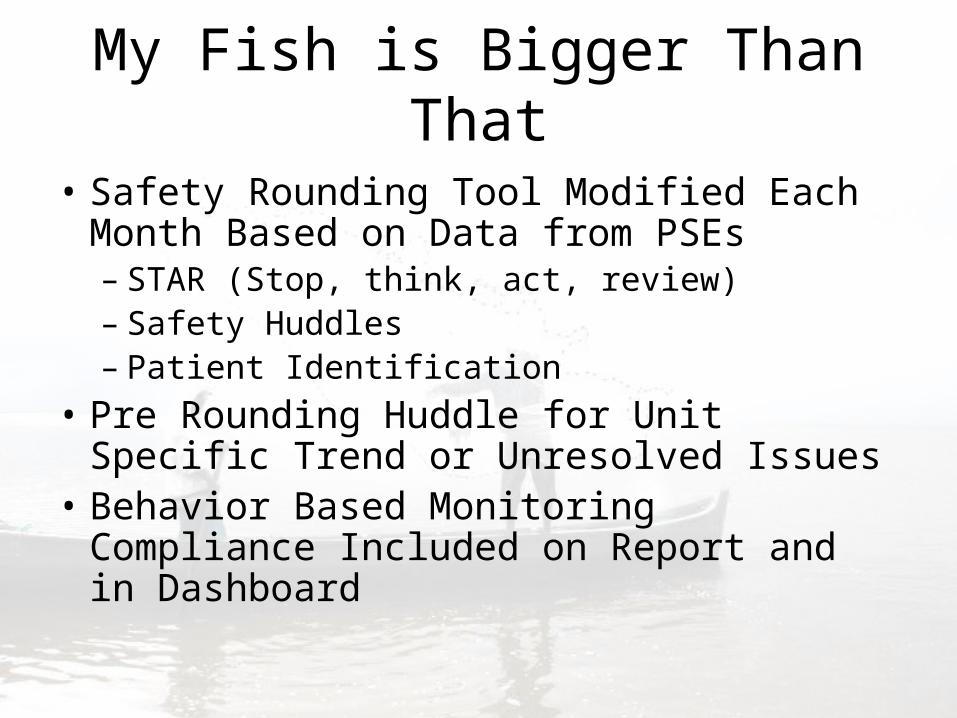
My Fish is Bigger Than That
• Safety Rounding Tool Modified Each Month Based on Data from PSEs– STAR (Stop, think, act, review)– Safety Huddles– Patient Identification
• Pre Rounding Huddle for Unit Specific Trend or Unresolved Issues
• Behavior Based Monitoring Compliance Included on Report and in Dashboard

We Confirm Tears in The Nets
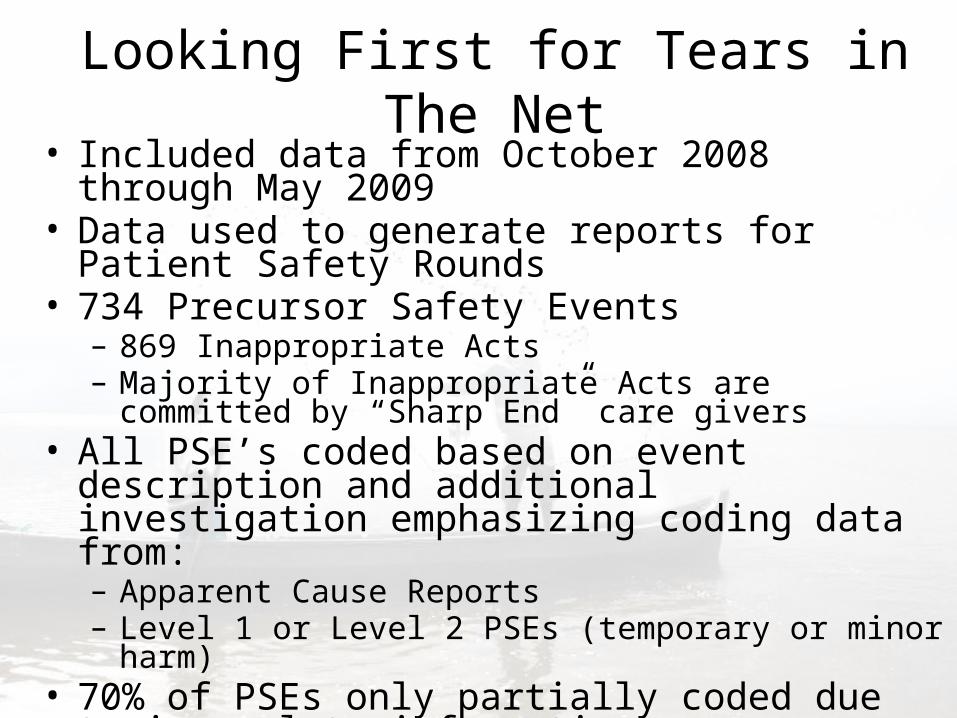
Looking First for Tears in The Net• Included data from October 2008 through May 2009• Data used to generate reports for Patient Safety
Rounds• 734 Precursor Safety Events
– 869 Inappropriate Acts– Majority of Inappropriate Acts are committed by “Sharp
End” care givers• All PSE’s coded based on event description and
additional investigation emphasizing coding data from: – Apparent Cause Reports – Level 1 or Level 2 PSEs (temporary or minor harm)
• 70% of PSEs only partially coded due to incomplete information
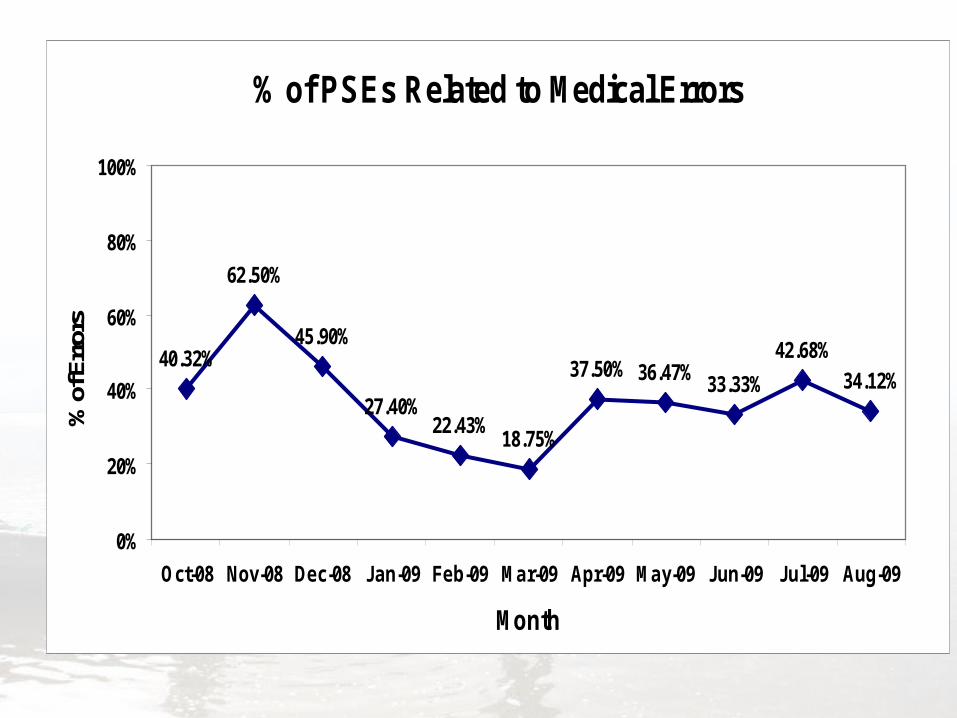
% of PSEs Related to Medical Errors
40.32%
62.50%
45.90%
34.12%27.40%
22.43%18.75%
37.50% 36.47% 33.33%
42.68%
0%
20%
40%
60%
80%
100%
Oct-08 Nov-08 Dec-08 Jan-09 Feb-09 Mar-09 Apr-09 May-09 Jun-09 Jul-09 Aug-09
Month
% o
f Err
ors
Mine DataA/C reports
Data & A/C
Approval for6 mth study
PSE Report & Rewards
MAXPI Saves& MAX Blitz
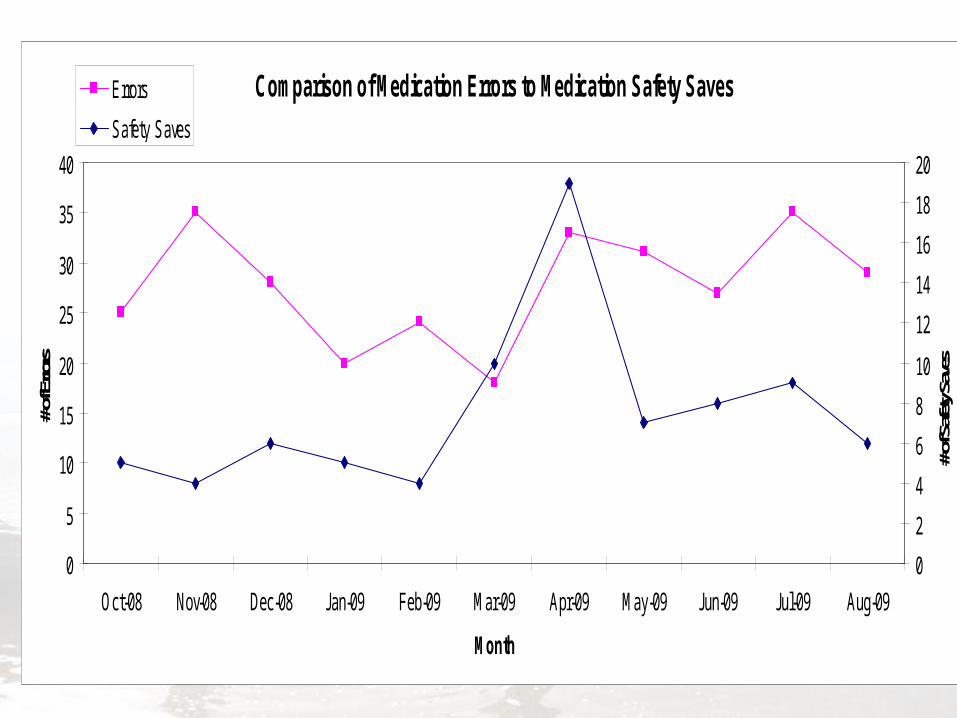
Comparison of Medication Errors to Medication Safety Saves
0
5
10
15
20
25
30
35
40
Oct-08 Nov-08 Dec-08 Jan-09 Feb-09 Mar-09 Apr-09 May-09 Jun-09 Jul-09 Aug-09
Month
# of E
rrors
0
2
4
6
8
10
12
14
16
18
20
# of S
afety
Save
s
Errors
Safety Saves

“PSEs are like a box of chocolates. You never know what you’re gonna get….”
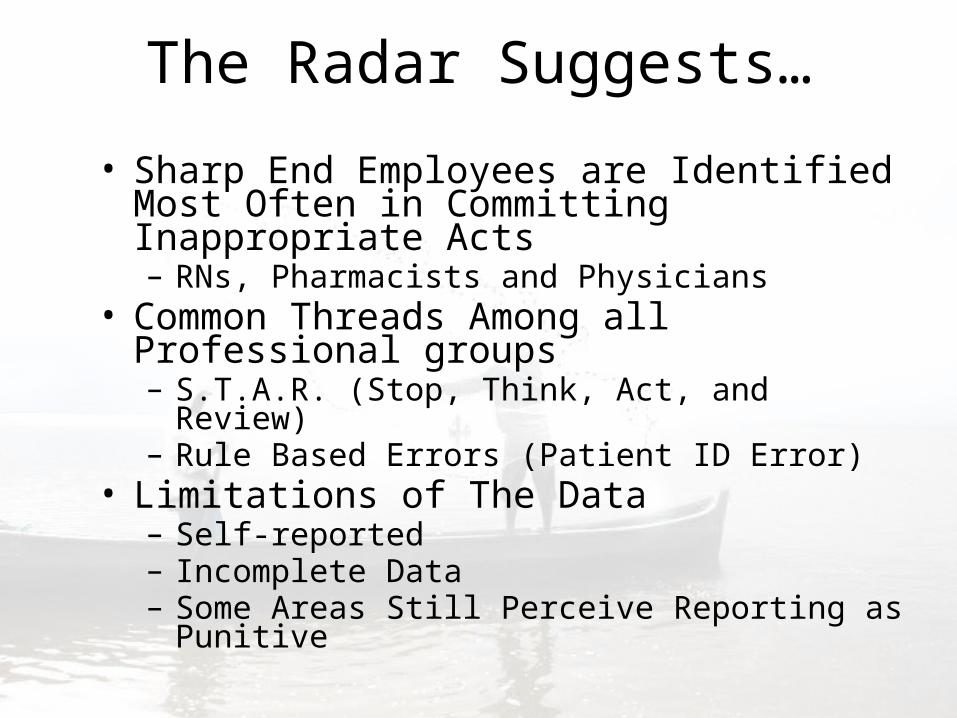
The Radar Suggests…
• Sharp End Employees are Identified Most Often in Committing Inappropriate Acts– RNs, Pharmacists and Physicians
• Common Threads Among all Professional groups – S.T.A.R. (Stop, Think, Act, and Review)– Rule Based Errors (Patient ID Error)
• Limitations of The Data – Self-reported– Incomplete Data– Some Areas Still Perceive Reporting as Punitive
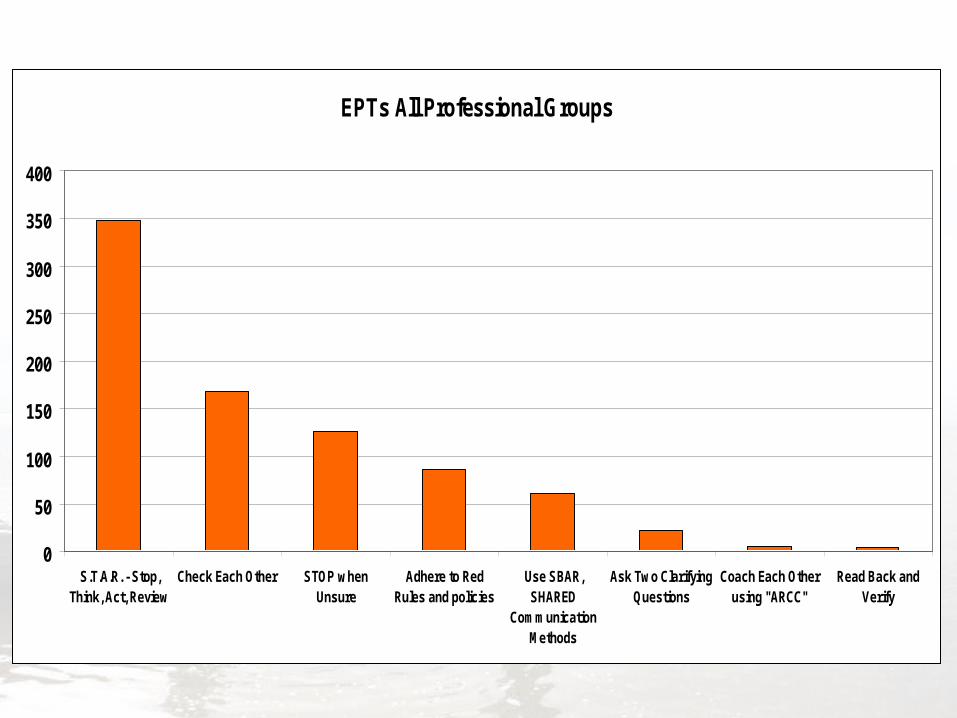
EPTs All Professional Groups
0
50
100
150
200
250
300
350
400
S.T.A.R. - Stop,Think, Act, Review
Check Each Other STOP whenUnsure
Adhere to RedRules and policies
Use SBAR,SHARED
CommunicationMethods
Ask Two ClarifyingQuestions
Coach Each Otherusing "ARCC"
Read Back andVerify
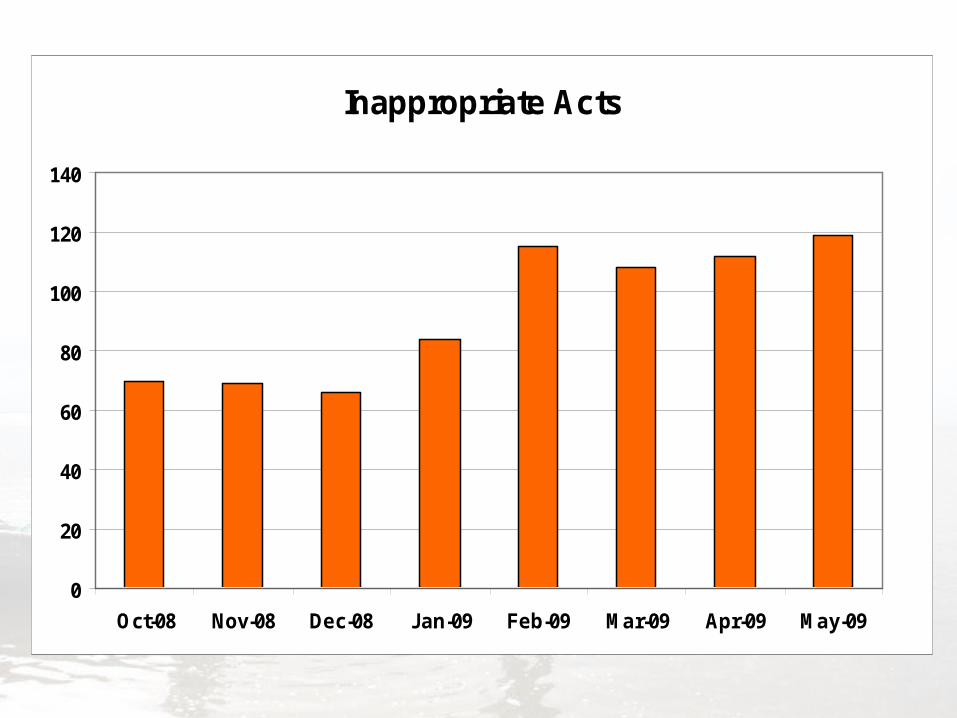
Inappropriate Acts
0
20
40
60
80
100
120
140
Oct-08 Nov-08 Dec-08 Jan-09 Feb-09 Mar-09 Apr-09 May-09
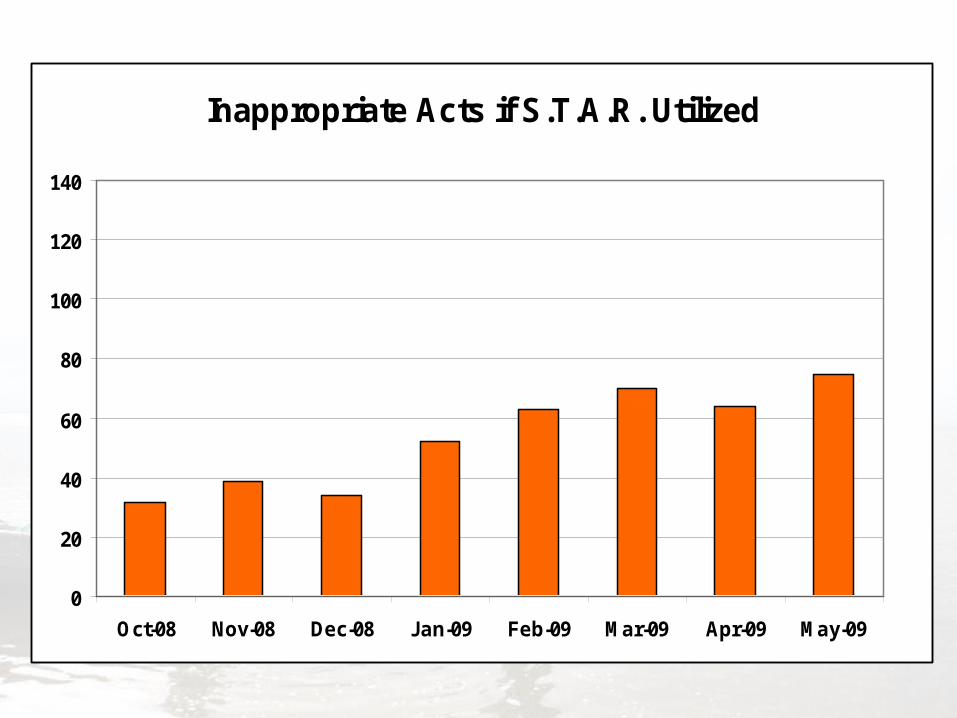
Inappropriate Acts if S.T.A.R. Utilized
0
20
40
60
80
100
120
140
Oct-08 Nov-08 Dec-08 Jan-09 Feb-09 Mar-09 Apr-09 May-09
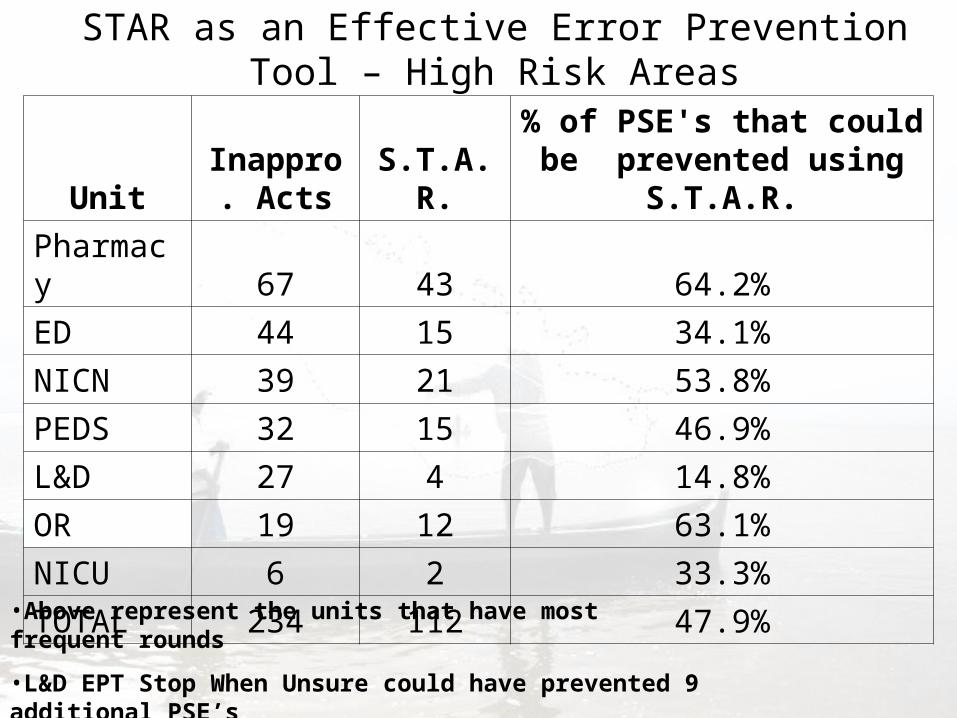
STAR as an Effective Error Prevention Tool – High Risk Areas
•Above represent the units that have most frequent rounds
•L&D EPT Stop When Unsure could have prevented 9 additional PSE’s
UnitInappro.
Acts S.T.A.R.% of PSE's that could be prevented using S.T.A.R.
Pharmacy 67 43 64.2%
ED 44 15 34.1%
NICN 39 21 53.8%
PEDS 32 15 46.9%
L&D 27 4 14.8%
OR 19 12 63.1%
NICU 6 2 33.3%
TOTAL 234 112 47.9%

Mending the Nets
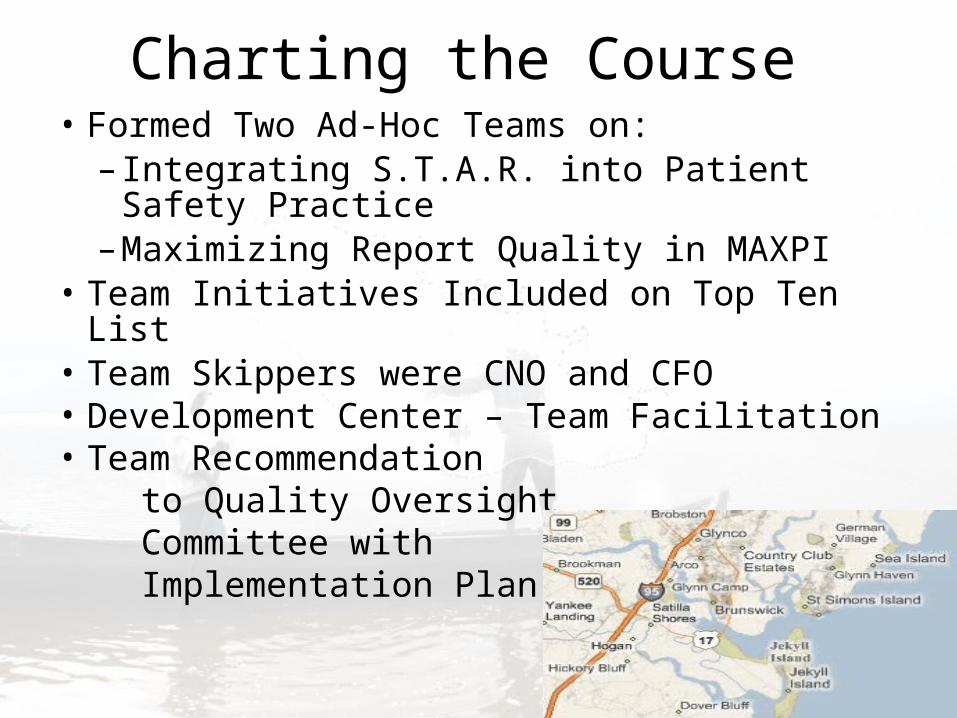
Charting the Course• Formed Two Ad-Hoc Teams on:
– Integrating S.T.A.R. into Patient Safety Practice
– Maximizing Report Quality in MAXPI• Team Initiatives Included on Top Ten List• Team Skippers were CNO and CFO• Development Center – Team Facilitation• Team Recommendation to Quality Oversight Committee with Implementation Plan
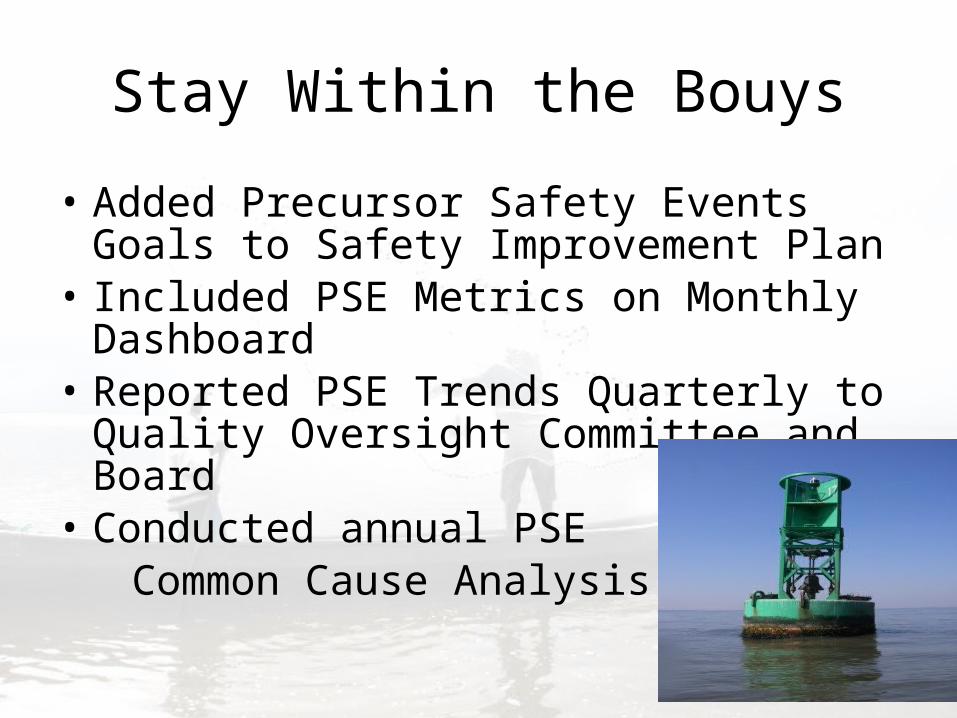
Stay Within the Bouys
• Added Precursor Safety Events Goals to Safety Improvement Plan
• Included PSE Metrics on Monthly Dashboard• Reported PSE Trends Quarterly to Quality
Oversight Committee and Board • Conducted annual PSE Common Cause Analysis
2009 Common Cause Navigation
• 1102 Precursor Safety Events– 1310 Inappropriate Acts– 17.5% of PSEs with Temporary or Minor Harm– Results Mirror Common Cause from August
2009– Five Straight Months with 100% of Apparent
Cause Reports Completed in Two Weeks– 35%-45% of Inappropriate Acts are with
Medication Nutrition Process– 50% of Inappropriate Acts could have been
Prevented by Using STAR
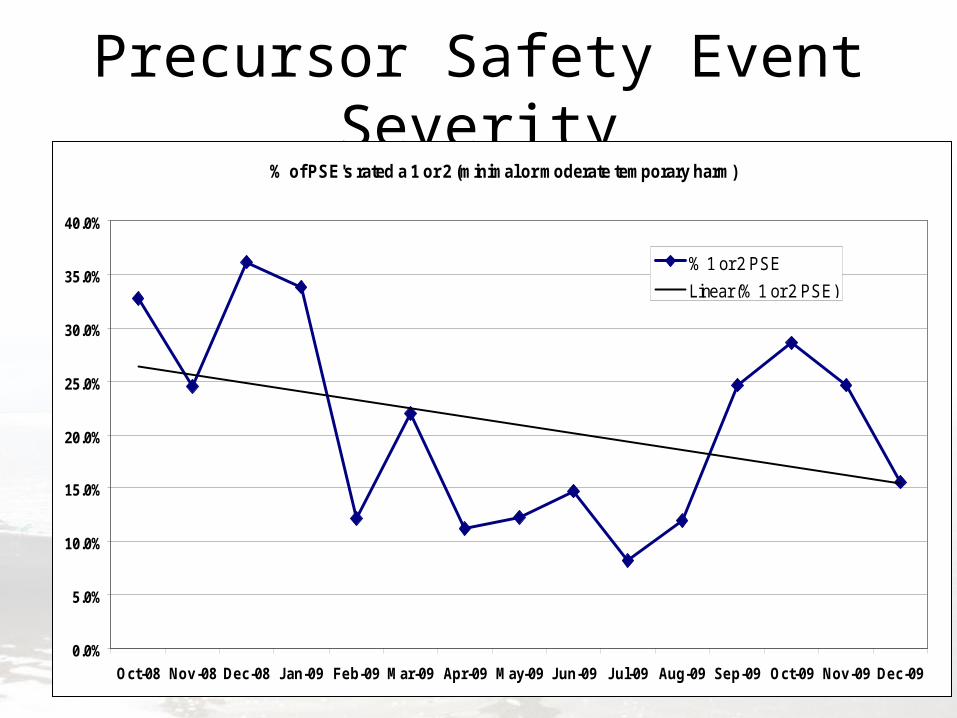
Precursor Safety Event Severity% of PSE's rated a 1 or 2 (minimal or moderate temporary harm)
0.0%
5.0%
10.0%
15.0%
20.0%
25.0%
30.0%
35.0%
40.0%
Oct-08 Nov-08 Dec-08 Jan-09 Feb-09 Mar-09 Apr-09 May-09 Jun-09 Jul-09 Aug-09 Sep-09 Oct-09 Nov-09 Dec-09
% 1 or 2 PSE
Linear (% 1 or 2 PSE)
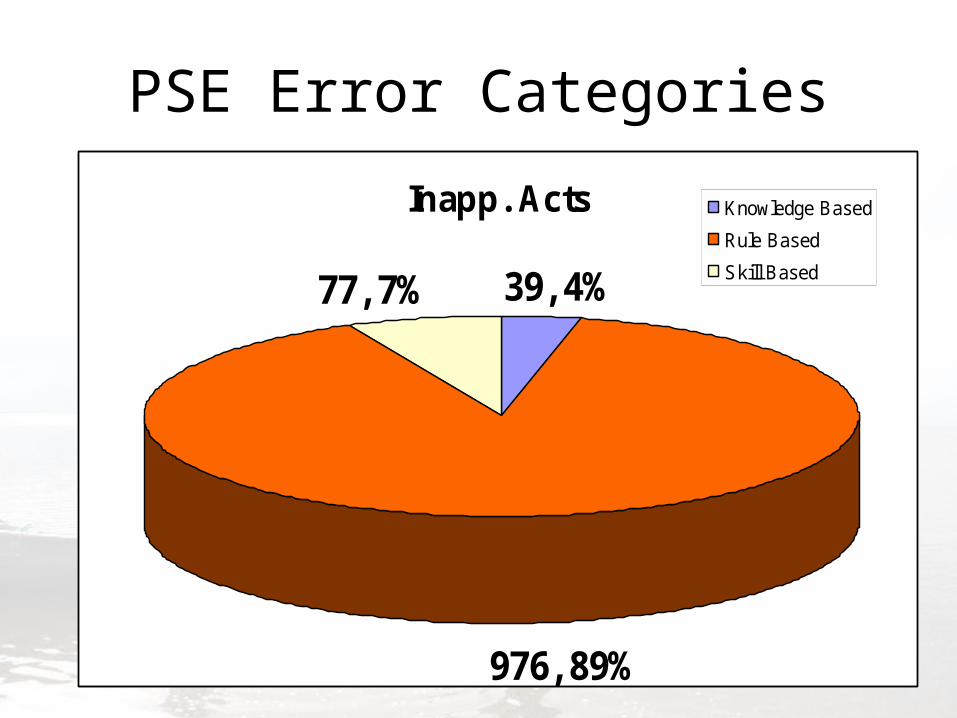
PSE Error Categories
Inapp. Acts
39, 4%
976, 89%
77, 7%
Knowledge Based
Rule Based
Skill Based
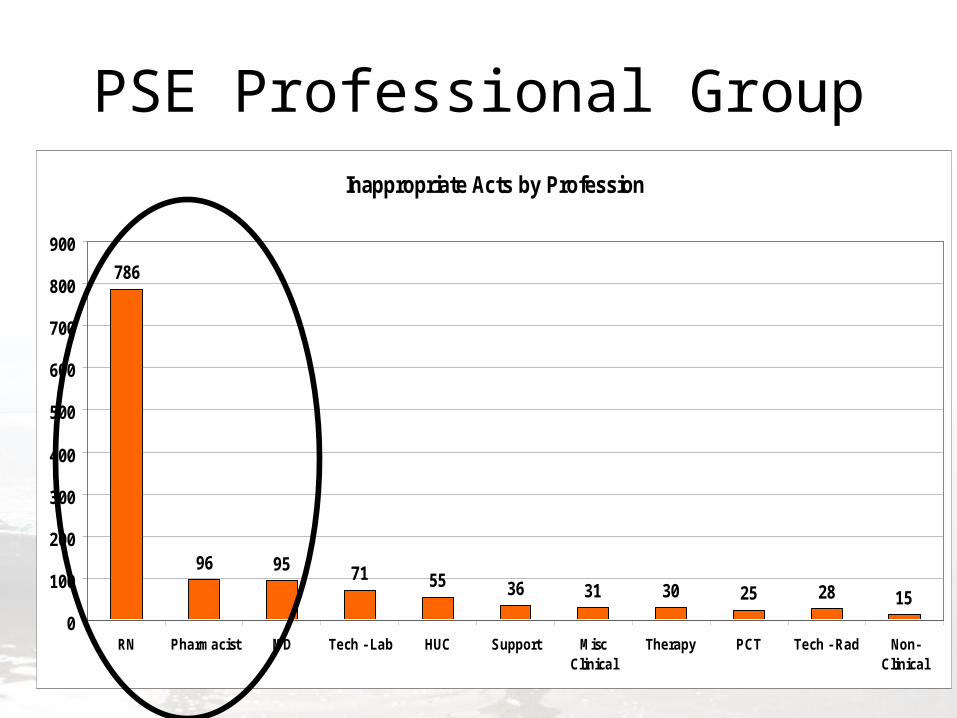
PSE Professional GroupInappropriate Acts by Profession
786
96 95 71 55 36 31 30 25 28 150
100
200
300
400
500
600
700
800
900
RN Pharmacist MD Tech - Lab HUC Support MiscClinical
Therapy PCT Tech - Rad Non-Clinical
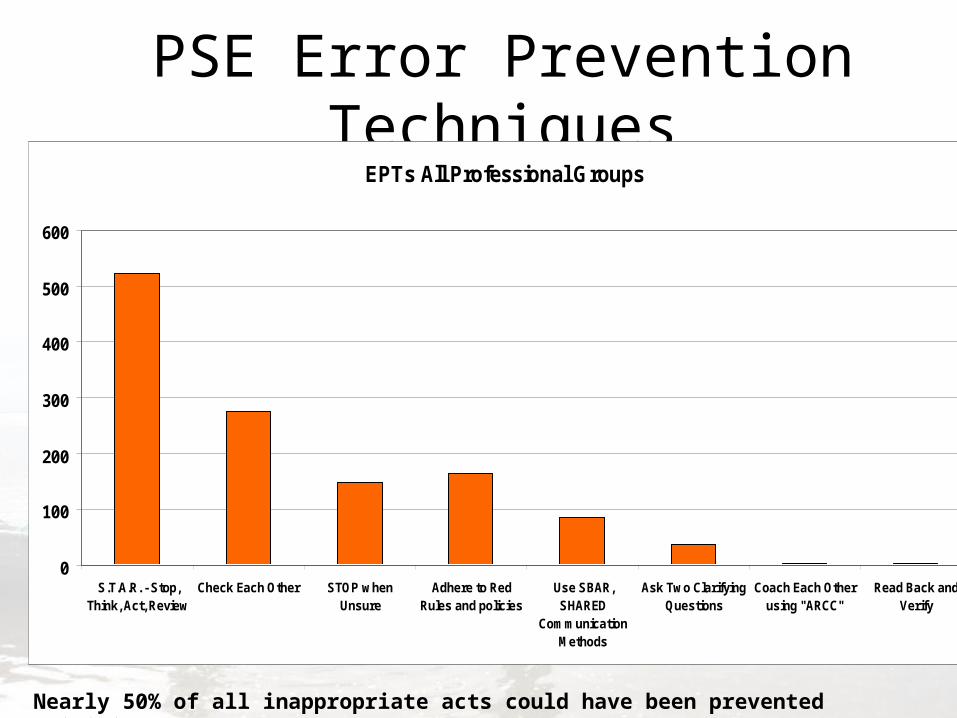
PSE Error Prevention TechniquesEPTs All Professional Groups
0
100
200
300
400
500
600
S.T.A.R. - Stop,Think, Act, Review
Check Each Other STOP whenUnsure
Adhere to RedRules and policies
Use SBAR,SHARED
CommunicationMethods
Ask Two ClarifyingQuestions
Coach Each Otherusing "ARCC"
Read Back andVerify
Nearly 50% of all inappropriate acts could have been prevented utilizing S.T.A.R.
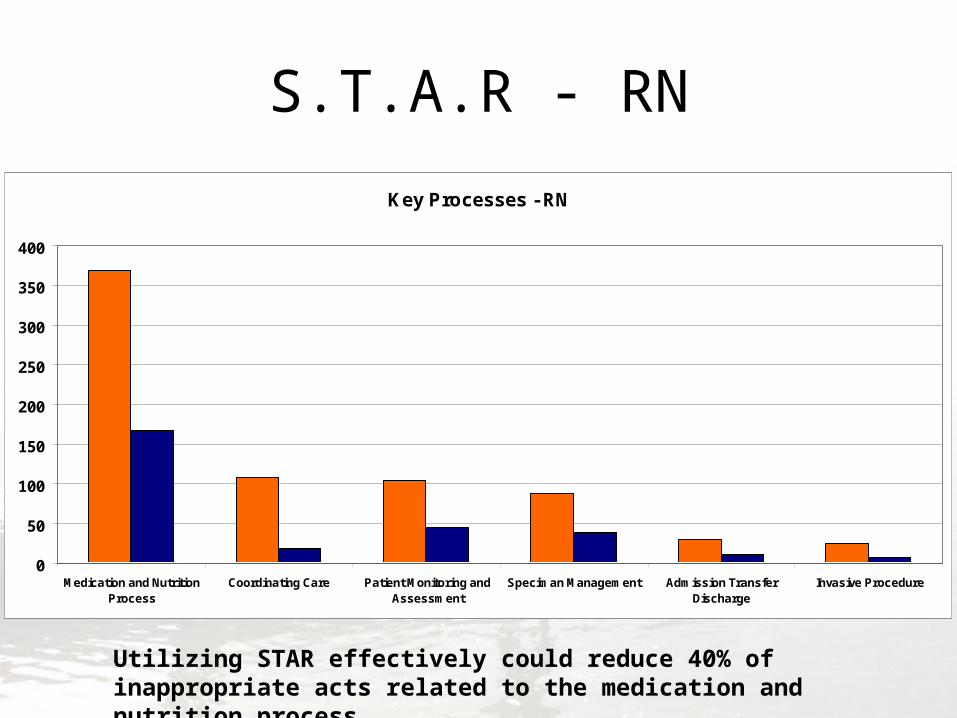
S.T.A.R - RN
Key Processes - RN
0
50
100
150
200
250
300
350
400
Medication and NutritionProcess
Coordinating Care Patient Monitoring andAssessment
Speciman Management Admission TransferDischarge
Invasive Procedure
Utilizing STAR effectively could reduce 40% of inappropriate acts related to the medication and nutrition process.
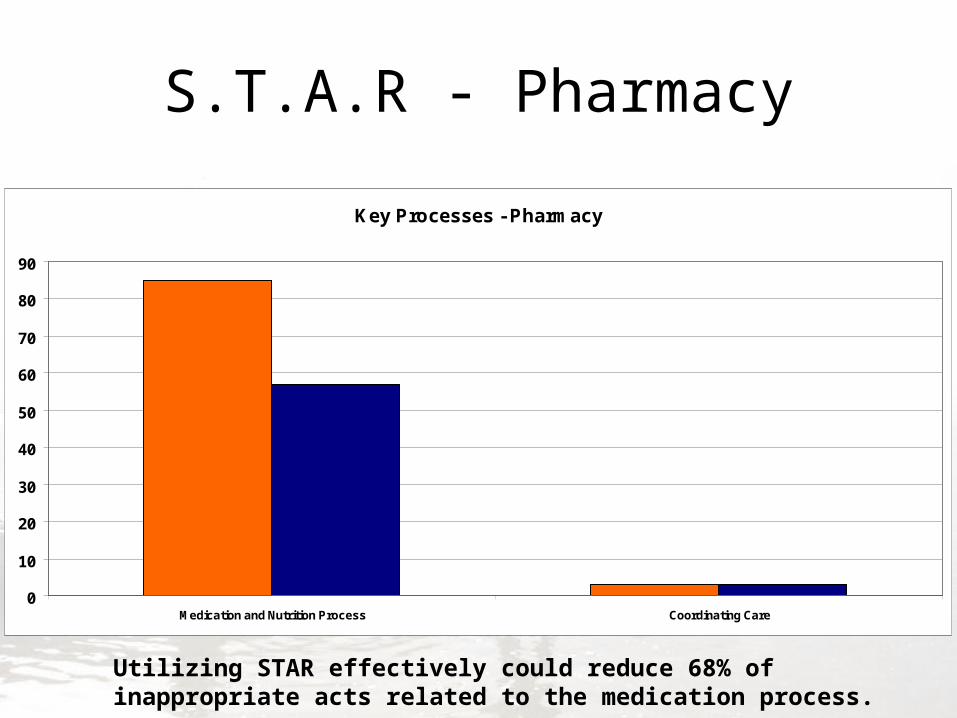
S.T.A.R - Pharmacy
Key Processes - Pharmacy
0
10
20
30
40
50
60
70
80
90
Medication and Nutrition Process Coordinating Care
Utilizing STAR effectively could reduce 68% of inappropriate acts related to the medication process.
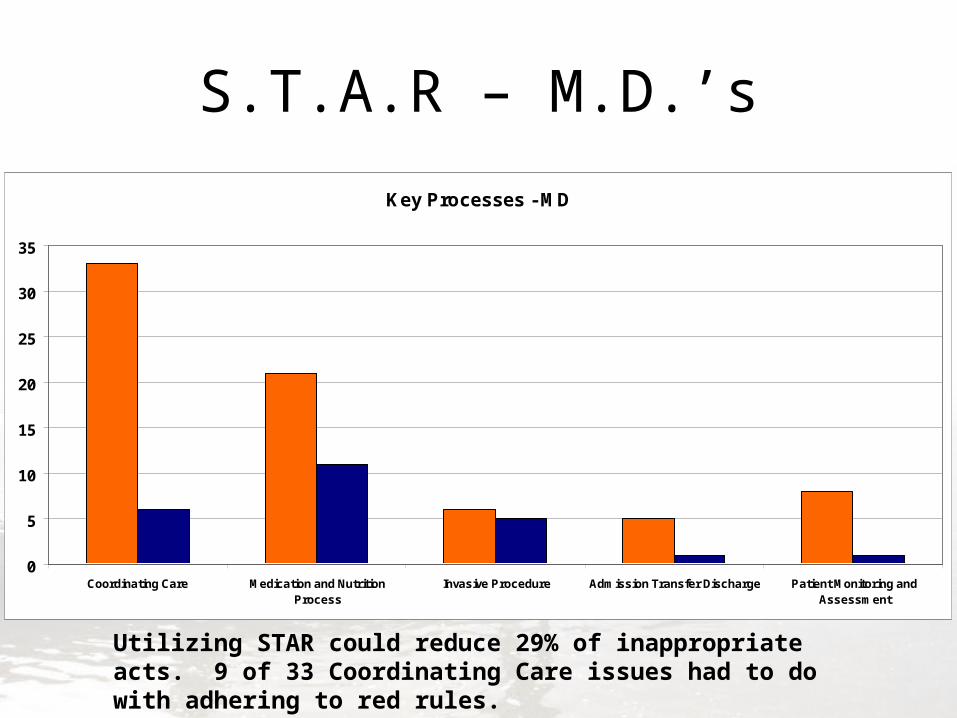
S.T.A.R – M.D.’s
Key Processes - MD
0
5
10
15
20
25
30
35
Coordinating Care Medication and NutritionProcess
Invasive Procedure Admission Transfer Discharge Patient Monitoring andAssessment
Utilizing STAR could reduce 29% of inappropriate acts. 9 of 33 Coordinating Care issues had to do with adhering to red rules.
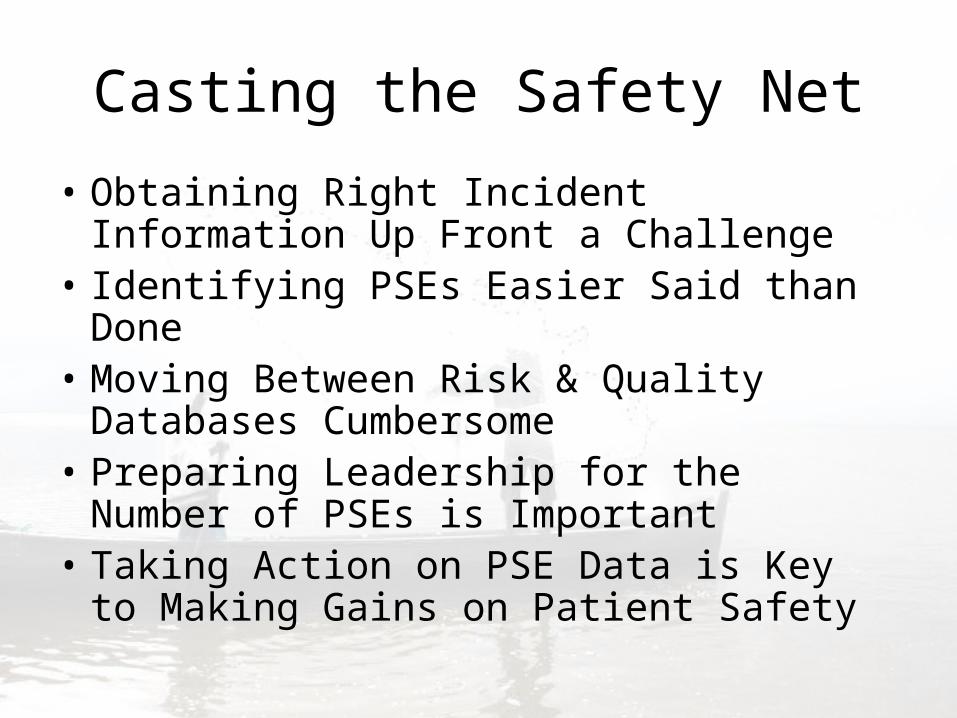
Casting the Safety Net
• Obtaining Right Incident Information Up Front a Challenge
• Identifying PSEs Easier Said than Done• Moving Between Risk & Quality
Databases Cumbersome• Preparing Leadership for the Number of
PSEs is Important• Taking Action on PSE Data is Key to
Making Gains on Patient Safety
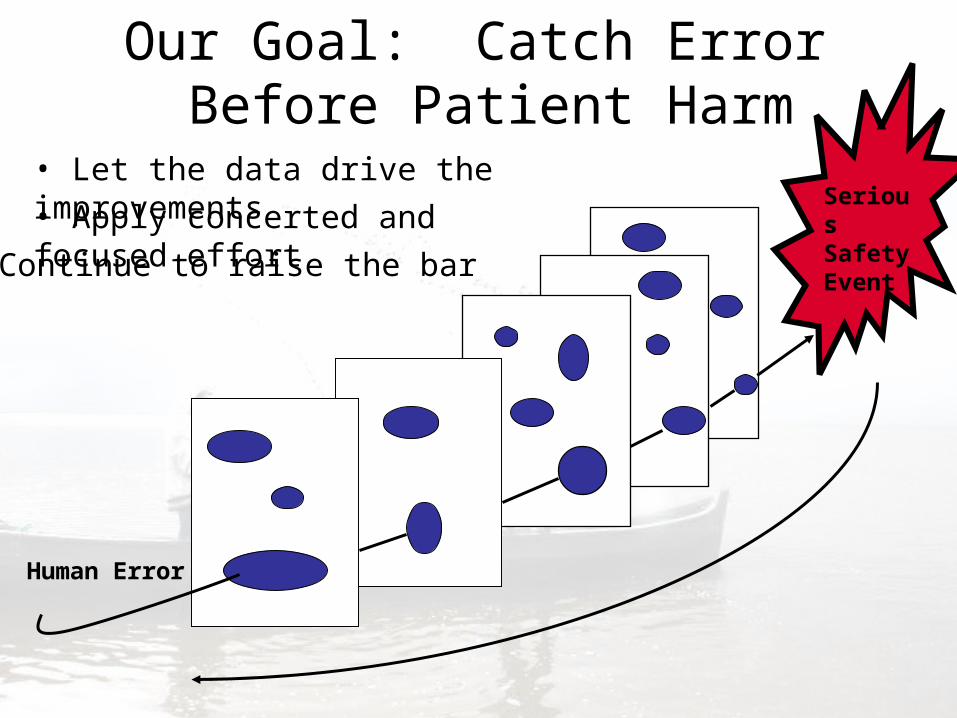
Our Goal: Catch Error Before Patient Harm
Human Error
Serious Safety Event
• Let the data drive the improvements
• Apply concerted and focused effort
• Continue to raise the bar
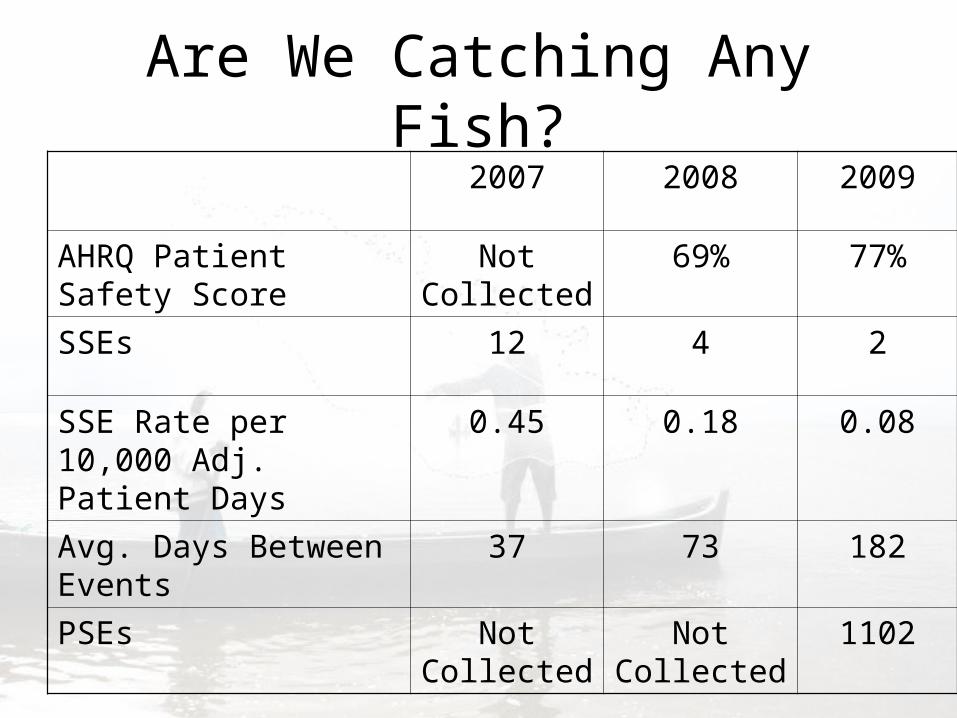
Are We Catching Any Fish?2007 2008 2009
AHRQ Patient Safety Score
Not Collected
69% 77%
SSEs 12 4 2
SSE Rate per 10,000 Adj. Patient Days
0.45 0.18 0.08
Avg. Days Between Events
37 73 182
PSEs Not Collected
Not Collected
1102
• Insert the chart
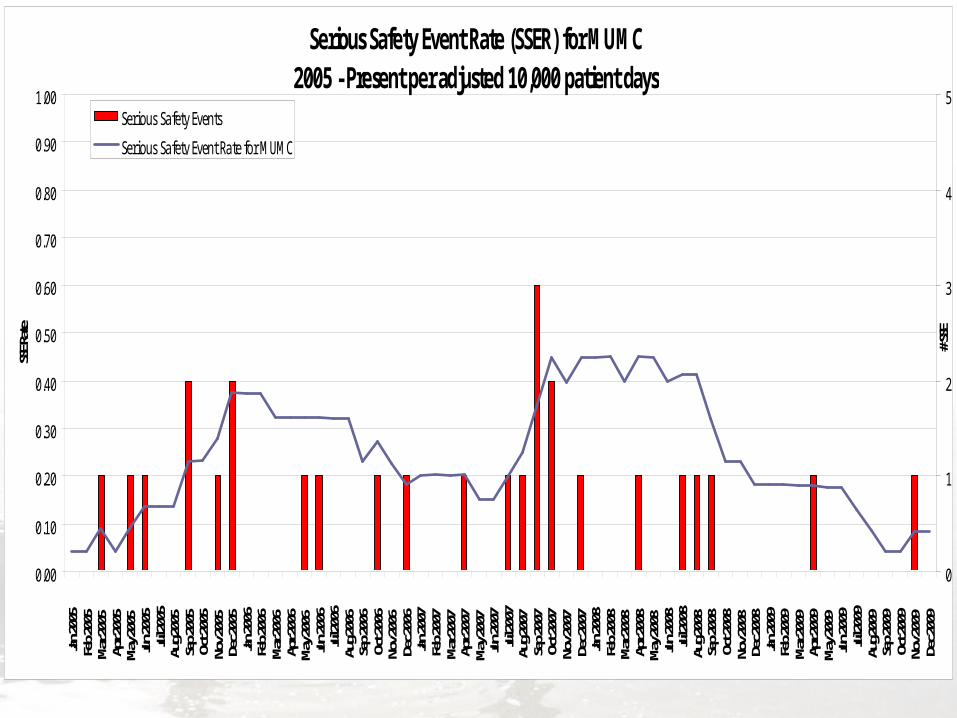
Serious Safety Event Rate (SSER) for MUMC2005 - Present per adjusted 10,000 patient days
0.00
0.10
0.20
0.30
0.40
0.50
0.60
0.70
0.80
0.90
1.00Jan
2005
Feb 2
005
Mar 2
005
Apr 2
005
May 2
005
Jun 20
05Jul
2005
Aug 2
005
Sep 2
005
Oct 2
005
Nov 2
005
Dec 2
005
Jan 20
06Fe
b 200
6Ma
r 200
6Ap
r 200
6Ma
y 200
6Jun
2006
Jul 20
06Au
g 200
6Se
p 200
6Oc
t 200
6No
v 200
6De
c 200
6Jan
2007
Feb 2
007
Mar 2
007
Apr 2
007
May 2
007
Jun 20
07Jul
2007
Aug 2
007
Sep 2
007
Oct 2
007
Nov 2
007
Dec 2
007
Jan 20
08Fe
b 200
8Ma
r 200
8Ap
r 200
8Ma
y 200
8Jun
2008
Jul 20
08Au
g 200
8Se
p 200
8Oc
t 200
8No
v 200
8De
c 200
8Jan
2009
Feb 2
009
Mar 2
009
Apr 2
009
May 2
009
Jun 20
09Jul
2009
Aug 2
009
Sep 2
009
Oct 2
009
Nov 2
009
Dec 2
009
SSE Ra
te
0
1
2
3
4
5
# SSE
Serious Safety Events
Serious Safety Event Rate for MUMC

2010 Safety Goal
Event Free Calendar
250 Days
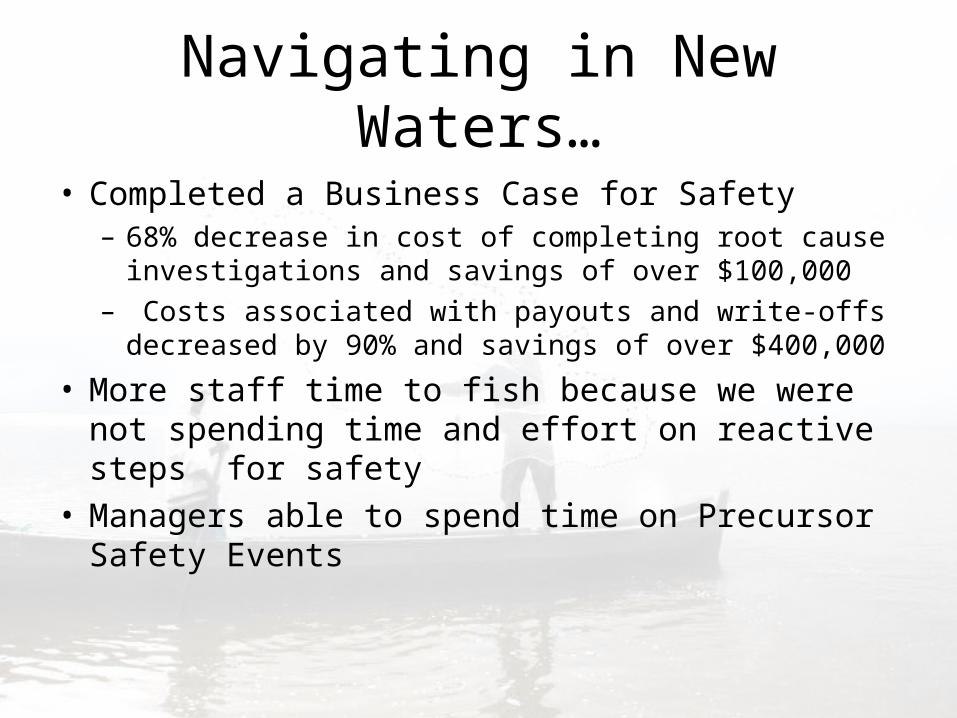
Navigating in New Waters…
• Completed a Business Case for Safety– 68% decrease in cost of completing root cause
investigations and savings of over $100,000– Costs associated with payouts and write-offs
decreased by 90% and savings of over $400,000
• More staff time to fish because we were not spending time and effort on reactive steps for safety
• Managers able to spend time on Precursor Safety Events

“That’s all I have to say about that…”
Questions?
Sherry SweekSoutheast Georgia Health System2450 Parkwood DriveBrunswick, GA [email protected]
Martha WhiteMemorial University Medical Center4750 Waters Ave, Suite 451Savannah, GA [email protected]
Contact Information
Recommended