McKinsey & Company |
Looking toward the future:Capturing growth opportunities in BC
May 28, 2013
Business Council of British Columbia
Dominic BartonGlobal Managing Director, McKinsey & Company

McKinsey & Company | 1
LNG – Accelerate development of export capacity to Asia (from 6 Mtpa to at least 18 Mtpa by 2018) before new US and Australian sources come online 22
Gateway economy – Increase share of Asian trade from 5% to 10+% of NA total with Prince Rupert expansion. Build up broader economy with regional HQs of Asian companies, Asia-focused professional services (e.g., law, accounting),and transport services
11
Natural resources (e.g., forestry, coal, copper) – Invest in critical areas to ensure BC at least maintains share as Asia grows, despite recovery in US exports33
Direct engagement – Create cabinet-level position on Asia to signal focus, establish business exchange programs, and convene a tri-sector task force on Asia77
Agrifood – Develop global champions in high-demand protein crops (e.g., beef, seafood, dairy) and processed food to establish BC as net food exporter. Emphasize brand – food safety, quality, and luxury items
44
Education – Establish as top 3 export industry (from 4% to 9% of total exports). Convert at least 60% of language and vocational students to university/college students
55
Tourism – Establish BC as top 3 Western destination for Chinese tourists(70% increase to 375k visits per year). Simplify visa requirement (i.e., faster, less costly, and less complex) for short stays from target markets
66
Seven priorities for BC to pursue

McKinsey & Company | 2
Overview
Five global trends
Opportunities in Asia
BC strengths and opportunities
1
2
3
Lessons from other cities and countries4
McKinsey & Company | 3
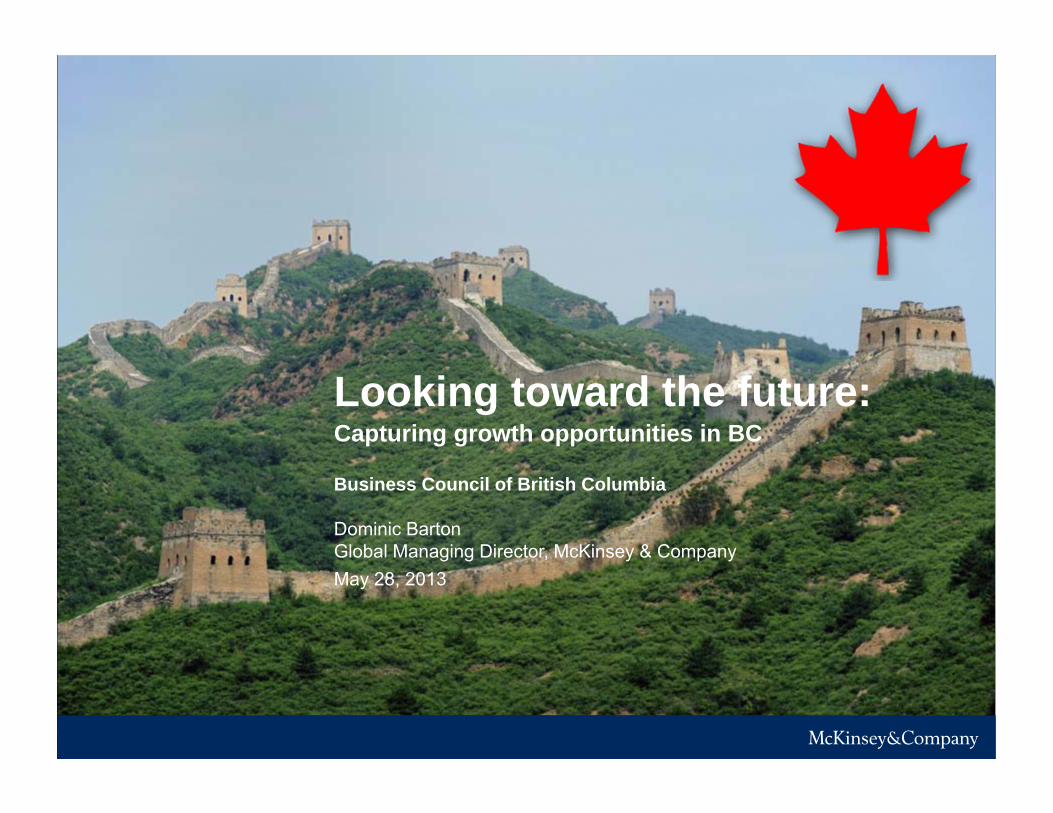
Five mega-trends reshaping the global economy
Pricing the planet
The productivity imperative
The market state
The great rebalancing
The global grid
McKinsey & Company | 4
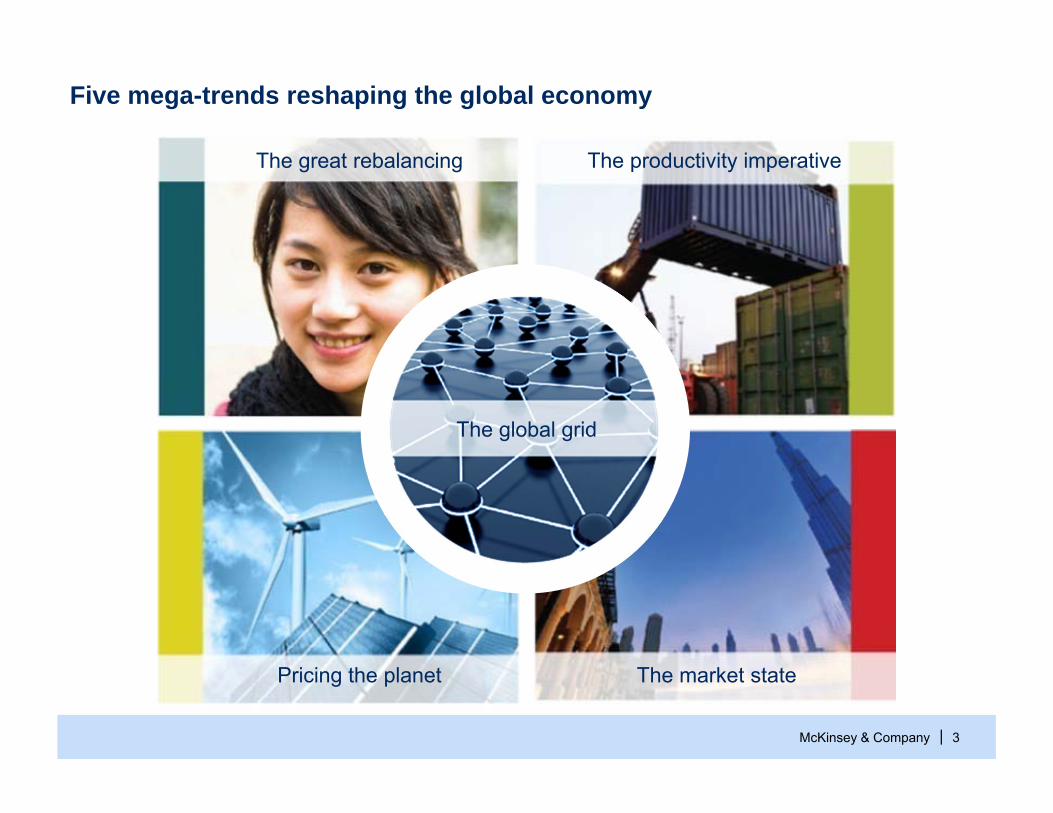
Massive urbanization is underway—old Shanghai
SOURCE: skylander.net
McKinsey & Company | 5
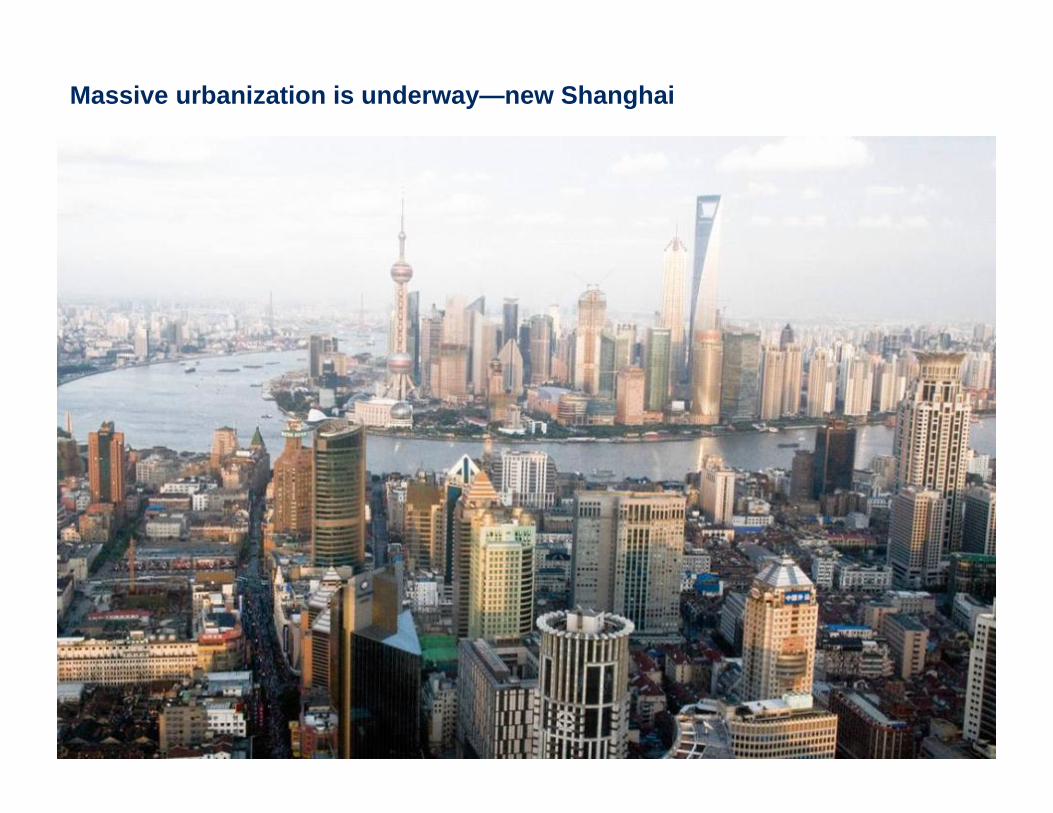
Massive urbanization is underway—new Shanghai
McKinsey & Company | 6
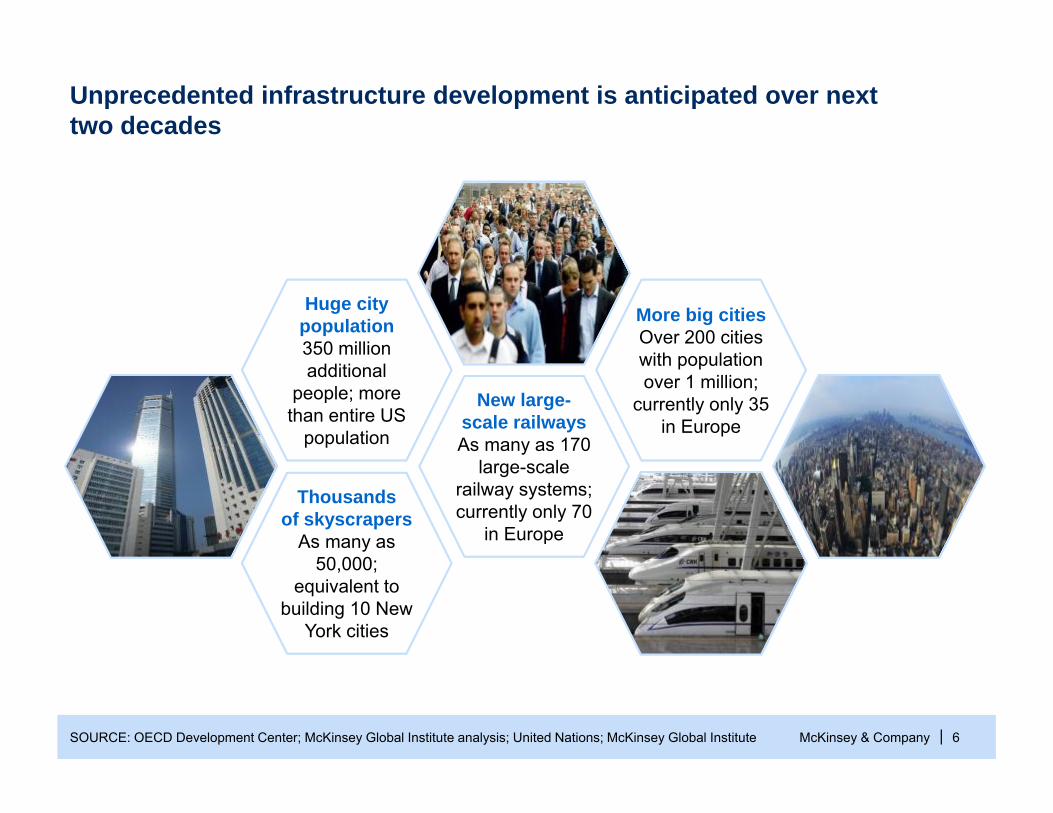
Unprecedented infrastructure development is anticipated over nexttwo decades
SOURCE: OECD Development Center; McKinsey Global Institute analysis; United Nations; McKinsey Global Institute
New large-scale railwaysAs many as 170
large-scale railway systems; currently only 70
in Europe
More big citiesOver 200 cities with population over 1 million;
currently only 35 in Europe
Huge city population 350 million additional
people; more than entire US
population
Thousands of skyscrapers
As many as 50,000;
equivalent to building 10 New
York cities
McKinsey & Company | 7
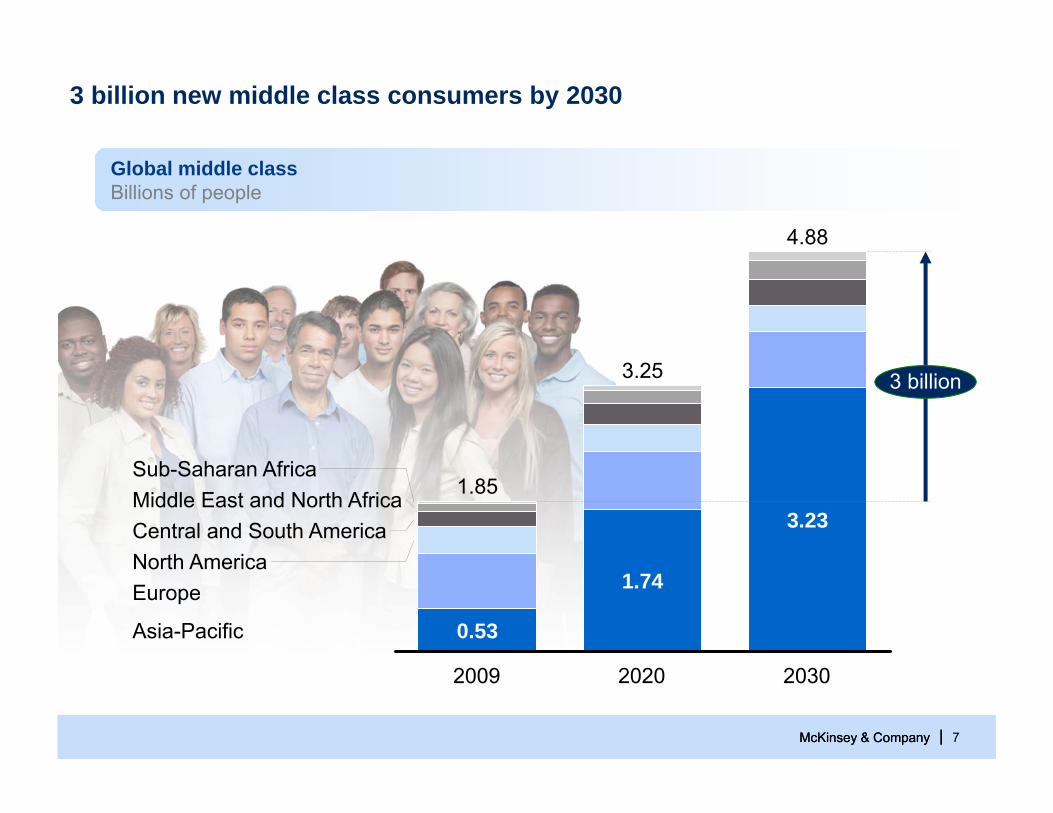
3 billion new middle class consumers by 2030
Global middle classBillions of people
4.88
3 billion
Asia-Pacific
EuropeNorth AmericaCentral and South AmericaMiddle East and North AfricaSub-Saharan Africa
2030
3.23
2020
3.25
1.74
2009
1.85
0.53
McKinsey & Company |
McKinsey & Company | 8
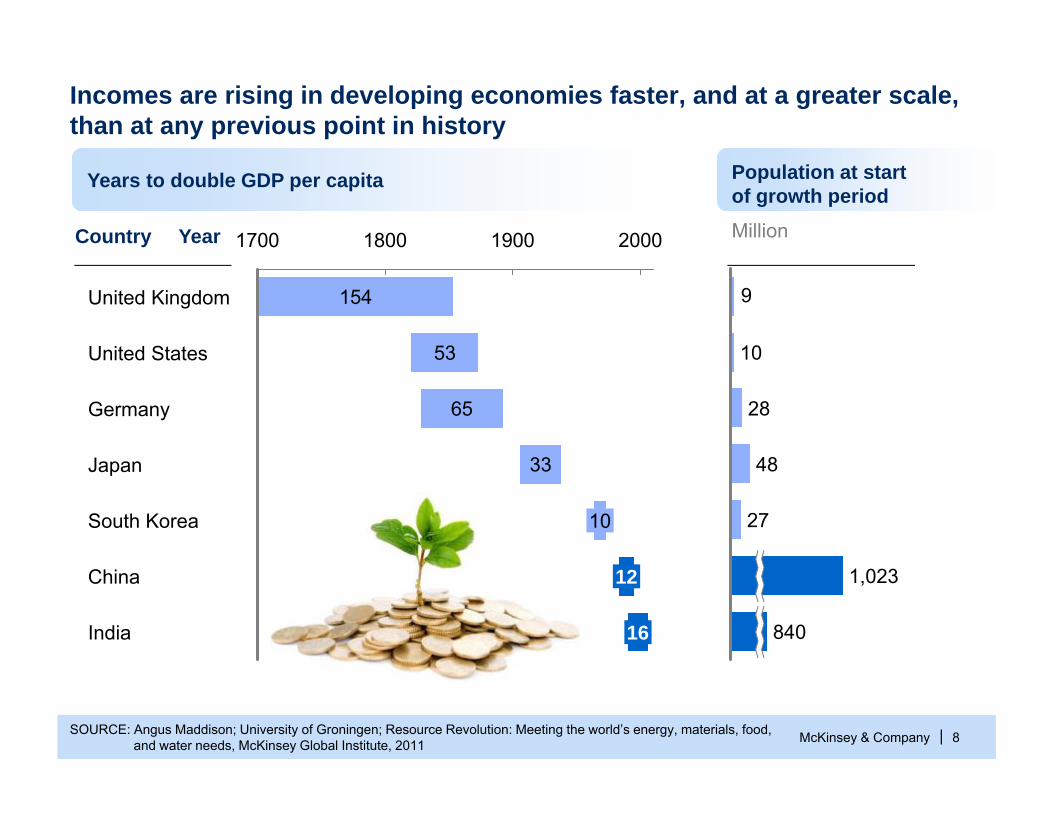
Incomes are rising in developing economies faster, and at a greater scale, than at any previous point in history
SOURCE: Angus Maddison; University of Groningen; Resource Revolution: Meeting the world’s energy, materials, food, and water needs, McKinsey Global Institute, 2011
9
840
1,023
27
48
28
10
Country
154
53
65
33
1700 1800 1900 2000
India
12
16
China
South Korea 10
Japan
Germany
United States
United Kingdom
Year
Population at start of growth period
Years to double GDP per capita
Million
McKinsey & Company | 9SOURCE: McKinsey Global Institute Cityscope 2.0
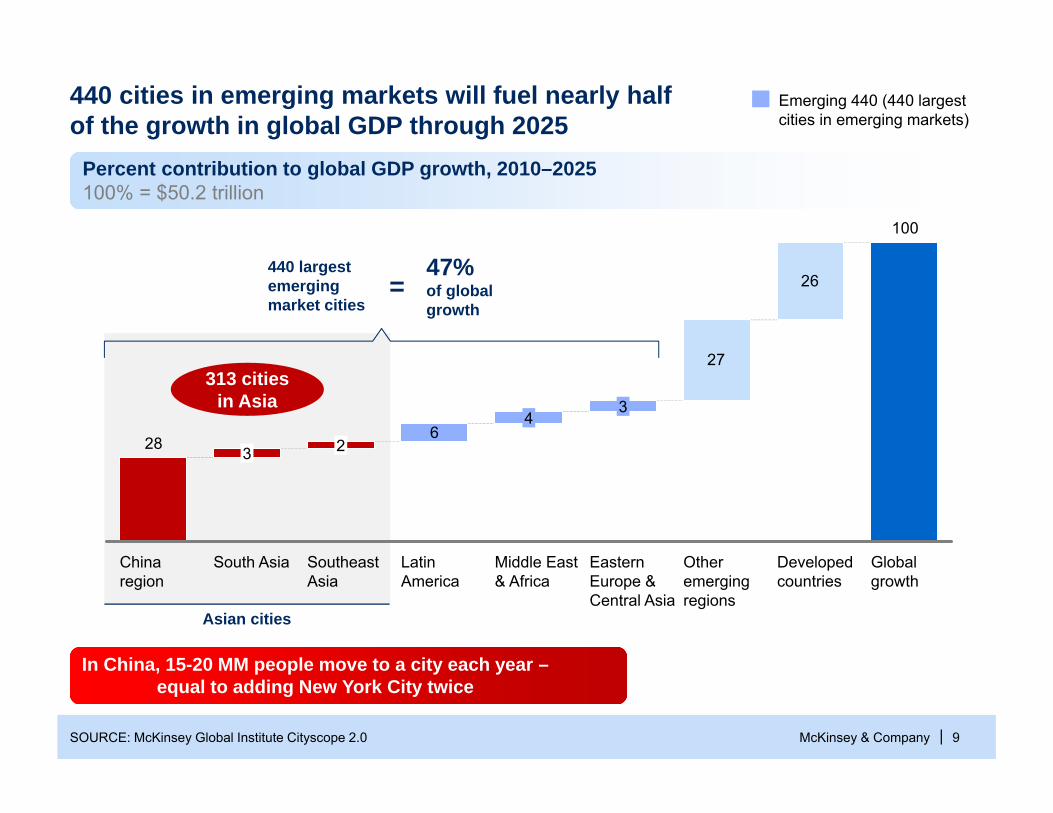
Percent contribution to global GDP growth, 2010–2025100% = $50.2 trillion
6
27
26
100
28
Global growth
Eastern Europe & Central Asia
Developed countries
Other emerging regions
2
3
Middle East & Africa
4
Latin America
SoutheastAsia
South Asia
3
China region
Asian cities
Emerging 440 (440 largestcities in emerging markets)
440 cities in emerging markets will fuel nearly half of the growth in global GDP through 2025
47%of global growth
440 largest emerging market cities
=
In China, 15-20 MM people move to a city each year –equal to adding New York City twice
313 cities in Asia
McKinsey & Company | 10
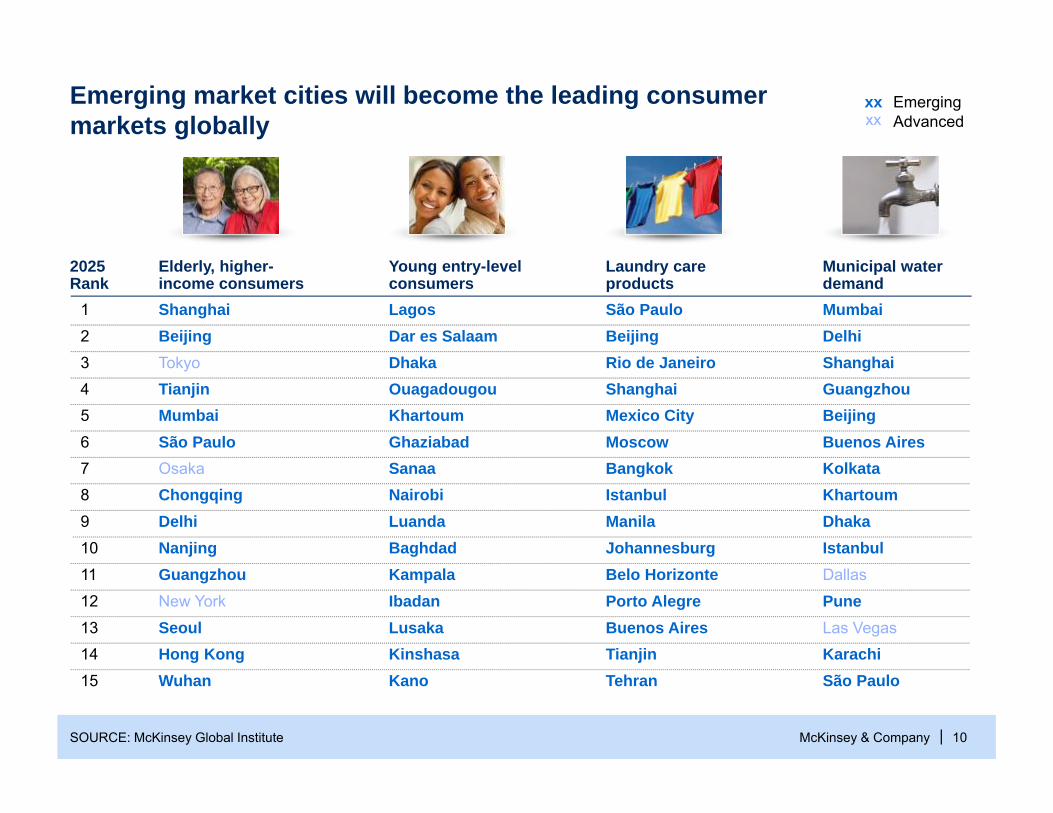
Emerging market cities will become the leading consumer markets globally
EmergingAdvanced
2025Rank
1
2
345
678
9
10
11
12
1314
15
Elderly, higher-income consumersShanghaiBeijingTokyoTianjinMumbaiSão PauloOsakaChongqingDelhiNanjingGuangzhouNew York
SeoulHong KongWuhan
xxxx
Municipal water demandMumbaiDelhiShanghaiGuangzhouBeijingBuenos AiresKolkataKhartoumDhakaIstanbulDallas
PuneLas VegasKarachiSão Paulo
Young entry-level consumersLagosDar es SalaamDhakaOuagadougouKhartoumGhaziabadSanaaNairobiLuandaBaghdadKampalaIbadanLusakaKinshasaKano
Laundry care productsSão Paulo Beijing Rio de Janeiro ShanghaiMexico City Moscow Bangkok Istanbul Manila Johannesburg Belo Horizonte Porto AlegreBuenos AiresTianjinTehran
SOURCE: McKinsey Global Institute
McKinsey & Company | 11
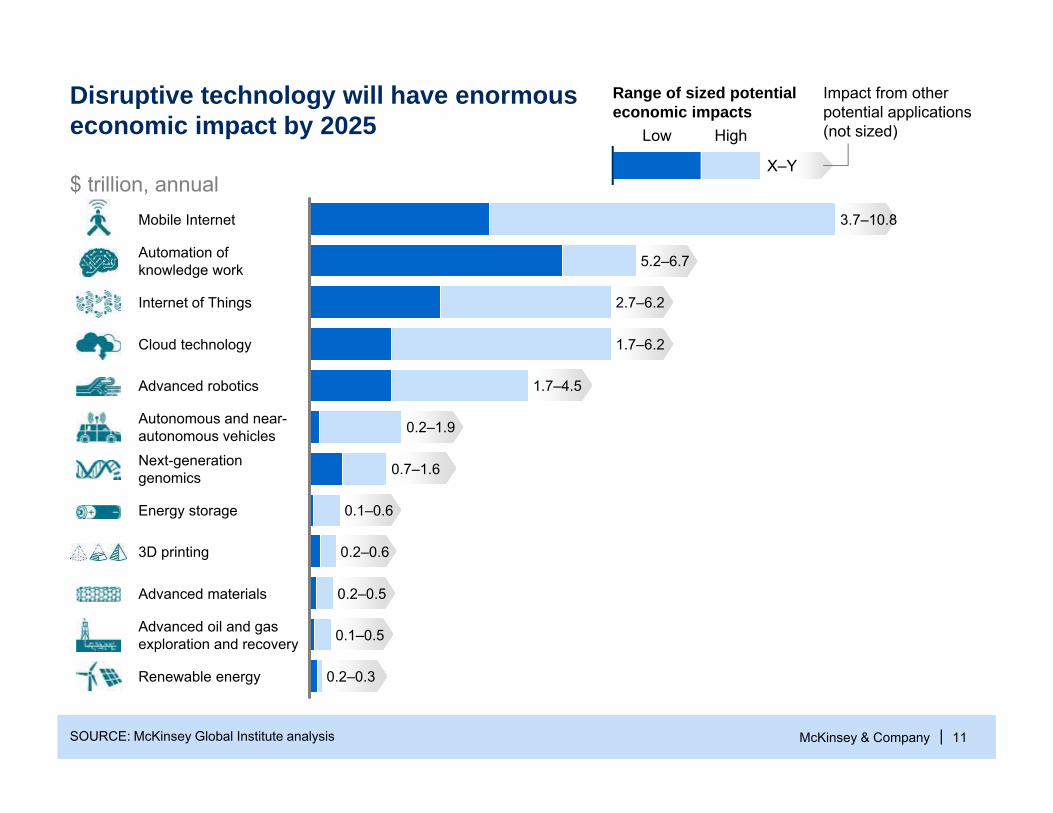
Disruptive technology will have enormouseconomic impact by 2025
SOURCE: McKinsey Global Institute analysis
Range of sized potential economic impacts
Impact from other potential applications (not sized)Low High
X–Y$ trillion, annual
Renewable energy 0.2–0.3
Advanced oil and gasexploration and recovery 0.1–0.5
Advanced materials 0.2–0.5
3D printing 0.2–0.6
Energy storage 0.1–0.6
Next-generationgenomics 0.7–1.6
Autonomous and near-autonomous vehicles 0.2–1.9
Advanced robotics 1.7–4.5
Cloud technology 1.7–6.2
Internet of Things 2.7–6.2
Automation ofknowledge work 5.2–6.7
Mobile Internet 3.7–10.8
McKinsey & Company | 12
100
1,000
10,000
100,000
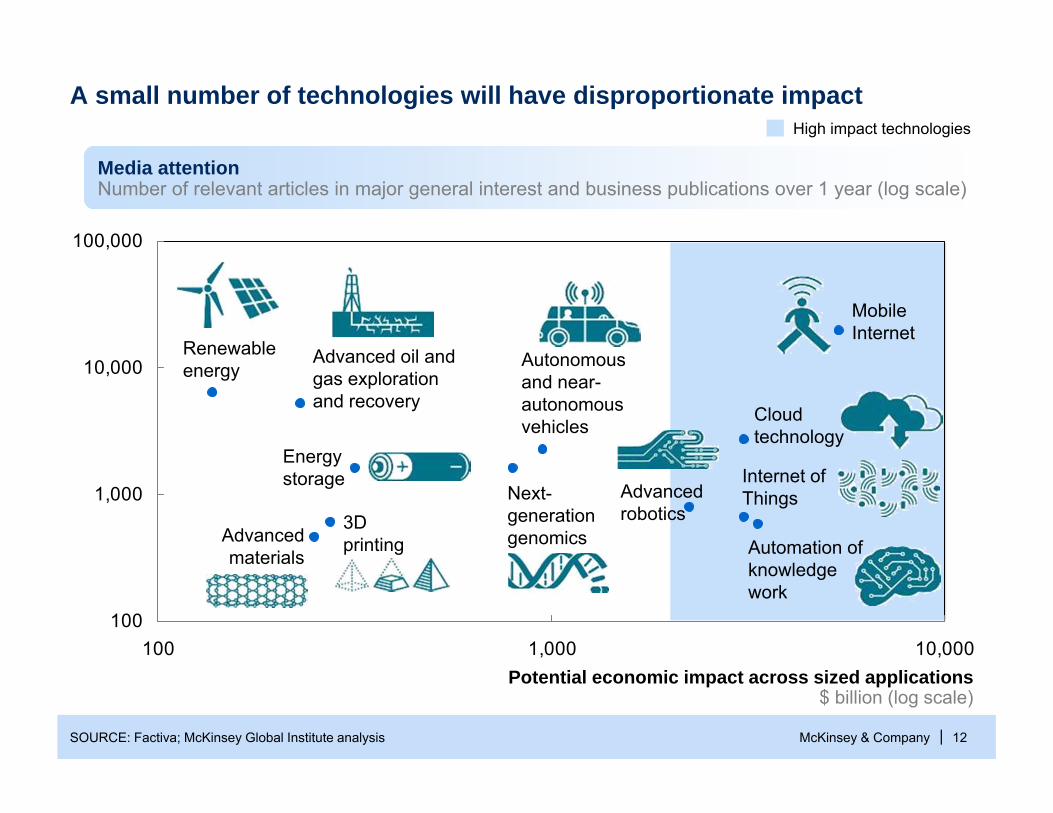
100 1,000 10,000Potential economic impact across sized applications
$ billion (log scale)
A small number of technologies will have disproportionate impact
SOURCE: Factiva; McKinsey Global Institute analysis
Mobile Internet
Internet ofThingsAdvanced
robotics
Autonomous and near-autonomous vehicles Cloud
technology
Automation of knowledge work
High impact technologies
Next-generation genomics
Energy storage
3DprintingAdvanced
materials
Advanced oil and gas exploration and recovery
Renewable energy
Media attentionNumber of relevant articles in major general interest and business publications over 1 year (log scale)
McKinsey & Company | 1313
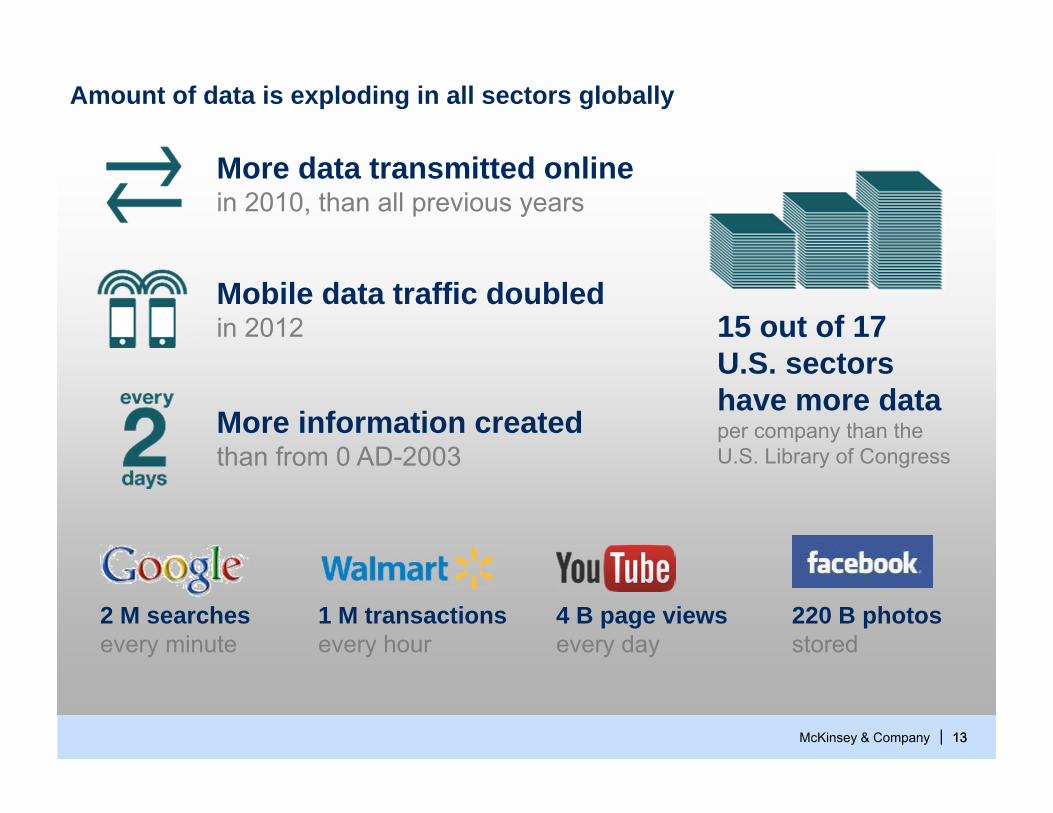
Amount of data is exploding in all sectors globally
220 B photosstored
1 M transactionsevery hour
2 M searchesevery minute
4 B page viewsevery day
Mobile data traffic doubled in 2012
More data transmitted online in 2010, than all previous years
More information created than from 0 AD-2003
15 out of 17 U.S. sectorshave more data per company than the U.S. Library of Congress
McKinsey & Company | 1414
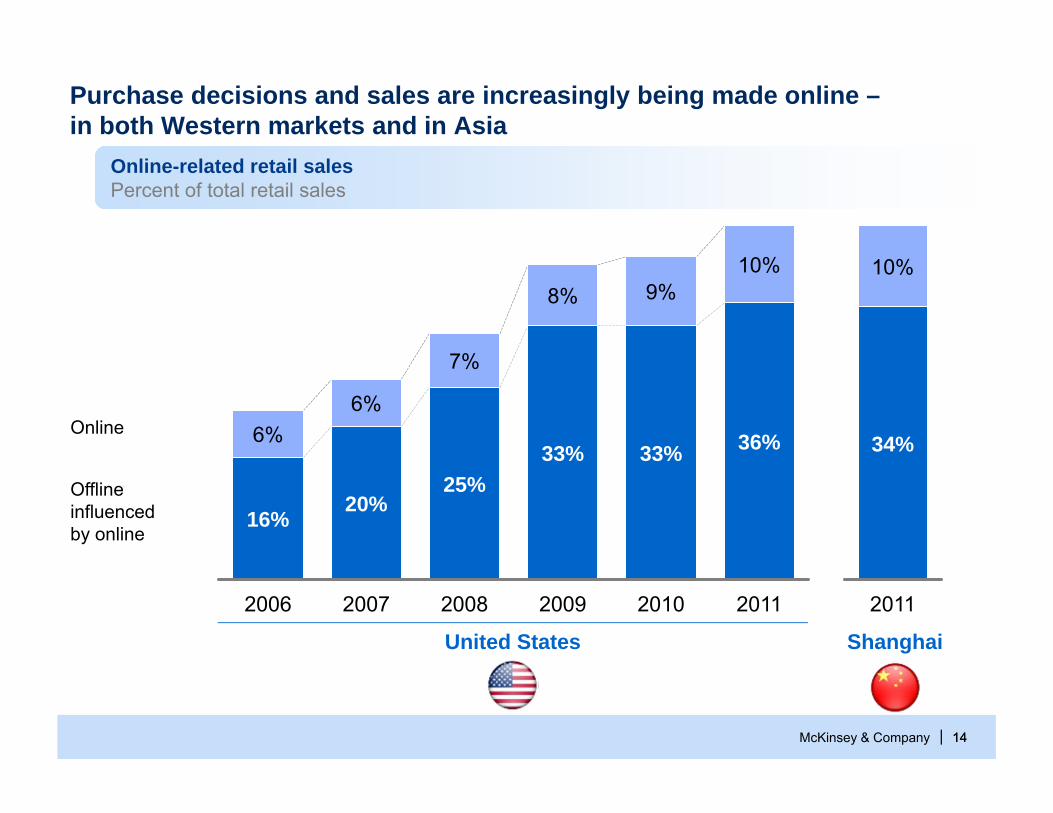
33%
8%
6%
2006
10%
2010
33%
9%
2009
36%
2011
16%
6%
2007
7%
25%
2008
20%
2011
34%
10%
Purchase decisions and sales are increasingly being made online –in both Western markets and in Asia
Online
Offline influenced by online
United States Shanghai
Online-related retail salesPercent of total retail sales
McKinsey & Company | 15
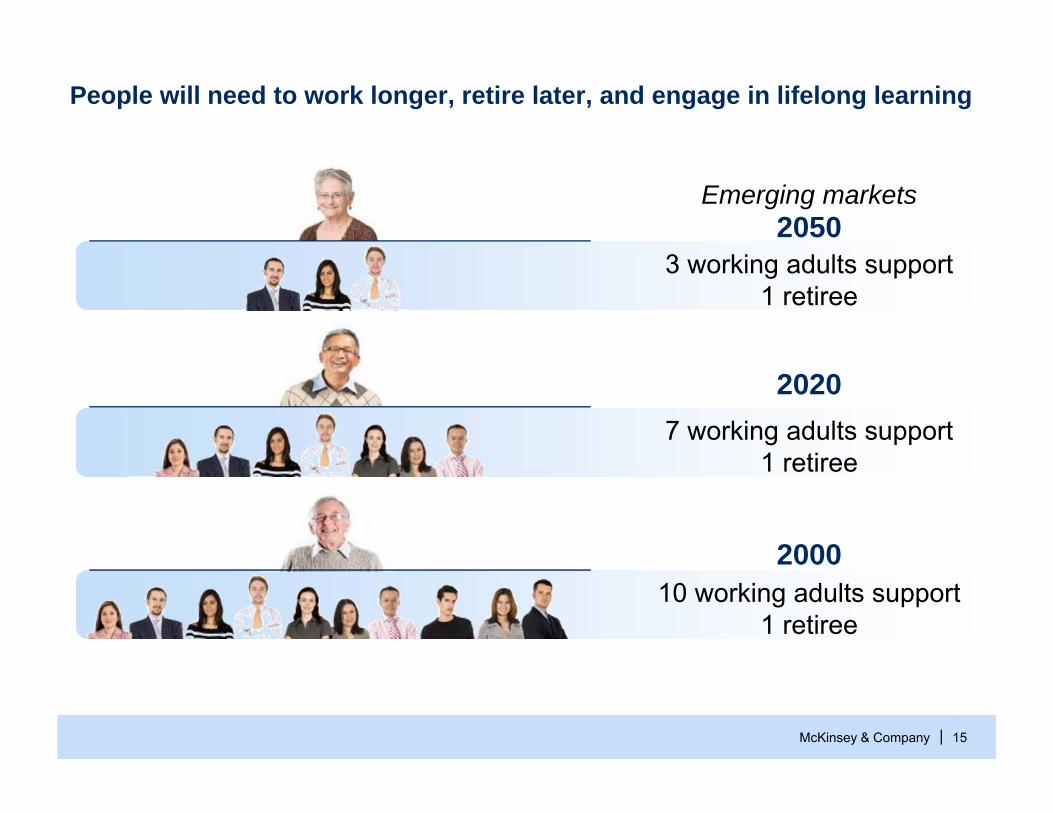
People will need to work longer, retire later, and engage in lifelong learning
10 working adults support 1 retiree
2000
7 working adults support 1 retiree
2020
3 working adults support 1 retiree
2050Emerging markets
McKinsey & Company | 16
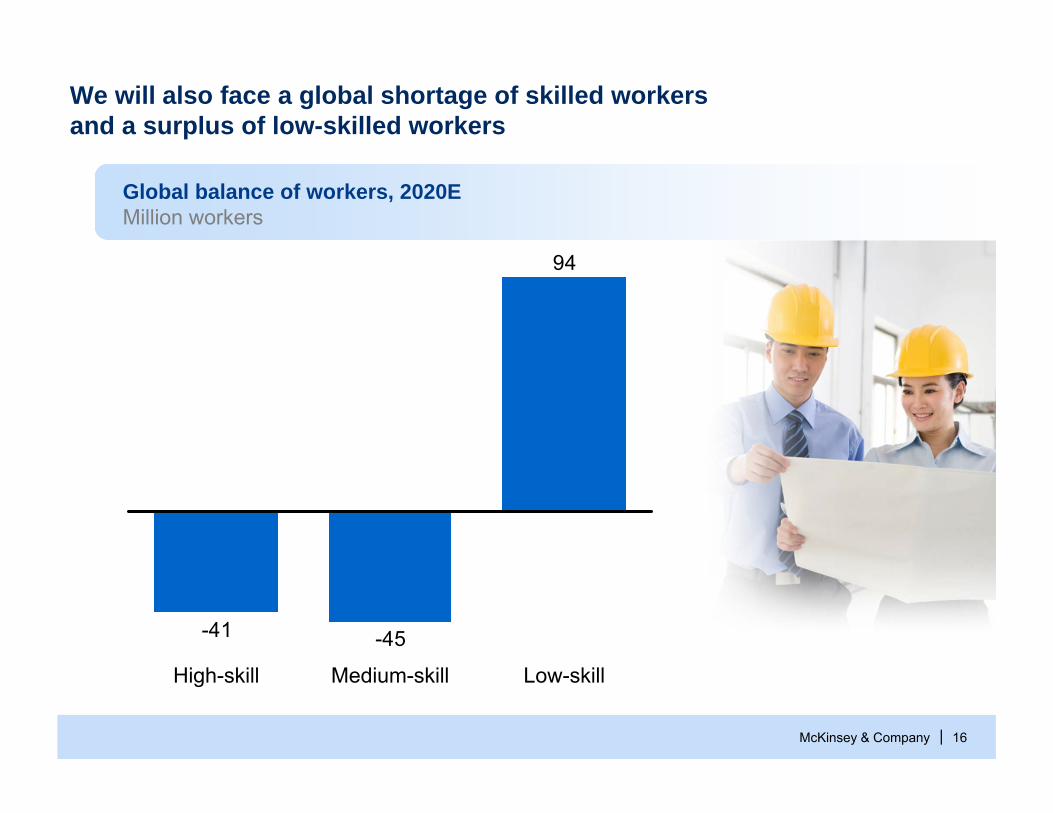
We will also face a global shortage of skilled workersand a surplus of low-skilled workers
94
-45-41
Low-skillMedium-skillHigh-skill
Global balance of workers, 2020EMillion workers
McKinsey & Company | 17
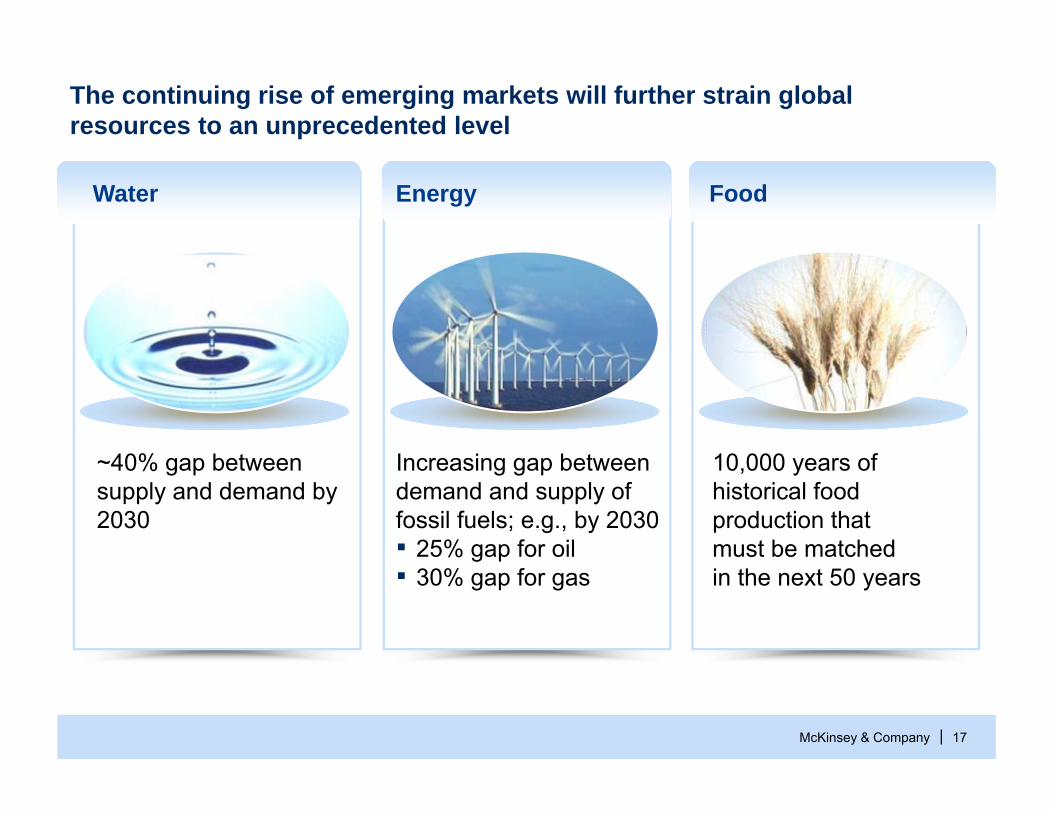
The continuing rise of emerging markets will further strain global resources to an unprecedented level
Water FoodEnergy
Increasing gap between demand and supply of fossil fuels; e.g., by 2030 ▪ 25% gap for oil ▪ 30% gap for gas
10,000 years of historical food production thatmust be matchedin the next 50 years
~40% gap between supply and demand by 2030
McKinsey & Company | 18
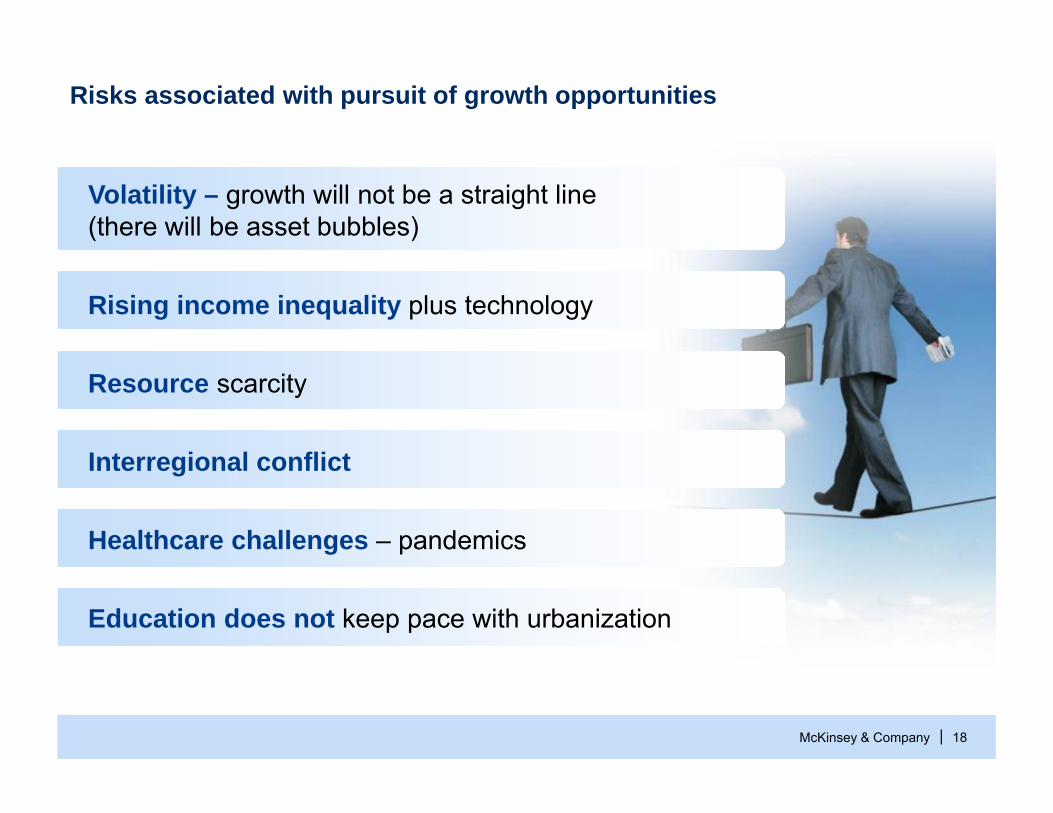
Volatility – growth will not be a straight line(there will be asset bubbles)
Rising income inequality plus technology
Resource scarcity
Interregional conflict
Healthcare challenges – pandemics
Education does not keep pace with urbanization
Risks associated with pursuit of growth opportunities
McKinsey & Company | 19
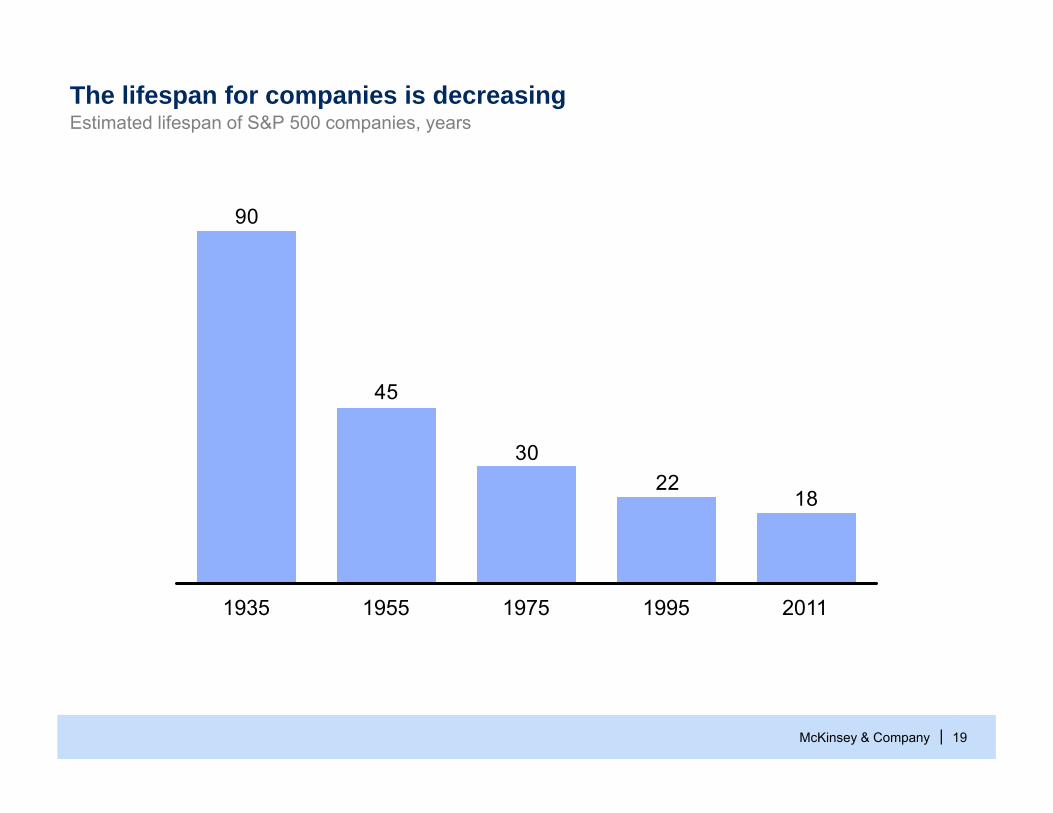
The lifespan for companies is decreasingEstimated lifespan of S&P 500 companies, years
1822
30
45
90
20111995197519551935
McKinsey & Company | 20
Overview
Five global trends
Opportunities in Asia
BC strengths and opportunities
1
2
3
Lessons from other cities and countries4
McKinsey & Company | 2121
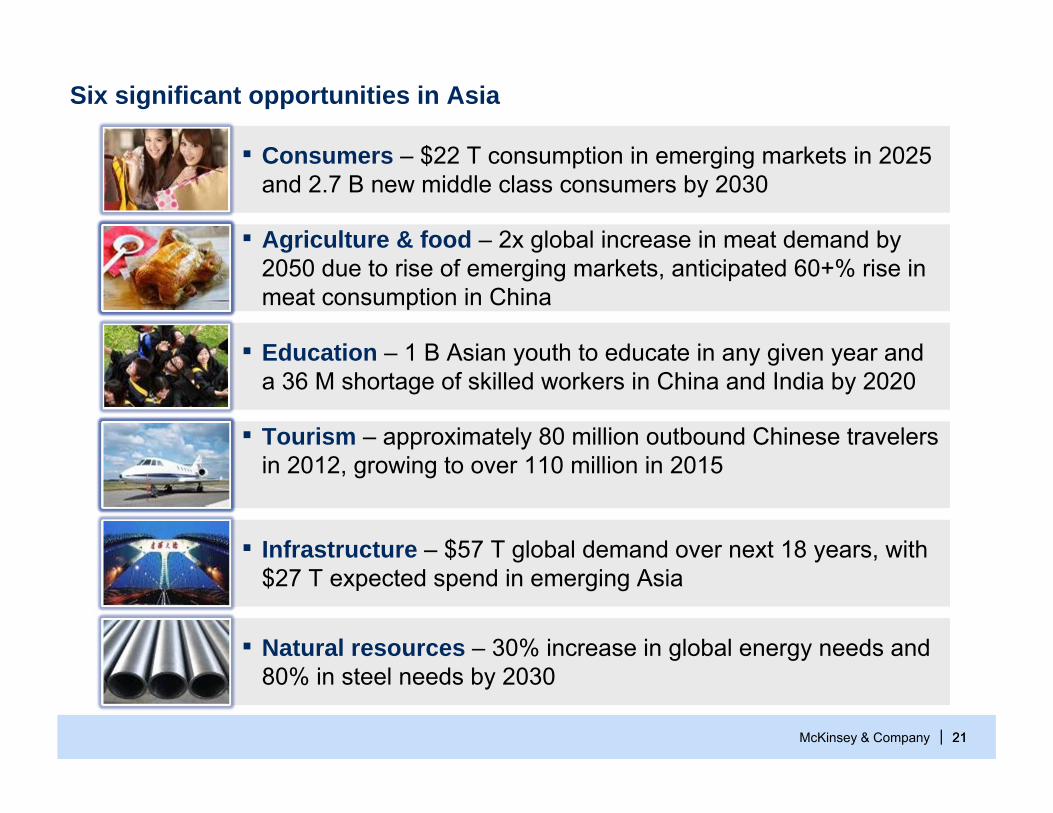
Six significant opportunities in Asia
▪ Consumers – $22 T consumption in emerging markets in 2025 and 2.7 B new middle class consumers by 2030
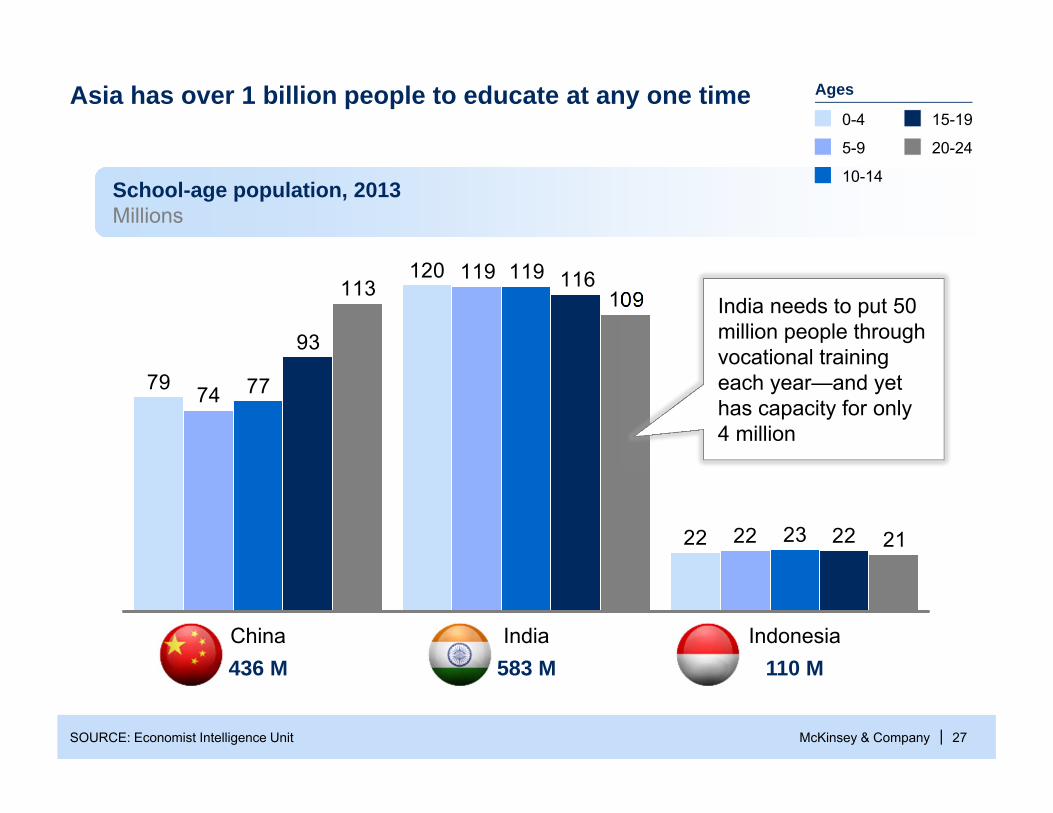
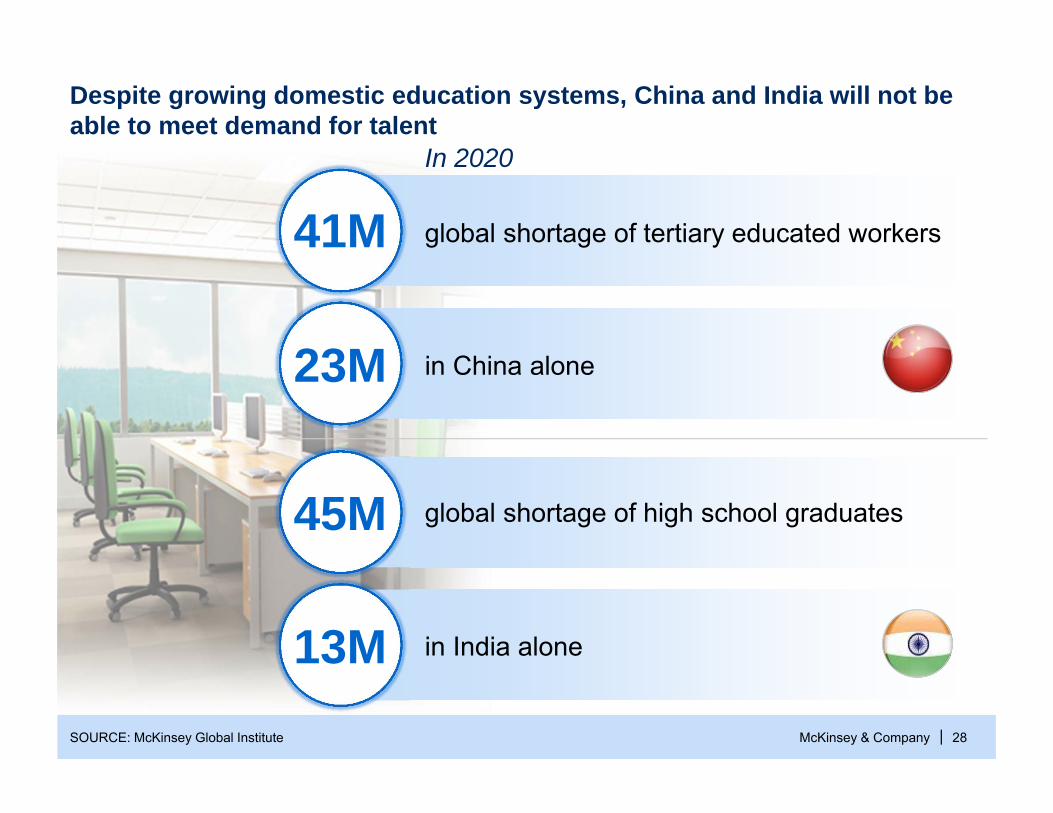
▪ Education – 1 B Asian youth to educate in any given year and a 36 M shortage of skilled workers in China and India by 2020
▪ Infrastructure – $57 T global demand over next 18 years, with $27 T expected spend in emerging Asia
▪ Tourism – approximately 80 million outbound Chinese travelers in 2012, growing to over 110 million in 2015
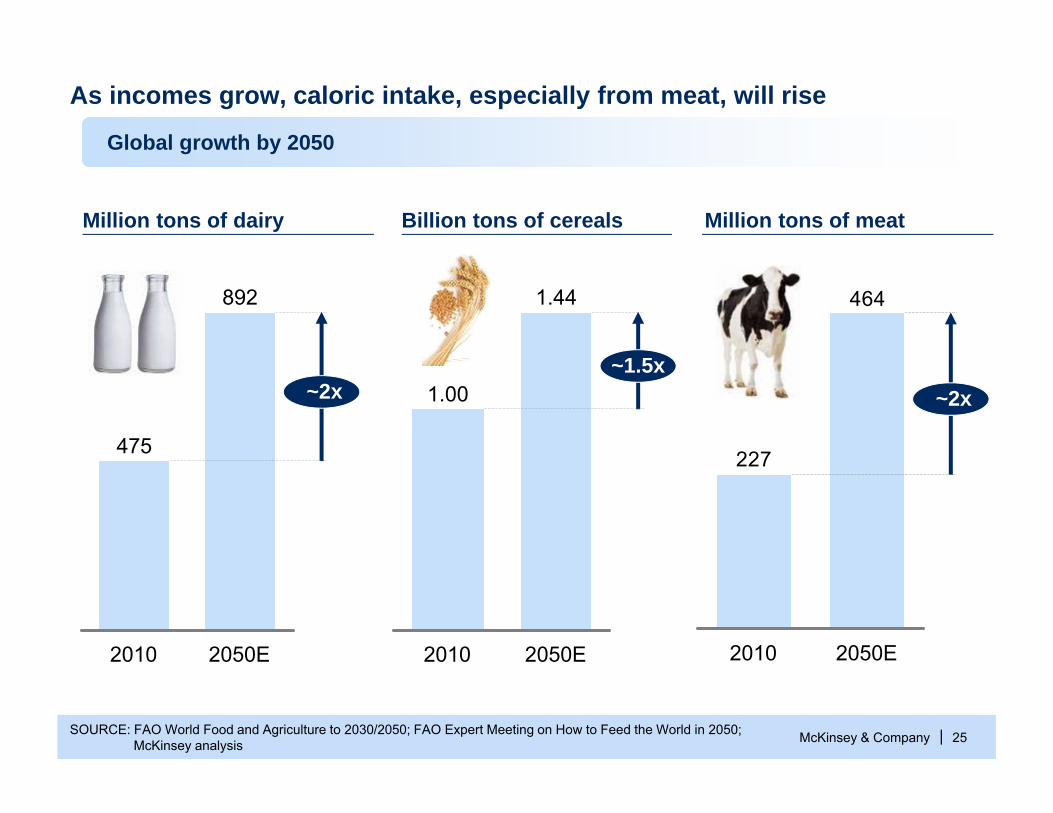
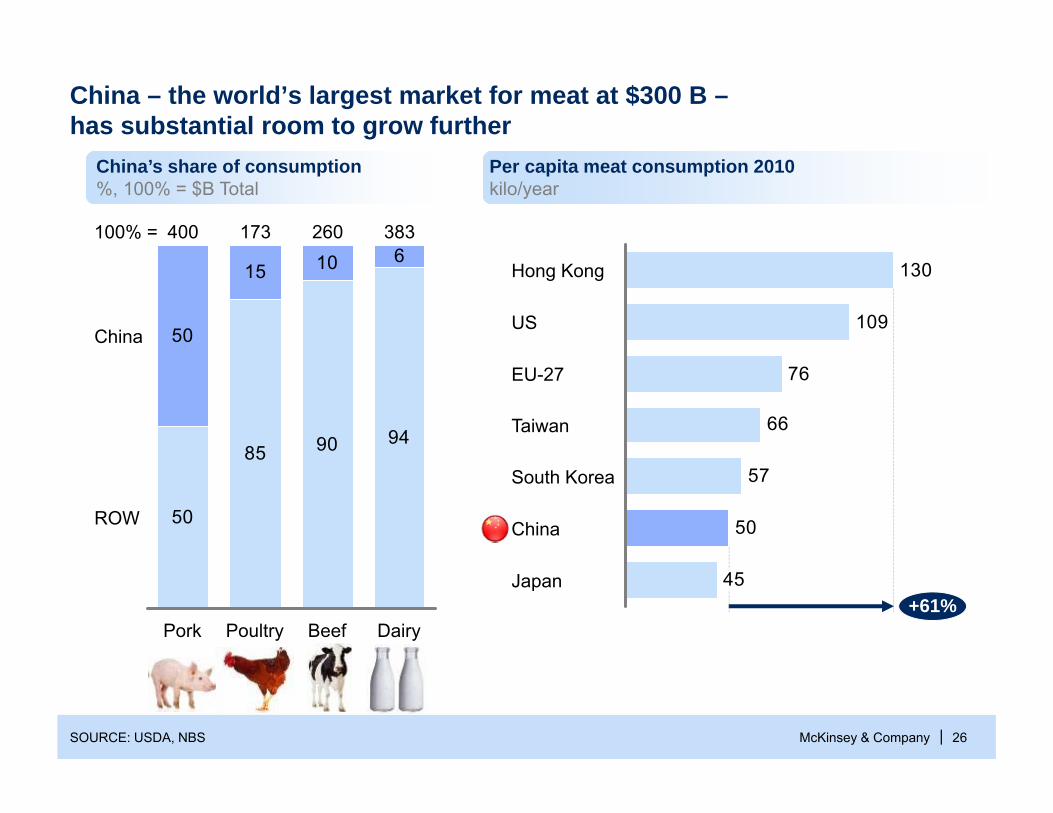
▪ Agriculture & food – 2x global increase in meat demand by 2050 due to rise of emerging markets, anticipated 60+% rise in meat consumption in China
▪ Natural resources – 30% increase in global energy needs and 80% in steel needs by 2030
McKinsey & Company | 22
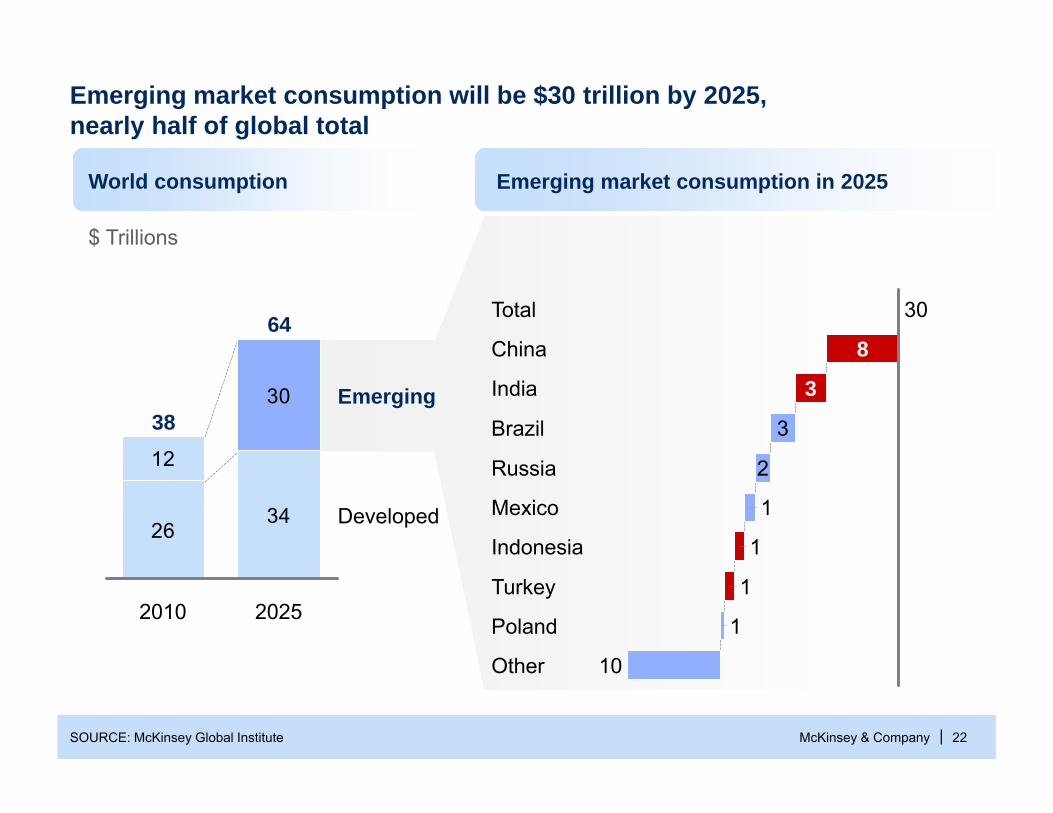
Emerging market consumption will be $30 trillion by 2025,nearly half of global total
$ Trillions
2634
12
30
Developed
Emerging
2025
64
2010
38 Brazil 3
India
10
China 8
Total 30
1
Other
Poland 1
Turkey 1
Indonesia 1
Mexico
Russia 2
3
SOURCE: McKinsey Global Institute
World consumption Emerging market consumption in 2025
McKinsey & Company | 23SOURCE: McKinsey analysis; Global Insight; Economist Intelligence Unit
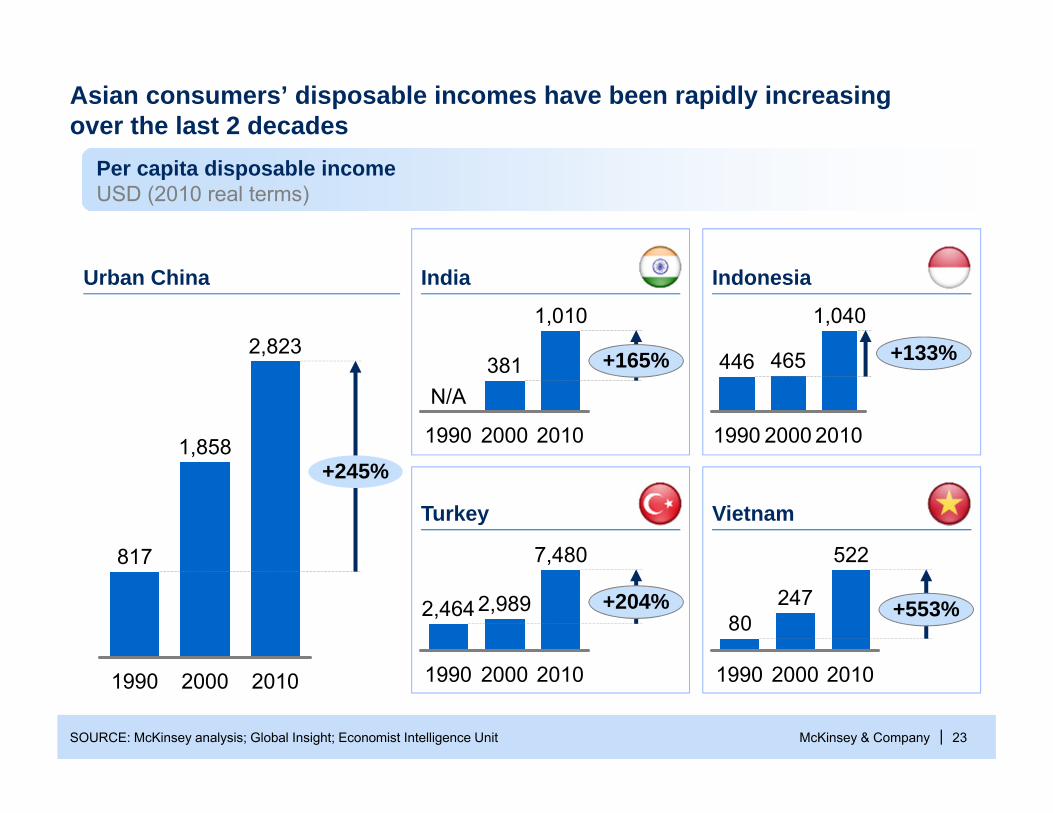
2,823
2000
1,858
1990
817
2010
+245%
Asian consumers’ disposable incomes have been rapidly increasingover the last 2 decades
+165%
1990
N/A
20102000
381
1,010
1990
+133%446
2000
465
1,040
2010
Indonesia
+204%
20102000
2,464
7,480
2,989
1990
80247
522
201020001990
+553%
India
Turkey Vietnam
Urban China
Per capita disposable incomeUSD (2010 real terms)
McKinsey & Company | 24
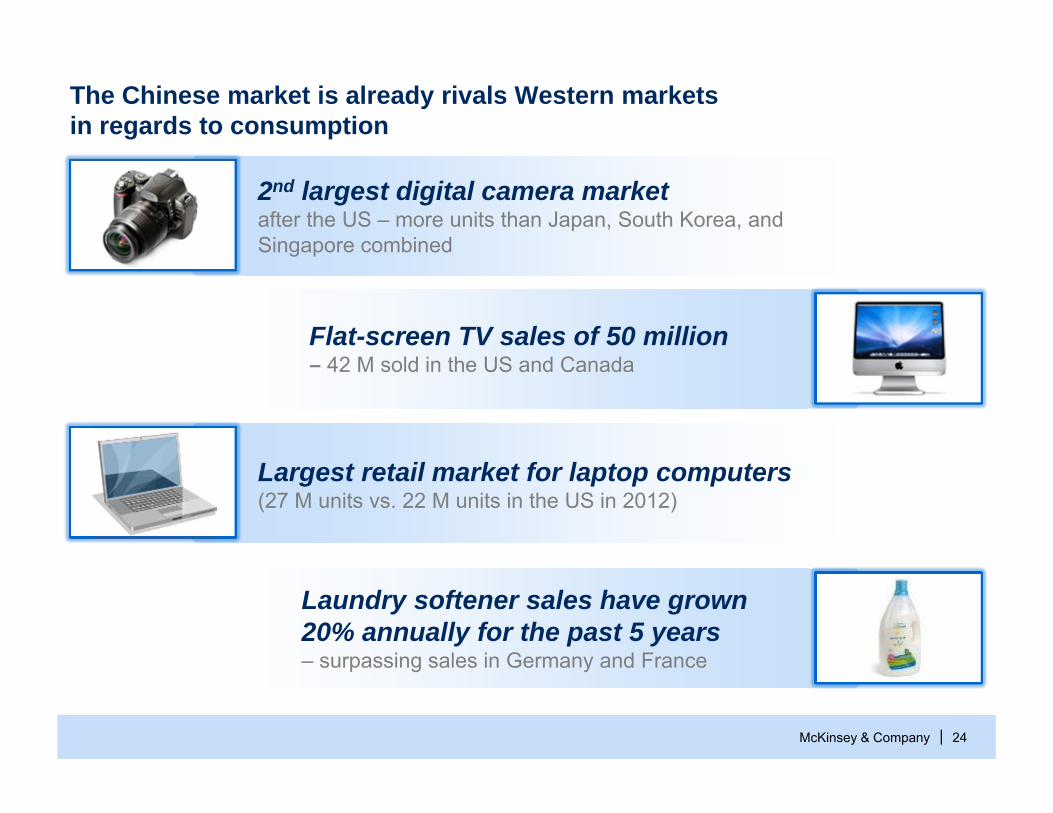
The Chinese market is already rivals Western markets in regards to consumption
2nd largest digital camera marketafter the US – more units than Japan, South Korea, and Singapore combined
Flat-screen TV sales of 50 million– 42 M sold in the US and Canada
Largest retail market for laptop computers(27 M units vs. 22 M units in the US in 2012)
Laundry softener sales have grown 20% annually for the past 5 years– surpassing sales in Germany and France
McKinsey & Company | 25SOURCE: FAO World Food and Agriculture to 2030/2050; FAO Expert Meeting on How to Feed the World in 2050; McKinsey analysis
Global growth by 2050
As incomes grow, caloric intake, especially from meat, will rise
892
~2x
475
2050E2010
Million tons of dairy
1.44
~1.5x1.00
2050E2010
Billion tons of cereals
464
227
~2x
2050E2010
Million tons of meat
McKinsey & Company | 26
China – the world’s largest market for meat at $300 B –has substantial room to grow further
45
50
57
66
76
109
130
+61%Japan
China
South Korea
Taiwan
EU-27
US
Hong Kong
Per capita meat consumption 2010kilo/year
50
85 90 94
50
15 10 6100% =
ROW
China
Dairy
383
Beef
260
Poultry
173
Pork
400
SOURCE: USDA, NBS
China’s share of consumption%, 100% = $B Total
McKinsey & Company | 27
22
120
79
22
119
74
23
119
77
22
116
93
21
109113
IndonesiaIndiaChina
20-24
15-19
10-14
5-9
0-4
School-age population, 2013Millions
AgesAsia has over 1 billion people to educate at any one time
436 M 583 M 110 M
India needs to put 50 million people through vocational training each year—and yet has capacity for only 4 million
SOURCE: Economist Intelligence Unit
McKinsey & Company | 28
Despite growing domestic education systems, China and India will not be able to meet demand for talent
SOURCE: McKinsey Global Institute
In 2020
41M
23M
45M
13M
global shortage of tertiary educated workers
in China alone
global shortage of high school graduates
in India alone
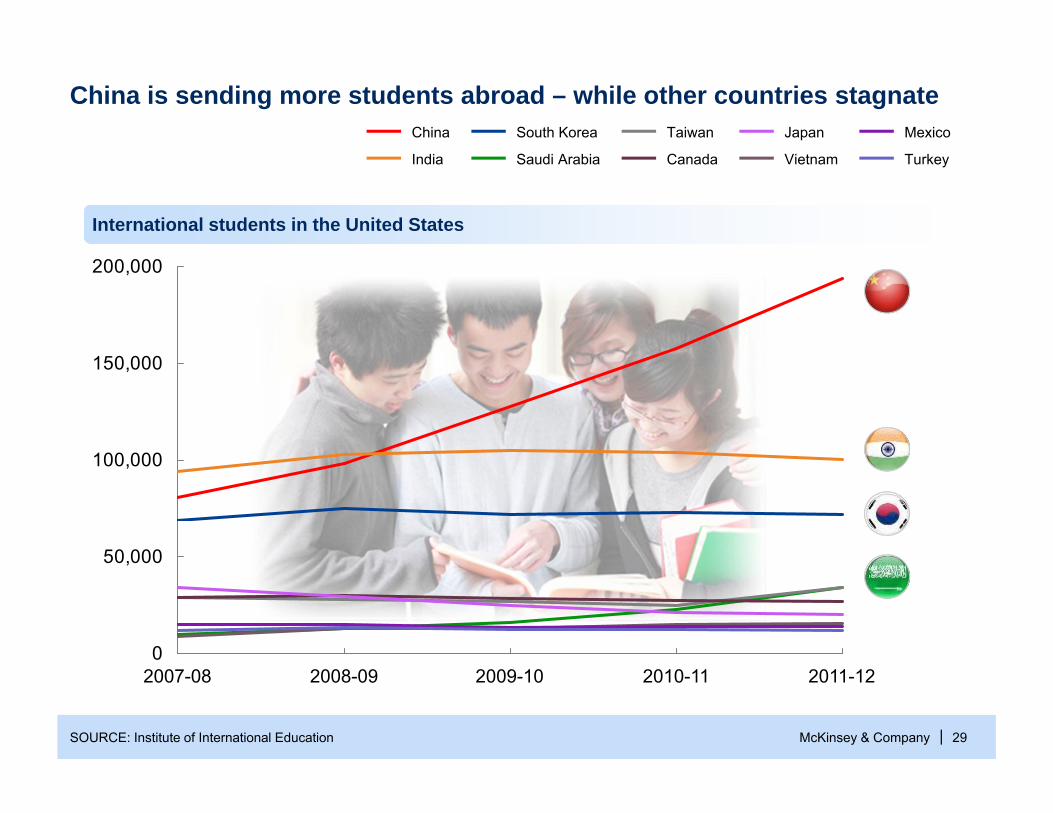
McKinsey & Company | 29
0
50,000
100,000
150,000
200,000
2011-122010-112009-102008-092007-08
International students in the United States
China is sending more students abroad – while other countries stagnate
SOURCE: Institute of International Education
Turkey
Mexico
Vietnam
Japan
Canada
Taiwan
Saudi Arabia
South Korea
India
China
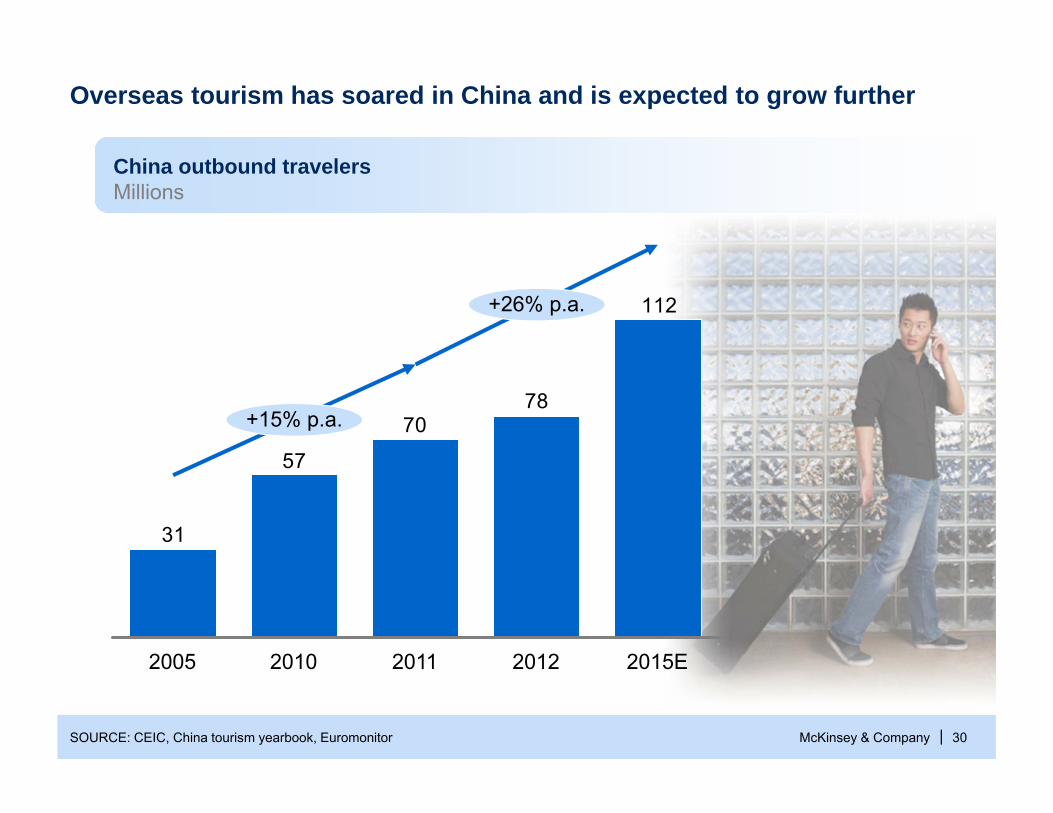
McKinsey & Company | 30
112
7870
57
31
+15% p.a.
+26% p.a.
2012201120102005 2015E
Overseas tourism has soared in China and is expected to grow further
SOURCE: CEIC, China tourism yearbook, Euromonitor
China outbound travelersMillions
McKinsey & Company | 3131
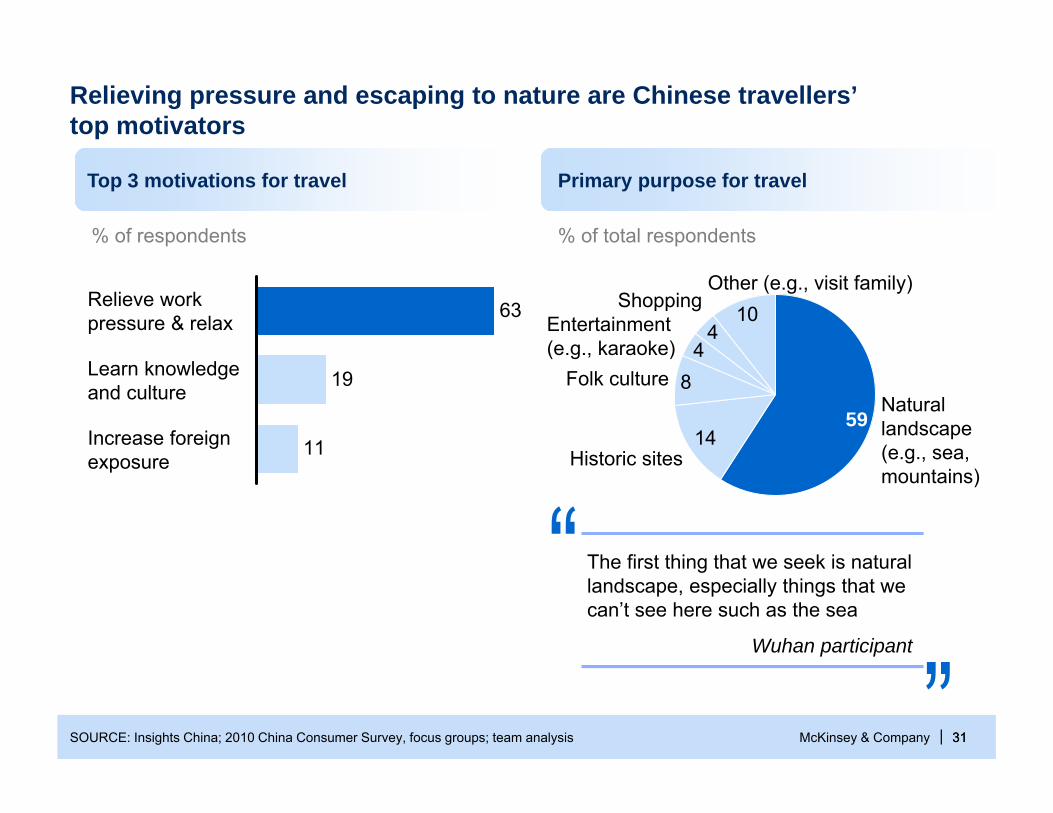
% of total respondents
SOURCE: Insights China; 2010 China Consumer Survey, focus groups; team analysis
Relieving pressure and escaping to nature are Chinese travellers’top motivators
63
11
19
Increase foreign exposure
Learn knowledge and culture
Relieve work pressure & relax 10
44
8
14
Other (e.g., visit family)Shopping
Entertainment(e.g., karaoke)
Folk culture
Historic sites
Natural landscape(e.g., sea, mountains)
59
% of respondents
The first thing that we seek is natural landscape, especially things that we can’t see here such as the sea
Wuhan participant
Primary purpose for travelTop 3 motivations for travel
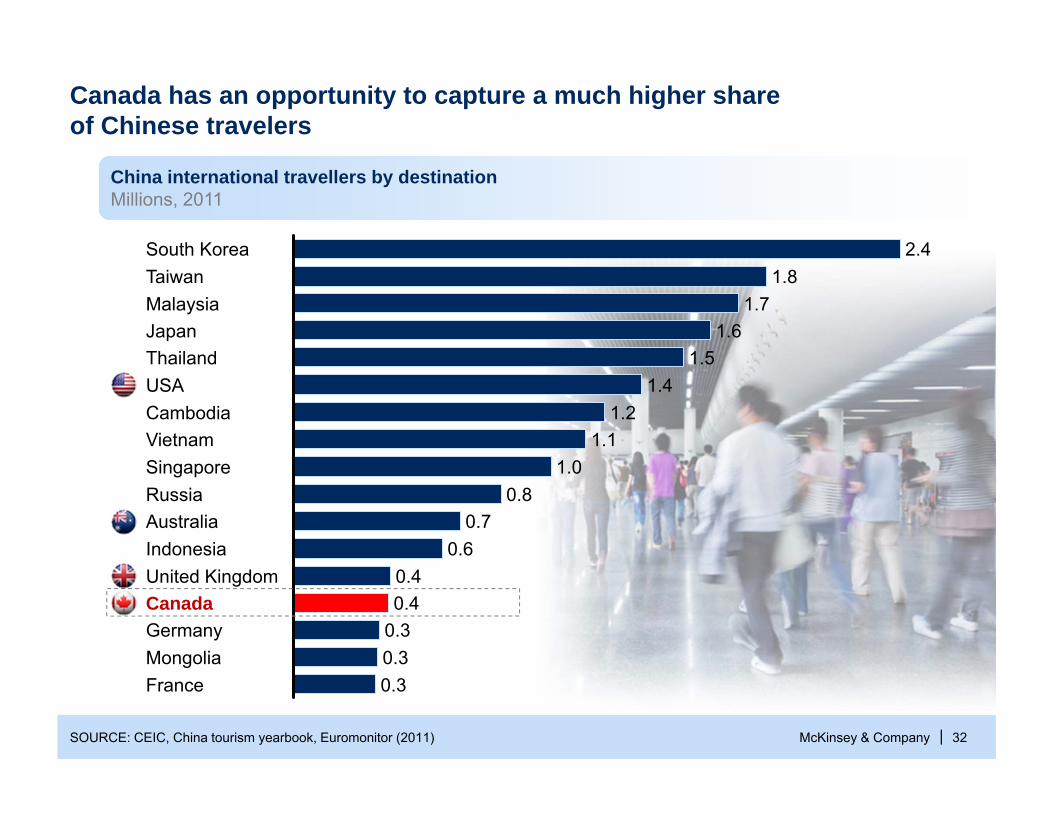
McKinsey & Company | 32
Canada has an opportunity to capture a much higher shareof Chinese travelers
Mongolia 0.3
Canada
0.3
0.3Germany0.40.4
Indonesia 0.6United Kingdom
1.1Cambodia
Thailand
Australia
Singapore
1.5
1.2
1.0
USA
Russia0.7
0.8
Vietnam
1.4
France
South Korea
1.6
2.41.8
1.7Taiwan
JapanMalaysia
SOURCE: CEIC, China tourism yearbook, Euromonitor (2011)
China international travellers by destination Millions, 2011
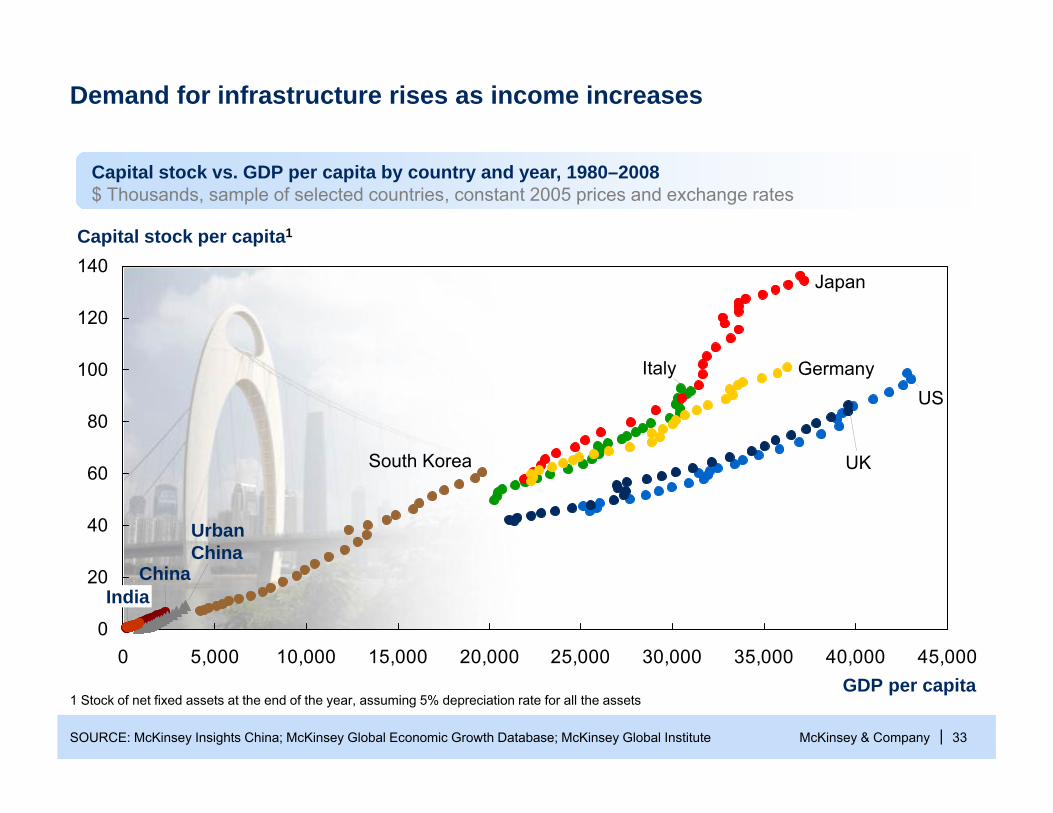
McKinsey & Company | 33SOURCE: McKinsey Insights China; McKinsey Global Economic Growth Database; McKinsey Global Institute
1 Stock of net fixed assets at the end of the year, assuming 5% depreciation rate for all the assets
Demand for infrastructure rises as income increases
0 5,000 10,000 15,000 20,000 25,000 30,000 35,000 40,000 45,000
Capital stock per capita1
140
120
100
80
60
40
20
0
GDP per capita
Urban China
ChinaIndia
Germany
South Korea
Japan
Italy
UK
US
Capital stock vs. GDP per capita by country and year, 1980–2008$ Thousands, sample of selected countries, constant 2005 prices and exchange rates
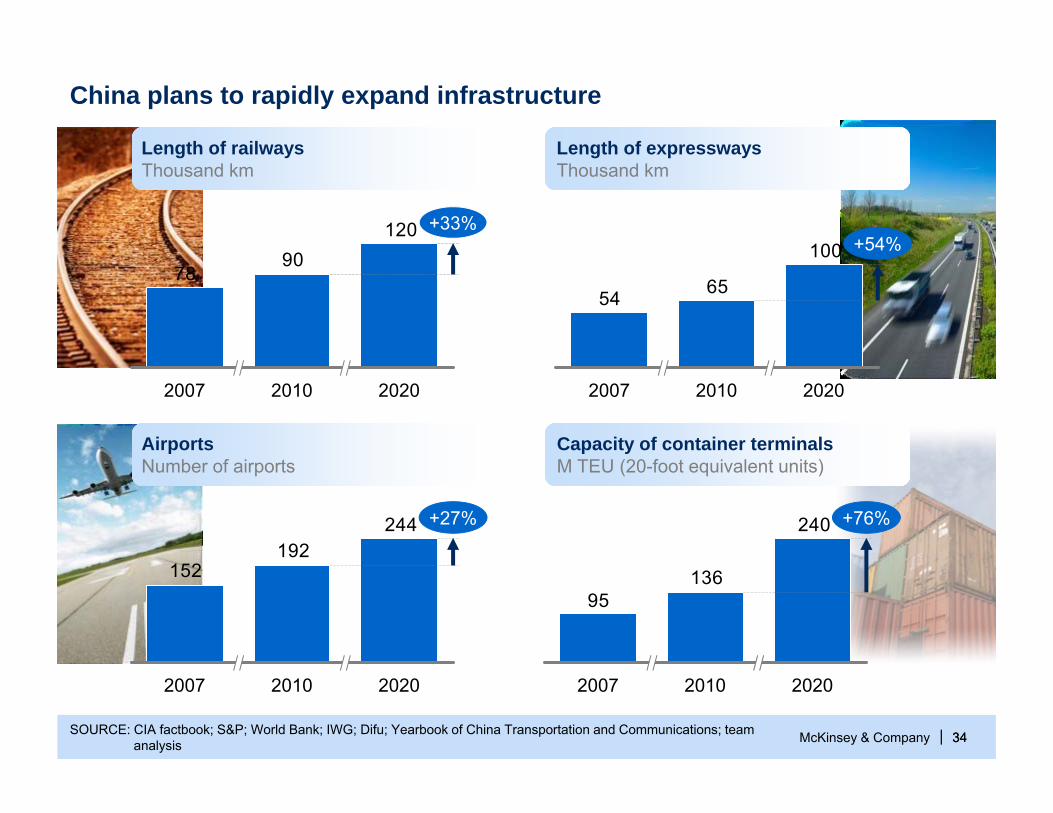
McKinsey & Company | 3434
Length of expresswaysThousand km
Length of railwaysThousand km
AirportsNumber of airports
Capacity of container terminalsM TEU (20-foot equivalent units)
12090
78
+33%
202020102007
China plans to rapidly expand infrastructure
100
6554
+54%
202020102007
244192
152
+27%
202020102007
240
13695
+76%
202020102007
SOURCE: CIA factbook; S&P; World Bank; IWG; Difu; Yearbook of China Transportation and Communications; team analysis
McKinsey & Company | 35
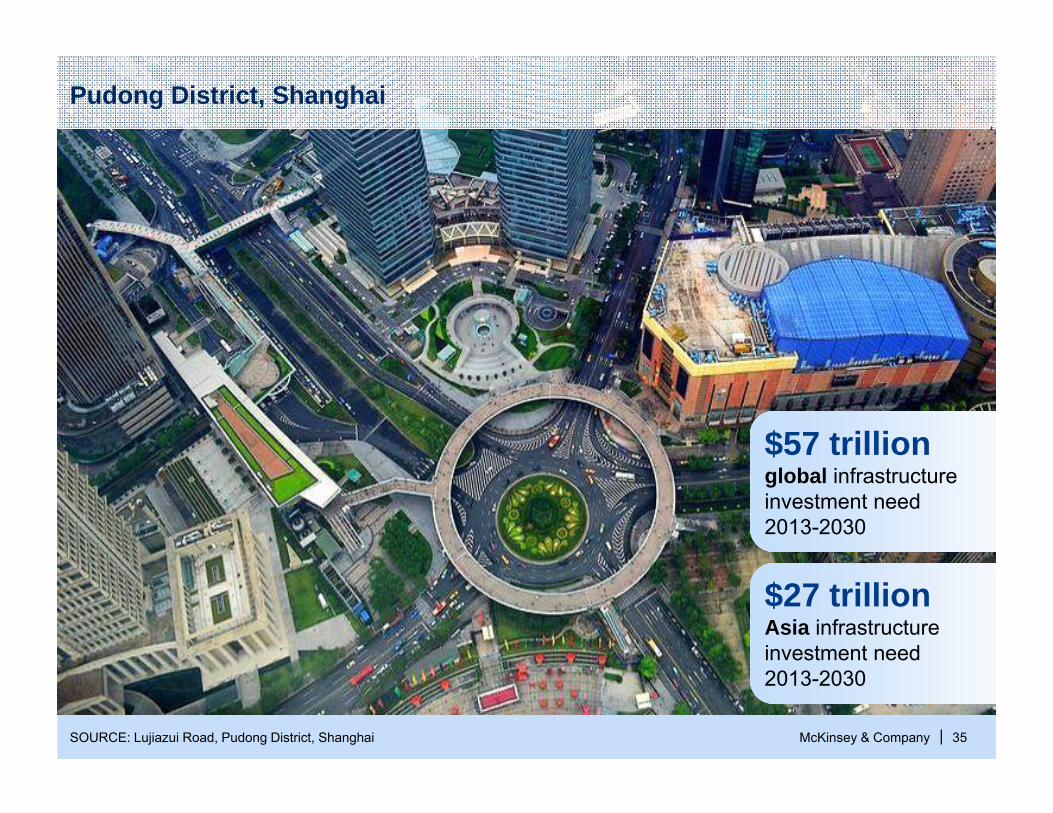
Pudong District, Shanghai
$27 trillionAsia infrastructureinvestment need2013-2030
SOURCE: Lujiazui Road, Pudong District, Shanghai
$57 trillionglobal infrastructureinvestment need2013-2030
McKinsey & Company | 36
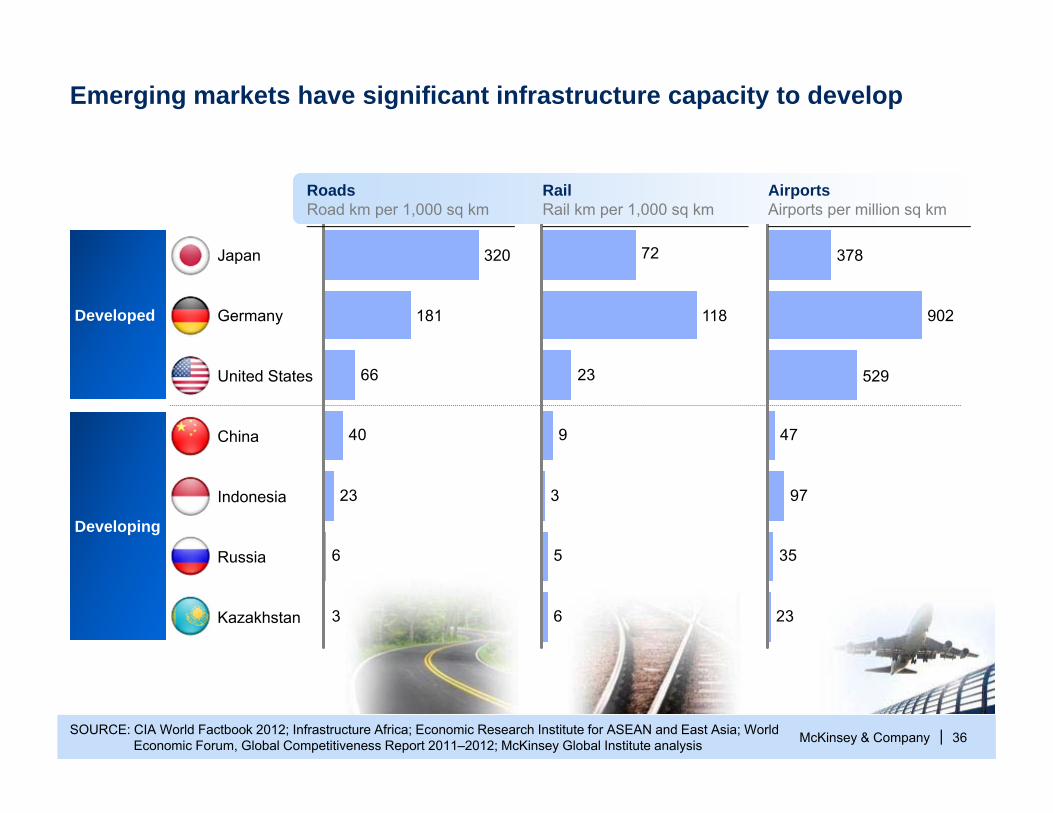
Emerging markets have significant infrastructure capacity to develop
SOURCE: CIA World Factbook 2012; Infrastructure Africa; Economic Research Institute for ASEAN and East Asia; World Economic Forum, Global Competitiveness Report 2011–2012; McKinsey Global Institute analysis
3
6
23
40
66
Kazakhstan
Russia
Indonesia
China
United States
Germany 181
Japan 320
6
5
3
9
23
72
118
23
35
97
47
529
902
378
Developing
Developed
AirportsAirports per million sq km
RailRail km per 1,000 sq km
RoadsRoad km per 1,000 sq km
McKinsey & Company | 37SOURCE: Global Insight; IEA; UN Environment Program (UNEP); FAO; World Steel Association; McKinsey analysis
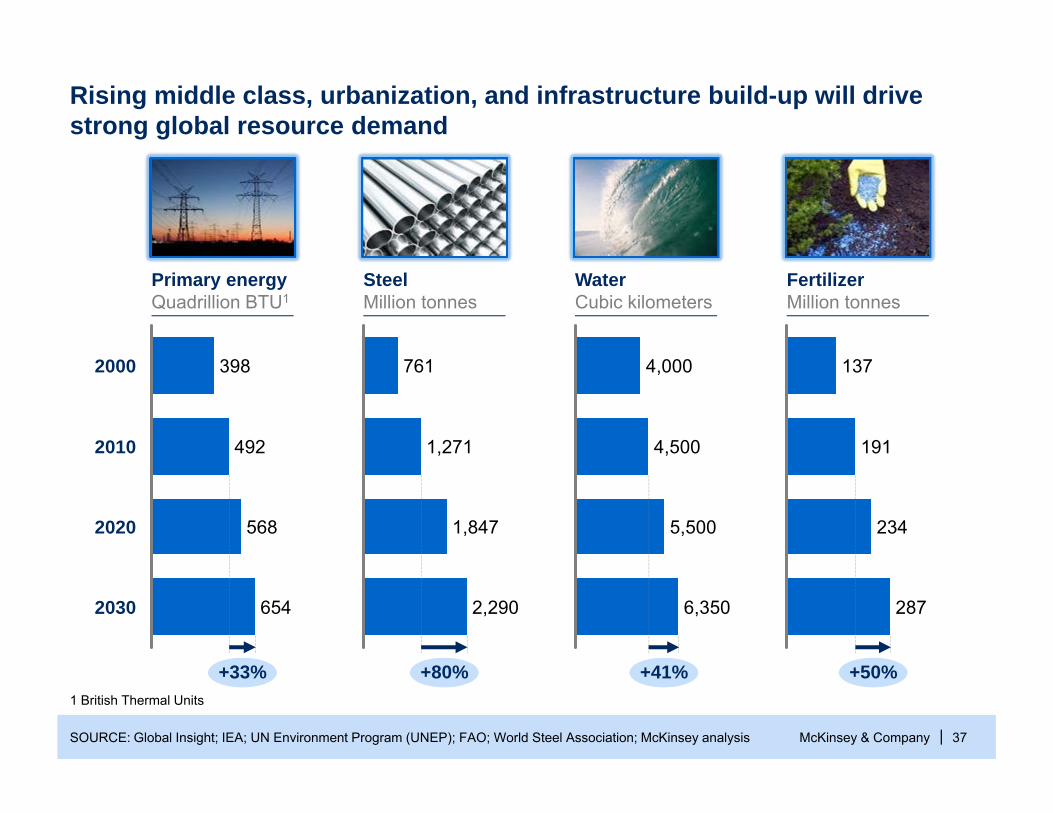
398
654
+33%
2030
4922010
2000
5682020
+80%
1,847
2,290
1,271
761
6,350
+41%
5,500
4,500
4,000
234
191
137
287
+50%
Rising middle class, urbanization, and infrastructure build-up will drive strong global resource demand
FertilizerMillion tonnes
WaterCubic kilometers
SteelMillion tonnes
Primary energyQuadrillion BTU1
1 British Thermal Units
McKinsey & Company | 3838SOURCE: McKinsey 2011 global copper, iron ore, steel, and metallurgical coal models
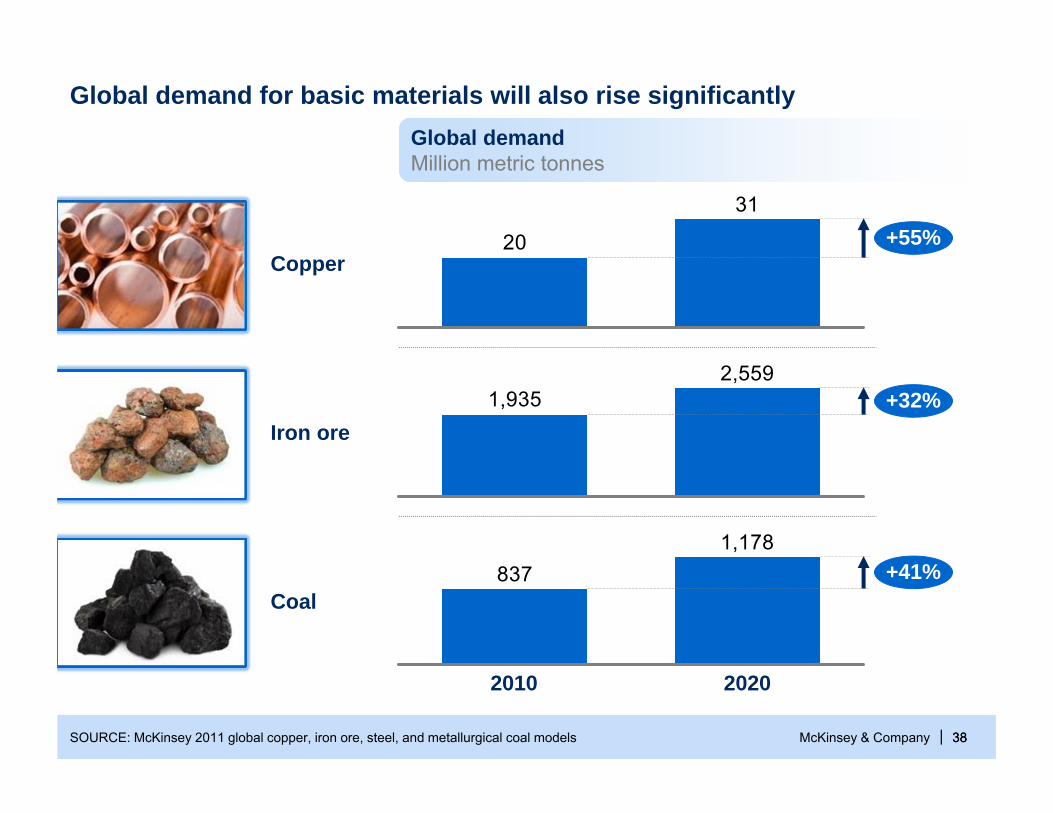
31
20 +55%
2,5591,935 +32%
1,178837 +41%
Global demand for basic materials will also rise significantlyGlobal demandMillion metric tonnes
Coal
Iron ore
Copper
2010 2020
McKinsey & Company | 3939
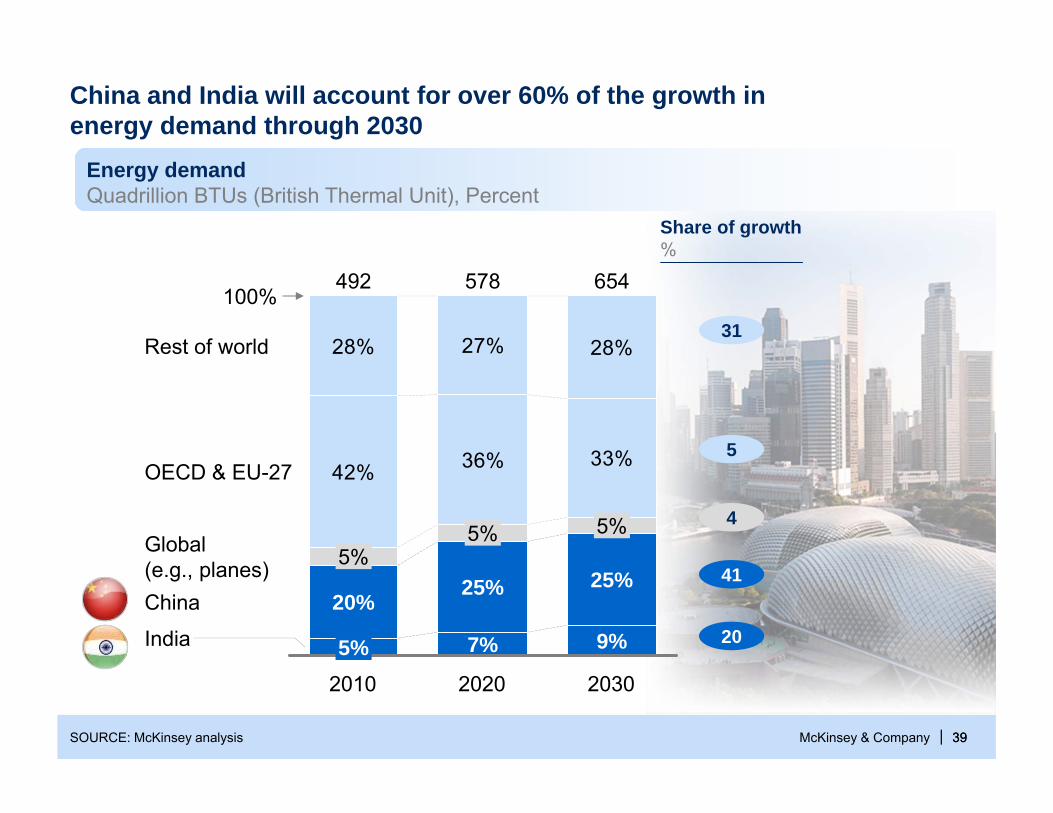
China and India will account for over 60% of the growth in energy demand through 2030
Energy demandQuadrillion BTUs (British Thermal Unit), Percent
41
20
5
31
Share of growth%
4
SOURCE: McKinsey analysis
42% 36% 33%
28% 27% 28%
2030
654
9%
100%
5%
2020
578
India
China
Global(e.g., planes)
OECD & EU-27
7%
25%
5%
2010
492
5%
20%
5%
Rest of world
25%
McKinsey & Company | 40
Overview
Five global trends
Opportunities in Asia
BC strengths and opportunities
1
2
3
Lessons from other cities and countries4
McKinsey & Company | 41
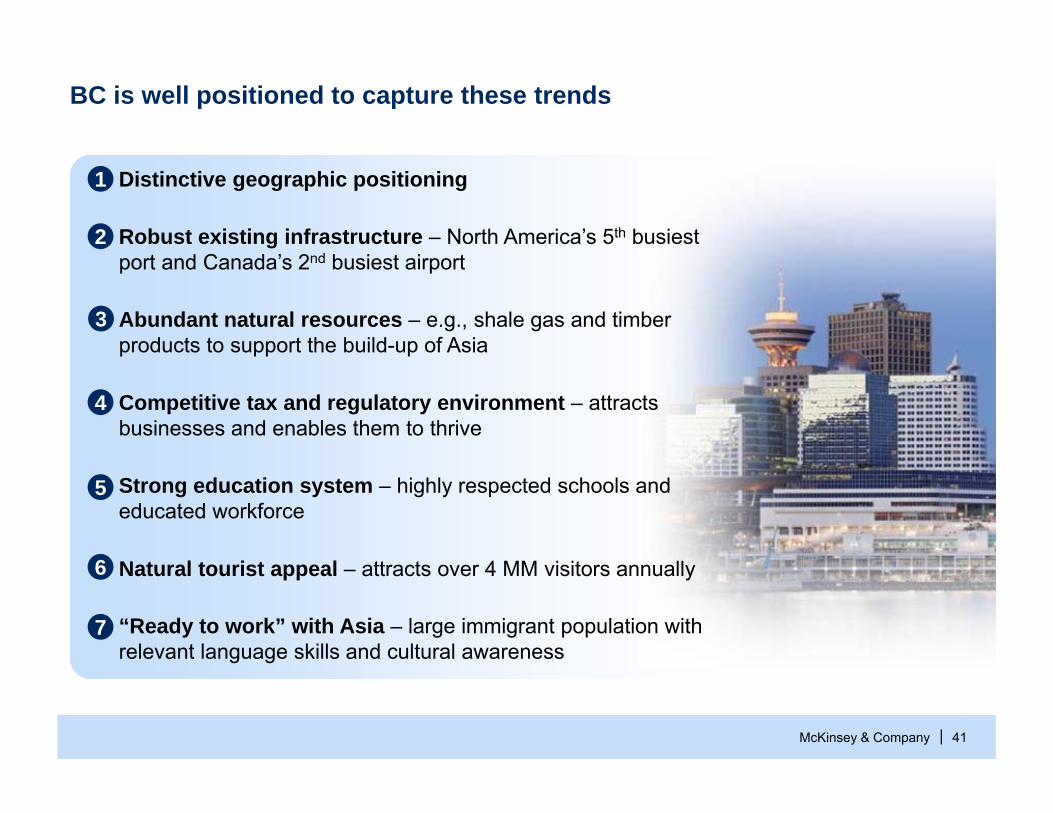
▪ Distinctive geographic positioning
▪ Competitive tax and regulatory environment – attracts businesses and enables them to thrive
▪ Strong education system – highly respected schools and educated workforce
▪ Natural tourist appeal – attracts over 4 MM visitors annually
▪ “Ready to work” with Asia – large immigrant population with relevant language skills and cultural awareness
▪ Abundant natural resources – e.g., shale gas and timber products to support the build-up of Asia
1
▪ Robust existing infrastructure – North America’s 5th busiest port and Canada’s 2nd busiest airport
3
4
2
5
6
7
BC is well positioned to capture these trends
McKinsey & Company | 42
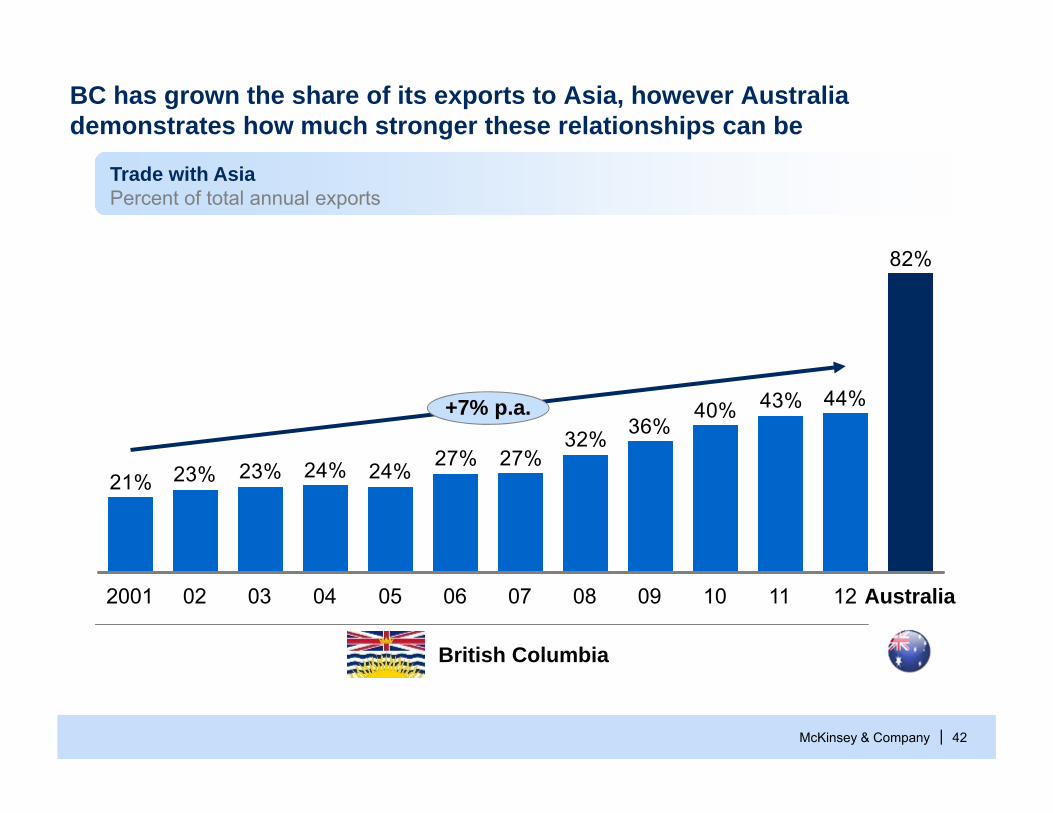
BC has grown the share of its exports to Asia, however Australia demonstrates how much stronger these relationships can be
82%
44%43%40%36%32%
27%27%24%24%23%23%21%
10 1211
+7% p.a.
Australia0403022001 05 06 090807
Trade with AsiaPercent of total annual exports
British Columbia
McKinsey & Company | 43
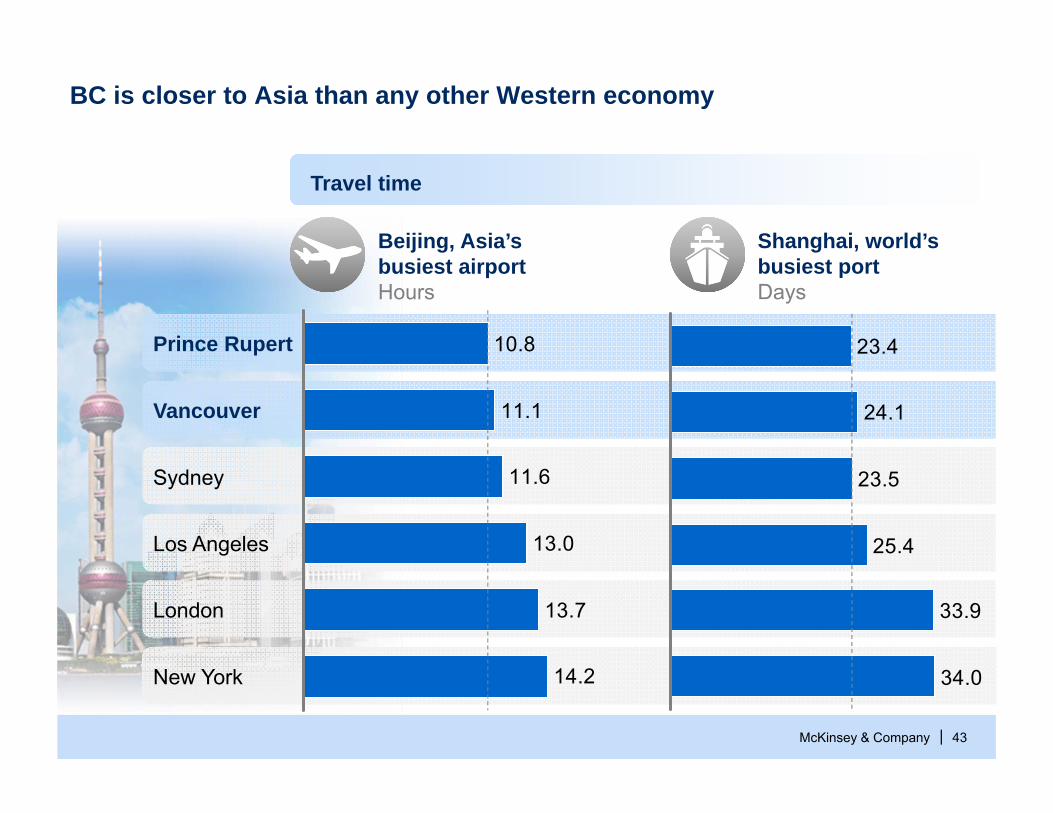
BC is closer to Asia than any other Western economy
Travel time
Beijing, Asia’s busiest airportHours
14.2
13.7
13.0
11.6
11.1
10.8
New York
London
Los Angeles
Sydney
Vancouver
Prince Rupert
Shanghai, world’sbusiest portDays
34.0
33.9
25.4
23.5
24.1
23.4
McKinsey & Company | 44
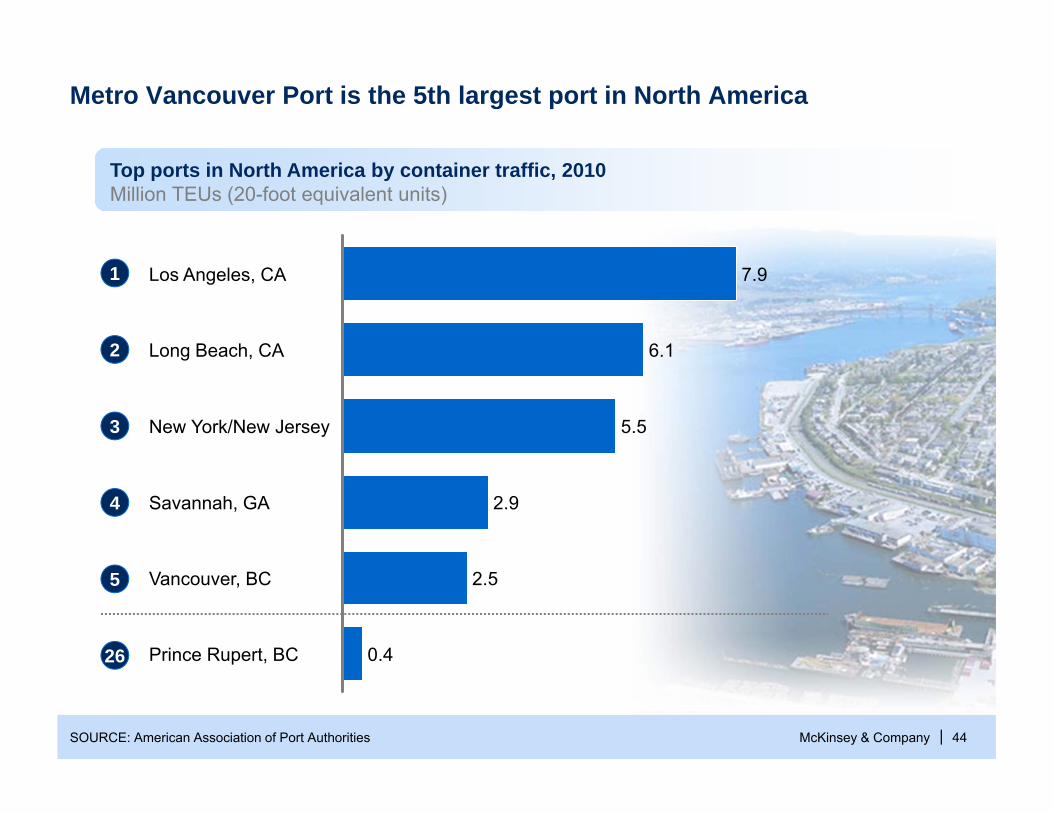
Metro Vancouver Port is the 5th largest port in North America
Los Angeles, CA 7.9
Prince Rupert, BC
6.1
Vancouver, BC
5.5
Savannah, GA 2.9
New York/New Jersey
2.5
Long Beach, CA
0.4
1
2
3
4
5
26
Top ports in North America by container traffic, 2010Million TEUs (20-foot equivalent units)
SOURCE: American Association of Port Authorities
McKinsey & Company | 45
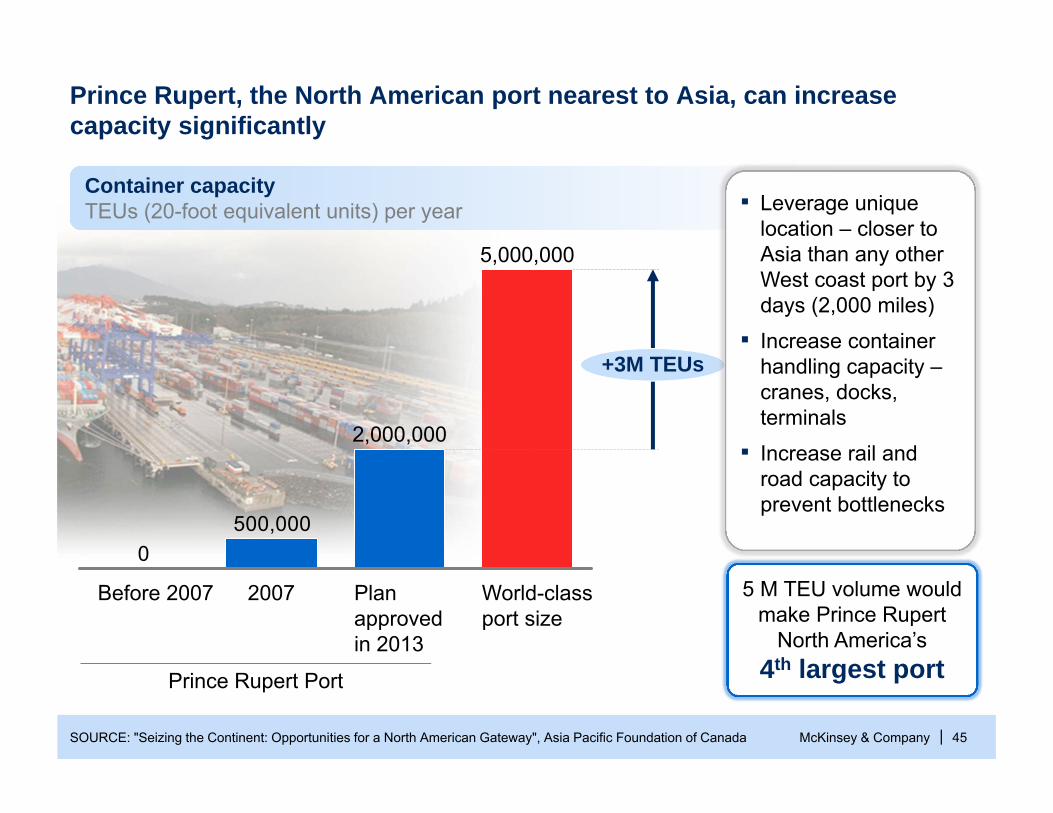
Prince Rupert, the North American port nearest to Asia, can increase capacity significantly
500,0000
Before 2007
+3M TEUs
5,000,000
World-class port size
Plan approved in 2013
2,000,000
2007
Prince Rupert Port
Container capacityTEUs (20-foot equivalent units) per year
SOURCE: "Seizing the Continent: Opportunities for a North American Gateway", Asia Pacific Foundation of Canada
▪ Leverage unique location – closer to Asia than any other West coast port by 3 days (2,000 miles)
▪ Increase container handling capacity –cranes, docks, terminals
▪ Increase rail and road capacity to prevent bottlenecks
5 M TEU volume would make Prince Rupert
North America’s4th largest port
McKinsey & Company | 46
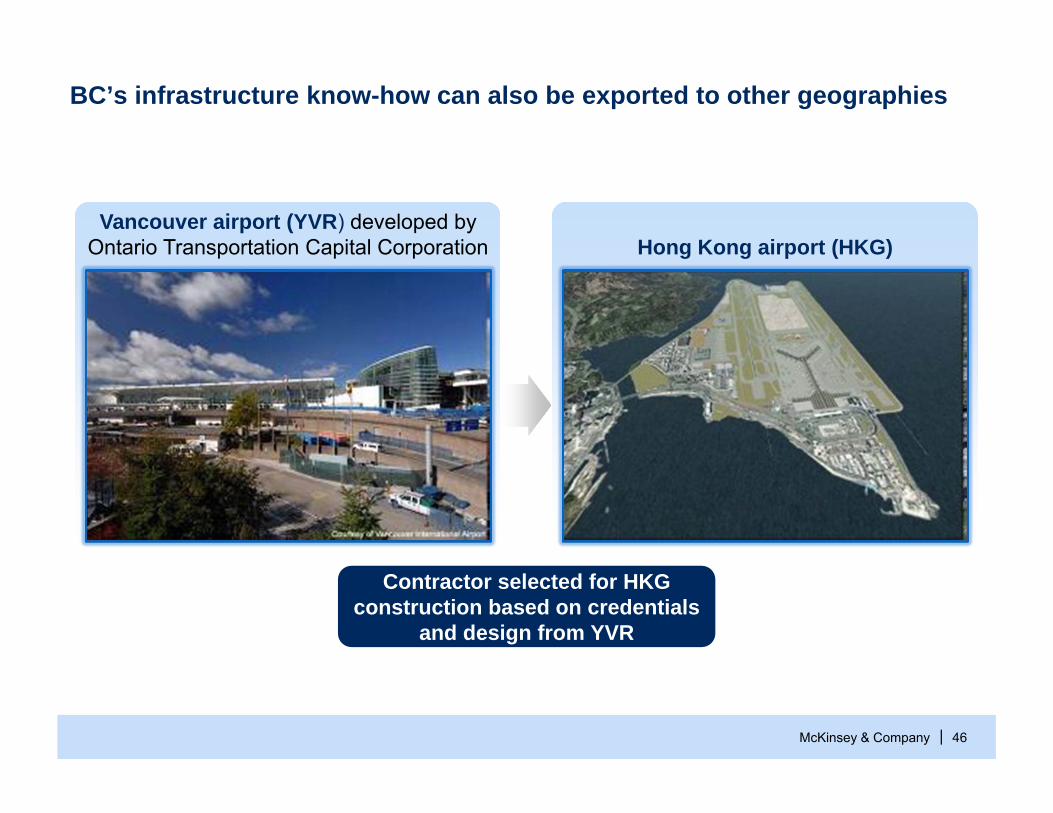
BC’s infrastructure know-how can also be exported to other geographies
Contractor selected for HKGconstruction based on credentials
and design from YVR
Vancouver airport (YVR) developed by Ontario Transportation Capital Corporation Hong Kong airport (HKG)
McKinsey & Company | 47
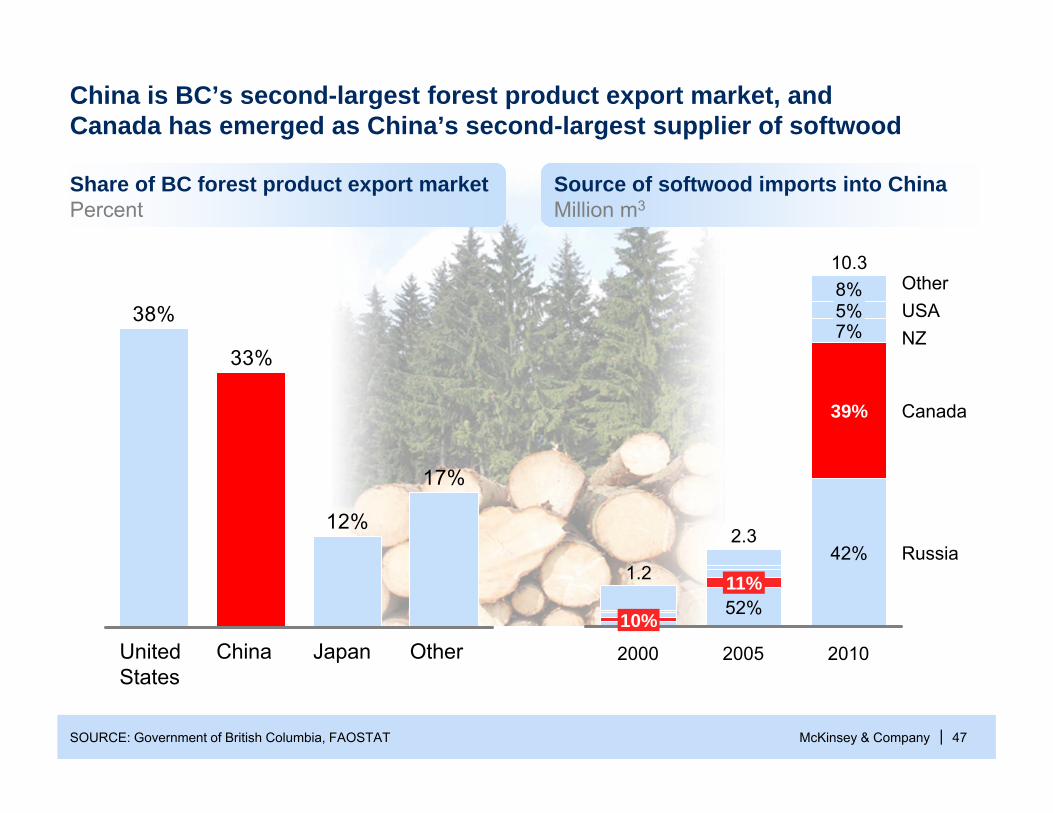
China is BC’s second-largest forest product export market, andCanada has emerged as China’s second-largest supplier of softwood
SOURCE: Government of British Columbia, FAOSTAT
17%
12%
33%
38%
OtherJapanChinaUnited States
Share of BC forest product export marketPercent
Russia
Canada
NZUSAOther
2010
10.3
42%
39%
7%5%8%
2005
2.3
52%11%
2000
1.2
10%
Source of softwood imports into ChinaMillion m3
McKinsey & Company | 48
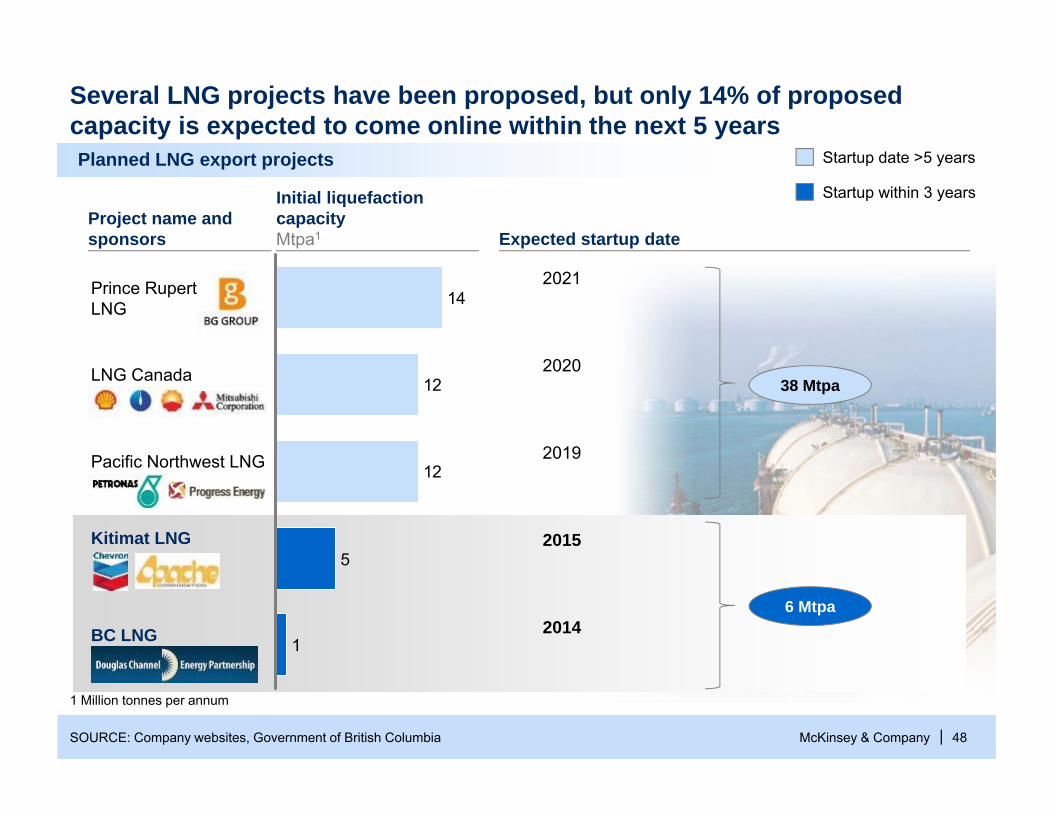
Planned LNG export projects
Project name and sponsors
Initial liquefaction capacityMtpa1 Expected startup date
2020
2015
2014
2019
Several LNG projects have been proposed, but only 14% of proposed capacity is expected to come online within the next 5 years
1
5
12
12
14Prince RupertLNG
LNG Canada
Pacific Northwest LNG
BC LNG
Kitimat LNG
SOURCE: Company websites, Government of British Columbia
2021
Startup date >5 years
Startup within 3 years
38 Mtpa
6 Mtpa
1 Million tonnes per annum
McKinsey & Company | 49
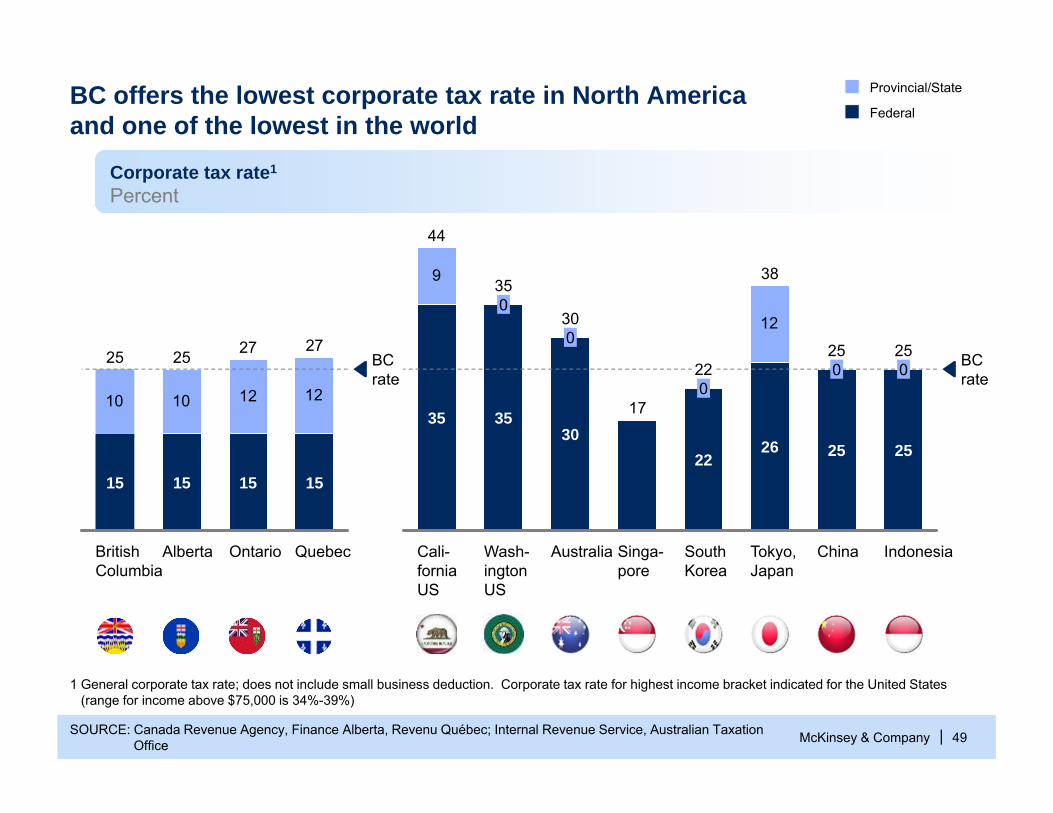
BC offers the lowest corporate tax rate in North Americaand one of the lowest in the world
SOURCE: Canada Revenue Agency, Finance Alberta, Revenu Québec; Internal Revenue Service, Australian Taxation Office
10 10 12 12
BCrate
Quebec
27
15
Ontario
27
15
Alberta
25
15
British Columbia
25
15
1 General corporate tax rate; does not include small business deduction. Corporate tax rate for highest income bracket indicated for the United States (range for income above $75,000 is 34%-39%)
Federal
Provincial/State
17
12
9
30
0
Wash-ingtonUS
35
35
0
Cali-forniaUS
44
35
BCrate
Indonesia
25
25
0
China
25
25
0
Tokyo, Japan
38
26
South Korea
22
22
0
Singa-pore
Australia
30
Corporate tax rate1
Percent
McKinsey & Company | 50
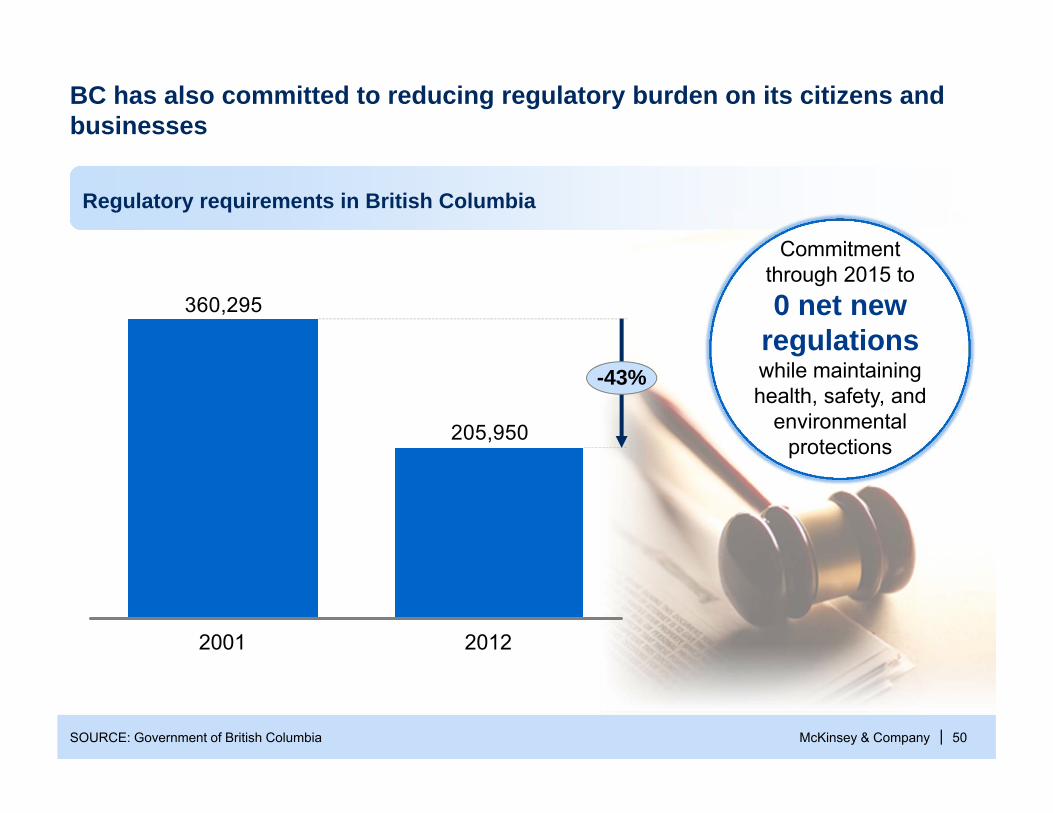
BC has also committed to reducing regulatory burden on its citizens and businesses
SOURCE: Government of British Columbia
205,950
360,295
-43%
2001 2012
Regulatory requirements in British Columbia
Commitmentthrough 2015 to0 net new
regulationswhile maintaining health, safety, and
environmental protections
McKinsey & Company | 51
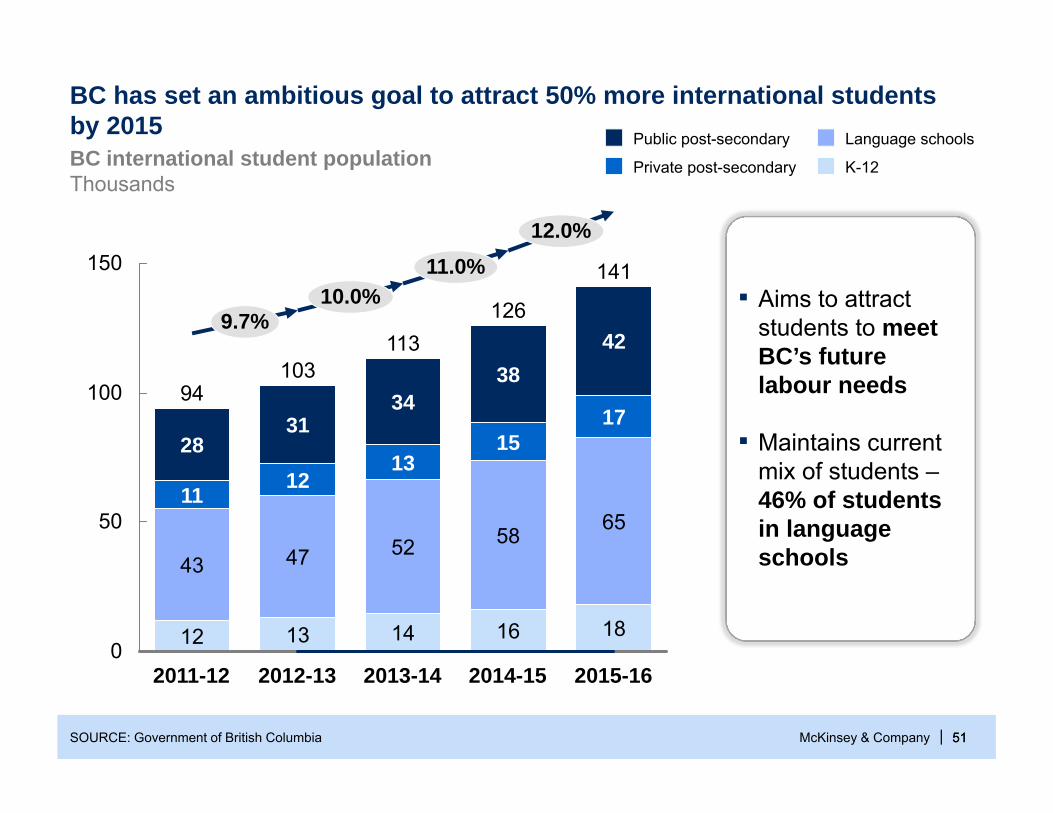
BC has set an ambitious goal to attract 50% more international students by 2015
51SOURCE: Government of British Columbia
▪ Aims to attract students to meet BC’s future labour needs
▪ Maintains current mix of students –46% of students in language schools
12
31
18
17
65
42
58
28
43
11
12
34
13
13
103113
9438
126
141
15
52
2014-15
150
2013-14
50
2012-13
100
0
11.0%12.0%
9.7%10.0%
2015-162011-12
47
14 16
Private post-secondary
Language schools
K-12
Public post-secondaryBC international student populationThousands
McKinsey & Company | 52SOURCE: Kevin Rudd speaking at the Business Council of British Columbia
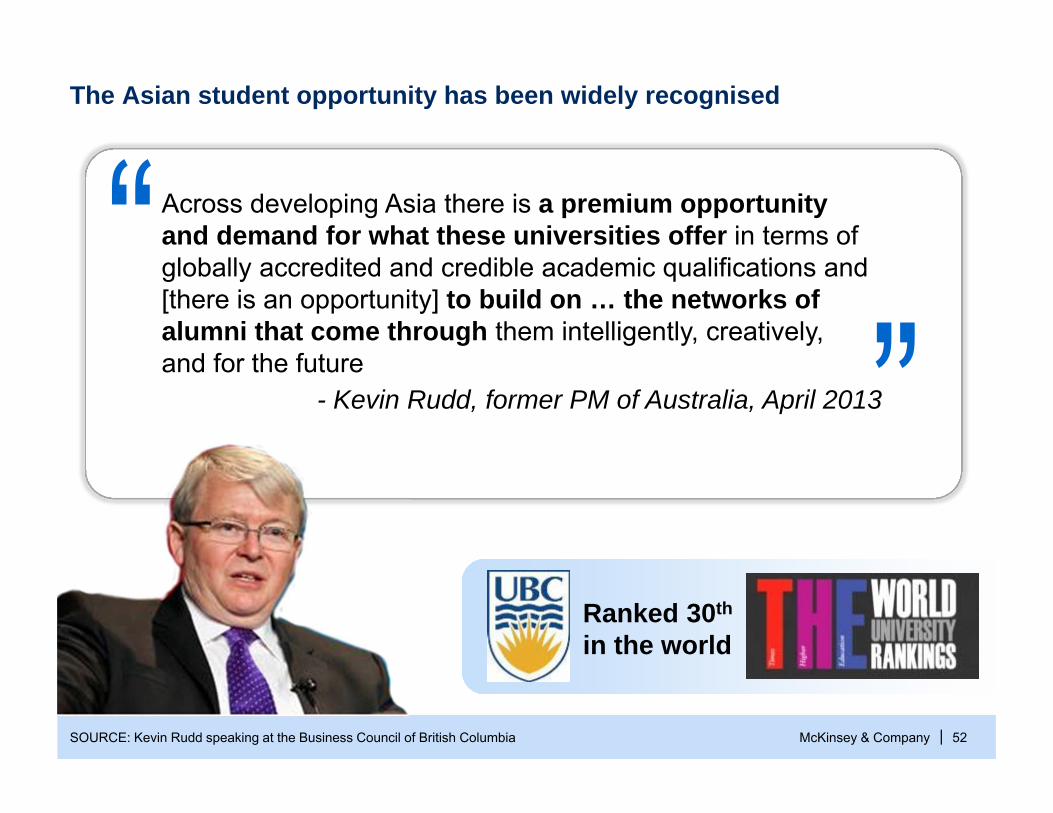
Across developing Asia there is a premium opportunity and demand for what these universities offer in terms of globally accredited and credible academic qualifications and [there is an opportunity] to build on … the networks of alumni that come through them intelligently, creatively,and for the future
- Kevin Rudd, former PM of Australia, April 2013
The Asian student opportunity has been widely recognised
Ranked 30th
in the world
McKinsey & Company | 53
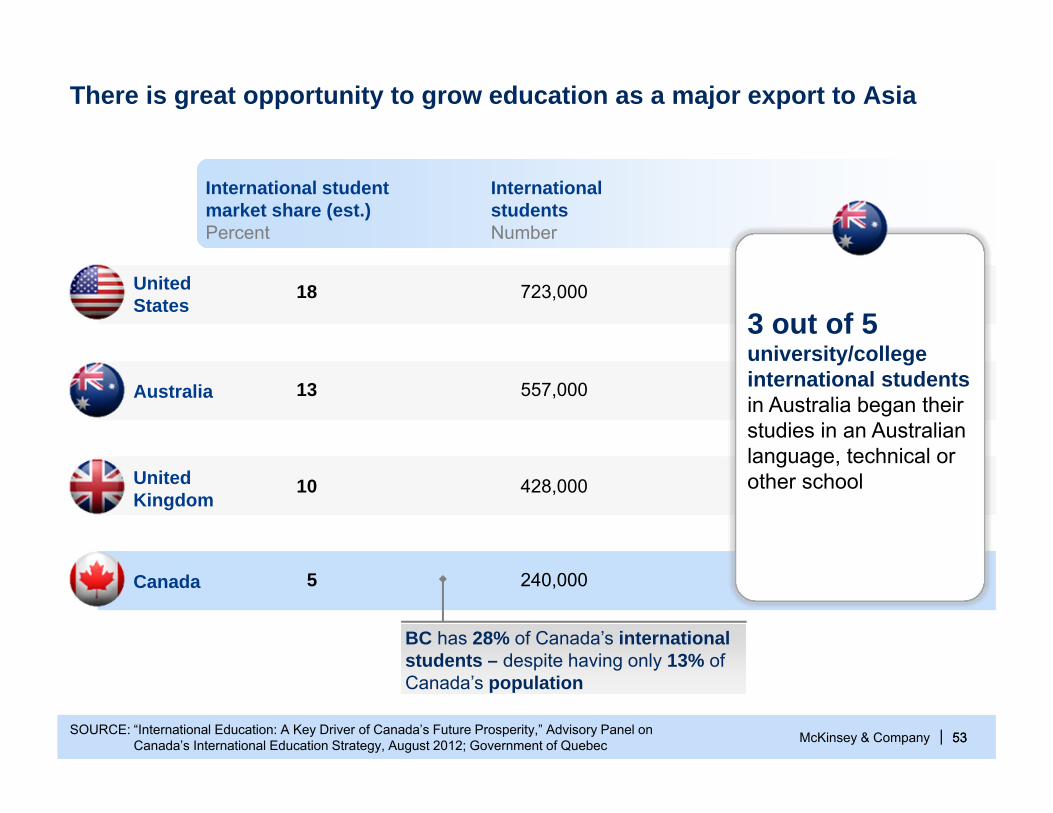
There is great opportunity to grow education as a major export to Asia
SOURCE: “International Education: A Key Driver of Canada’s Future Prosperity,” Advisory Panel onCanada’s International Education Strategy, August 2012; Government of Quebec 53
UnitedKingdom
UnitedStates
Canada
Australia
International student market share (est.)Percent
10
18
5
13
International studentsNumber
428,000
723,000
240,000
557,000
BC has 28% of Canada’s international students – despite having only 13% of Canada’s population
3 out of 5university/college international studentsin Australia began their studies in an Australian language, technical or other school
McKinsey & Company | 54
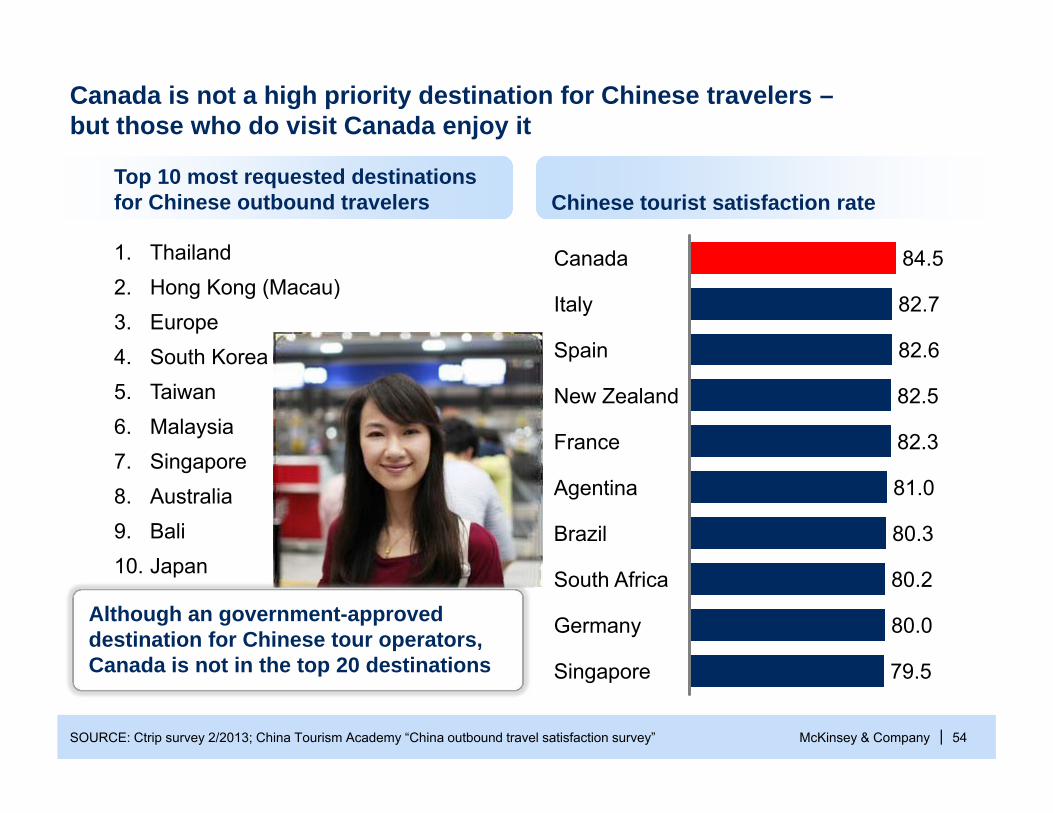
1. Thailand2. Hong Kong (Macau)3. Europe4. South Korea5. Taiwan6. Malaysia7. Singapore8. Australia9. Bali10. Japan
SOURCE: Ctrip survey 2/2013; China Tourism Academy “China outbound travel satisfaction survey”
Singapore 79.5
Germany 80.0
South Africa 80.2
Brazil 80.3
Agentina 81.0
France 82.3
New Zealand 82.5
Spain 82.6
Italy 82.7
Canada 84.5
Canada is not a high priority destination for Chinese travelers –but those who do visit Canada enjoy it
Chinese tourist satisfaction rateTop 10 most requested destinations for Chinese outbound travelers
Although an government-approved destination for Chinese tour operators, Canada is not in the top 20 destinations
McKinsey & Company | 55SOURCE: Kevin Rudd speaking at the Business Council of British Columbia
We’re going to have a 100 M Chinese tourists travelling the world in the next couple of decades. Where are they going to go? Countries where they are met and greeted in the language they are familiar with.
The assumption that English will be the global lingua franca at the end of this century is itself an arrogant assumption – English has only been the lingua franca since English speaking countries triumphed in WWII
- Kevin Rudd, former PM of Australia, April 2013
McKinsey & Company | 56
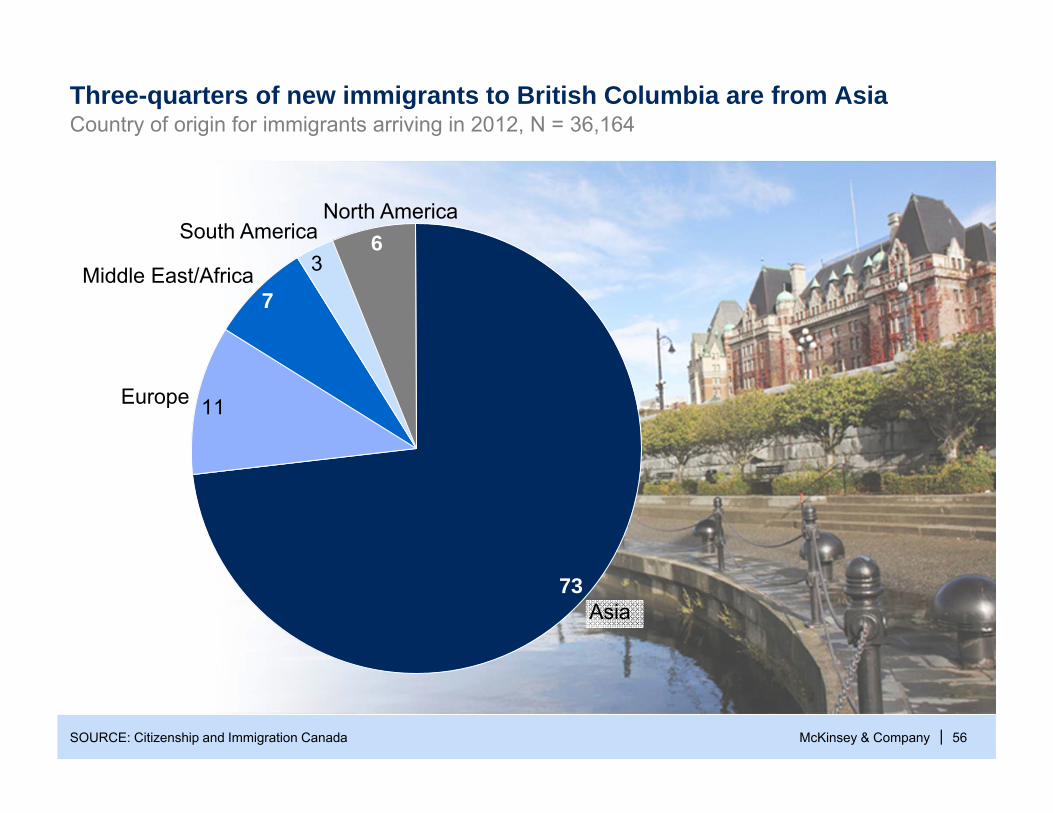
Three-quarters of new immigrants to British Columbia are from Asia
SOURCE: Citizenship and Immigration Canada
3
11
7Middle East/Africa
Europe
73Asia
6North America
South America
Country of origin for immigrants arriving in 2012, N = 36,164
McKinsey & Company | 57
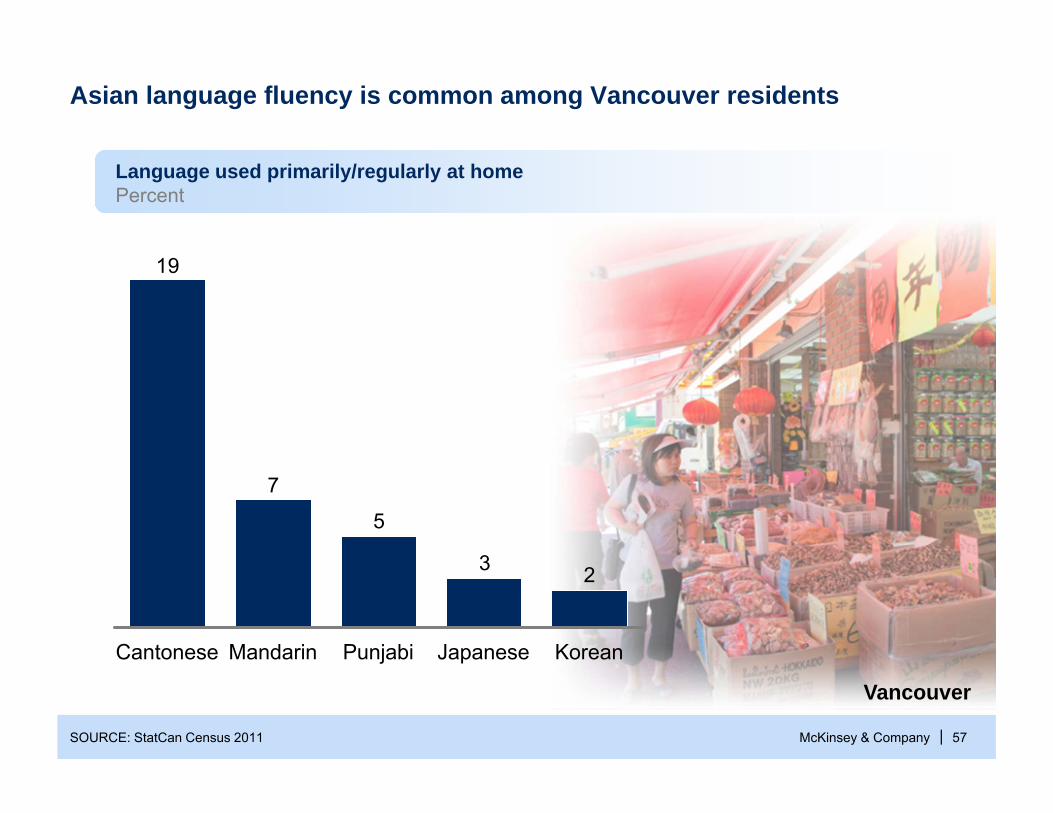
Asian language fluency is common among Vancouver residents
SOURCE: StatCan Census 2011
23
5
7
19
KoreanJapanesePunjabiMandarinCantonese
Language used primarily/regularly at homePercent
Vancouver
McKinsey & Company | 58
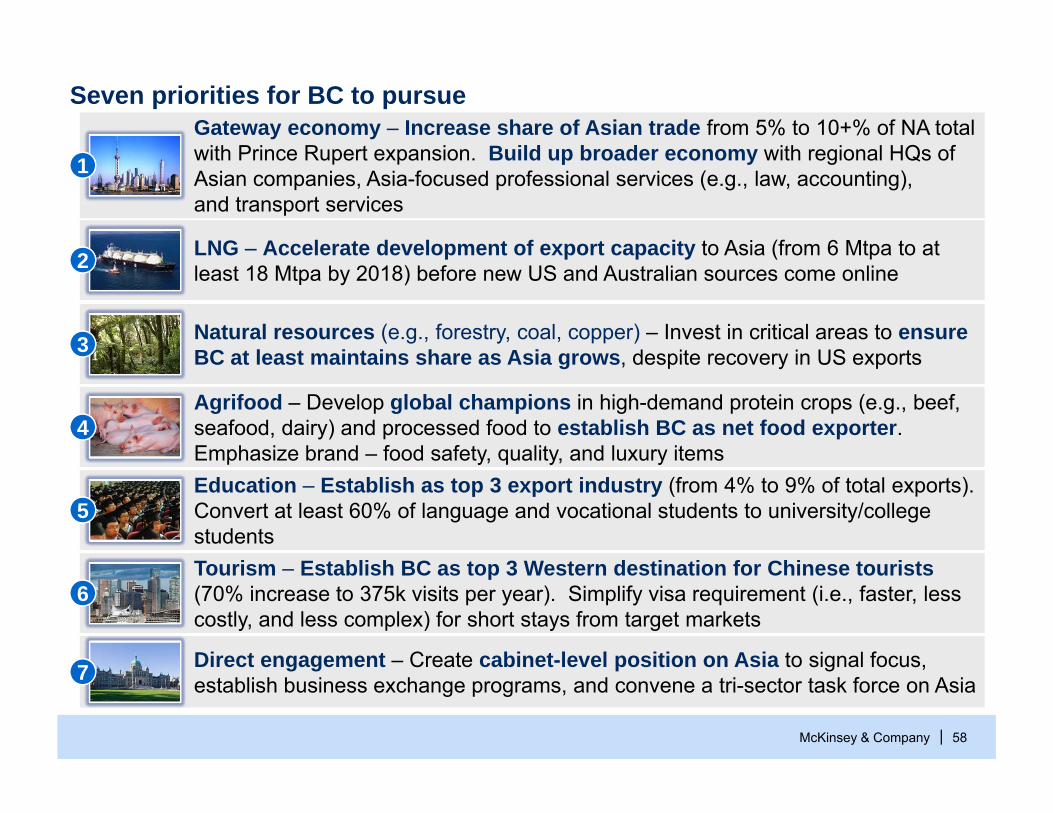
LNG – Accelerate development of export capacity to Asia (from 6 Mtpa to at least 18 Mtpa by 2018) before new US and Australian sources come online 22
Gateway economy – Increase share of Asian trade from 5% to 10+% of NA total with Prince Rupert expansion. Build up broader economy with regional HQs of Asian companies, Asia-focused professional services (e.g., law, accounting),and transport services
11
Natural resources (e.g., forestry, coal, copper) – Invest in critical areas to ensure BC at least maintains share as Asia grows, despite recovery in US exports33
Direct engagement – Create cabinet-level position on Asia to signal focus, establish business exchange programs, and convene a tri-sector task force on Asia77
Agrifood – Develop global champions in high-demand protein crops (e.g., beef, seafood, dairy) and processed food to establish BC as net food exporter. Emphasize brand – food safety, quality, and luxury items
44
Education – Establish as top 3 export industry (from 4% to 9% of total exports). Convert at least 60% of language and vocational students to university/college students
55
Tourism – Establish BC as top 3 Western destination for Chinese tourists(70% increase to 375k visits per year). Simplify visa requirement (i.e., faster, less costly, and less complex) for short stays from target markets
66
Seven priorities for BC to pursue

McKinsey & Company | 59
Overview
Five global trends
Opportunities in Asia
BC strengths and opportunities
1
2
3
Lessons from other cities and countries4
McKinsey & Company | 60
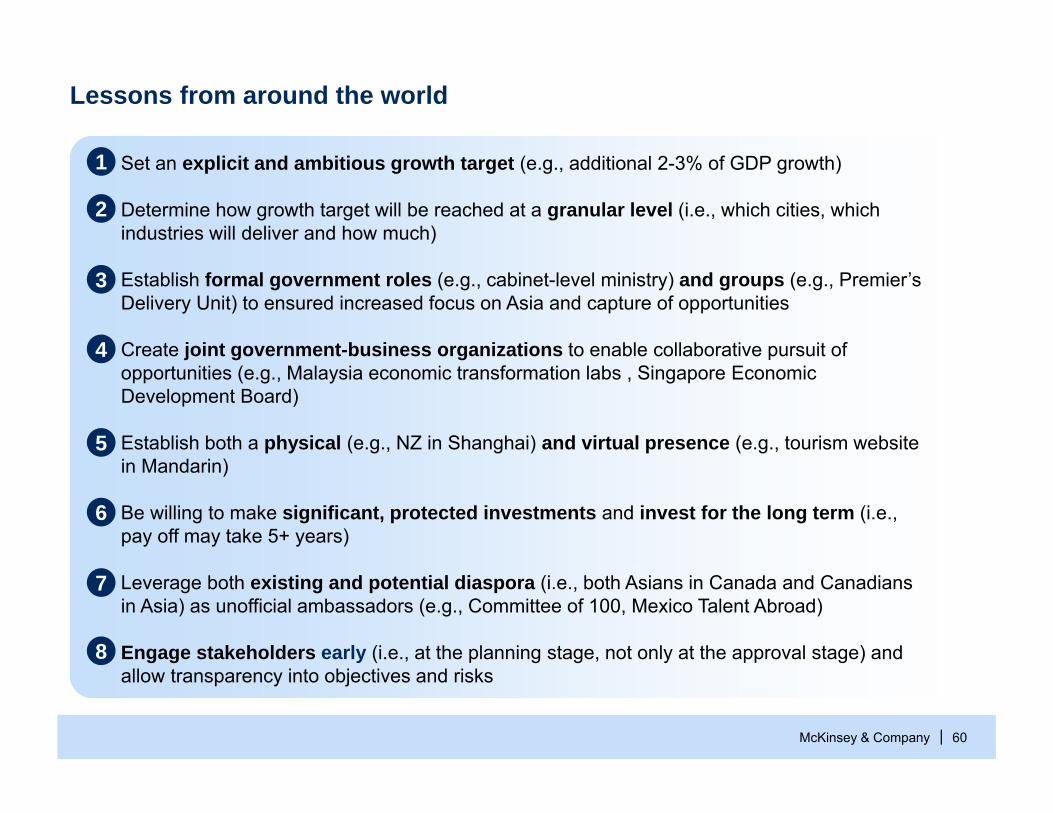
▪ Set an explicit and ambitious growth target (e.g., additional 2-3% of GDP growth)
▪ Determine how growth target will be reached at a granular level (i.e., which cities, which industries will deliver and how much)
▪ Establish formal government roles (e.g., cabinet-level ministry) and groups (e.g., Premier’s Delivery Unit) to ensured increased focus on Asia and capture of opportunities
▪ Create joint government-business organizations to enable collaborative pursuit of opportunities (e.g., Malaysia economic transformation labs , Singapore Economic Development Board)
▪ Establish both a physical (e.g., NZ in Shanghai) and virtual presence (e.g., tourism website in Mandarin)
▪ Be willing to make significant, protected investments and invest for the long term (i.e., pay off may take 5+ years)
▪ Leverage both existing and potential diaspora (i.e., both Asians in Canada and Canadians in Asia) as unofficial ambassadors (e.g., Committee of 100, Mexico Talent Abroad)
▪ Engage stakeholders early (i.e., at the planning stage, not only at the approval stage) and allow transparency into objectives and risks
1
2
3
4
5
6
8
Lessons from around the world
7
McKinsey & Company | 61
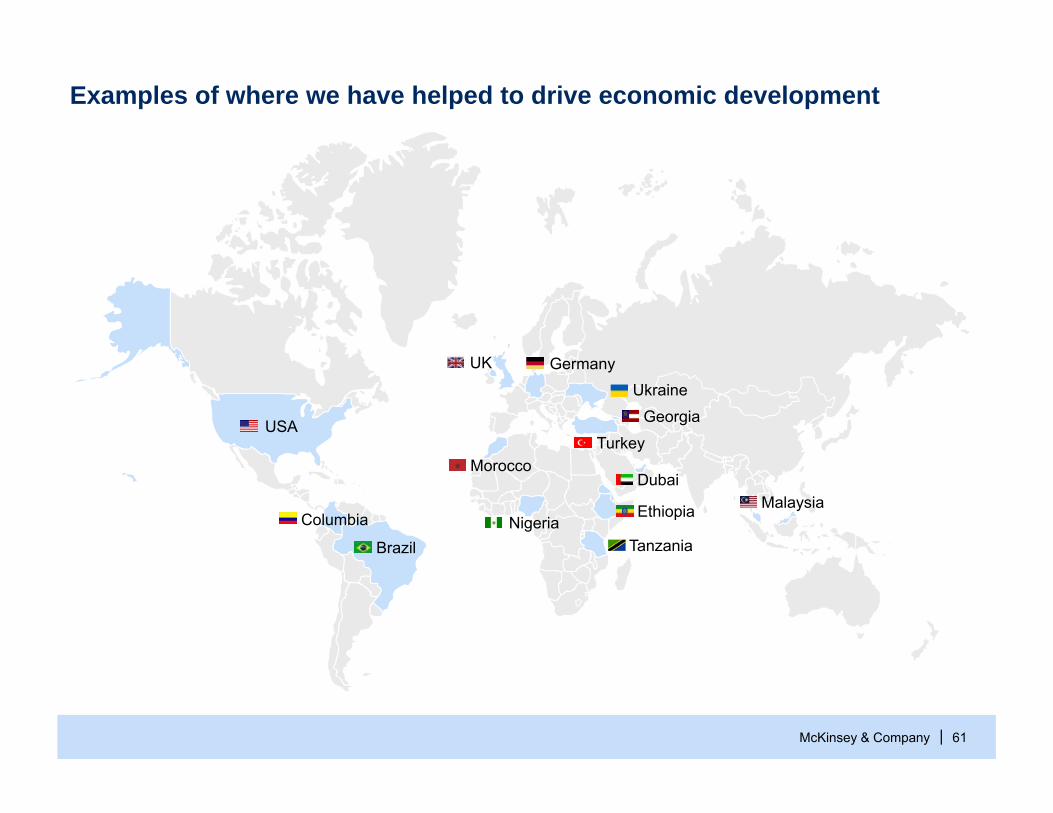
Examples of where we have helped to drive economic development
Tanzania
Turkey
UK
Georgia
MalaysiaNigeria
Dubai
Brazil
USA
GermanyUkraine
Morocco
EthiopiaColumbia
McKinsey & Company | 62
▪ Be in the top 3 most competitive countries in Latin America
▪ Cultivate a business environment that attracts local and foreign investment (30% of GDP)
▪ Raise the proportion of high value-added goods and services to 60% of exports (19% in 2006)
▪ Quadruple GDP per capita, from $5,000 to $18,000 –become a mid-high income country
▪ Substantially improve quality of life and decrease poverty level to <15% (45% in 2006)
Colombia set an ambitious set of goals to improve its attractiveness to foreign businesses and consumers
Productivity Transformation Program
McKinsey & Company | 63
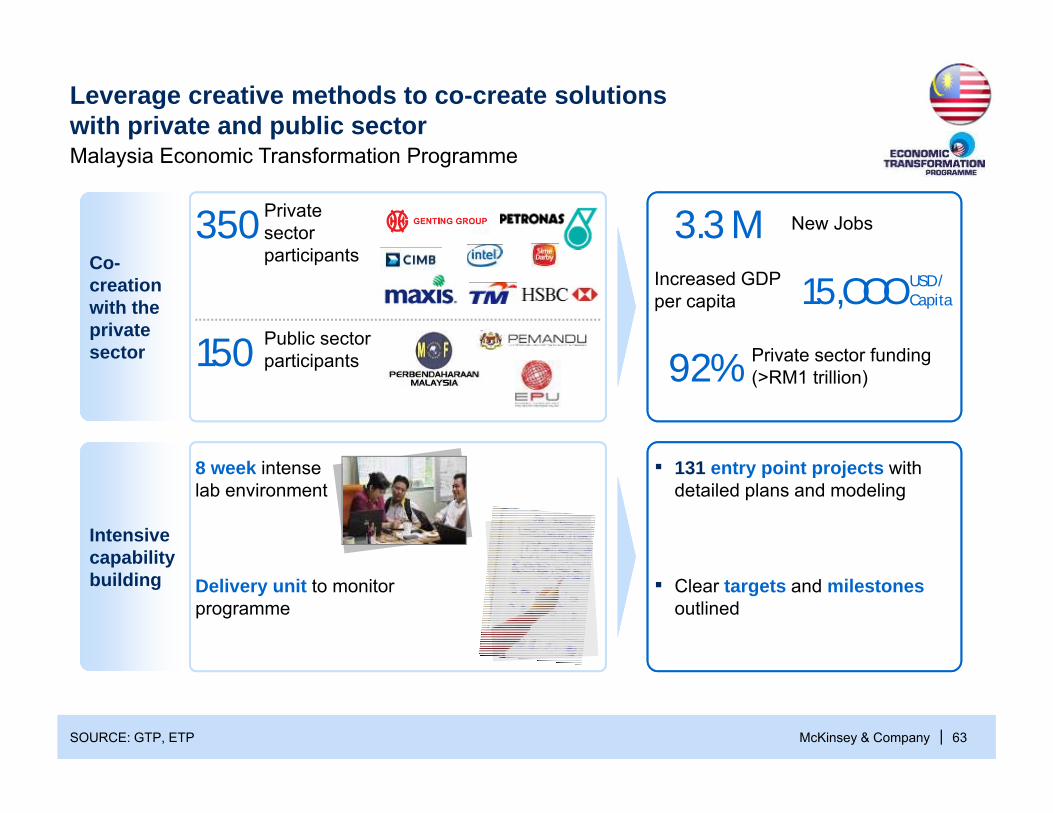
Leverage creative methods to co-create solutionswith private and public sector
SOURCE: GTP, ETP
Malaysia Economic Transformation Programme
Intensive capability building
Co-creation with the private sector
Private sectorparticipants
Public sectorparticipants150
350 New Jobs3.3 M
15,OOO
92%
▪ 131 entry point projects with detailed plans and modeling
▪ Clear targets and milestonesoutlined
Increased GDP per capita
Private sector funding (>RM1 trillion)
USD / Capita
8 week intense lab environment
Delivery unit to monitor programme
McKinsey & Company | 64
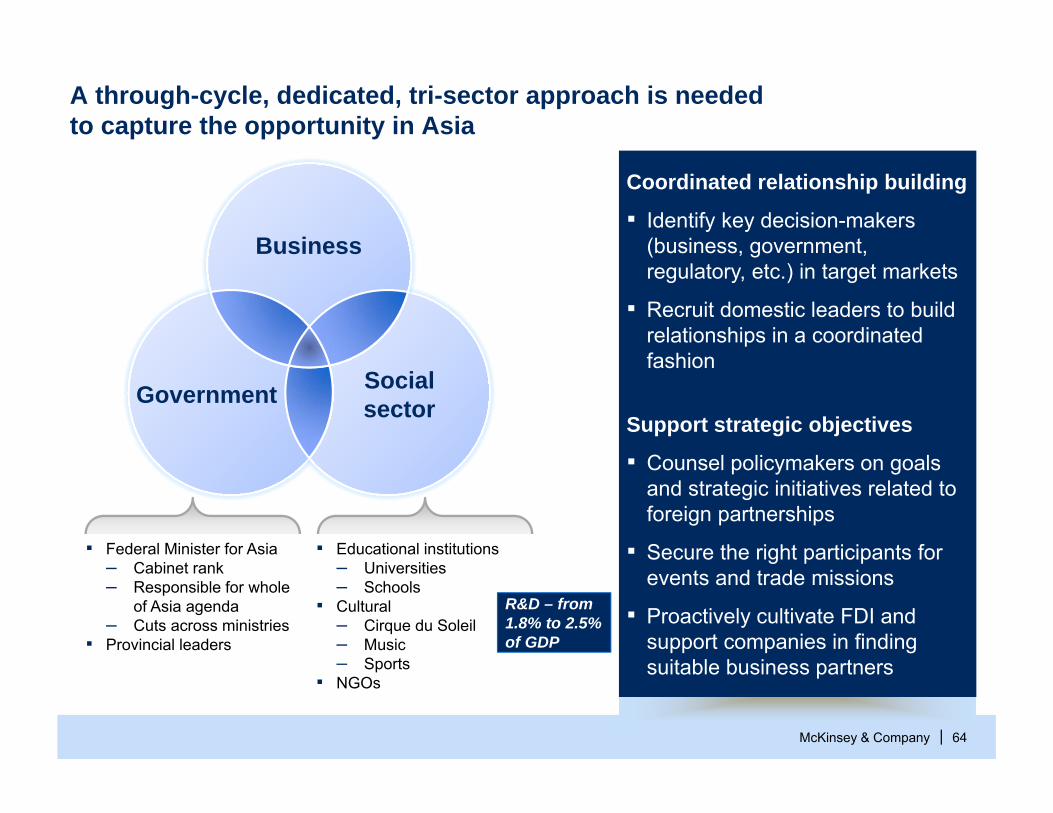
A through-cycle, dedicated, tri-sector approach is neededto capture the opportunity in Asia
Coordinated relationship building
▪ Identify key decision-makers (business, government, regulatory, etc.) in target markets
▪ Recruit domestic leaders to build relationships in a coordinated fashion
Support strategic objectives
▪ Counsel policymakers on goals and strategic initiatives related to foreign partnerships
▪ Secure the right participants for events and trade missions
▪ Proactively cultivate FDI and support companies in finding suitable business partners
▪ Federal Minister for Asia– Cabinet rank– Responsible for whole
of Asia agenda– Cuts across ministries
▪ Provincial leaders
▪ Educational institutions– Universities– Schools
▪ Cultural– Cirque du Soleil– Music– Sports
▪ NGOs
R&D – from 1.8% to 2.5% of GDP
Business
Government Socialsector
McKinsey & Company | 6565
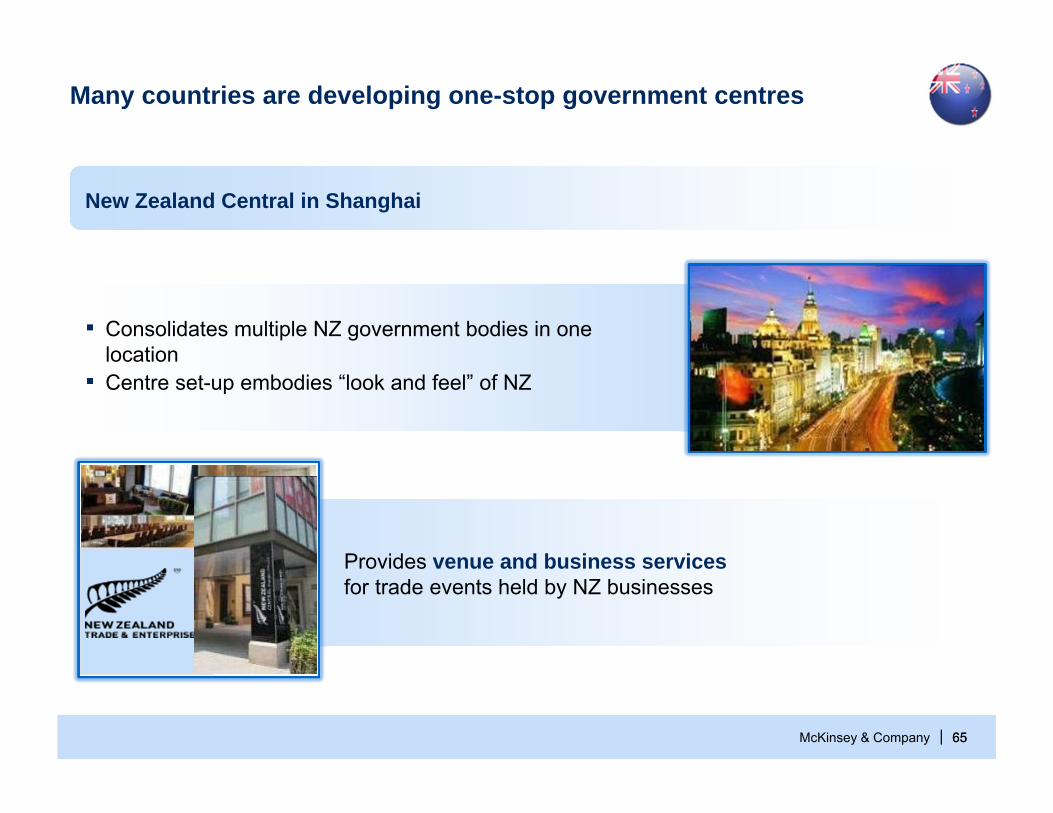
Many countries are developing one-stop government centres
Provides venue and business services for trade events held by NZ businesses
New Zealand Central in Shanghai
▪ Consolidates multiple NZ government bodies in one location
▪ Centre set-up embodies “look and feel” of NZ
McKinsey & Company | 66
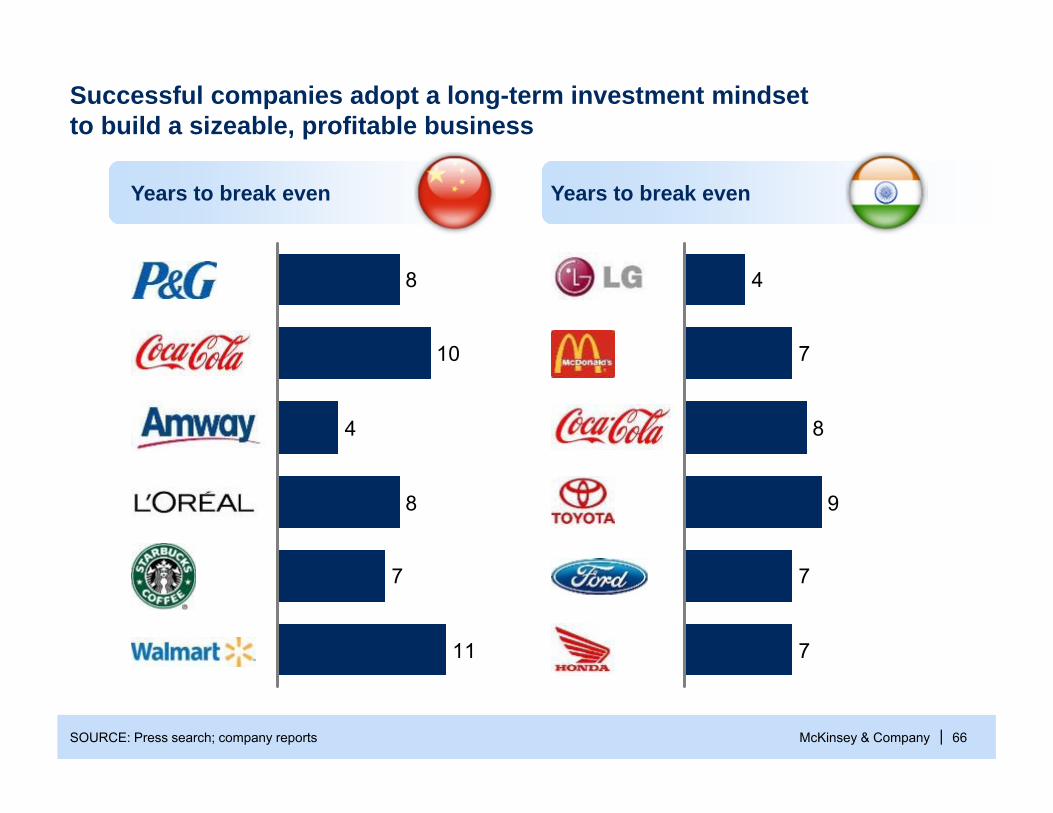
Years to break even Years to break even
11
7
8
4
10
8
Successful companies adopt a long-term investment mindsetto build a sizeable, profitable business
SOURCE: Press search; company reports
7
7
9
8
7
4
McKinsey & Company | 67
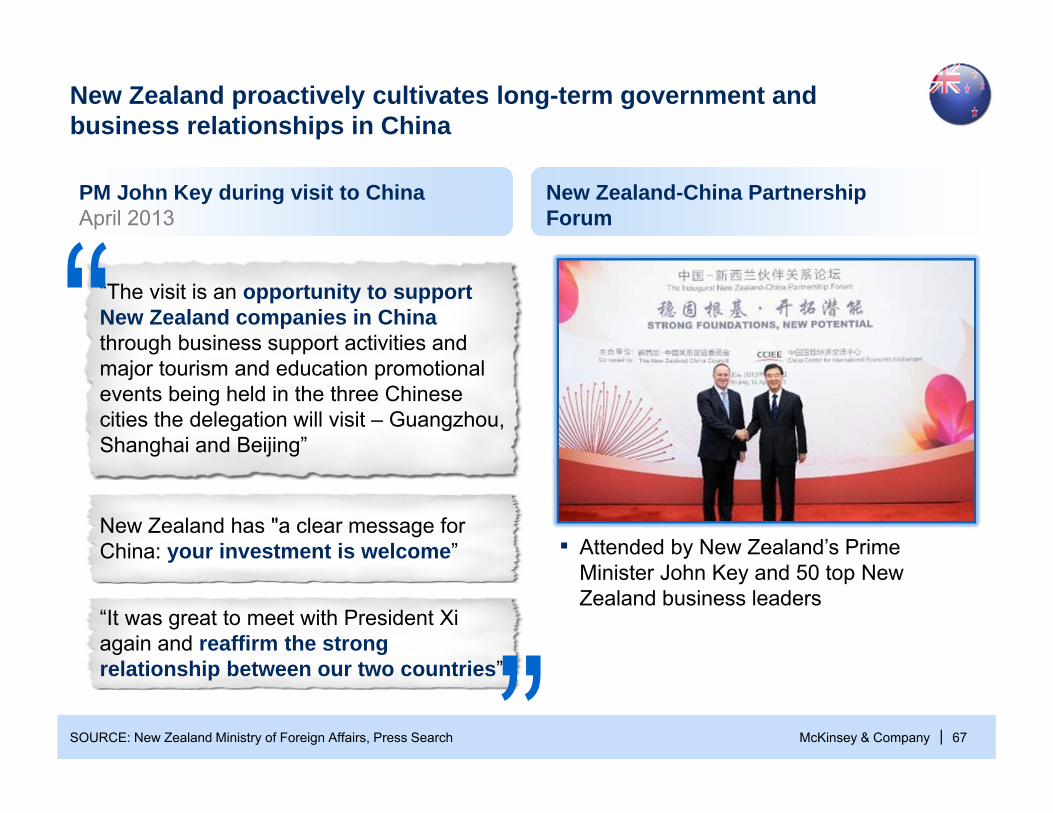
New Zealand proactively cultivates long-term government and business relationships in China
SOURCE: New Zealand Ministry of Foreign Affairs, Press Search
PM John Key during visit to ChinaApril 2013
▪ Attended by New Zealand’s Prime Minister John Key and 50 top New Zealand business leaders
New Zealand-China PartnershipForum
“The visit is an opportunity to support New Zealand companies in China through business support activities and major tourism and education promotional events being held in the three Chinese cities the delegation will visit – Guangzhou, Shanghai and Beijing”
New Zealand has "a clear message for China: your investment is welcome”
“It was great to meet with President Xi again and reaffirm the strong relationship between our two countries”
McKinsey & Company | 68SOURCE: Literature search; press releases
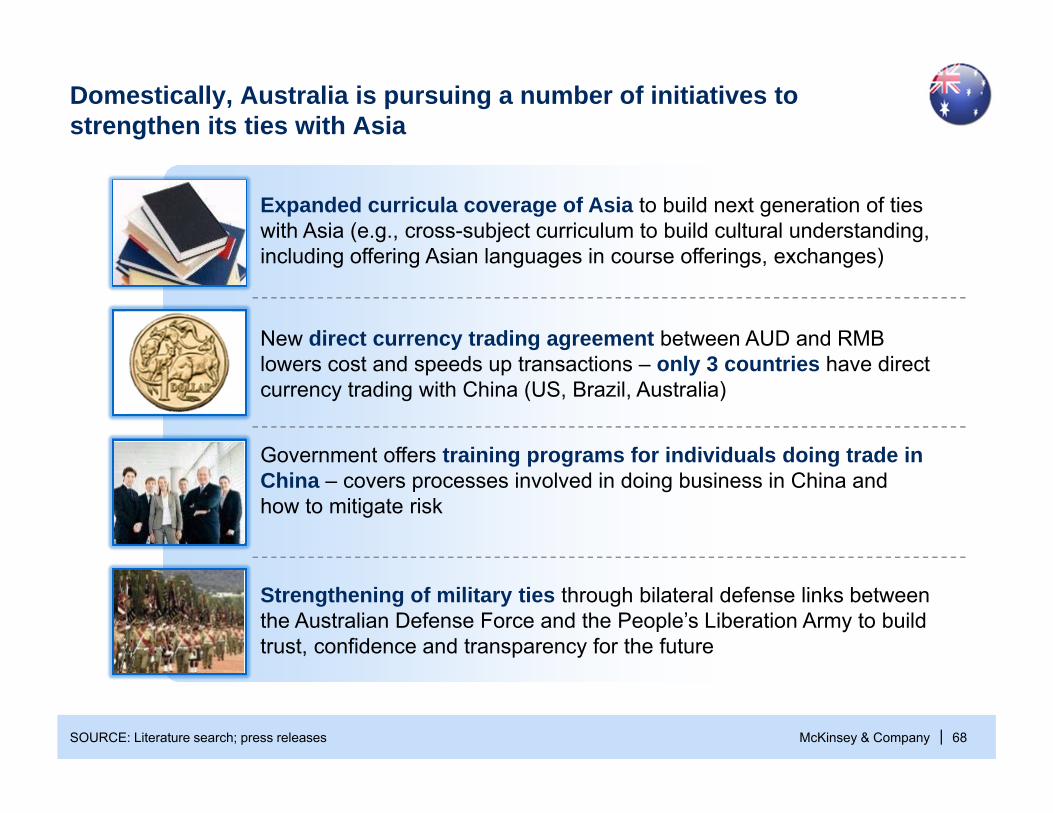
Domestically, Australia is pursuing a number of initiatives to strengthen its ties with Asia
New direct currency trading agreement between AUD and RMBlowers cost and speeds up transactions – only 3 countries have direct currency trading with China (US, Brazil, Australia)
Expanded curricula coverage of Asia to build next generation of ties with Asia (e.g., cross-subject curriculum to build cultural understanding, including offering Asian languages in course offerings, exchanges)
Government offers training programs for individuals doing trade in China – covers processes involved in doing business in China and how to mitigate risk
Strengthening of military ties through bilateral defense links between the Australian Defense Force and the People’s Liberation Army to build trust, confidence and transparency for the future
McKinsey & Company | 69
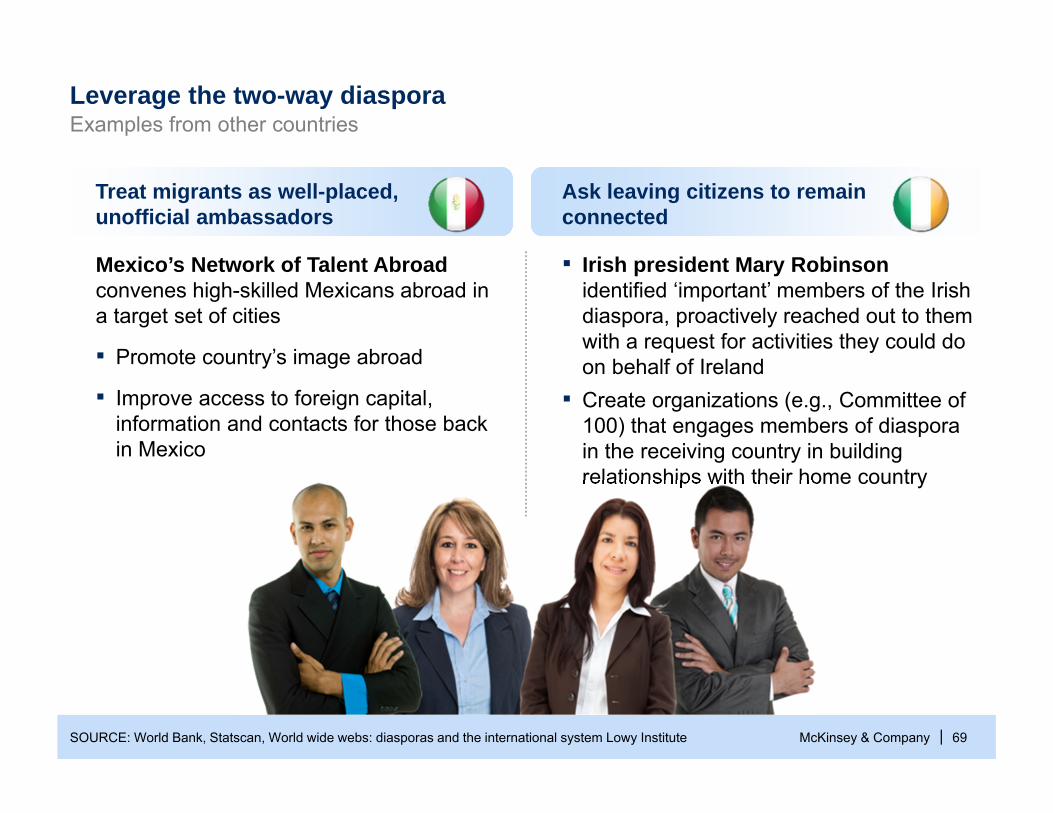
Leverage the two-way diaspora
SOURCE: World Bank, Statscan, World wide webs: diasporas and the international system Lowy Institute
Mexico’s Network of Talent Abroad convenes high-skilled Mexicans abroad in a target set of cities
▪ Promote country’s image abroad
▪ Improve access to foreign capital, information and contacts for those back in Mexico
▪ Irish president Mary Robinson identified ‘important’ members of the Irish diaspora, proactively reached out to them with a request for activities they could do on behalf of Ireland
▪ Create organizations (e.g., Committee of 100) that engages members of diaspora in the receiving country in building relationships with their home country
Treat migrants as well-placed, unofficial ambassadors
Ask leaving citizens to remain connected
Examples from other countries
Looking toward the futureBusiness Council of British ColumbiaDominic Barton, Global Managing DirectorMcKinsey & CompanyMay 28, 2013
Recommended