Capital Management Issues
and ICAAP
Scott Collings
18 October 2012
Copyright 2012 | Finity Consulting
2
Agenda
Capital Adequacy - Recent industry experience
Implications of new LAGIC rules
• Investment strategy
• Reinsurance
• Capital structure
ICAAP – setting capital management trigger levels
3
Capital Adequacy Trends
An exciting decade for Industry capital
Started with HIH imploding, Royal Commission
APRA and a new prudential regime introduced ‘02
The Good times:
• tort reform, benign event experience and solid
investment markets
Were followed by the Not So Good times:
• Heavy natural event experience, GFC, poor
investment markets and sharply lower interest rates
. . . and then came LAGIC . . .
4
Capital Adequacy Trends
Analysis of insurer solvency trends
Using APRA and ISC company level data
Analysis restricted to only active ‘typical’ insurers
• Excluded: runoff, LMI, Medical, Captives
• Results weighted by minimum capital requirement
5
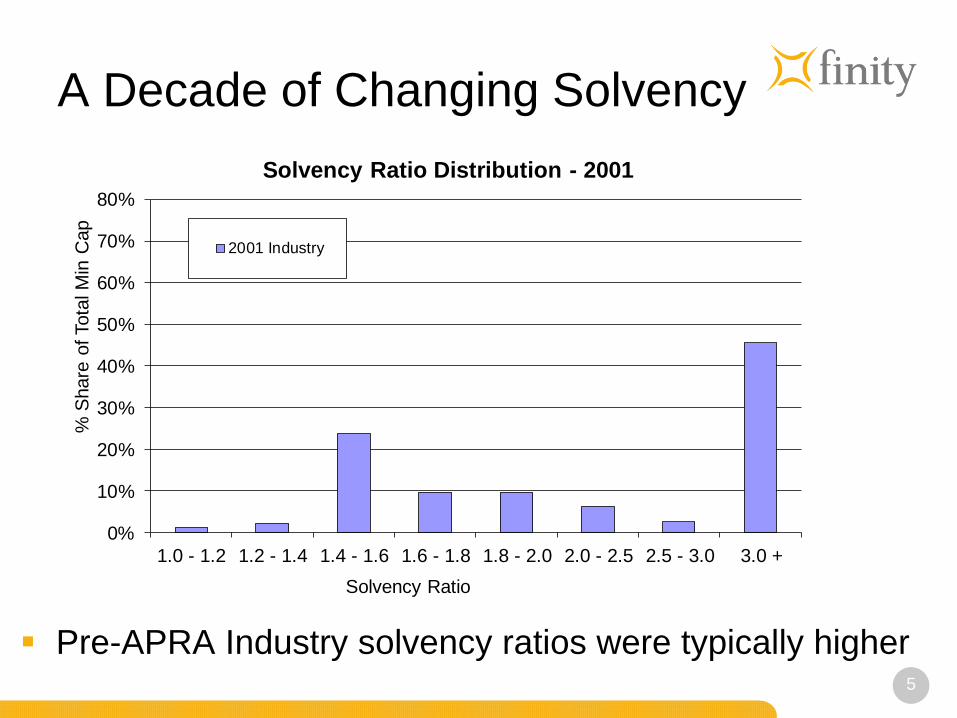
A Decade of Changing Solvency
Pre-APRA Industry solvency ratios were typically higher
0%
10%
20%
30%
40%
50%
60%
70%
80%
1.0 - 1.2 1.2 - 1.4 1.4 - 1.6 1.6 - 1.8 1.8 - 2.0 2.0 - 2.5 2.5 - 3.0 3.0 +
% S
hare
of Tota
l M
in C
ap
Solvency Ratio
Solvency Ratio Distribution - 2001
2001 Industry
6
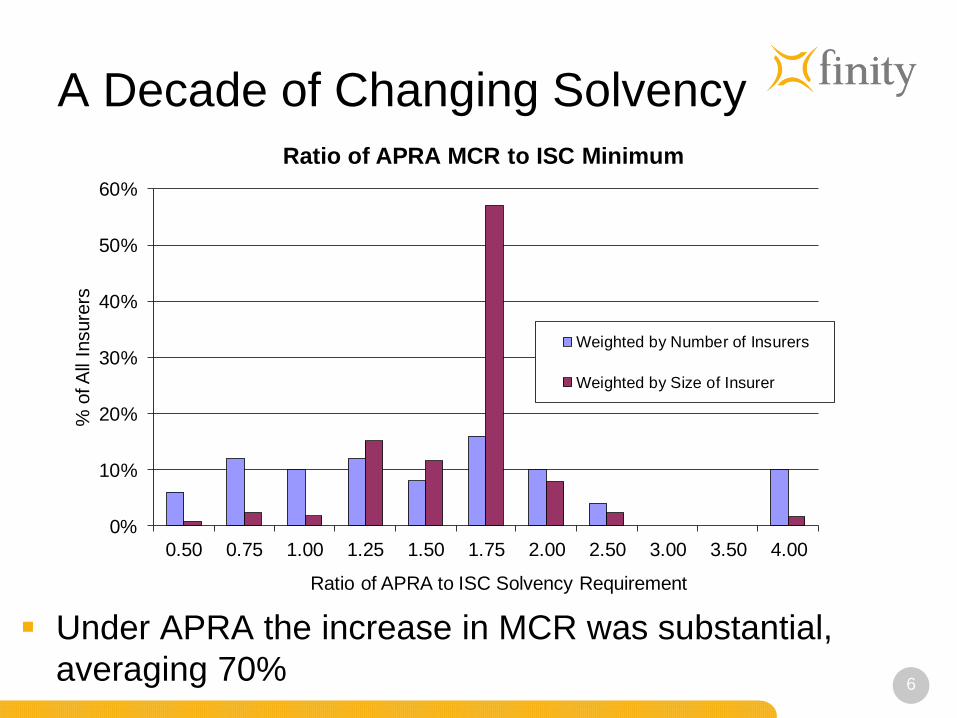
A Decade of Changing Solvency
Under APRA the increase in MCR was substantial,
averaging 70%
0%
10%
20%
30%
40%
50%
60%
0.50 0.75 1.00 1.25 1.50 1.75 2.00 2.50 3.00 3.50 4.00
% o
f A
ll In
sure
rs
Ratio of APRA to ISC Solvency Requirement
Ratio of APRA MCR to ISC Minimum
Weighted by Number of Insurers
Weighted by Size of Insurer
7
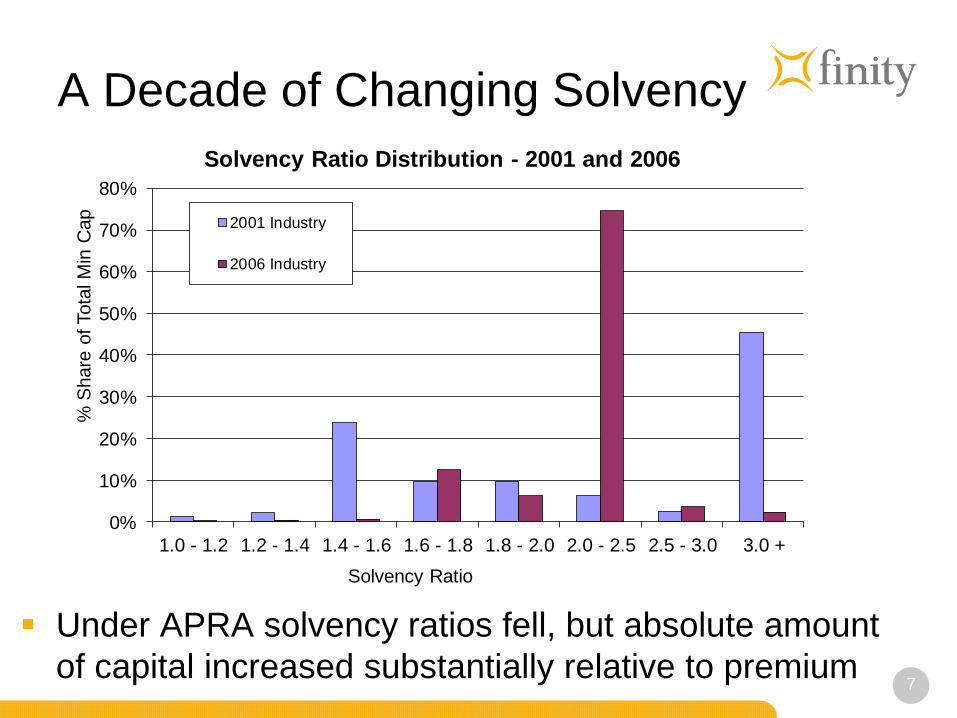
A Decade of Changing Solvency
Under APRA solvency ratios fell, but absolute amount
of capital increased substantially relative to premium
0%
10%
20%
30%
40%
50%
60%
70%
80%
1.0 - 1.2 1.2 - 1.4 1.4 - 1.6 1.6 - 1.8 1.8 - 2.0 2.0 - 2.5 2.5 - 3.0 3.0 +
% S
hare
of Tota
l M
in C
ap
Solvency Ratio
Solvency Ratio Distribution - 2001 and 2006
2001 Industry
2006 Industry
8
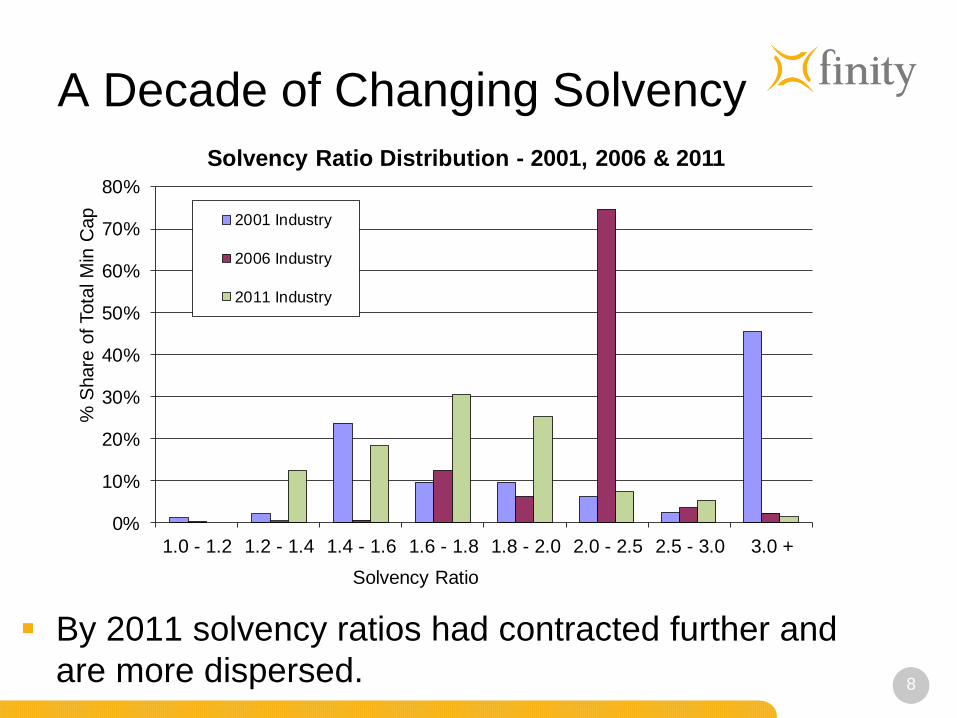
A Decade of Changing Solvency
By 2011 solvency ratios had contracted further and
are more dispersed.
0%
10%
20%
30%
40%
50%
60%
70%
80%
1.0 - 1.2 1.2 - 1.4 1.4 - 1.6 1.6 - 1.8 1.8 - 2.0 2.0 - 2.5 2.5 - 3.0 3.0 +
% S
hare
of Tota
l M
in C
ap
Solvency Ratio
Solvency Ratio Distribution - 2001, 2006 & 2011
2001 Industry
2006 Industry
2011 Industry
9
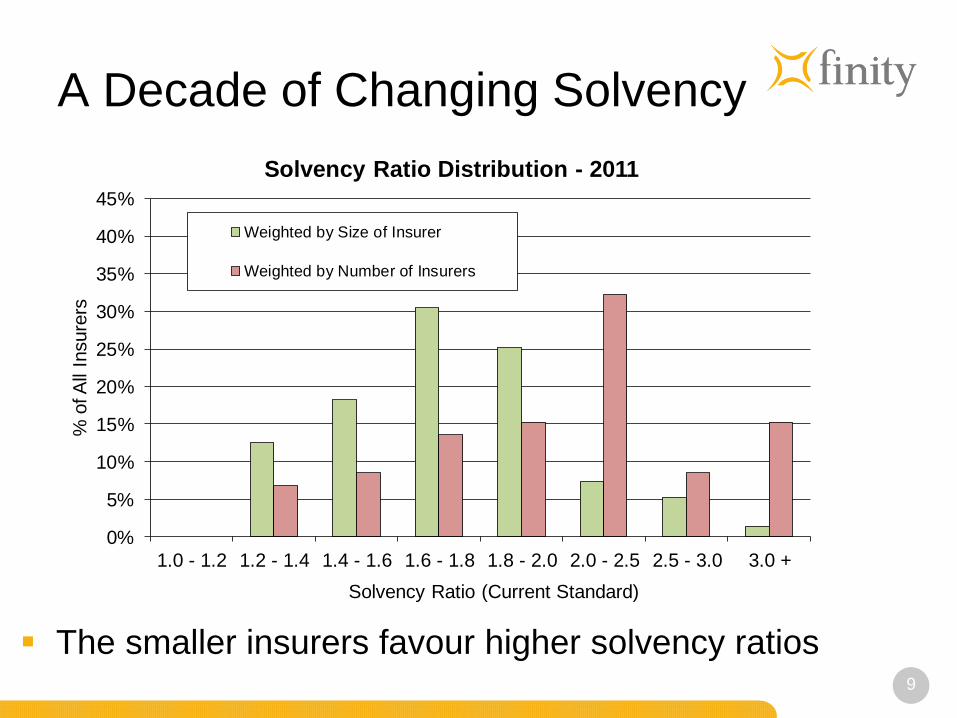
A Decade of Changing Solvency
The smaller insurers favour higher solvency ratios
0%
5%
10%
15%
20%
25%
30%
35%
40%
45%
1.0 - 1.2 1.2 - 1.4 1.4 - 1.6 1.6 - 1.8 1.8 - 2.0 2.0 - 2.5 2.5 - 3.0 3.0 +
% o
f A
ll In
sure
rs
Solvency Ratio (Current Standard)
Solvency Ratio Distribution - 2011
Weighted by Size of Insurer
Weighted by Number of Insurers
10
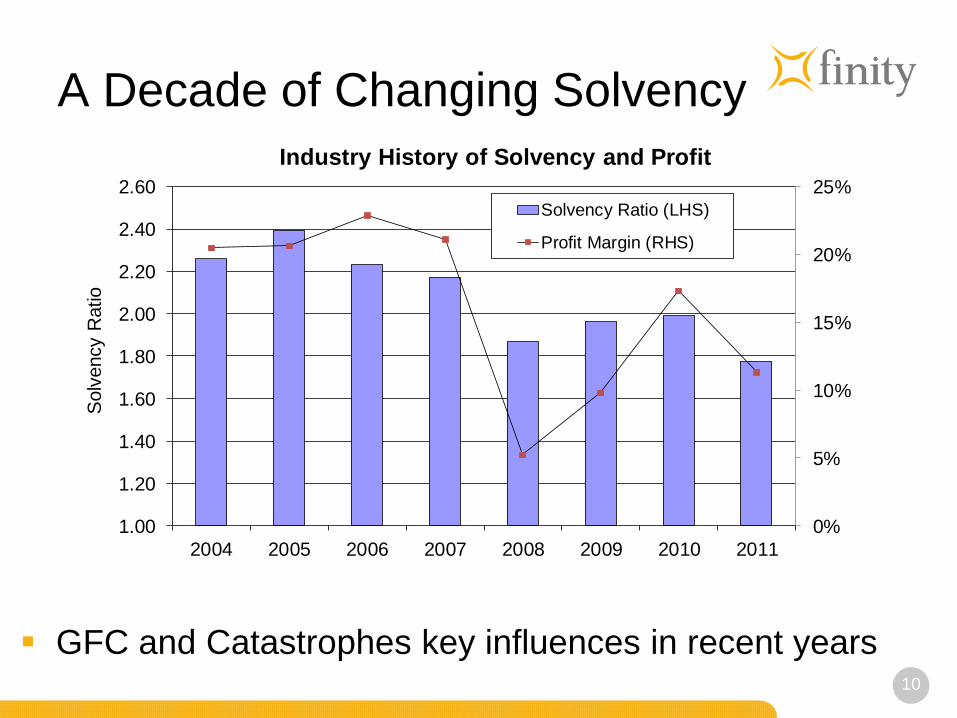
A Decade of Changing Solvency
GFC and Catastrophes key influences in recent years
0%
5%
10%
15%
20%
25%
1.00
1.20
1.40
1.60
1.80
2.00
2.20
2.40
2.60
2004 2005 2006 2007 2008 2009 2010 2011
Solv
ency R
atio
Industry History of Solvency and Profit
Solvency Ratio (LHS)
Profit Margin (RHS)
11
Solvency set to be changed again
- this time by LAGIC
Some Background
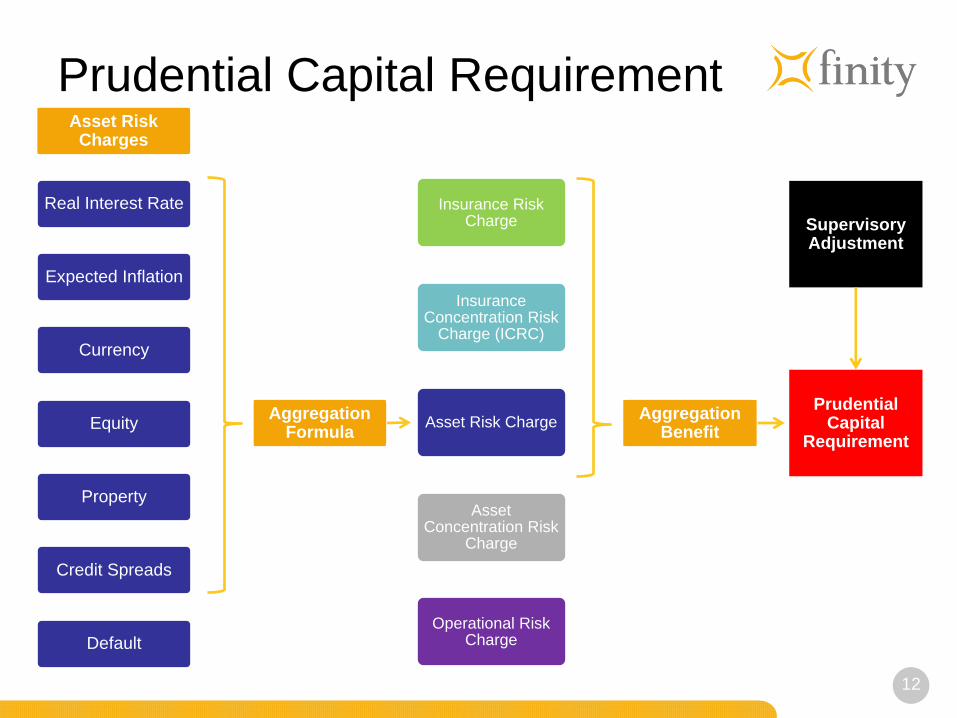
The new minimum capital requirement is the PCR,
replacing the previous MCR
Prudential Capital Requirement (PCR)
Equals
Prescribed Capital Amount + Supervisory Adjustment
PCA: can be determined either using:
• the ‘Standard Method’ (risk charges), or
• the Internal Model Method (IMM)
Supervisory Adjustment (Pillar 2): applied to reflect
risks not otherwise captured in the PCA
12
Prudential Capital Requirement
Real Interest Rate
Expected Inflation
Currency
Equity
Property
Credit Spreads
Default
Asset Risk Charges
Aggregation Formula
Insurance Risk Charge
Insurance Concentration Risk
Charge (ICRC)
Asset Risk Charge
Asset Concentration Risk
Charge
Operational Risk Charge
Aggregation Benefit
Prudential Capital
Requirement
Supervisory Adjustment
13
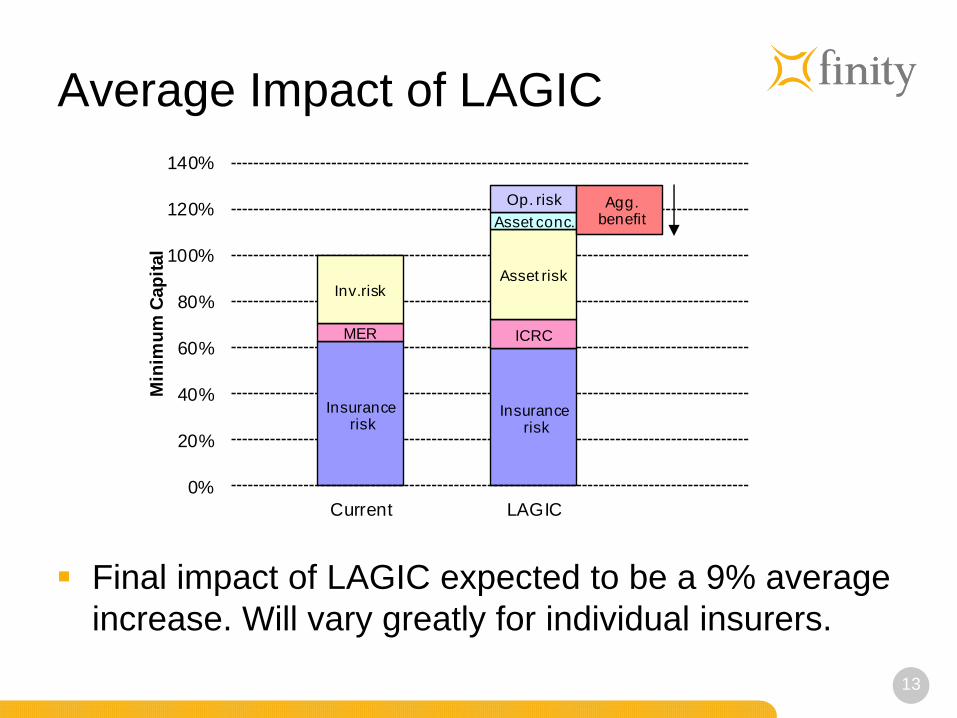
Average Impact of LAGIC
Final impact of LAGIC expected to be a 9% average
increase. Will vary greatly for individual insurers.
Insurancerisk
Insurancerisk
MER ICRC
Inv.riskAsset risk
Asset conc.
Op. risk Agg. benefit
0%
20%
40%
60%
80%
100%
120%
140%
Current LAGIC
Min
imu
m C
ap
ital
14
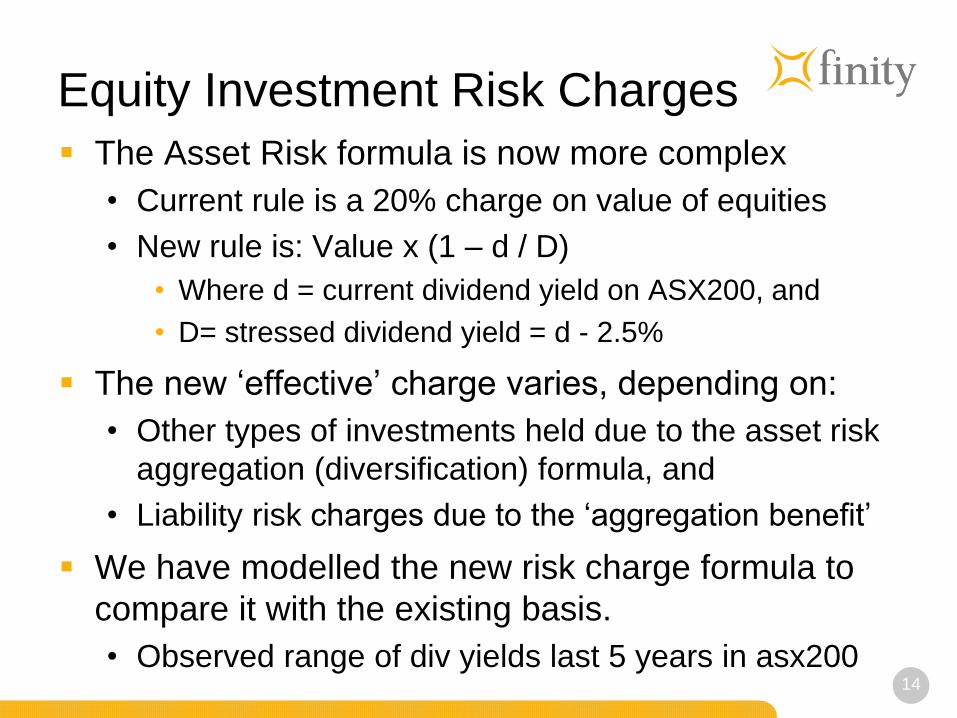
Equity Investment Risk Charges
The Asset Risk formula is now more complex
• Current rule is a 20% charge on value of equities
• New rule is: Value x (1 – d / D)
• Where d = current dividend yield on ASX200, and
• D= stressed dividend yield = d - 2.5%
The new ‘effective’ charge varies, depending on:
• Other types of investments held due to the asset risk
aggregation (diversification) formula, and
• Liability risk charges due to the ‘aggregation benefit’
We have modelled the new risk charge formula to
compare it with the existing basis.
• Observed range of div yields last 5 years in asx200
15
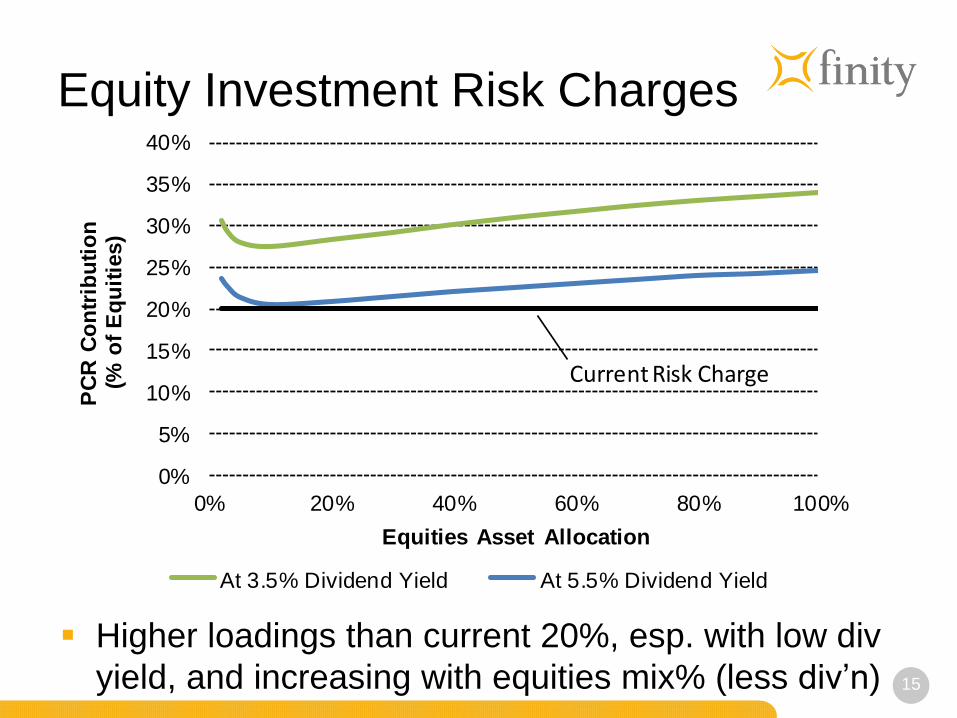
Equity Investment Risk Charges
Higher loadings than current 20%, esp. with low div
yield, and increasing with equities mix% (less div’n)
0%
5%
10%
15%
20%
25%
30%
35%
40%
0% 20% 40% 60% 80% 100%
PC
R C
on
trib
uti
on
(%
of
Eq
uit
ies)
Equities Asset Allocation
At 3.5% Dividend Yield At 5.5% Dividend Yield
Current Risk Charge
16
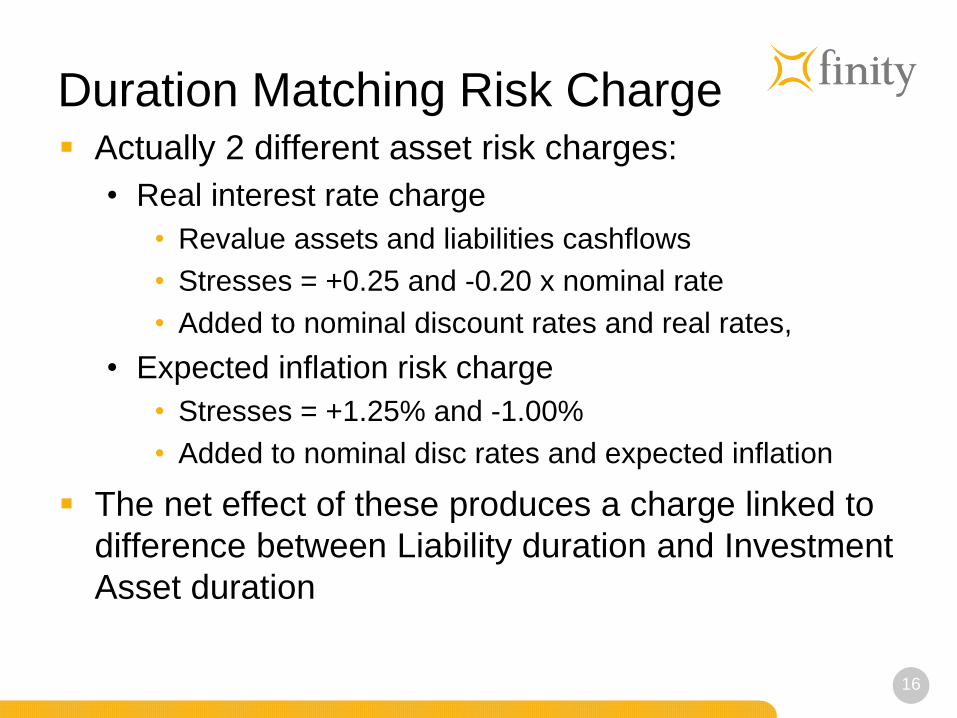
Duration Matching Risk Charge Actually 2 different asset risk charges:
• Real interest rate charge
• Revalue assets and liabilities cashflows
• Stresses = +0.25 and -0.20 x nominal rate
• Added to nominal discount rates and real rates,
• Expected inflation risk charge
• Stresses = +1.25% and -1.00%
• Added to nominal disc rates and expected inflation
The net effect of these produces a charge linked to
difference between Liability duration and Investment
Asset duration
17
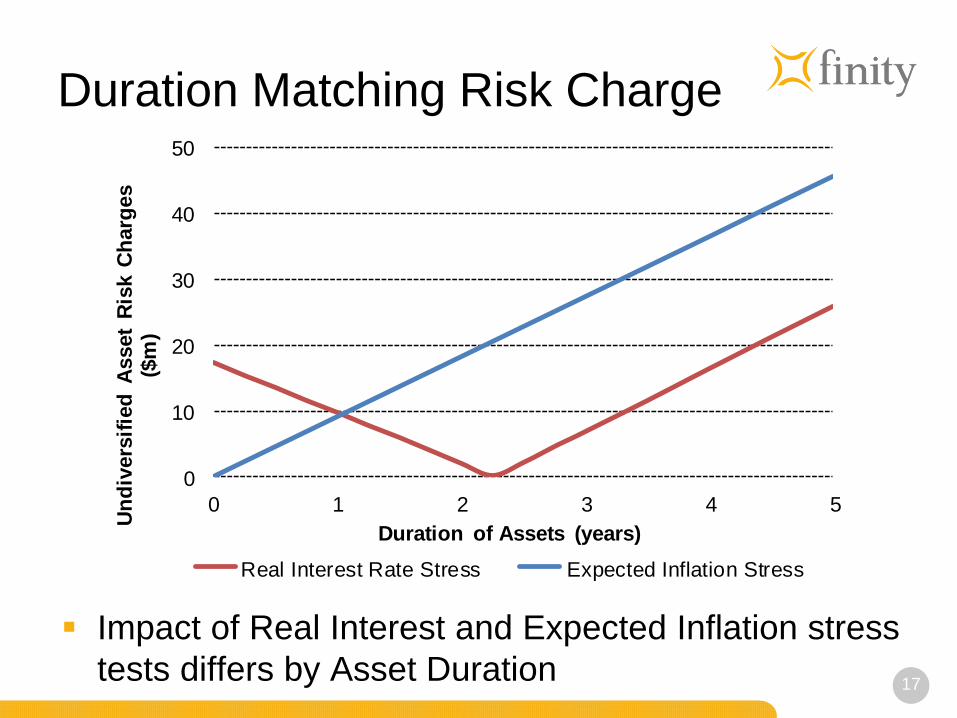
Duration Matching Risk Charge
Impact of Real Interest and Expected Inflation stress
tests differs by Asset Duration
0
10
20
30
40
50
0 1 2 3 4 5
Un
div
ers
ifie
d A
sset
Ris
k C
harg
es
($m
)
Duration of Assets (years)
Real Interest Rate Stress Expected Inflation Stress
18
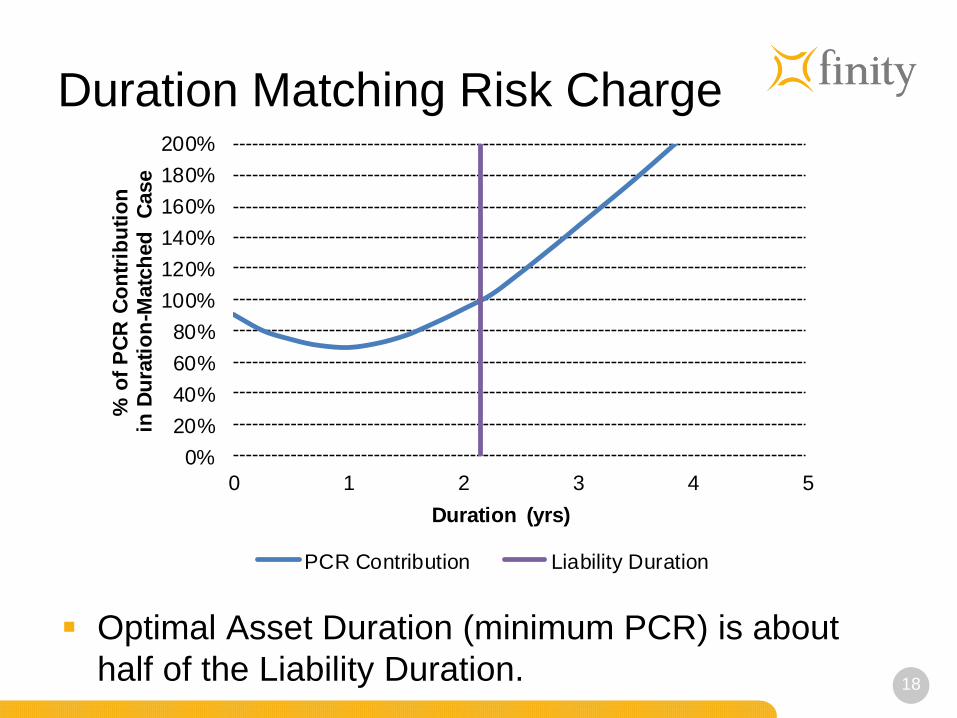
Duration Matching Risk Charge
Optimal Asset Duration (minimum PCR) is about
half of the Liability Duration.
0%
20%
40%
60%
80%
100%
120%
140%
160%
180%
200%
0 1 2 3 4 5
% o
f P
CR
Co
ntr
ibu
tio
nin
Du
rati
on
-Matc
hed
C
ase
Duration (yrs)
PCR Contribution Liability Duration
19
Liability Concentration Risk Maximum Event Retention (MER) to be replaced by Insurance
Concentration Risk Charge (ICRC) for accumulation exposures
For those with ‘natural perils’ exposure there will be a vertical
requirement (similar to MER) and a horizontal requirement
Vertical considers 1-in-200 year event (WOP)
Horizontal consists of 2 tests
• H(3) considers three 1-in-10 year events
• H(4) considers four 1-in-6 year events
• Net off the amount of annual ‘expected’ event costs
• Based on assumptions in the premium liability valuation
• Horizontal only applies from 1 January 2014
Most insurer’s have property cat retentions below 1-in-6 year events
• Therefore, H(4) will typically be the most important calculation
20
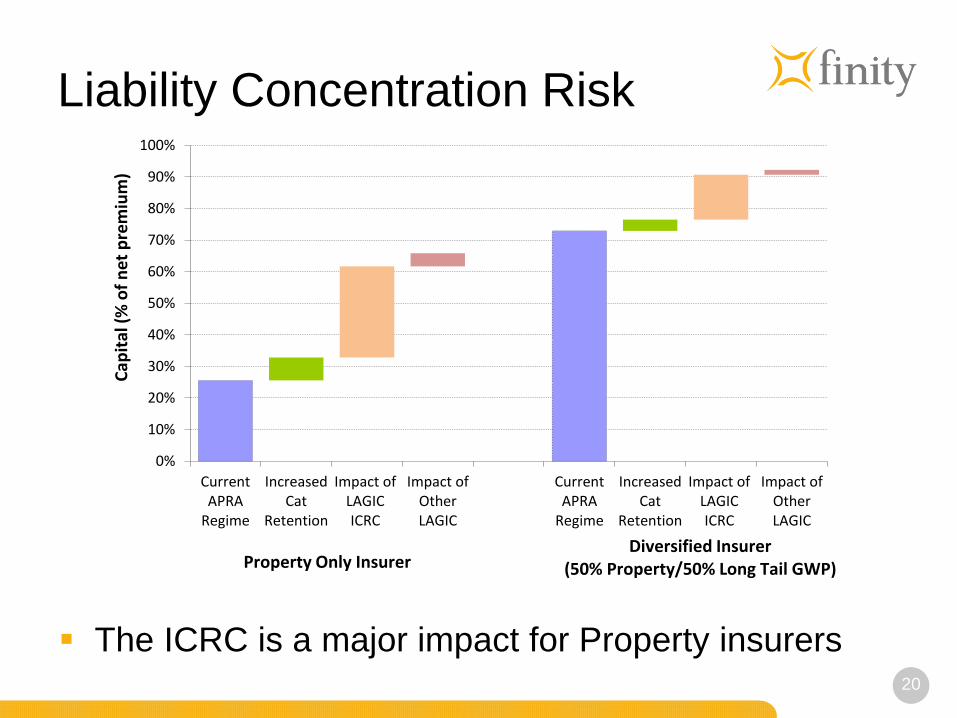
Liability Concentration Risk
The ICRC is a major impact for Property insurers
0%
10%
20%
30%
40%
50%
60%
70%
80%
90%
100%
CurrentAPRA
Regime
IncreasedCat
Retention
Impact ofLAGICICRC
Impact ofOtherLAGIC
CurrentAPRA
Regime
IncreasedCat
Retention
Impact ofLAGICICRC
Impact ofOtherLAGIC
Cap
ital
(%
of
net
pre
miu
m)
Property Only InsurerDiversified Insurer
(50% Property/50% Long Tail GWP)
21
Capital Base components
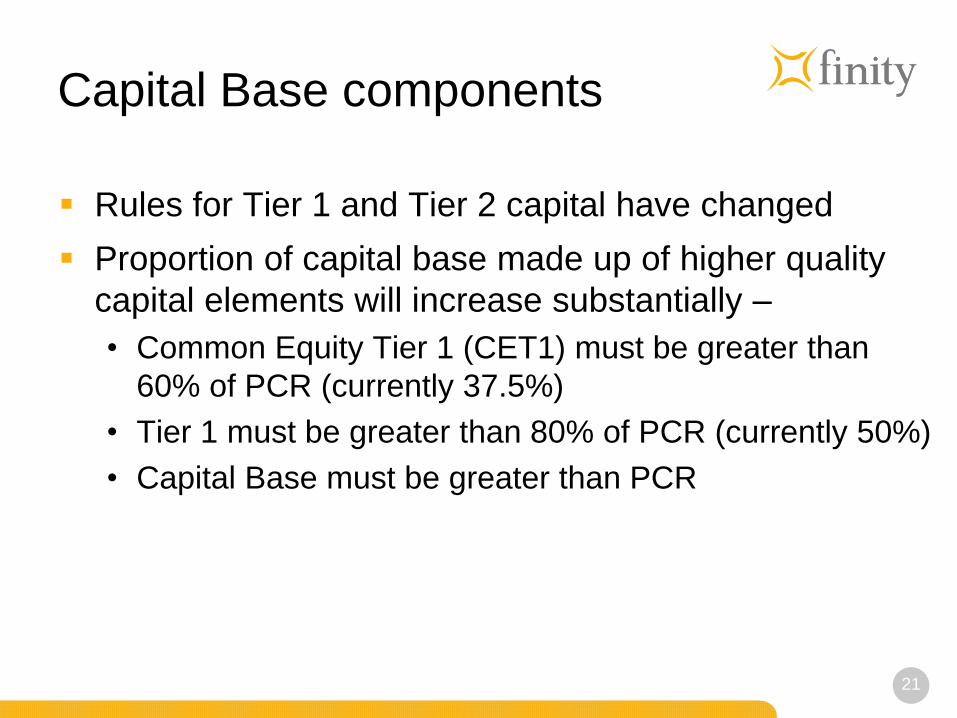
Rules for Tier 1 and Tier 2 capital have changed
Proportion of capital base made up of higher quality
capital elements will increase substantially –
• Common Equity Tier 1 (CET1) must be greater than
60% of PCR (currently 37.5%)
• Tier 1 must be greater than 80% of PCR (currently 50%)
• Capital Base must be greater than PCR
22
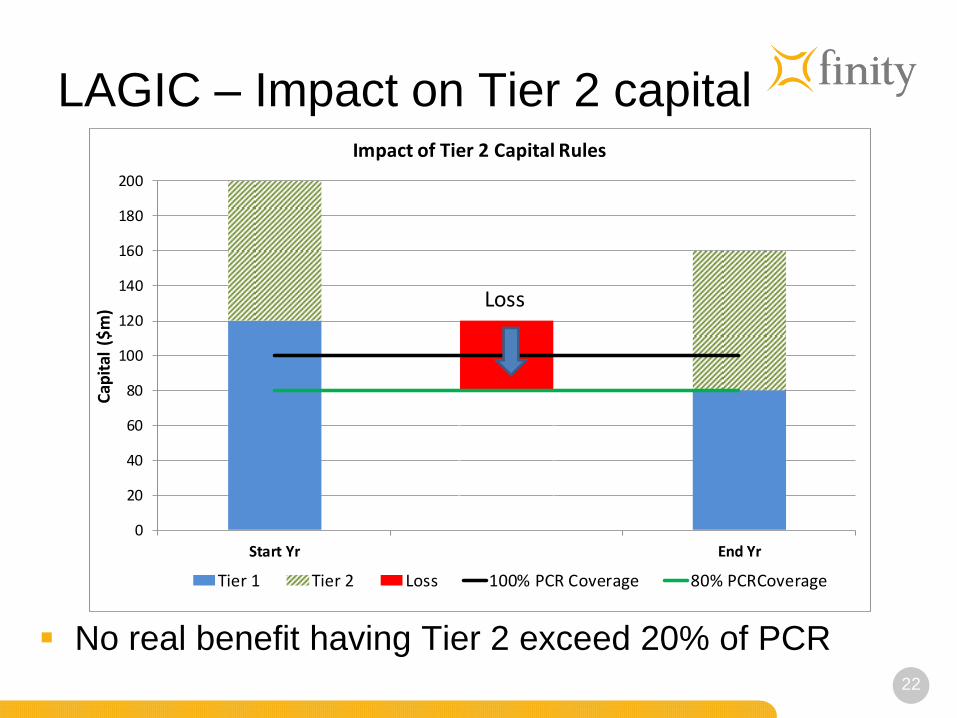
LAGIC – Impact on Tier 2 capital
No real benefit having Tier 2 exceed 20% of PCR
0
20
40
60
80
100
120
140
160
180
200
Start Yr End Yr
Cap
ital
($
m)
Impact of Tier 2 Capital Rules
Tier 1 Tier 2 Loss 100% PCR Coverage 80% PCRCoverage
Loss
23
ICAAP Capital Trigger Levels
A key aspect of an ICAAP is setting the capital levels
that will trigger specific capital management
responses
Each Insurer needs to consider:
• Future volatility of annual profit (and hence capital)
• Important capital thresholds where a capital
management decision is required
• Likelihood of breaching those thresholds
• The Board’s Risk Appetite
Understanding the potential variability of profits will
be key to matching risk appetite with trigger levels.
24
ICAAP Capital Trigger Levels
We have conducted Capital Volatility research
based on historical results of Australian insurers.
We used ISC and APRA company level statistics
• Selected only active insurers (no ‘run-off’ insurers)
• Excluded captives, LMI and Medical Indemnity
• Deleted any clearly incorrect data
The key statistic we used is :
• Net Profit (after-tax) / Minimum Capital Requirement
For pre-APRA periods the minimum solvency capital
was scaled up (x1.6) to approximate the APRA MCR
25
ICAAP Capital Trigger Levels
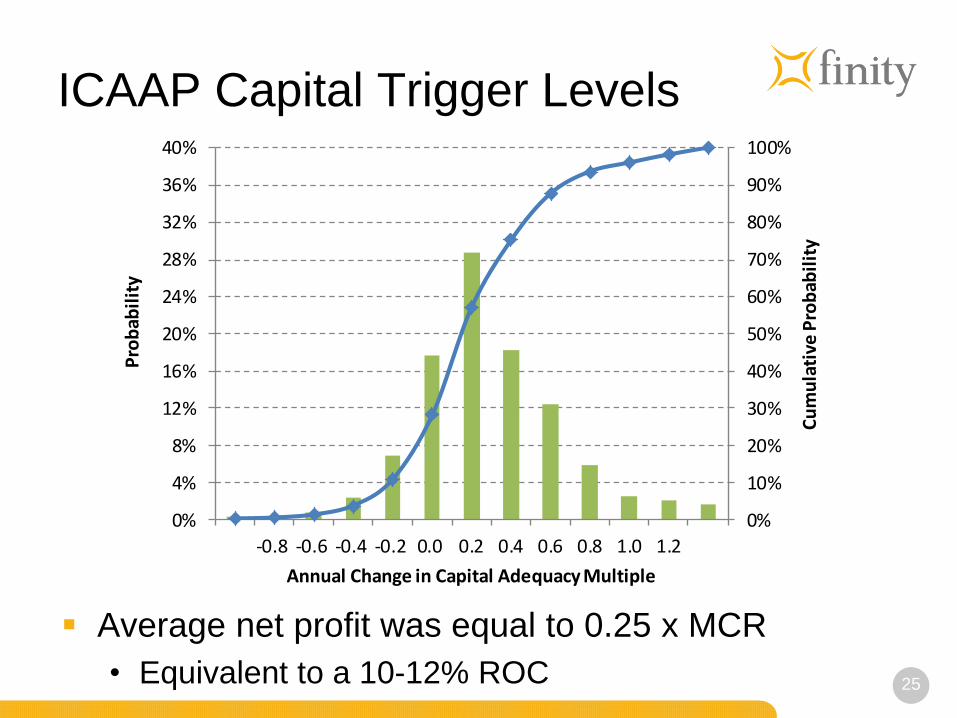
Average net profit was equal to 0.25 x MCR
• Equivalent to a 10-12% ROC
0%
10%
20%
30%
40%
50%
60%
70%
80%
90%
100%
0%
4%
8%
12%
16%
20%
24%
28%
32%
36%
40%
-0.8 -0.6 -0.4 -0.2 0.0 0.2 0.4 0.6 0.8 1.0 1.2
Cu
mu
lati
ve P
rob
abil
ity
Pro
bab
ilit
y
Annual Change in Capital Adequacy Multiple
26
ICAAP Capital Trigger Levels
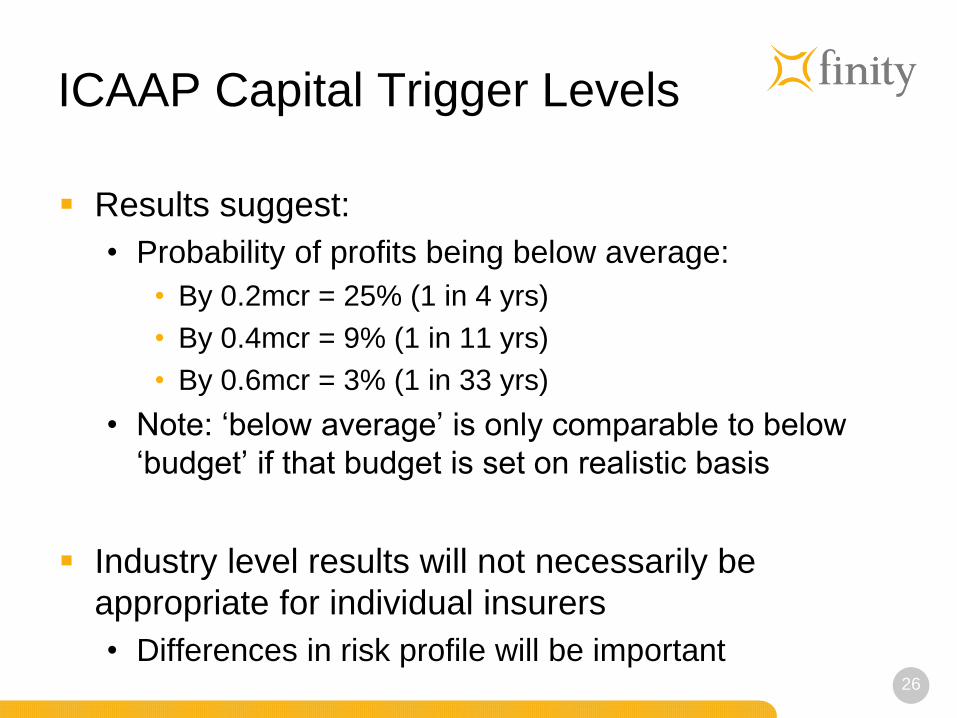
Results suggest:
• Probability of profits being below average:
• By 0.2mcr = 25% (1 in 4 yrs)
• By 0.4mcr = 9% (1 in 11 yrs)
• By 0.6mcr = 3% (1 in 33 yrs)
• Note: ‘below average’ is only comparable to below
‘budget’ if that budget is set on realistic basis
Industry level results will not necessarily be
appropriate for individual insurers
• Differences in risk profile will be important
27
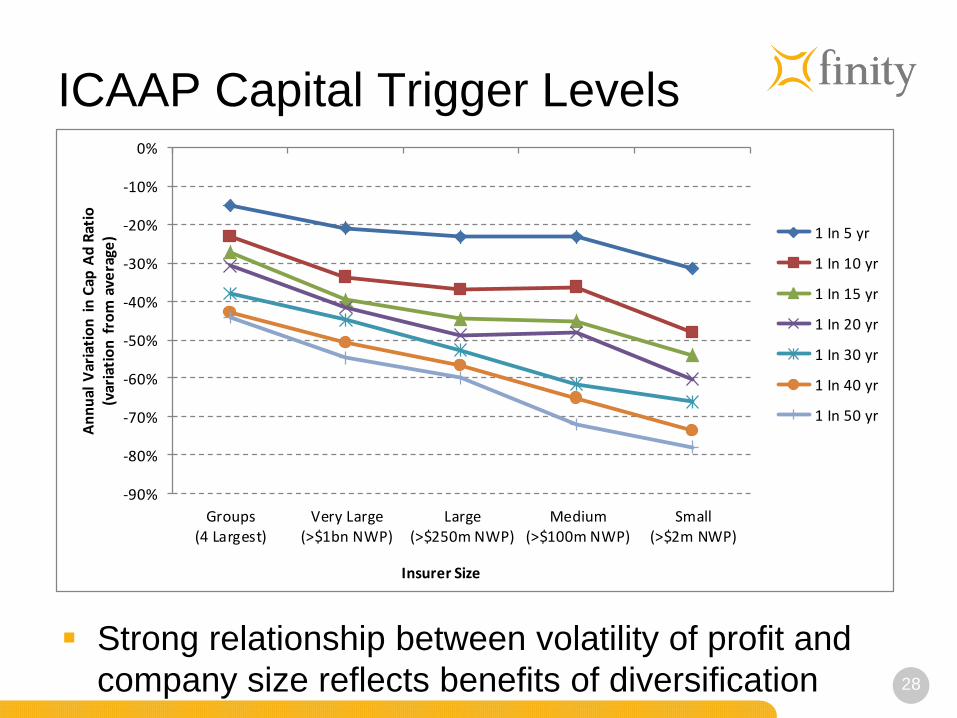
ICAAP Capital Trigger Levels
To further segment the analysis we considered size
Insurers were categorised based on annual NWP:
• small (>$2m), medium (>$100m), large (>$250m) and
very large (>$1bn)
NWP thresholds deflated historically for consistency
We also looked at current large consolidated groups
(QBE, IAG, Suncorp etc) on an ‘as if’ historical basis
28
ICAAP Capital Trigger Levels
Strong relationship between volatility of profit and
company size reflects benefits of diversification
-90%
-80%
-70%
-60%
-50%
-40%
-30%
-20%
-10%
0%
Groups(4 Largest)
Very Large(>$1bn NWP)
Large(>$250m NWP)
Medium(>$100m NWP)
Small(>$2m NWP)
An
nu
al V
aria
tio
n i
n C
ap A
d R
atio
(var
iati
on
fro
m a
vera
ge)
Insurer Size
1 In 5 yr
1 In 10 yr
1 In 15 yr
1 In 20 yr
1 In 30 yr
1 In 40 yr
1 In 50 yr
29
Summary
‘Average’ impact of LAGIC is relatively small, but
differential impact by Insurer may be substantial
Strategic responses to the new capital standards
• Reduced use of Tier 2 capital instruments
• Heightened focus on ALM and duration matching
• Tendency to invest assets ‘short’
• Reduced incentive to hold equities
• Strong desire to buy horizontal reinsurance cover
ICAAP will increase focus on profit volatility and
optimising risk profile to reduce capital requirements

30
Disclaimer
This presentation was made to the Finity Niche
Insurer Conference on 18 October 2012. It may be
incomplete in that the speaker may have discussed
or qualified matters not incorporated into the slides
The information is general in nature and may not be
applicable to your particular situation. It is not
actuarial advice and Finity Consulting will accept no
liability for any use to which it is put
If you have any questions or comments, the author
or another member of the Finity Consulting team
would be pleased to hear from you. Please contact
us on 02 8252 3300
Recommended