Cancer Cell
Article
Ultraconserved Regions Encoding ncRNAs AreAltered in Human Leukemias and CarcinomasGeorge A. Calin,1,11,12 Chang-gong Liu,1,11 Manuela Ferracin,4,11 Terry Hyslop,5 Riccardo Spizzo,1,12
Cinzia Sevignani,6 Muller Fabbri,1 Amelia Cimmino,1 Eun Joo Lee,2 Sylwia E. Wojcik,1 Masayoshi Shimizu,1,12
Esmerina Tili,1 Simona Rossi,3 Cristian Taccioli,1 Flavia Pichiorri,1 Xiuping Liu,1 Simona Zupo,7 Vlad Herlea,8
Laura Gramantieri,9 Giovanni Lanza,4 Hansjuerg Alder,1 Laura Rassenti,10 Stefano Volinia,1,3
Thomas D. Schmittgen,2 Thomas J. Kipps,10 Massimo Negrini,1,4,* and Carlo M. Croce1,*1Comprehensive Cancer Center2College of Pharmacy
Ohio State University, Columbus, OH 43210, USA3Morphology and Embryology Department4Department of Experimental and Diagnostic Medicine, Interdepartment Center for Cancer Research
University of Ferrara, Ferrara 44100, Italy5Division of Biostatistics, Department of Pharmacology and Experimental Therapeutics6Kimmel Cancer Center
Thomas Jefferson University, Philadelphia, PA 19107, USA7Advanced Biotechnology Center, Genoa 16132, Italy8University Clinical Fundeni Hospital, Bucharest 72437, Romania9Department of Internal Medicine and Gastroenterology, University of Bologna, Bologna 44100, Italy10Department of Medicine, University of California, San Diego, La Jolla, CA 92093, USA11These authors contributed equally to this work.12Present address: Experimental Therapeutics Department, M.D. Anderson Cancer Center, University of Texas, Houston,
TX 77030, USA.
*Correspondence: [email protected] (C.M.C.), [email protected] (M.N.)
DOI 10.1016/j.ccr.2007.07.027
SUMMARY
Noncoding RNA (ncRNA) transcripts are thought to be involved in human tumorigenesis. We reportthat a large fraction of genomic ultraconserved regions (UCRs) encode a particular set of ncRNAswhose expression is altered in human cancers. Genome-wide profiling revealed that UCRs have dis-tinct signatures in human leukemias and carcinomas. UCRs are frequently located at fragile sites andgenomic regions involved in cancers. We identified certain UCRs whose expression may be regulatedby microRNAs abnormally expressed in human chronic lymphocytic leukemia, and we proved thatthe inhibition of an overexpressed UCR induces apoptosis in colon cancer cells. Our findings arguethat ncRNAs and interaction between noncoding genes are involved in tumorigenesis to a greaterextent than previously thought.
INTRODUCTION
All malignant cells have specific alterations at DNA loci
that encode genes for oncoproteins or tumor suppressors
Cance
(Balmain et al., 2003; Wooster and Weber, 2003). This
common feature has recently been expanded to include
a large class of noncoding RNAs (ncRNAs) called micro-
RNAs (miRNAs) (Ambros, 2004) that are also involved in
SIGNIFICANCE
Common features of the genomic architecture of malignant cells are specific alterations at loci harboring genescoding for oncoproteins or tumor suppressors. In the last few years, this dogma of molecular oncology has evolvedwith the inclusion of a large class of noncoding RNAs (ncRNAs) named microRNAs (miRNAs) in the ever-expandinglist of genes involved in cancer initiation and progression. We demonstrate that another class of genes encodingncRNAs, comprising hundreds of transcribed ultraconserved regions (T-UCRs), is consistently altered at the ge-nomic level in a significant percentage of analyzed leukemias and carcinomas and that miRNAs may interact withT-UCRs. This offers the prospect of defining tumor-specific signatures of ncRNAs that are associated with diag-nosis, prognosis, and response to treatment.
r Cell 12, 215–229, September 2007 ª2007 Elsevier Inc. 215

Cancer Cell
Ultraconserved Regions and Human Cancers
cancer initiation and progression (Calin et al., 2002; Croce
and Calin, 2005; Berezikov and Plasterk, 2005a; Esquela-
Kerscher and Slack, 2006; Calin and Croce, 2006a).
MiRNAs affect the regulation of gene expression at both
the transcriptional and posttranscriptional levels (Ambros,
2003, 2004).
The extent of involvement of miRNAs and the involve-
ment of other classes of ncRNAs in human tumorigenesis
is unknown. Research into these questions will offer new
insights into the molecular mechanisms and signal trans-
duction pathways altered in cancer and also present
unexpected opportunities for the identification of new
molecular markers and potential therapeutic agents. We
focused our attention on the ultraconserved regions
(UCRs) of the human genome (Bejerano et al., 2004b) be-
cause also miRNAs are almost completely conserved
among various species (Berezikov et al., 2005b). For ex-
ample, the active molecules of the miR-16-1/miR-15a
cluster, shown to be an essential player in the initiation
of chronic lymphocytic leukemia (CLL) (Calin et al.,
2005), are completely conserved in human, mouse, and
rat and highly conserved in nine out of the ten sequenced
primate species (Berezikov et al., 2005b). Comparative
sequence analysis has identified a number of highly con-
served genomic sequences. Some of these regions do
not produce a transcript that is translated into protein
and are therefore considered to be nongenic. Various
names have been applied to this class of sequences: con-
served nongenic sequences (CNGs) (Dermitzakis et al.,
2005), conserved noncoding sequences (CNSs/CNCs)
(Meisler, 2001), multiple species conserved sequences
(MCSs) (Thomas et al., 2003), or highly conserved regions
(HCRs) (Duret et al., 1993).
UCRs are a subset of conserved sequences that are
located in both intra- and intergenic regions. They are ab-
solutely conserved (100%) between orthologous regions
of the human, rat, and mouse genomes (Bejerano et al.,
2004b). In contrast to other regions of conserved
sequence, 53% of the UCRs have been classified as
nonexonic (‘‘N’’, 256/481 without evidence of encoding
protein), while the other 47% have been designated either
exonic (‘‘E’’, 111/481, that overlap mRNA of known pro-
tein-coding genes), or possibly exonic (‘‘P’’, 114/481,
with inconclusive evidence of overlap with protein coding
genes).
A large portion of transcription products of the noncod-
ing functional genomic regions have significant RNA
secondary structures and are components of clusters
containing other sequences with functional noncoding
significance (Bejerano et al., 2004a). The UCRs represent
a small fraction of the human genome that are likely to be
functional but not encoding proteins and have been called
the ‘‘dark matter’’ of the human genome (Bejerano et al.,
2004a). Because of the high degree of conservation, the
UCRs may have fundamental functional importance for
the ontogeny and phylogeny of mammals and other verte-
brates. This was illustrated by the recent finding of a distal
enhancer and an ultraconserved exon derived from a novel
retroposon active in lobe-finned fishes and terrestrial ver-
216 Cancer Cell 12, 215–229, September 2007 ª2007 Elsevier
tebrates more than 400 million years ago and maintained
as active in a ‘‘living fossil’ coelacanth (Bejerano et al.,
2006). Further experimental proof of the functional impor-
tance of UCRs is based on analysis of mice with targeted
mutations. Megabase deletions of gene deserts that lack
ultraconserved elements or highly conserved sequences
resulted in viable mice that developed apparently without
detectable phenotypes (Nobrega et al., 2004). By con-
trast, gene deserts containing several UCRs (such as the
two gene deserts surrounding the DACH1 gene on human
chromosome 13q21.33) were shown to contain long-
range enhancers, some of them composed of UCR se-
quences (Nobrega et al., 2003).
We present here a thorough genomic interrogation of
the status of UCRs in a large panel of human leukemias
and carcinomas. We investigated the genome-wide ex-
pression of UCRs in various normal and cancer samples,
and we assessed the relationship between the genomic
location of these sequences and the known regions in-
volved in cancers. Furthermore, we identified a functional
role for miRNAs in the transcriptional regulation of cancer-
associated UCRs. Finally, we proved in cancer systems
that a differentially expressed UCR could alter the func-
tional characteristics of malignant cells. By combining
these data with the much more elaborate model involving
miRNAs in human tumorigenesis, we propose a model in
which alteration in both coding and noncoding RNAs
cooperate in the initiation and progression of malignancy.
RESULTS
Genome-wide Profiling Reveals ExtensiveTranscription of UCRs in Normal Human TissuesTo investigate the possible involvement of UCRs in human
cancers, we analyzed 481 genomic regions longer than
200 bp (Bejerano et al., 2004b) by northern blot, quantita-
tive PCR (qRT-PCR), and microarray. Both exonic (E) and
possibly exonic (P) and nonexonic (N) UCR probes de-
tected transcripts (in sense or antisense, A, orientation)
over a large range of lengths from various normal tissues
(Figure 1A and Figure S1 in the Supplemental Data avail-
able with this article online). The length of two of the tran-
scripts was confirmed by cloning the cDNA by 50- and 30-
RACE for the exonic uc.246(E) from normal human colon
and the nonexonic uc.269A(N) from normal human bone
marrow. Neither of these cDNAs contained open reading
frames (ORFs) of significant length, confirming their likely
nonprotein coding nature. These nonspliced full-length
cDNAs, which we named noncoding ultraconserved
genes, nc-UCGs, are of variable length (about 0.8 kb for
the ultraconserved gene UCG.246 and about 1.8 kb and
2.8 kb for the ultraconserved gene UCG.269A). Transcrip-
tion of these nc-UCGs may be initiated from polyadenine
rich genomic regions, as was recently proposed for sev-
eral long ncRNAs from mouse (Furuno et al., 2006).
We compared the transcription levels of several UCRs
from normal and disease tissue using microarray analysis
followed by qRT-PCR and northern blot confirmation. The
expression of uc.291(P) and uc.73A(P) was significantly
Inc.

Cancer Cell
Ultraconserved Regions and Human Cancers
higher in normal CD5+/CD19+ lymphocytes than in CLL
cells (p < 0.05) (Figure 1B). The data obtained with this mi-
croarray platform has been confirmed in various studies
(Calin et al., 2005; Yanaihara et al., 2006; Volinia et al.,
2006). The strength of our data is reinforced by the fact
that two independent sets of normal CD5 cells were
included in microarray and quantitative RT-PCR experi-
ments. When both uc.291(P) and uc.73A(P) were investi-
gated by qRT-PCR and microarray in two different sets
of CD5/CD19 positive B cells and malignant B cells, the
differential expression was statistically significant by
both assays (Figure 1B). Furthermore, qRT-PCR and
northern blotting for eleven and six UCRs, respectively,
gave results that were concordant with microarray results
(Figures S1 and S2).
Using microarray analysis, we found that the majority of
transcribed UCRs (that we named here T-UCRs) were ex-
pressed in normal human tissues both ubiquitously and in
a tissue-specific manner (Figure 1C). About 34% of puta-
tive T-UCRs (325/962) had hybridization signals with an in-
tensity over background (calculated as average signal of
blank spots + 2 SD) in all 19 tissue samples. The highest
number of T-UCRs was found in B cells, while the lowest
was in ovary. About 93% of the UCRs (890 of 962) were
expressed over background in at least one sample, and
therefore we considered these as T-UCRs. The three
different types of UCRs were transcribed with similar fre-
quencies: 41% of exonic UCRs, 33% of possibly exonic
UCRs, and 30% of nonexonic UCRs.
The microarray platform contains putative T-UCRs in
both sense and antisense orientation. Eighty-four of the
962 UCRs (9%) were bidirectionally transcribed, while
241 were transcribed only from one strand, in all the nor-
mal tissues analyzed (Figures 1D and 1E and Table S1).
Since identification of bidirectional transcription by micro-
array analysis may be hindered by trace contamination
with genomic DNA, we performed a comparison of micro-
array results with strand-specific qRT-PCR for uc.269(N),
uc.233(E), and uc.73(P). In all three instances the data
were concordant, showing predominant transcription
from one strand (Figure 1E). Of note, out of the 156 non-
exonic T-UCRs expressed in all 19 tissues, 92 (�60%)
are intergenic, while 64 are intronic. Of the latter, 37 are
in the antisense orientation compared with the host
gene, suggesting that about 83% (129/156) of the non-
exonic T-UCRs did not represent intronic transcription of
long precursor transcripts of known host genes but bona
fide independent noncoding transcripts.
As with miRNAs (Liu et al., 2004), we performed a hierar-
chical clustering of T-UCR expression in hematopoietic
tissues (represented by B lymphocytes, T lymphocytes,
and mononuclear cells, each collected from two healthy
individuals) and nonhematopoietic tissues. The same
types of tissue from different individuals were clustered
as closest neighbors (Figure 2A and Figure S3). These
findings demonstrate that UCRs represent, in a significant
proportion of cases, noncoding transcripts in normal hu-
man tissues and that the expression of these T-UCRs is
tissue-specific.
Canc
Distinct UCR Signatures in Human Leukemiasand CarcinomasSince extensive gene expression alterations in cancer
cells have been widely described for both protein-coding
genes and miRNAs (Esquela-Kerscher and Slack, 2006;
Calin and Croce, 2006a, 2006b; Lu et al., 2005), we inves-
tigated the expression of UCRs in a panel of 173 samples,
including 133 human cancers and 40 corresponding nor-
mal tissues. Hierarchical clustering of the samples
showed that various types of cancers clustered differently
according to their developmental origins: the leukemias
(CLL) and normal hematopoietic tissues were branched
separately from the colorectal (CRC) and hepatocellular
carcinomas (HCC) with their normal counterparts
(Figure S4); moreover, specific groups of UCRs seemed
to be differentially expressed in tumor types (Figure 2B).
Since different tissues have specific UCR signatures,
this clustering pattern could be the consequence of differ-
ent tissue-specific origin of the tumors. Thus, we com-
pared the expression of UCRs between the normal and tu-
mor cells of the same origin. Out of 962 possible T-UCRs,
88 (9.1%) were differentially expressed at a highly statisti-
cally significant level (p < 0.005) in at least one type of can-
cer (Table 1 and Table S2). We found both downregulated
and upregulated T-UCRs in cancers compared to the ex-
pression in corresponding normal tissues. By comparing
each cancer type with the corresponding normal tissues,
we found that the CLL signature was composed of 19
UCRs (8 up- and 11 downregulated), the CRC signature
of 61 UCRs (59 up- and 2 downregulated), and the HCC
signature of 8 UCRs (3 up- and 5 downregulated) (Table
S2). Eighteen transcripts of the signatures were exonic
UCRs (20%), 28 were possibly exonic UCRs (32%) and
42 were nonexonic UCRs (48%). Of the 18 exonic T-
UCRs, 9 represented the anti-sense direction of the
known host protein-coding gene transcripts. We therefore
demonstrated that the T-UCR expression profiles can be
used to differentiate human cancers.
UCRs Are Frequently Located at Fragile Sitesand Genomic Regions Involved in CancersWe compared the genomic location of UCRs with that of
previously reported nonrandom genetic alterations identi-
fied in human tumors and cloned fragile sites (FRA) as de-
scribed (Calin et al., 2004b). We used the set of 186
miRNAs previously reported (Calin et al., 2004b) and
a set of 297 zinc finger protein-coding genes (ZNF)
(http://genome.ucsc.edu/), a well known family of tran-
scription factors shown to be associated with cancer
(Huntley et al., 2006). We previously reported that miRNA
genes are frequently located at FRA sites, HOX genes clus-
ters, and genomic regions involved in cancer, such as min-
imal regions of loss of heterozygosity (LOH), and minimal
regions of amplification, globally named cancer-associ-
ated genomic regions (CAGR) (Calin et al., 2004b). A recent
study, using high-resolution array comparative genomic
hybridization (aCGH), confirmed that miRNA loci exhibit
genomic alterations at high frequency in human cancers
(Zhang et al., 2006). Furthermore, by analyzing the miRNA
er Cell 12, 215–229, September 2007 ª2007 Elsevier Inc. 217

Cancer Cell
Ultraconserved Regions and Human Cancers
218 Cancer Cell 12, 215–229, September 2007 ª2007 Elsevier Inc.
Cancer Cell
Ultraconserved Regions and Human Cancers
expression in NCI-60 cell lines, another group found that
the candidate tumor-suppressor and oncogenic miRNAs
are located in CAGRs (Gaur et al., 2007).
Here, we show that the association between the geno-
mic location of UCRs and the analyzed cancer-related
genomic elements is highly statistically significant and
comparable to that reported for miRNAs. The ZNF tran-
scription factors did not show any significant association
with any of the analyzed regions of interest (Table 2 and
Table S3). There was a similar lack of association for the
smaller family of protein-coding genes involved in RNA
splicing (80 genes, data not shown). For example, the
probability for the association of UCRs or miRNAs with
minimal LOH regions versus nondeleted genomic regions
was less than 0.001 in both instances (IRR of 2.02 and
4.08, respectively). As an internal control, we used the
human papilloma virus 16 (HPV16) integration sites, which
frequently occur in FRA sites. If UCRs are significantly as-
sociated with FRA, then we expected to find an associa-
tion with the HPV16 integration site. This is exactly what
we observed for both UCRs and miRNAs, but not for
ZNF protein-coding genes (Table 2) or for the protein-
coding genes involved in RNA splicing (data not shown).
Additional data illustrate the importance of the geno-
mic location of UCRs. First, we found that the ubiqui-
tously expressed T-UCRs (expressed in 18 or 19 normal
tissues in Figure 1C) are significantly more frequently lo-
cated in CAGRs (p < 0.005, Fisher’s exact test) when
compared with all other UCRs (97 out of 189 versus
71 out of 292). Second and more importantly, T-UCRs
differentially expressed in human cancers are located
in CAGRs specifically associated with that type of can-
cer. For example, the chromosomal region 13q21.33–
q22.2 has been linked to susceptibility to familial CLL
(Ng et al., 2007). No mutations were found in any of
the 13 protein-coding genes screened within this inter-
val. We identified a cluster of seven UCRs (uc.347 to
uc.353) located within this CAGR. Two of them,
uc.349A(P) and uc.352(N) are among the T-UCRs that
are differentially expressed between normal and malig-
nant B-CLL CD5-positive cells. This suggests, at least
in this case, that it is not the protein-coding genes but
Canc
the UCRs that represent the ‘‘unknown’’ culprits located
in the CAGR. Together these data provide evidence that
the UCRs are located in genomic regions altered during
the malignant process and suggest that T-UCRs could
be candidate genes for cancer susceptibility.
Negative Regulation of T-UCRs by DirectInteraction with MicroRNAsIn order to begin to functionally characterize some UCRs
involved in human cancers, we performed a genome-
wide expression study in the same set of CLL samples in-
vestigated above. We found that a signature of five UCRs,
uc.269A(N), uc.160(N), uc.215(N), uc.346A(P), and
uc.348(N), was able to differentiate between two main
CLL prognosis groups previously differentiated by the ex-
pression of 70-kDa zeta-associated protein (ZAP-70).
These five T-UCRs displayed variations in their expression
level that was negatively correlated with the miRNA
expression signature reported in CLL (Calin et al., 2005)
(Table 3). This finding raises the possibility of complex reg-
ulatory mechanisms between miRNAs and T-UCRs. We
identified, by sequence alignments, that three out of the
5 UCRs have significant antisense complementarity with
5 out of the 13 miRNAs from the signature, giving rise to
six possible interacting pairs: uc.160::miR-24, uc.160::
miR-155, uc.160::miR-223, uc.160::miR-146a, uc.346A::
miR-155, and uc.-348::miR-29b (Figure 3A). In this ana-
lyzed set of miRNA::UCR pairs, the 50- end ‘‘6 base
seed’’ complementarity rule described for miRNA::mRNA
interaction was valid; furthermore, the levels of 30-end
complementarity could be variable: more than 60% com-
plementarity for miR-24::uc160 or miR-155::uc.346A pairs
to less than 25% for the miR-155::uc.160 pair. As a control,
when randomly generated combinations of five UCRs and
13 miRNAs were compared, the sense and antisense
complementarity was not significant.
Negative correlations between the microarray expres-
sion values of specific T-UCRs and predicted interactor
miRNAs was confirmed by qRT-PCR for selected T-
UCRs and miRNAs from lymphocytes of an independent
set of CLL patients and normal controls (Figure 3B). We
performed in vitro assays of miRNA::UCR interaction
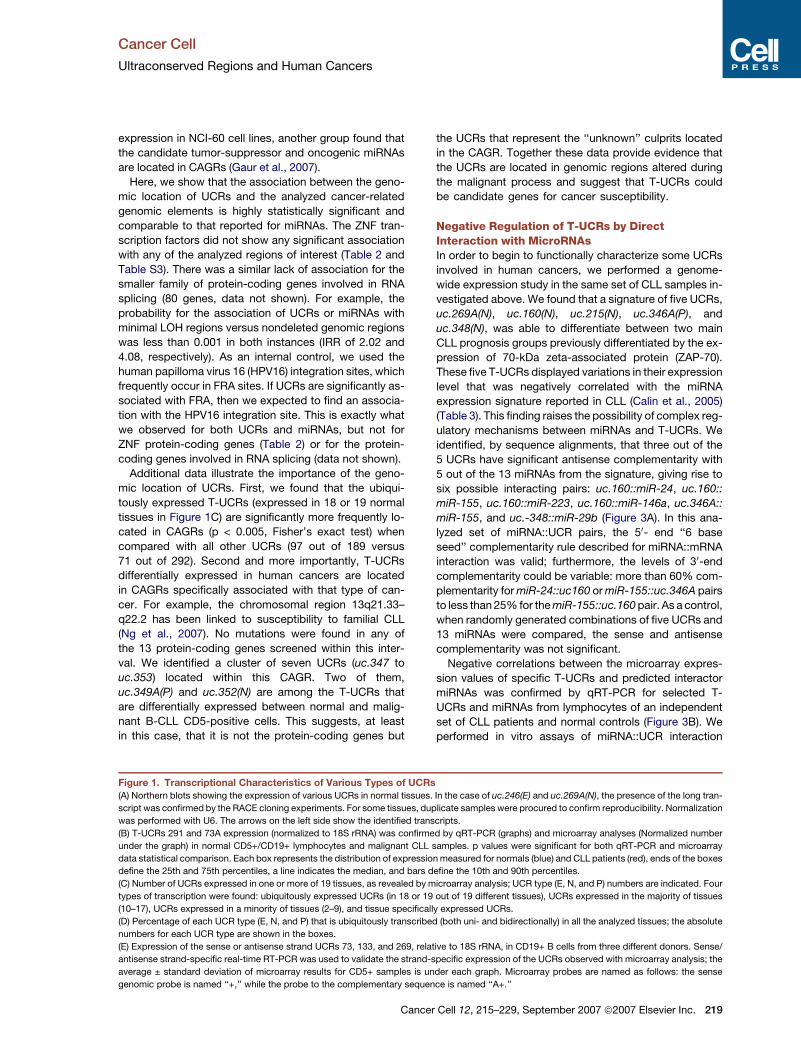
Figure 1. Transcriptional Characteristics of Various Types of UCRs
(A) Northern blots showing the expression of various UCRs in normal tissues. In the case of uc.246(E) and uc.269A(N), the presence of the long tran-
script was confirmed by the RACE cloning experiments. For some tissues, duplicate samples were procured to confirm reproducibility. Normalization
was performed with U6. The arrows on the left side show the identified transcripts.
(B) T-UCRs 291 and 73A expression (normalized to 18S rRNA) was confirmed by qRT-PCR (graphs) and microarray analyses (Normalized number
under the graph) in normal CD5+/CD19+ lymphocytes and malignant CLL samples. p values were significant for both qRT-PCR and microarray
data statistical comparison. Each box represents the distribution of expression measured for normals (blue) and CLL patients (red), ends of the boxes
define the 25th and 75th percentiles, a line indicates the median, and bars define the 10th and 90th percentiles.
(C) Number of UCRs expressed in one or more of 19 tissues, as revealed by microarray analysis; UCR type (E, N, and P) numbers are indicated. Four
types of transcription were found: ubiquitously expressed UCRs (in 18 or 19 out of 19 different tissues), UCRs expressed in the majority of tissues
(10–17), UCRs expressed in a minority of tissues (2–9), and tissue specifically expressed UCRs.
(D) Percentage of each UCR type (E, N, and P) that is ubiquitously transcribed (both uni- and bidirectionally) in all the analyzed tissues; the absolute
numbers for each UCR type are shown in the boxes.
(E) Expression of the sense or antisense strand UCRs 73, 133, and 269, relative to 18S rRNA, in CD19+ B cells from three different donors. Sense/
antisense strand-specific real-time RT-PCR was used to validate the strand-specific expression of the UCRs observed with microarray analysis; the
average ± standard deviation of microarray results for CD5+ samples is under each graph. Microarray probes are named as follows: the sense
genomic probe is named ‘‘+,’’ while the probe to the complementary sequence is named ‘‘A+.’’
er Cell 12, 215–229, September 2007 ª2007 Elsevier Inc. 219
Cancer Cell
Ultraconserved Regions and Human Cancers
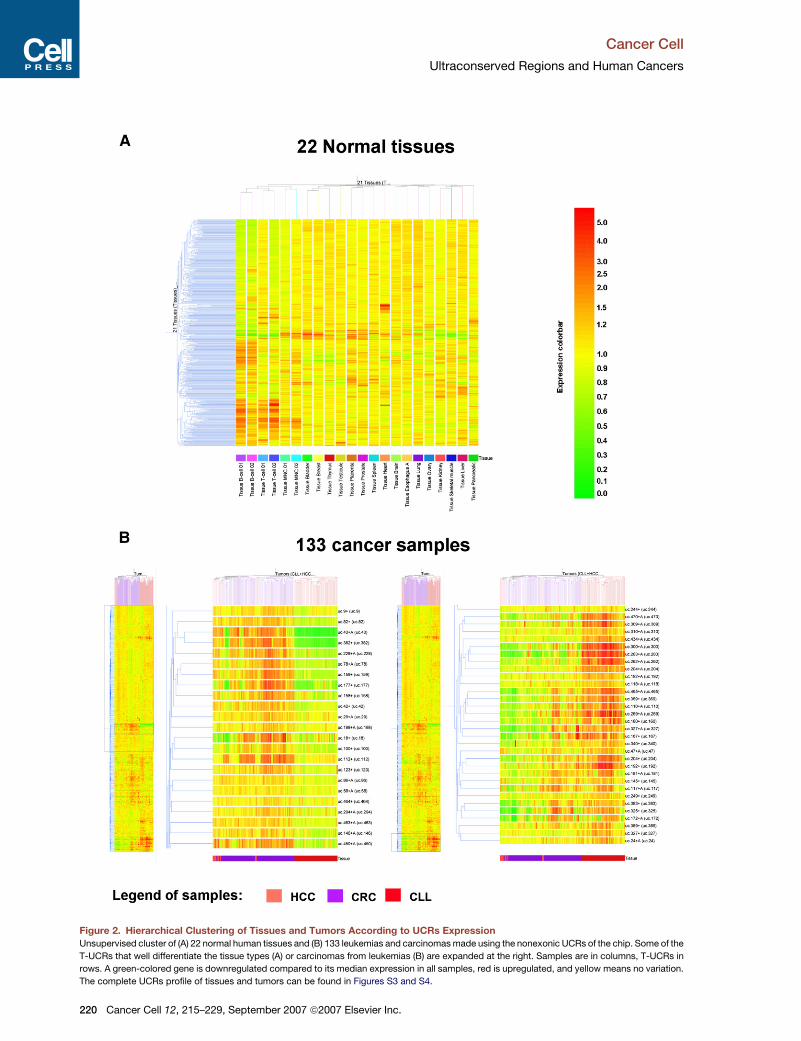
Figure 2. Hierarchical Clustering of Tissues and Tumors According to UCRs Expression
Unsupervised cluster of (A) 22 normal human tissues and (B) 133 leukemias and carcinomas made using the nonexonic UCRs of the chip. Some of the
T-UCRs that well differentiate the tissue types (A) or carcinomas from leukemias (B) are expanded at the right. Samples are in columns, T-UCRs in
rows. A green-colored gene is downregulated compared to its median expression in all samples, red is upregulated, and yellow means no variation.
The complete UCRs profile of tissues and tumors can be found in Figures S3 and S4.
220 Cancer Cell 12, 215–229, September 2007 ª2007 Elsevier Inc.
Cancer Cell
Ultraconserved Regions and Human Cancers
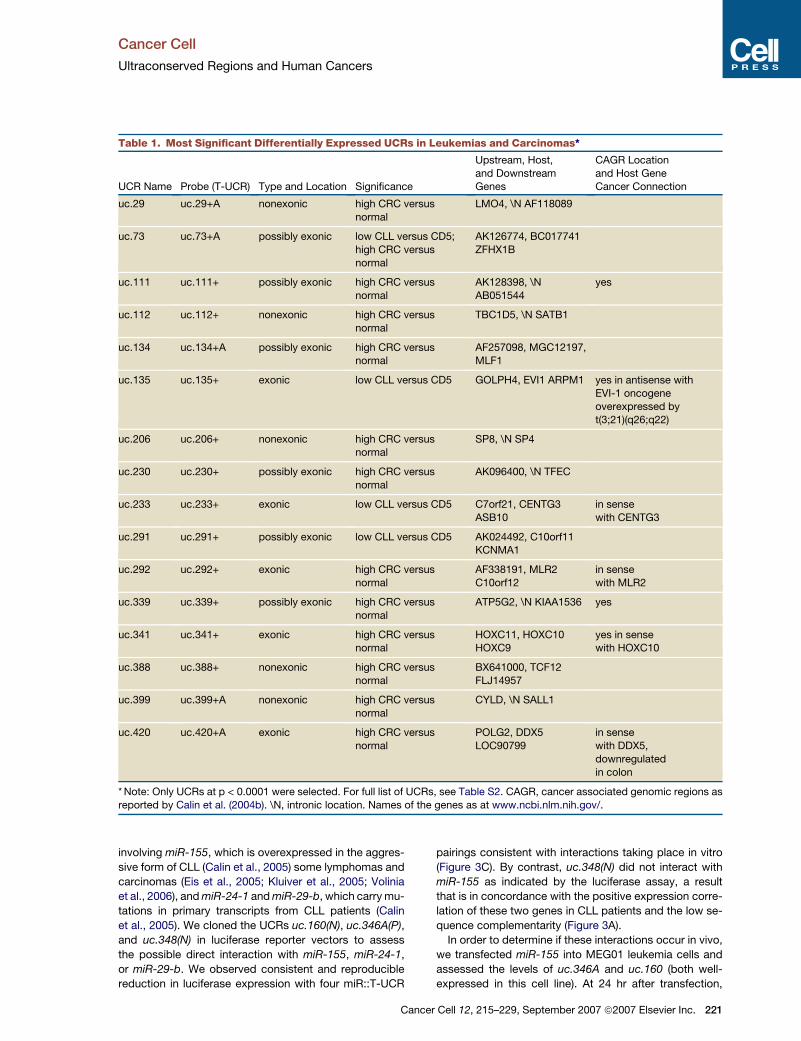
Table 1. Most Significant Differentially Expressed UCRs in Leukemias and Carcinomas*
UCR Name Probe (T-UCR) Type and Location Significance
Upstream, Host,
and DownstreamGenes
CAGR Location
and Host GeneCancer Connection
uc.29 uc.29+A nonexonic high CRC versus
normal
LMO4, \N AF118089
uc.73 uc.73+A possibly exonic low CLL versus CD5;
high CRC versus
normal
AK126774, BC017741
ZFHX1B
uc.111 uc.111+ possibly exonic high CRC versus
normal
AK128398, \N
AB051544
yes
uc.112 uc.112+ nonexonic high CRC versus
normal
TBC1D5, \N SATB1
uc.134 uc.134+A possibly exonic high CRC versusnormal
AF257098, MGC12197,MLF1
uc.135 uc.135+ exonic low CLL versus CD5 GOLPH4, EVI1 ARPM1 yes in antisense with
EVI-1 oncogeneoverexpressed by
t(3;21)(q26;q22)
uc.206 uc.206+ nonexonic high CRC versusnormal
SP8, \N SP4
uc.230 uc.230+ possibly exonic high CRC versus
normal
AK096400, \N TFEC
uc.233 uc.233+ exonic low CLL versus CD5 C7orf21, CENTG3
ASB10
in sense
with CENTG3
uc.291 uc.291+ possibly exonic low CLL versus CD5 AK024492, C10orf11KCNMA1
uc.292 uc.292+ exonic high CRC versus
normal
AF338191, MLR2
C10orf12
in sense
with MLR2
uc.339 uc.339+ possibly exonic high CRC versus
normal
ATP5G2, \N KIAA1536 yes
uc.341 uc.341+ exonic high CRC versusnormal
HOXC11, HOXC10HOXC9
yes in sensewith HOXC10
uc.388 uc.388+ nonexonic high CRC versus
normal
BX641000, TCF12
FLJ14957
uc.399 uc.399+A nonexonic high CRC versus
normal
CYLD, \N SALL1
uc.420 uc.420+A exonic high CRC versus
normal
POLG2, DDX5
LOC90799
in sense
with DDX5,
downregulated
in colon
* Note: Only UCRs at p < 0.0001 were selected. For full list of UCRs, see Table S2. CAGR, cancer associated genomic regions as
reported by Calin et al. (2004b). \N, intronic location. Names of the genes as at www.ncbi.nlm.nih.gov/.
involving miR-155, which is overexpressed in the aggres-
sive form of CLL (Calin et al., 2005) some lymphomas and
carcinomas (Eis et al., 2005; Kluiver et al., 2005; Volinia
et al., 2006), and miR-24-1 and miR-29-b, which carry mu-
tations in primary transcripts from CLL patients (Calin
et al., 2005). We cloned the UCRs uc.160(N), uc.346A(P),
and uc.348(N) in luciferase reporter vectors to assess
the possible direct interaction with miR-155, miR-24-1,
or miR-29-b. We observed consistent and reproducible
reduction in luciferase expression with four miR::T-UCR
Canc
pairings consistent with interactions taking place in vitro
(Figure 3C). By contrast, uc.348(N) did not interact with
miR-155 as indicated by the luciferase assay, a result
that is in concordance with the positive expression corre-
lation of these two genes in CLL patients and the low se-
quence complementarity (Figure 3A).
In order to determine if these interactions occur in vivo,
we transfected miR-155 into MEG01 leukemia cells and
assessed the levels of uc.346A and uc.160 (both well-
expressed in this cell line). At 24 hr after transfection,
er Cell 12, 215–229, September 2007 ª2007 Elsevier Inc. 221

Cancer Cell
Ultraconserved Regions and Human Cancers
Table 2. Mixed Effect Poisson Regression Results of Association of UCRs with Regions of Interest*
Region of Interest
Ultraconserved Regions microRNAs Zinc Finger Proteins
IRR 95% CI IRR p IRR 95% CI IRR p IRR 95% CI IRR p
Fragile sites
versus nonfragile sites
2.98 1.69, 5.07 < 0.001 9.12 6.22, 13.38 <0.001 1.36 0.76, 2.44 0.29
HPV16 insertion
versus all other
5.07 3.37, 7.64 <0.001 3.22 1.55, 6.68 0.002 0.50 0.07, 3.60 0.49
Homeobox genes
versus all other
2.39 1.69, 3.39 <0.001 2.95 1.63, 5.34 <0.001 0.16 0.02, 1.14 0.07
HOX clusterversus all other
7.09 3.61, 13.93 <0.001 15.77 7.39, 33.62 <0.001 –a – –
Amplified region
versus nonamplified
3.05 1.99, 4.67 <0.001 3.97 2.31, 6.83 <0.001 0.39 0.12, 1.23 0.11
LOH versus other 2.02 1.62, 2.53 <0.001 4.08 2.99, 5.56 <0.001 0.54 0.14, 2.10 0.37
* The comparison with a ‘‘positive’’ and a ‘‘negative’’ control class of genes each, microRNAs and zinc finger proteins, respectively,is presented. IRR, Incident Rate Ratio.a Too few events, likelihood-based models are numerically unstable.
miR-155 significantly reduced the expression level of both
T-UCRs; after 48 hr, the reduction of exogenous miR-155
levels was paralleled by an increase in T-UCR expression
(Figure 3D). This reversible effect supports a regulation of
T-UCR by specific miRNAs. As this interaction was proven
for the genes of the ‘‘ZAP-70 signature,’’ we investigated
the correlations between the expression of all miRNAs
and T-UCRs at the genome-wide level in all 50 CLL pa-
tients. Interestingly, we found a significant negative corre-
lation (at a false detection rate [FDR] of less than 0.01) be-
tween 87 miRNAs (out of 235 spotted on the chip, 37%)
and T-UCRs expression levels (Table S4). Furthermore,
among the correlated genes we identified the miR-24-
1::uc.160 and the miR-155::uc346A(P) pairs, experimen-
tally proven to interact (Figure 3E). Moreover, miR-155
222 Cancer Cell 12, 215–229, September 2007 ª2007 Elsevier In
and uc.348, which did not interact experimentally, were
not members of this list. Other pairs of possible interactors
for which we identified positive luciferse assays were
miR-15-a::uc.78 and miR-16::uc.78 (data not shown).
Therefore, noncoding T-UCRs represent possible targets
of miRNAs and these interactions may have biological
and prognostic significance for cancer patients.
A T-UCR Could Act as an OncogeneTo expand the functional characterization of T-UCR, we
examined the biological effects of uc.73A(P) in a cancer
model. Since this is one of the most statistically significant
upregulated T-UCRs in colon cancers (p < 0.001), we de-
cided to investigate the effects of its downregulation in
COLO-320 colorectal cancer cells that expressed high
Table 3. T-UCRs Whose Expression Inversely Correlates with Complementary miRNA Differentially Expressed in CLLPatients*
T-UCRName
Type andLocation
T-UCR Expression
in ZAP-70 Positiveversus Negative
ComplementarymiRNAs
MiRNA Expression
in ZAP-70 Positiveversus Negative
Upstream, Host,Downstream Genes
uc.269A nonexonic, chr. 9 downregulated no complementary sites AK123000, KIAA1608
LHX2
uc.160 nonexonic, chr. 5 downregulated miR-155, miR-146a,
miR-24 and miR-223
upregulated
downregulated
AK128395, \N AP3B1
uc.215 nonexonic, chr. 7 upregulated no complementary
sites
INHBA, GLI3 C7orf25
uc.346A possibly exonic,chr. 12
downregulated miR-155 upregulated RPC2, \N RFX4
uc.348 nonexonic, chr. 13 upregulated miR-29b, miR-29a, miR-29c,
and miR-155, miR-24
downregulated
upregulated
KLHL1, DACH FLJ22624
gene desert
* Among the UCRs differentially expressed between the 70 kD zeta-associated protein (ZAP-70) positive and negative CLLs, we
selected only the UCRs identified by three different algorithms—GeneSpring ANOVA, PAM (Prediction Analysis for Microarrays),and SAM (Significance Analysis of Microarrays)—and that had a complementary site for microRNAs differentially expressed among
the same groups of CLLs.
c.

Cancer Cell
Ultraconserved Regions and Human Cancers
levels of uc.73A(P). As a control we used the SW620 colon
cancer cells in which the expression of this gene does not
differ from normal colonic cells (Figure S5). Two small in-
terfering RNAs (siRNA1 and siRNA3), as well as a pool of
four siRNAs (siRNApool), were designed to target
uc.73A(P) and transfected into COLO-320 and SW620
cells. There was significantly less expression of
uc.73A(P) after 48 (Figure 4A and Figure S6), 72, and
144 hr (data not shown) in the COLO-320 cells treated
with siRNAs 1, 3, and pool. The same was found also for
SW-620 cells (Figure S6). The growth of COLO-320 cells
was significantly reduced after 144 hr of treatment with
specific siRNA compared to both untreated (null) or
siRNA-treated control cells (p < 0.05 at 96 hr and p <
0.01 at 144 hr) (Figure 4B). In comparison, proliferation
of the SW620 control cells was not significantly changed
(p = 0.83 and p = 0.23 at 96 and 144 hr, respectively)
(data not shown). Cell-cycle studies revealed an increase
in the sub-G1 fraction of cells (suggesting the presence of
apoptotic cells, data not shown) in COLO-320 cells, but
not in SW620 cells, a finding confirmed by the apopto-
sis-specific AnnexinV assay (Figures 4C and 4D) and by
caspase-3 assay (Figure S7). Furthermore, the intensity
of effects on cell proliferation and survival were propor-
tional to the degree of inhibition by siRNAs (Figure 4).
These data suggest that in colorectal cancers, uc.73A(P)
behaves like an oncogene by increasing the number of
malignant cells as a consequence of reduced apoptosis.
DISCUSSION
According to the dogma of molecular oncology, cancer is
a genetic disease involving tumor suppressor and onco-
genic proteins (Bishop, 1991; Hunter, 1991; Weinberg,
1991). Recent findings strongly support the involvement
of microRNAs in the pathogenesis of a majority of ana-
lyzed cancers and add a new layer of complexity to the
molecular architecture of human cancers (Calin et al.,
2002; Esquela-Kerscher and Slack, 2006; Calin and
Croce, 2006a). MiRNAs could represent, however, just
a particular group of ncRNAs involved in human cancers.
It has been shown that antisense intronic ncRNA levels
correlate with the degree of tumor differentiation in pros-
tate cancer (Reis et al., 2005) and that MALAT-1 ncRNA
expression predicts metastasis and survival in early
stage non-small-cell lung cancer (Ji et al., 2003),
suggesting a deeper link between ncRNAs and tumor
biology.
To clearly address this question, we investigated at the
genomic level a full new class of ncRNAs, namely the tran-
scribed noncoding ultraconserved regions (T-UCRs). We
used bioinformatics tools to demonstrate that the UCRs
are located in genomic regions targeted during the malig-
nant process indicative of a putative involvement in human
tumorigenesis. Second, we were able to clone by RACE
amplification cDNAs corresponding to uc.246(E) and
uc.269A(N), proving that, at least in these specific in-
stances, the UCRs are bona fide genes (and we named
these as nc-UCGs) that are expressed and can be cloned
Cance
by standard methods. Various expression techniques
including northern blot, qRT-PCR, and genome-wide
microarray profiling proved that UCRs are frequently tran-
scribed and that there are distinct signatures in human
leukemias and carcinomas. We focused on chronic lym-
phocytic leukemia, the most frequent adult leukemia in
the Western world (Chiorazzi et al., 2005), on colorectal
carcinoma, one of the most common cancers in industrial-
ized countries (de la Chapelle, 2004), and on hepatocellu-
lar carcinoma, the most rapidly increasing type of cancer
in America (Wilson, 2005). We found that, for all the tumor
types examined, the malignant cells have a unique
spectrum of expressed UCRs when compared with the
corresponding normal cells, suggesting that significant
variations in T-UCR expression are involved in the malig-
nant process.
Characterizing the functional significance of T-UCR
alterations in human cancers is not a trivial task. A myriad
of putative functions of T-UCRs can be hypothesized,
including an antisense inhibitory role for protein coding
genes or other noncoding RNAs or a role as ‘‘aspecific’’
miRNAs, meaning miRNAs with peculiarities such as
very long precursors (e.g., uc.339(P), which has a precur-
sor length that is double the usual miRNA). This puzzle
becomes more complicated by the fact that several
UCRs do not act like genes and were found to have regu-
latory functions as enhancers (Nobrega et al., 2003;
Pennacchio et al., 2006), while others represent exons of
protein coding genes with known/unknown cancer con-
nections. A particularly interesting region is the DACH1 lo-
cus that contains 7 UCRs in about 700 kb (Bejerano et al.,
2004b). Three of the UCRs from this region are differen-
tially expressed in analyzed cancers, two of which are
members of the CLL signature. The majority of scanned
conserved regions from this locus in a mouse model are
enhancers, including the uc.351(N) that was not ex-
pressed in any of the analyzed tissues in our study. Inter-
estingly, the only two regions that failed to have enhancer
function are uc.348(N) and uc.352(N), both classified as
noncoding and both differentially expressed in human
cancers. Further increasing the interest in these specific
T-UCRs, come the finding that this genomic region has
been linked to susceptibility to familial CLL and that
none of the known protein-coding genes were mutated
(Ng et al., 2007).
Recently, it was found that short blocks of several tens
of bp from the noncoding parts of the human genome
named pyknons, occur within nearly all known protein
coding genes (Rigoutsos et al., 2006). While the pyknons
are distinct from the UCRs, the ultraconserved element
containing the highest number of pyknons (four) was
uc.73(P), which we found to be one of the most differen-
tially expressed T-UCRs in both CLL and CRC. These in-
triguing observations suggest a possible regulatory role
for uc.73(P) on the coding genes with complementary
sequences. Further expanding the involvement of this
T-UCR in human cancers, we were able to prove an
oncogenic function for uc.73(P) in colon cancer, as dimi-
nution of its overexpression induced apoptosis and had
r Cell 12, 215–229, September 2007 ª2007 Elsevier Inc. 223

Cancer Cell
Ultraconserved Regions and Human Cancers
Figure 3. T-UCRs Represent Direct Targets of miRNAs
(A) Examples of sites of complementarity T-UCR::miRNA. The uc.348::miR-155 pairing is shown as an example of low levels of complementarity in
contrast with the other 4 interacting paired genes for which higher levels of complementarity are found.
(B) The correlation by qRT-PCR for miR-155, uc.160, and uc.346A expression in 9 CLL patients. Lymphocytes from four different individuals were
used as normal controls. Each box represents the distribution of expression measured for normals (blue) and CLL patients (red), ends of the boxes
define the 25th and 75th percentiles, a line indicates the median, and bars define the 10th and 90th percentiles.
(C) The direct miRNA::T-UCR interaction. Relative repression of firefly luciferase expression standardized to a transfection control, Renilla luciferase.
pGL-3 (Promega) was used as the empty vector. All the experiments were performed four to six times in triplicate (n = 12–18). Each box represents the
distribution of expression measured for miRNAs (blue) and scrambled oligos (red), ends of the boxes define the 25th and 75th percentiles, a line in-
dicates the median, and bars define the 10th and 90th percentiles.
(D) The effects of miR-155 transfection in MEG-01 cells on expression levels of uc.160 and uc.346A. Effects were measured by qRT-PCR at 0, 24, and
48 hr posttransfection.
(E) Two scatter plots between expression values of mir-24-1 and uc.160 and of miR-155 and uc.346A are presented. The regression line shows the
negative correlation between these two genes. The name of the corresponding array probes are presented on the Y and X axes. Both probes rec-
ognize the mature form of the miRNA gene.
224 Cancer Cell 12, 215–229, September 2007 ª2007 Elsevier Inc.
Cancer Cell
Ultraconserved Regions and Human Cancers
antiproliferative effects specifically in colon cancer cells
abnormally expressing this T-UCR.
Our findings that another class of ncRNAs, the T-UCRs,
is consistently altered at the genomic level in a high per-
centage of analyzed leukemias and carcinomas, support
a model in which both coding and noncoding genes are in-
volved and cooperate in human tumorigenesis (Calin and
Croce, 2006b). Furthermore, correlations between the ex-
pression of UCRs and miRNAs in CLL patients raise the in-
triguing possibility of complex functional regulatory path-
ways in which two or more types of ncRNAs interact and
influence the phenotype. We also demonstrated the exis-
tence of the miRNA::T-UCR interaction in which two differ-
ent types of ncRNAs are interacting.
In conclusion, we found that nc-UCGs are consistently
altered at the genomic level in a high percentage of leuke-
mias and carcinomas and may interact with miRNAs in
leukemias. The findings provide support for a model
in which both coding and noncoding genes are involved
in and cooperate in human tumorigenesis.
EXPERIMENTAL PROCEDURES
RACE Cloning and Expression Analysis by Microarray,
qRT-PCR, and Northern Blot
RACE Cloning
The expression of six UCRs [uc.47(N), uc.110(N), uc.192(N), uc.246(E),
uc.269A(N), and uc.352(N)] was analyzed in brain, testis, bone marrow,
small intestine, colon, and liver tissue using various combinations of
PCR primers designed to amplify short products. These products
included 40-mers used for probes in microarray analysis and the com-
plete >200 bp UCR sequence. Two of the UCR products, one exonic,
uc.246(E) and one nonexonic, uc.269A(N), were cloned by rapid ampli-
fication of cDNA ends (RACE) in both 50 and 30 directions. The sources
of tissue from which sequences were cloned were bone marrow,
leukocytes, fetal brain, and colon according to the manufacturer’s
protocol (Marathon-ready cDNAs, Clontech, Palo Alto, CA).
UCR Expression Study by Microarray
Total RNA was extracted with Trizol (Invitrogen, Carlsbad, CA) from
19 normal human tissues (Liu et al., 2004) and from 50 CLL samples
from patients diagnosed with CLL. Informed consent was obtained
from all patients at the CLL Research Consortium institutions in the
USA. As controls, CD5+ B cells from 6 healthy individuals (four dis-
tinct samples, two being pools from two different healthy individuals)
and mononuclear cells (MNC) from 3 individuals were used as re-
ported in Calin et al. (2005). RNA was also extracted from 78 primary
colorectal carcinomas, 21 normal colonic mucosas, 9 primary hepa-
tocellular carcinomas, and 4 normal livers, collected at the University
of Ferrara, University of Bologna, and University Tor Vergata, Rome
(Italy). All samples were obtained with written informed consent
according to institutional guidelines for the protection of human
subjects.
Microarray chips were developed with a total of 481 human UCR se-
quences as in http://www.soe.ucsc.edu/�jill/ultra.html. For each UCR
two 40-mer probes were designed, one corresponding to the sense
genomic sequence (named ‘‘+’’) and the other to the complementary
sequence (named ‘‘+A’’). The design criteria were as described (Liu
et al., 2004). Each oligo was printed in duplicate in two different slide
locations, and therefore quadruplicate numerical values were available
for analysis. Several thousand (3484) blank spots were used for back-
ground subtraction. RNA extraction and microarray experiments, con-
sisting of the UCR microarray assembly, target preparation, and array
hybridization, were performed as described in detail elsewhere (Liu
et al., 2004; Calin et al., 2004a).
Canc
Briefly, 5 mg of RNA from each tissue sample was labeled with biotin
by reverse transcription using random octomers. Hybridization was
carried out on the second version of our miRNA-chip (ArrayExpress
accession number A-MEXP-258), which contained the 962 UCR
probes, 238 probes for mature miRNA, and 143 probes for precursor
miRNAs. Each oligo was printed in duplicate in two different slide loca-
tions. Hybridization signals were detected by biotin binding of a Strep-
tavidin-Alexa647 conjugate (one-color signal) using a GenePix 4000B
scanner (Axon Instruments). Images were quantified using the Gene-
Pix Pro 6.0 (Axon Instruments).
Raw data were normalized and analyzed in GeneSpring GX 7.3 (Agi-
lent Technologies, Santa Clara, CA). Expression data of the 22 tissue
samples were normalized with Lowess function in Bioconductor
(Limma package) and then were median centered using GeneSpring
normalization; the threshold used to determine the level of UCR
expression was calculated as the average of blank spots + 2 SD (stan-
dard deviation). Tumors were normalized using the on-chip and on-
gene median normalization of the GeneSpring software. Hierarchical
cluster analysis was done using average linkage and Pearson correla-
tion as measures of similarity. Statistical comparisons of tumors and
normal tissues were performed by filtering on fold change and then us-
ing the ANOVA (Analysis of Variance) statistic of the GeneSpring soft-
ware and the Benjamini and Hochberg correction for reduction of false
positives. The filter on fold change was set on 1.2 because this thresh-
old, already used for microRNAs analyzed with the same chip (for
examples see Calin et al., 2005; Cimmino et al., 2005; Iorio et al.,
2005), was demonstrated to reflect a real biological difference. The
T-UCRs differentially expressed among CLL patients, grouped in
accordance to 70-kDa zeta-associated protein (ZAP-70) expression,
were identified by combining the ANOVA results with the SAM (Signif-
icance Analysis of Microarray) and PAM (Prediction Analysis of Micro-
arrays) analysis. Their expression was compared to that of microRNAs
(Calin et al., 2005). All data were submitted using MIAMExpress to the
ArrayExpress database and can be retrieved using the accession num-
ber E-TABM-184.
Quantitative RT-PCR for UCRs
Quantitative RT-PCR was the first method we used to confirm the
microarray results. We validated the microarray data for eleven
UCRs, including uc.73(P)/73A(P), uc.135(E), uc.160(N), uc.233(E)/
233A(E), uc.269(N)/269A(N), uc.289(N), uc.291(P), and uc.346A(P) in
various combinations of samples, including 15 to 17 randomly se-
lected CLL samples from the array set of 50, and various normal
CD19+/CD5+ B cells and B and T lymphocyte controls by qRT-
PCR. An additional set of 3 normal CD19+/CD5+ positive B cells,
not used for microarray studies, was purchased from AllCells (Berke-
ley, CA), and used as an independent confirmation set. In all
instances the qRT-PCR data confirmed the microarray data. RNA
was treated with RNase-free DNase I and reverse transcribed to
cDNA using random primers and SuperScript II reverse transcriptase.
To determine if the sense or antisense UCR transcript was expressed,
total RNA was reverse transcribed using Thermoscript RT and a gene-
specific (i.e., sense or antisense) primer. RT conditions were as
described (Schmittgen et al., 2004). cDNA was amplified using real-
time PCR and SYBR green detection using PCR primers designed
to amplify the same 40 bp regions as the oligo probe on the micro-
array. The relative amount of each UCR to 18S rRNA was deter-
mined using the Equation 2�dCT, where dCT = (CTUCR – CT18S rRNA).
Relative gene expression data were multiplied by 106 to simplify the
presentation.
Northern Blot Analysis of T-UCRs
We analyzed five UCRs, uc.110(N), uc.192(N), uc.246(E), uc.269A(N),
and uc.352(N), by northern blot, two of which were then cloned by
RACE experiments. For a sixth one, the uc.47(N), the data are not
shown. Total RNA was electrophoresed on 15% PAA-urea gels (Calin
et al., 2002). RNA sources included 11 normal tissues (breast, liver,
lung, kidney, and pancreas) in duplicate or triplicate (purchased from
Ambion and Clontech) and 4 normal MNC samples and 16 CLL sam-
ples prepared in the laboratory. As this represents the investigation
er Cell 12, 215–229, September 2007 ª2007 Elsevier Inc. 225

Cancer Cell
Ultraconserved Regions and Human Cancers
Figure 4. T-UCR 73A(P) Is Acting as an Oncogene in Colon Cancer Cells
(A) The expression inhibition by various siRNAs in COLO-320 cells. As reference value we used a siRNA control from Dharmacon. The most effective
two siRNAs and a pool of four different siRNAs, including these two, were used.
(B) The antiproliferative effects of reduction in uc.73A(P) gene expression using siRNA-uc73A in COLO-320 colorectal cancer cells. All the results
represent the median of three independent triplicate experiments. The levels of uc.73A(P) expression were measured by RT-PCR. Two asterisks
indicate a statistically significant effect at p < 0.01, while one at p < 0.05.
(C) Reduced levels of uc.73A(P) (using various siRNAs) results in enhanced apoptosis as shown by the Annexin-V staining assay in COLO-320 cells.
As reference value we used a siRNA control from Dharmacon.
(D) Inhibition of uc.73A(P) by various siRNAs did not influence SW620 colon cancer cell survival. All the results represent the median of three inde-
pendent triplicate experiments.
All the results represent the average ±SD of three independent triplicate experiments.
by northern blot of UCR expression, we used multiple samples from
the same tissues to confirm data reproducibility. The probes were de-
signed to be identical with the oligonucleotides on the chip in order to
detect the same transcripts as the microarray, and the hybridization
was done as described (Calin et al., 2002).
Databases and Statistical Analyses
Databases for Genomic Locations
The UCR databases used for all the studies reported here are as
published (Bejerano et al., 2004b). We restricted our analyses to 481
segments longer than 200 base pairs (bp). The Fragile site (FRA) data-
base and the cancer-associated genomic regions (CAGR) databases
are as previously published (Calin et al., 2004b).
Statistical Analyses for Genomic Locations
To test hypotheses associating the incidence of ultraconserved
regions (UCRs) with fragile sites, amplified regions in cancer, and de-
letion regions in cancer, we utilized random effect Poisson and nega-
tive binomial regression models. Under these models, ‘‘events’’ were
defined as the number of UCRs, and exposure ‘‘time’’ (i.e., fragile
226 Cancer Cell 12, 215–229, September 2007 ª2007 Elsevier I
site versus nonfragile site) was defined as nonoverlapping lengths of
the region of interest. The ‘‘length’’ of a region was exact, if known,
or estimated as 1 Mb if unknown. For example, for each chromosome
the total length of all nonoverlapping fragile sites was computed and
was used as the exposure time for fragile sites. We then counted the
number of UCRs occurring within fragile sites for each chromosome.
The remaining length of each chromosome (total Mb – fragile sites
Mb) was assumed to be nonfragile, and the remaining UCRs in each
chromosome were assumed to occur in the nonfragile region. Then
for each region, alternative random effects models, the zero-inflated
Poisson and the zero-inflated negative binomial models were fitted,
and, of the three, the best model was selected using the Akaike’s Infor-
mation Criteria (based on the log likelihood and number of parame-
ters). This same approach was used for analysis of the data from
expression of zinc finger proteins. The best fitting model for fragile
sites with UCRs and LOH with zinc finger proteins was the zero-
inflated negative binomial. For all other cases, the Poisson model is
reported. When the number of categories with zero events was more
than expected for a Poisson distribution, the zero-inflated negative
nc.
Cancer Cell
Ultraconserved Regions and Human Cancers
binomial model was preferred. When the total number of events was
too small for a region, the model likelihoods were unable to converge
and results are not reported. The random effect in the Poisson, zero-
inflated Poisson, and zero-inflated negative binomial regression
models was the individual chromosome in that data within a chromo-
some was assumed to be correlated. The fixed effect in each model
consisted of an indicator variable(s) for the type of region being
compared. We report the incidence rate ratio (IRR), 2-sided 95% con-
fidence interval of the incidence rate ratio, and 2-sided p values for
testing the hypothesis that the incident rate ratio is 1.0. An IRR signif-
icantly > 1 indicates an increase in the number of UCRs within a region
over that expected by chance.
The proportions of clustering of miRNAs and zinc finger proteins
were compared using an asymptotic test of the difference in two inde-
pendent proportions, where we report the difference, 95% confidence
interval of the difference, and p value. Of note, the ZNF transcription
factor class of genes showed a significantly lower clustering (a cluster
defined as the location of at least two genes from the same class at
less than 50 kb genomic distance) when compared with the micro-
RNAs [32%, 95/297 clustered ZNF genes versus 48%, 90/186 clus-
tered miRNAs, difference = 16.4%, 95% CI = (7.5%, 25.2%), p <
0.001]. All computations were completed using STATA v7.0 and
StatXact v7.0.
Statistical Analyses for Negative Correlations between
Microarray Expression of UCRs and miRNAs
A detailed description is provided in the Supplemental Data. Briefly,
the input data was constituted by a list of T-UCRs and by a list of
miRNAs (the ‘‘seeds’’) and the corresponding matrix of expression
values. We calculated r, the Spearman rank coefficient of correlation
for each pair of (miR, UC) genes; namely, we evaluate the p values
of the correlation tests and select the genes whose correlation value
is significant at a given value of rejection. Given the high number of
correlation tests performed, p values were corrected for multiple test-
ing by using the false detection rate (FDR), as in Benjamini and
Hochberg, 1995. In this way, p values control the number of false pos-
itive over the number of truly null tests, while FDR controls the number
of false positive over the number of significant tests.
Functional Studies
UCR’s Downregulation by Direct Interaction with MicroRNAs
The genomic sequences of uc.160, uc.346A, and uc.348 were cloned
into pGL3-control vector (Clontech) using the XbaI site immediately
downstream from the stop codon of luciferase. Human megakaryo-
cytic MEG-01 and the cervical carcinoma HeLa cell lines were grown
as recommended by the ATCC. Cells were cotransfected in 12-well
plates using siPORT neoFX (Ambion) according to the manufacturer’s
protocol using 0.4 mg of the firefly luciferase reporter vector and
0.08 mg of the control vector containing Renilla luciferase, pRL-TK
(Promega). For each well, 10 nM of miRNA-sense precursor and
scrambled oligonucleotides (Ambion) were used. Firefly and Renilla
luciferase activities were measured consecutively using the Dual-
luciferase assays (Promega) 24 hr after transfection. All experiments
were performed in triplicate on 4 to 6 different days (n = 12–18).
Expressionofboth the ultraconservedRNAand the mature miRNAwas
analyzed using real-time PCR. Expression of the UCR RNA was deter-
mined by real-time PCR as described above. Expression of the mature
miRNA was performed using TaqMan looped primer assays to
miR-155 (Applied Biosystems) as described (Chen et al., 2005). Mature
miRNA expression was presented as 2�dCT where dCT = CTmiRNA –
CT18S rRNA); data was multiplied by 106 to simplify presentation.
For the patient correlation a set of 13 samples was used (including 9
CLL patients and 4 normal lymphocyte samples) and miR-155,
uc.346A, and uc.160 levels were analyzed as described above. For
the identification of the ‘‘in vivo’’ effects in MEG01 of miR-155 transfec-
tion, the levels of uc.346A and uc.160 were measured by qRT-PCR as
described at 0, 24, and 48 hr posttransfection with the pre-miRNA 155
(Ambion) using Lipofectamine reagent.
Canc
Effects on Cancer Cell Proliferation by uc.73A(P) Inhibition
The siRNA against the uc.73A(P) were designed using the Dharmacon
algorithm (Dharmacon siDESIGN http://www.dharmacon.com/
sidesign/) entering the complete sequence of the UCR. The eight high-
est rank target sequences were tested. The performance was as-
sessed after 48, 72, and 144 hr posttransfection by semiquantitative
RT-PCR. The most effective two siRNAs and a pool of four different
siRNAs, including these two, were used. We named these as siRNA1,
siRNA3, and siRNApool.
For the cell growth assay, the human colon cancer cell lines COLO-
320 and SW620 were grown in RPMI1640 medium supplemented with
10% FBS, and 1 3 104 cells were plated in 96-well plate a day before
transfection. The cells were transfected with siRNA-uc.73A(P) at a final
concentration of 200 nM by using Lipofectamine 2000 (Invitrogen,
Carlsbad, CA, USA) according to the manufacturer’s protocol. The
siCONTROL Non-Targeting siRNA Pool (Dharmacon Research,
LaFayette, CO, USA) was used as negative control. The transfection
was repeated under the same conditions every two days at 48 and
96 hr. To evaluate the cell number the CellTiter 96 Aqueous One Solu-
tion Cell Proliferation Assay (Promega U.S., Madison, WI, USA) was
used. The readings were performed at 0, 48, 96, and 144 hr, respec-
tively, measuring the absorbance at 490 nm using an ELISA plate
reader (Spectra MAX, Molecular Devices, Sunnyvale, CA, USA). The
cell growth assay was performed three times in triplicate for each treat-
ment. The statistical differences between the number of cells at various
time points with respect to time 0 was calculated using the Student’s
t test.
For both cell-cycle and apoptosis assays, cells were plated in 6 well
plates at 6 3 105 cells per well. The day after and then every 48 hr, the
cells were transfected with 200 nM siRNA. The cells were collected
and fixed in cold 70% ethanol for at least 30 min. The Propidium Iodide
(PI) staining was performed at 48, 96, and 144 hr in a 50 mg/ml PI
(Sigma Aldrich, St. Louis, MO) and 5 mg/ml RNase DNase free (Roche
Diagnostics, Indianapolis, IN, USA) PBS Solution. The apoptosis stain-
ing was performed with the Annexin V-FITC Apoptosis Detection Kit
(BD PharMingen, San Jose, CA, USA) and with the PE-conjugated
monoclonal active Caspase-3 antibody apoptosis kit (BD Biosciences)
at 0 and 144 hr according to the manufacturer’s procedure using an
FACS Calibur (BD Biosciences, San Jose, CA, USA) to acquire the
data. Each experiment was performed three times.
Supplemental Data
The Supplemental Data include seven supplemental figures, four sup-
plemental tables, and Supplemental Experimental Procedures, and
can be found with this article online at http://www.cancercell.org/
cgi/content/full/12/3/215/DC1/.
ACKNOWLEDGMENTS
The GenBank accession numbers for the cloned T-UCRs described in
this study are as followings: DQ644536 (UCG.246), DQ644537
(UCG.269A, short form), and DQ644538 (UCG.269A, long form). The
authors thank Dr. A de la Chapelle and Dr. Jean-Jacques Michaille
for the critical reading of the manuscript. Supported by National Can-
cer Institute grants to C.M.C., T.J.K., and T.D.S.; by a Sydney Kimmel
Research Foundation award and by a CLL Global Research Founda-
tion grant to G.A.C.; by grants from the Italian Ministry of Public Health,
the Italian Ministry of University Research, and the Italian Association
for Cancer Research (AIRC) to M.N., L.G., G.L., and S.V.; by Comitato
dei Sostenitori to M.N.; and by a FIRB grant to S.Z. and M.N. M.F. is
a recipient of a fellowship from Fondazione Italiana per la Ricerca sul
Cancro (FIRC).
Received: November 10, 2006
Revised: April 1, 2007
Accepted: July 27, 2007
Published: September 10, 2007
er Cell 12, 215–229, September 2007 ª2007 Elsevier Inc. 227

Cancer Cell
Ultraconserved Regions and Human Cancers
REFERENCES
Ambros, V. (2003). MicroRNA pathways in flies and worms: Growth,
death, fat, stress, and timing. Cell 113, 673–676.
Ambros, V. (2004). The functions of animal microRNAs. Nature 431,
350–355.
Balmain, A., Gray, J.W., and Ponder, B.A. (2003). The genetics and ge-
nomics of cancer. Nat. Genet. Suppl. 33, 238–244.
Bejerano, G., Haussler, D., and Blanchette, M. (2004a). Into the heart of
darkness: Large-scale clustering of human non-coding DNA. Bioinfor-
matics 20, I40–I48.
Bejerano, G., Pheasant, M., Makunin, I., Stephen, S., Kent, W.J.,
Mattick, J.S., and Haussler, D. (2004b). Ultraconserved elements in
the human genome. Science 304, 1321–1325.
Bejerano, G., Lowe, C.B., Ahituv, N., King, B., Siepel, A., Salama, S.R.,
Rubin, E.M., Kent, W.J., and Haussler, D. (2006). A distal enhancer and
an ultraconserved exon are derived from a novel retroposon. Nature
441, 87–90.
Benjamini, Y., and Hochberg, Y. (1995). Controlling the false discovery
rate: A practical and powerful approach to multiple testing. J. R. Stat.
Soc. Ser. B 57, 289–300.
Berezikov, E., and Plasterk, R.H. (2005a). Camels and zebrafish, vi-
ruses and cancer: A microRNA update. Hum. Mol. Genet. 14, R183–
R190.
Berezikov, E., Guryev, V., van de Belt, J., Wienholds, E., Plasterk, R.H.,
and Cuppen, E. (2005b). Phylogenetic shadowing and computational
identification of human microRNA genes. Cell 120, 21–24.
Bishop, J.M. (1991). Molecular themes in oncogenesis. Cell 64, 235–
248.
Calin, G.A., Dumitru, C.D., Shimizu, M., Bichi, R., Zupo, S., Noch, E.,
Aldler, H., Rattan, S., Keating, M., Rai, K., et al. (2002). Frequent dele-
tions and down-regulation of micro- RNA genes miR15 and miR16 at
13q14 in chronic lymphocytic leukemia. Proc. Natl. Acad. Sci. USA
99, 15524–15529.
Calin, G.A., Liu, C.G., Sevignani, C., Ferracin, M., Felli, N., Dumitru,
C.D., Shimizu, M., Cimmino, A., Zupo, S., Dono, M., et al. (2004a).
MicroRNA profiling reveals distinct signatures in B cell chronic lym-
phocytic leukemias. Proc. Natl. Acad. Sci. USA 101, 11755–11760.
Calin, G.A., Sevignani, C., Dumitru, C.D., Hyslop, T., Noch, E., Yenda-
muri, S., Shimizu, M., Rattan, S., Bullrich, F., Negrini, M., and Croce,
C.M. (2004b). Human microRNA genes are frequently located at fragile
sites and genomic regions involved in cancers. Proc. Natl. Acad. Sci.
USA 101, 2999–3004.
Calin, G.A., Ferracin, M., Cimmino, A., Di Leva, G., Shimizu, M., Wojcik,
S., Iorio, M.V., Visone, R., Sever, N.I., Fabbri, M., et al. (2005). A Unique
MicroRNA Signature Associated with Prognostic Factors and Disease
Progression in B cell Chronic Lymphocytic Leukemia. N. Engl. J. Med.
352, 1667–1676.
Calin, G.A., and Croce, C.M. (2006a). MicroRNA signatures in human
cancers. Nat. Rev. Cancer 6, 857–866.
Calin, G.A., and Croce, C.M. (2006b). MicroRNA-cancer connection:
The beginning of a new tale. Cancer Res. 66, 7390–7394.
Chen, C., Ridzon, D.A., Broomer, A.J., Zhou, Z., Lee, D.H., Nguyen,
J.T., Barbisin, M., Xu, N.L., Mahuvakar, V.R., Andersen, M.R., et al.
(2005). Real-time quantification of microRNAs by stem-loop RT-
PCR. Nucleic Acids Res. 33, e179.
Chiorazzi, N., Rai, K.R., and Ferrarini, M. (2005). Chronic lymphocytic
leukemia. N. Engl. J. Med. 352, 804–815.
Cimmino, A., Calin, G.A., Fabbri, M., Iorio, M.V., Ferracin, M., Shimizu,
M., Wojcik, S.E., Aqeilan, R., Zupo, S., Dono, M., et al. (2005). miR-15
and miR-16 induce apoptosis by targeting BCL2. Proc. Natl. Acad. Sci.
USA 102, 13944–13949.
Croce, C.M., and Calin, G.A. (2005). miRNAs, Cancer, and Stem Cell
Division. Cell 122, 6–7.
228 Cancer Cell 12, 215–229, September 2007 ª2007 Elsevier I
de la Chapelle, A. (2004). Genetic predisposition to colorectal cancer.
Nat. Rev. Cancer 4, 769–780.
Dermitzakis, E.T., Reymond, A., and Antonarakis, S.E. (2005). Con-
served non-genic sequences - an unexpected feature of Mamm. Ge-
nomes. Nat. Rev. Genet. 6, 151–157.
Duret, L., Dorkeld, F., and Gautier, C. (1993). Strong conservation of
non-coding sequences during vertebrates evolution: Potential involve-
ment in post-transcriptional regulation of gene expression. Nucleic
Acids Res. 21, 2315–2322.
Eis, P.S., Tam, W., Sun, L., Chadburn, A., Li, Z., Gomez, M.F., Lund, E.,
and Dahlberg, J.E. (2005). Accumulation of miR-155 and BIC RNA in
human B cell lymphomas. Proc. Natl. Acad. Sci. USA 102, 3627–3632.
Esquela-Kerscher, A., and Slack, F.J. (2006). Oncomirs - microRNAs
with a role in cancer. Nat. Rev. Cancer 6, 259–269.
Furuno, M., Pang, K.C., Ninomiya, N., Fukuda, S., Frith, M.C., Bult, C.,
Kai, C., Kawai, J., Carninci, P., Hayashizaki, Y., et al. (2006). Clusters of
internally primed transcripts reveal novel long noncoding RNAs. PLoS
Genet. 2, e37. 10.1371/journal.pgen.0020037.
Gaur, A., Jewell, D.A., Liang, Y., Ridzon, D., Moore, J.H., Chen, C.,
Ambros, V.R., and Israel, M.A. (2007). Characterization of MicroRNA
Expression Levels and Their Biological Correlates in Human
Cancer Cell Lines. Cancer Res. 67, 2456–2468.
Hunter, T. (1991). Cooperation between oncogenes. Cell 64, 249–270.
Huntley, S., Baggott, D.M., Hamilton, A.T., Tran-Gyamfi, M., Yang,
S.C., Kim, J., Gordon, L., Branscomb, E., and Stubbs, S. (2006). A
comprehensive catalog of human KRAB-associated zinc finger genes:
Insights into the evolutionary history of a large family of transcriptional
repressors. Genome Res. 16, 669–677.
Iorio, M.V., Ferracin, M., Liu, C.G., Veronese, A., Spizzo, R., Sabbioni,
S., Magri, E., Pedriali, M., Fabbri, M., Campiglio, M., et al. (2005). mi-
croRNA gene expression deregulation in human breast cancer. Cancer
Res. 65, 7065–7070.
Ji, P., Diederichs, S., Wang, W., Boing, S., Metzger, R., Schneider,
P.M., Tidow, N., Brandt, B., Buerger, H., Bulk, E., et al. (2003). MA-
LAT-1, a novel noncoding RNA, and thymosin beta4 predict metasta-
sis and survival in early-stage non-small cell lung cancer. Oncogene
22, 8031–8041.
Kluiver, J., Poppema, S., de Jong, D., Blokzijl, T., Harms, G., Jacobs,
S., Kroesen, B.J., and van den Berg, A. (2005). BIC and miR-155 are
highly expressed in Hodgkin, primary mediastinal and diffuse large B
cell lymphomas. J. Pathol. 207, 243–249.
Liu, C.-G., Calin, G.A., Meloon, B., Gamliel, N., Sevignani, C., Ferracin,
M., Dumitru, D.C., Shimizu, M., Zupo, S., Dono, M., et al. (2004). An ol-
igonucleotide microchip for genome-wide miRNA profiling in human
and mouse tissues. Proc. Natl. Acad. Sci. USA 101, 9740–9744.
Lu, J., Getz, G., Miska, E.A., Alvarez-Saavedra, E., Lamb, J., Peck, D.,
Sweet-Cordero, A., Ebert, B.L., Mak, R.H., Ferrando, A.A., et al. (2005).
MicroRNA expression profiles classify human cancers. Nature 435,
834–838.
Meisler, M.H. (2001). Evolutionarily conserved noncoding DNA in the
human genome: How much and what for? Genome Res. 11, 1617–
1618.
Ng, D., Toure, O., Wei, M.H., Arthur, D.C., Abbasi, F., Fontaine, L.,
Marti, G.E., Fraumeni, J.F.J., Goldin, L.R., Caporaso, N.E., and Toro,
J.R. (2007). Identification of a novel chromosome region, 13q21.33-
q22.2, for susceptibility genes in familial chronic lymphocytic leuke-
mia. Blood 109, 916–925.
Nobrega, M.A., Ovcharenko, I., Afzal, V., and Rubin, E.M. (2003). Scan-
ning human gene deserts for long-range enhancers. Science 302, 413.
Nobrega, M.A., Zhu, Y., Plajzer-Frick, I., Afzal, V., and Rubin, E.M.
(2004). Megabase deletions of gene deserts result in viable mice. Na-
ture 431, 988–993.
Pennacchio, L.A., Ahituv, N., Moses, A.M., Prabhakar, S., Nobrega,
M.A., Shoukry, M., Minovitsky, S., Dubchak, I., Holt, A., Lewis, K.D.,
nc.

Cancer Cell
Ultraconserved Regions and Human Cancers
et al. (2006). In vivo enhancer analysis of human conserved non-coding
sequences. Nature 444, 499–502.
Reis, E.M., Louro, R., Nakaya, H.I., and Verjovski-Almeida, S. (2005).
As antisense RNA gets intronic. OMICS 9, 2–12.
Rigoutsos, I., Huynh, T., Miranda, K., Tsirigos, A., McHardy, A., and
Platt, D. (2006). Short blocks from the noncoding parts of the human
genome have instances within nearly all known genes and relate to bi-
ological processes. Proc. Natl. Acad. Sci. USA 103, 6605–6610.
Schmittgen, T.D., Jiang, J., Liu, Q., and Yang, L. (2004). A high-
throughput method to monitor the expression of microRNA precursor.
Nucleic Acids Res. 32, 43–53.
Thomas, J.W., Touchman, J.W., Blakesley, R.W., Bouffard, G.G.,
Beckstrom-Sternberg, S.M., Margulies, E.H., Blanchette, M., Siepel,
A.C., Thomas, P.J., McDowell, J.C., et al. (2003). Comparative analy-
ses of multi-species sequences from targeted genomic regions. Na-
ture 424, 788–793.
Volinia, S., Calin, G.A., Liu, C.-G., Ambs, S., Cimmino, A., Petrocca, F.,
Visone, R., Iorio, M.V., Roldo, C., Ferracin, M., et al. (2006). A micro-
RNA expression signature of human solid tumors define cancer gene
targets. Proc. Natl. Acad. Sci. USA 103, 2257–2261.
Canc
Weinberg, R.A. (1991). Tumor suppressor genes. Science 254, 1138–
1146.
Wilson, J.F. (2005). Liver cancer on the rise. Ann. Intern. Med. 142,
1029–1032.
Wooster, R., and Weber, B.L. (2003). Breast and ovarian cancer. N.
Engl. J. Med. 348, 2339–2347.
Yanaihara, N., Caplen, N., Bowman, E., Kumamoto, K., Okamoto, A.,
Yokota, J., Tanaka, T., Calin, G.A., Liu, C.G., Croce, C.M., and Harris,
C.C. (2006). microRNA Signature in Lung Cancer Diagnosis and Prog-
nosis. Cancer Cell 9, 189–198.
Zhang, L., Huang, J., Yang, N., Greshock, J., Megraw, M.S., Gianna-
kakis, A., Liang, S., Naylor, T.L., Barchetti, A., Ward, M.R., et al.
(2006). MicroRNAs exhibit high frequency genomic alterations in
human cancer. Proc. Natl. Acad. Sci. USA 103, 9136–9141.
Accession Numbers
All data were submitted using MIAMExpress to the ArrayExpress data-
base and can be retrieved using the accession number E-TABM-184.
er Cell 12, 215–229, September 2007 ª2007 Elsevier Inc. 229
Recommended