Canadian Natural Resources LimitedUNAUDITED INTERIM CONSOLIDATED FINANCIAL STATEMENTS
FOR THE THREE AND SIX MONTHS ENDED JUNE 30, 2021 AND 2020
INTERIM CONSOLIDATED FINANCIAL STATEMENTS
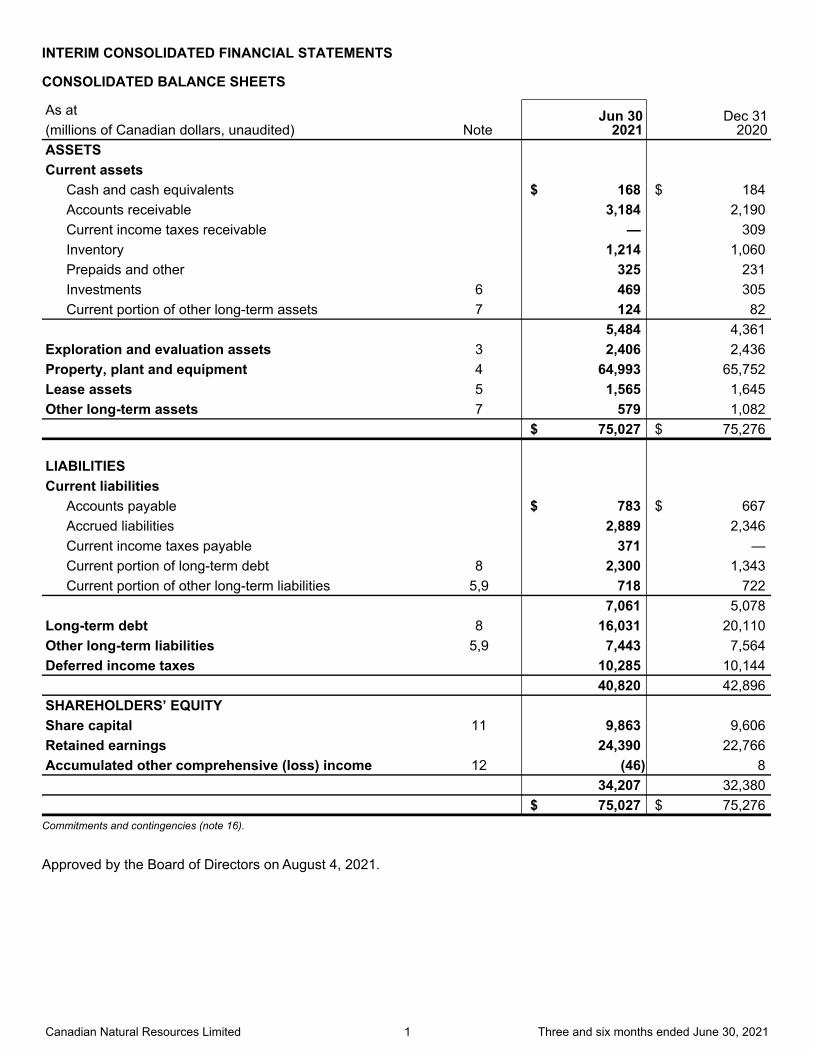
CONSOLIDATED BALANCE SHEETS
As atNote
Jun 302021
Dec 312020(millions of Canadian dollars, unaudited)
ASSETS
Current assets
Cash and cash equivalents $ 168 $ 184 Accounts receivable 3,184 2,190 Current income taxes receivable — 309 Inventory 1,214 1,060 Prepaids and other 325 231 Investments 6 469 305 Current portion of other long-term assets 7 124 82
5,484 4,361 Exploration and evaluation assets 3 2,406 2,436 Property, plant and equipment 4 64,993 65,752 Lease assets 5 1,565 1,645 Other long-term assets 7 579 1,082 $ 75,027 $ 75,276
LIABILITIES Current liabilities
Accounts payable $ 783 $ 667 Accrued liabilities 2,889 2,346 Current income taxes payable 371 — Current portion of long-term debt 8 2,300 1,343 Current portion of other long-term liabilities 5,9 718 722
7,061 5,078 Long-term debt 8 16,031 20,110 Other long-term liabilities 5,9 7,443 7,564 Deferred income taxes 10,285 10,144 40,820 42,896 SHAREHOLDERS’ EQUITY Share capital 11 9,863 9,606 Retained earnings 24,390 22,766 Accumulated other comprehensive (loss) income 12 (46) 8 34,207 32,380 $ 75,027 $ 75,276
Commitments and contingencies (note 16).
Approved by the Board of Directors on August 4, 2021.
Canadian Natural Resources Limited 1 Three and six months ended June 30, 2021
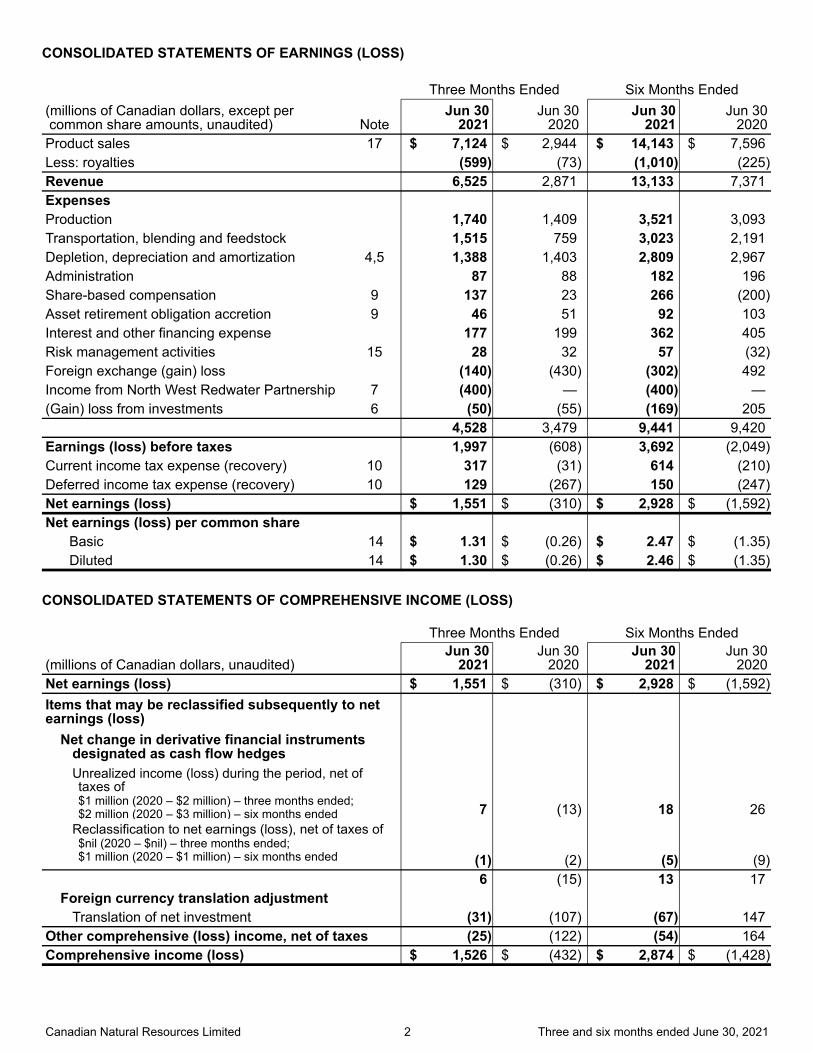
CONSOLIDATED STATEMENTS OF EARNINGS (LOSS)
Three Months Ended Six Months Ended(millions of Canadian dollars, except per common share amounts, unaudited) Note
Jun 302021
Jun 302020
Jun 302021
Jun 302020
Product sales 17 $ 7,124 $ 2,944 $ 14,143 $ 7,596 Less: royalties (599) (73) (1,010) (225) Revenue 6,525 2,871 13,133 7,371 ExpensesProduction 1,740 1,409 3,521 3,093 Transportation, blending and feedstock 1,515 759 3,023 2,191 Depletion, depreciation and amortization 4,5 1,388 1,403 2,809 2,967 Administration 87 88 182 196 Share-based compensation 9 137 23 266 (200) Asset retirement obligation accretion 9 46 51 92 103 Interest and other financing expense 177 199 362 405 Risk management activities 15 28 32 57 (32) Foreign exchange (gain) loss (140) (430) (302) 492 Income from North West Redwater Partnership 7 (400) — (400) — (Gain) loss from investments 6 (50) (55) (169) 205 4,528 3,479 9,441 9,420 Earnings (loss) before taxes 1,997 (608) 3,692 (2,049) Current income tax expense (recovery) 10 317 (31) 614 (210) Deferred income tax expense (recovery) 10 129 (267) 150 (247) Net earnings (loss) $ 1,551 $ (310) $ 2,928 $ (1,592) Net earnings (loss) per common share
Basic 14 $ 1.31 $ (0.26) $ 2.47 $ (1.35) Diluted 14 $ 1.30 $ (0.26) $ 2.46 $ (1.35)
CONSOLIDATED STATEMENTS OF COMPREHENSIVE INCOME (LOSS)
Three Months Ended Six Months Ended
(millions of Canadian dollars, unaudited)Jun 30
2021Jun 30
2020Jun 30
2021Jun 30
2020Net earnings (loss) $ 1,551 $ (310) $ 2,928 $ (1,592) Items that may be reclassified subsequently to net earnings (loss)
Net change in derivative financial instrumentsdesignated as cash flow hedges Unrealized income (loss) during the period, net of taxes of $1 million (2020 – $2 million) – three months ended;$2 million (2020 – $3 million) – six months ended 7 (13) 18 26
Reclassification to net earnings (loss), net of taxes of $nil (2020 – $nil) – three months ended;$1 million (2020 – $1 million) – six months ended (1) (2) (5) (9)
6 (15) 13 17 Foreign currency translation adjustment
Translation of net investment (31) (107) (67) 147 Other comprehensive (loss) income, net of taxes (25) (122) (54) 164 Comprehensive income (loss) $ 1,526 $ (432) $ 2,874 $ (1,428)
Canadian Natural Resources Limited 2 Three and six months ended June 30, 2021
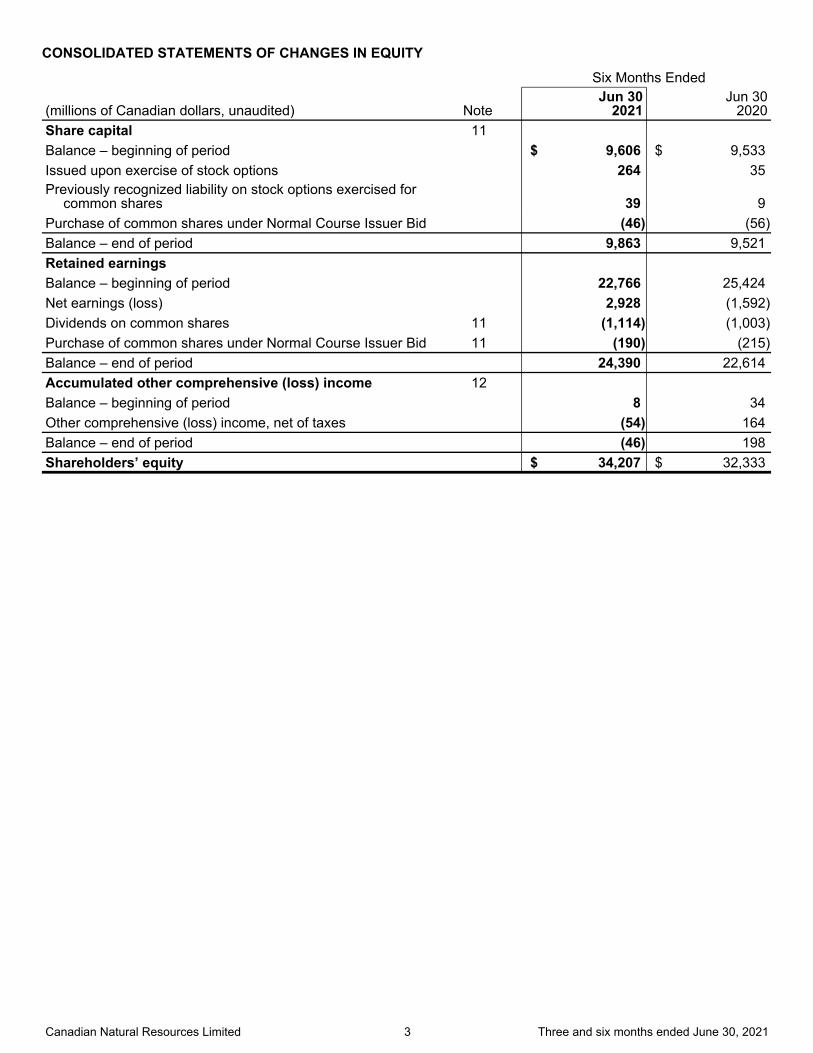
CONSOLIDATED STATEMENTS OF CHANGES IN EQUITY
Six Months Ended
(millions of Canadian dollars, unaudited) NoteJun 30
2021Jun 30
2020Share capital 11
Balance – beginning of period $ 9,606 $ 9,533 Issued upon exercise of stock options 264 35 Previously recognized liability on stock options exercised for
common shares 39 9 Purchase of common shares under Normal Course Issuer Bid (46) (56) Balance – end of period 9,863 9,521 Retained earnings Balance – beginning of period 22,766 25,424 Net earnings (loss) 2,928 (1,592) Dividends on common shares 11 (1,114) (1,003) Purchase of common shares under Normal Course Issuer Bid 11 (190) (215) Balance – end of period 24,390 22,614 Accumulated other comprehensive (loss) income 12 Balance – beginning of period 8 34 Other comprehensive (loss) income, net of taxes (54) 164 Balance – end of period (46) 198 Shareholders’ equity $ 34,207 $ 32,333
Canadian Natural Resources Limited 3 Three and six months ended June 30, 2021
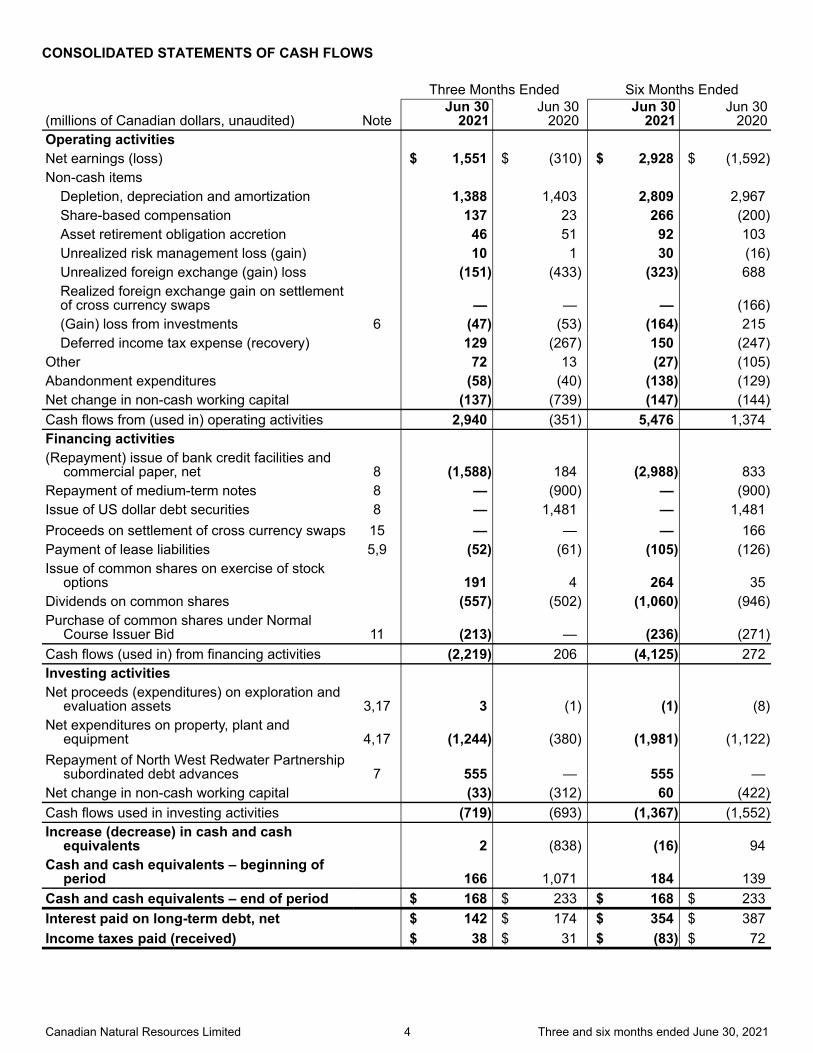
CONSOLIDATED STATEMENTS OF CASH FLOWS
Three Months Ended Six Months Ended
(millions of Canadian dollars, unaudited) NoteJun 30
2021Jun 30
2020Jun 30
2021Jun 30
2020Operating activities Net earnings (loss) $ 1,551 $ (310) $ 2,928 $ (1,592) Non-cash items
Depletion, depreciation and amortization 1,388 1,403 2,809 2,967 Share-based compensation 137 23 266 (200) Asset retirement obligation accretion 46 51 92 103 Unrealized risk management loss (gain) 10 1 30 (16) Unrealized foreign exchange (gain) loss (151) (433) (323) 688 Realized foreign exchange gain on settlement of cross currency swaps — — — (166) (Gain) loss from investments 6 (47) (53) (164) 215 Deferred income tax expense (recovery) 129 (267) 150 (247)
Other 72 13 (27) (105) Abandonment expenditures (58) (40) (138) (129) Net change in non-cash working capital (137) (739) (147) (144) Cash flows from (used in) operating activities 2,940 (351) 5,476 1,374 Financing activities (Repayment) issue of bank credit facilities and
commercial paper, net 8 (1,588) 184 (2,988) 833 Repayment of medium-term notes 8 — (900) — (900) Issue of US dollar debt securities 8 — 1,481 — 1,481 Proceeds on settlement of cross currency swaps 15 — — — 166 Payment of lease liabilities 5,9 (52) (61) (105) (126) Issue of common shares on exercise of stock
options 191 4 264 35 Dividends on common shares (557) (502) (1,060) (946) Purchase of common shares under Normal
Course Issuer Bid 11 (213) — (236) (271) Cash flows (used in) from financing activities (2,219) 206 (4,125) 272 Investing activities Net proceeds (expenditures) on exploration and
evaluation assets 3,17 3 (1) (1) (8) Net expenditures on property, plant and
equipment 4,17 (1,244) (380) (1,981) (1,122) Repayment of North West Redwater Partnership
subordinated debt advances 7 555 — 555 — Net change in non-cash working capital (33) (312) 60 (422) Cash flows used in investing activities (719) (693) (1,367) (1,552) Increase (decrease) in cash and cash
equivalents 2 (838) (16) 94 Cash and cash equivalents – beginning of
period 166 1,071 184 139 Cash and cash equivalents – end of period $ 168 $ 233 $ 168 $ 233 Interest paid on long-term debt, net $ 142 $ 174 $ 354 $ 387 Income taxes paid (received) $ 38 $ 31 $ (83) $ 72
Canadian Natural Resources Limited 4 Three and six months ended June 30, 2021
NOTES TO THE CONSOLIDATED FINANCIAL STATEMENTS(tabular amounts in millions of Canadian dollars, unless otherwise stated, unaudited)
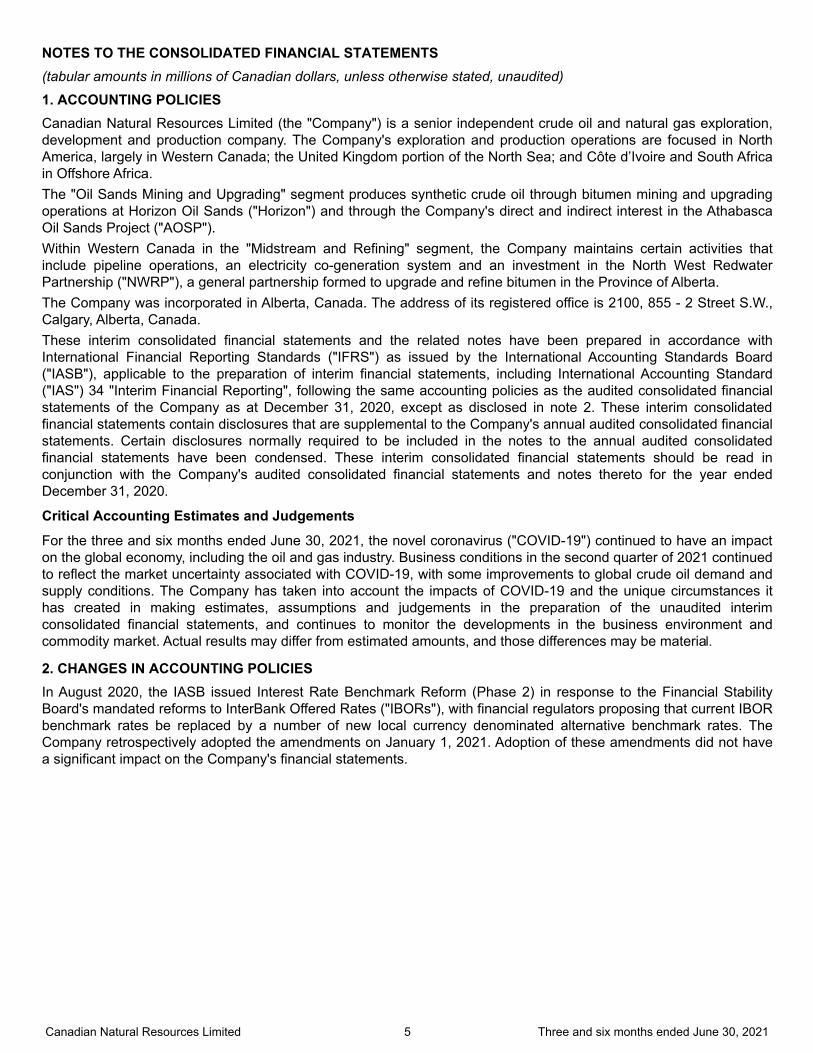
1. ACCOUNTING POLICIES Canadian Natural Resources Limited (the "Company") is a senior independent crude oil and natural gas exploration, development and production company. The Company's exploration and production operations are focused in North America, largely in Western Canada; the United Kingdom portion of the North Sea; and Côte d’Ivoire and South Africa in Offshore Africa.The "Oil Sands Mining and Upgrading" segment produces synthetic crude oil through bitumen mining and upgrading operations at Horizon Oil Sands ("Horizon") and through the Company's direct and indirect interest in the Athabasca Oil Sands Project ("AOSP").Within Western Canada in the "Midstream and Refining" segment, the Company maintains certain activities that include pipeline operations, an electricity co-generation system and an investment in the North West Redwater Partnership ("NWRP"), a general partnership formed to upgrade and refine bitumen in the Province of Alberta.The Company was incorporated in Alberta, Canada. The address of its registered office is 2100, 855 - 2 Street S.W., Calgary, Alberta, Canada. These interim consolidated financial statements and the related notes have been prepared in accordance with International Financial Reporting Standards ("IFRS") as issued by the International Accounting Standards Board ("IASB"), applicable to the preparation of interim financial statements, including International Accounting Standard ("IAS") 34 "Interim Financial Reporting", following the same accounting policies as the audited consolidated financial statements of the Company as at December 31, 2020, except as disclosed in note 2. These interim consolidated financial statements contain disclosures that are supplemental to the Company's annual audited consolidated financial statements. Certain disclosures normally required to be included in the notes to the annual audited consolidated financial statements have been condensed. These interim consolidated financial statements should be read in conjunction with the Company's audited consolidated financial statements and notes thereto for the year ended December 31, 2020.
Critical Accounting Estimates and Judgements
For the three and six months ended June 30, 2021, the novel coronavirus ("COVID-19") continued to have an impact on the global economy, including the oil and gas industry. Business conditions in the second quarter of 2021 continued to reflect the market uncertainty associated with COVID-19, with some improvements to global crude oil demand and supply conditions. The Company has taken into account the impacts of COVID-19 and the unique circumstances it has created in making estimates, assumptions and judgements in the preparation of the unaudited interim consolidated financial statements, and continues to monitor the developments in the business environment and commodity market. Actual results may differ from estimated amounts, and those differences may be material.
2. CHANGES IN ACCOUNTING POLICIESIn August 2020, the IASB issued Interest Rate Benchmark Reform (Phase 2) in response to the Financial Stability Board's mandated reforms to InterBank Offered Rates ("IBORs"), with financial regulators proposing that current IBOR benchmark rates be replaced by a number of new local currency denominated alternative benchmark rates. The Company retrospectively adopted the amendments on January 1, 2021. Adoption of these amendments did not have a significant impact on the Company's financial statements.
Canadian Natural Resources Limited 5 Three and six months ended June 30, 2021
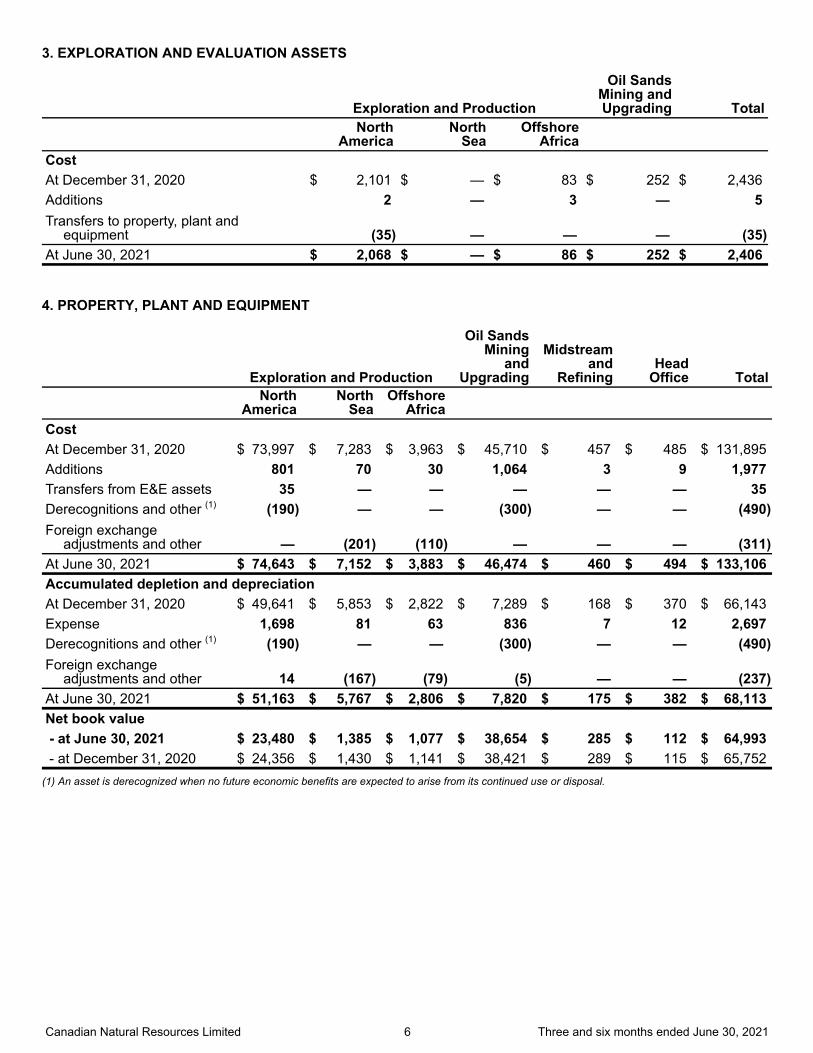
3. EXPLORATION AND EVALUATION ASSETS
Exploration and Production
Oil SandsMining andUpgrading Total
North
AmericaNorth
SeaOffshore
Africa Cost At December 31, 2020 $ 2,101 $ — $ 83 $ 252 $ 2,436 Additions 2 — 3 — 5 Transfers to property, plant and
equipment (35) — — — (35) At June 30, 2021 $ 2,068 $ — $ 86 $ 252 $ 2,406
4. PROPERTY, PLANT AND EQUIPMENT
Exploration and Production
Oil SandsMining
andUpgrading
Midstreamand
RefiningHead
Office Total
North
AmericaNorth
SeaOffshore
Africa Cost
At December 31, 2020 $ 73,997 $ 7,283 $ 3,963 $ 45,710 $ 457 $ 485 $ 131,895 Additions 801 70 30 1,064 3 9 1,977 Transfers from E&E assets 35 — — — — — 35 Derecognitions and other (1) (190) — — (300) — — (490) Foreign exchange
adjustments and other — (201) (110) — — — (311) At June 30, 2021 $ 74,643 $ 7,152 $ 3,883 $ 46,474 $ 460 $ 494 $ 133,106 Accumulated depletion and depreciation
At December 31, 2020 $ 49,641 $ 5,853 $ 2,822 $ 7,289 $ 168 $ 370 $ 66,143 Expense 1,698 81 63 836 7 12 2,697 Derecognitions and other (1) (190) — — (300) — — (490) Foreign exchange
adjustments and other 14 (167) (79) (5) — — (237) At June 30, 2021 $ 51,163 $ 5,767 $ 2,806 $ 7,820 $ 175 $ 382 $ 68,113 Net book value - at June 30, 2021 $ 23,480 $ 1,385 $ 1,077 $ 38,654 $ 285 $ 112 $ 64,993 - at December 31, 2020 $ 24,356 $ 1,430 $ 1,141 $ 38,421 $ 289 $ 115 $ 65,752
(1) An asset is derecognized when no future economic benefits are expected to arise from its continued use or disposal.
Canadian Natural Resources Limited 6 Three and six months ended June 30, 2021
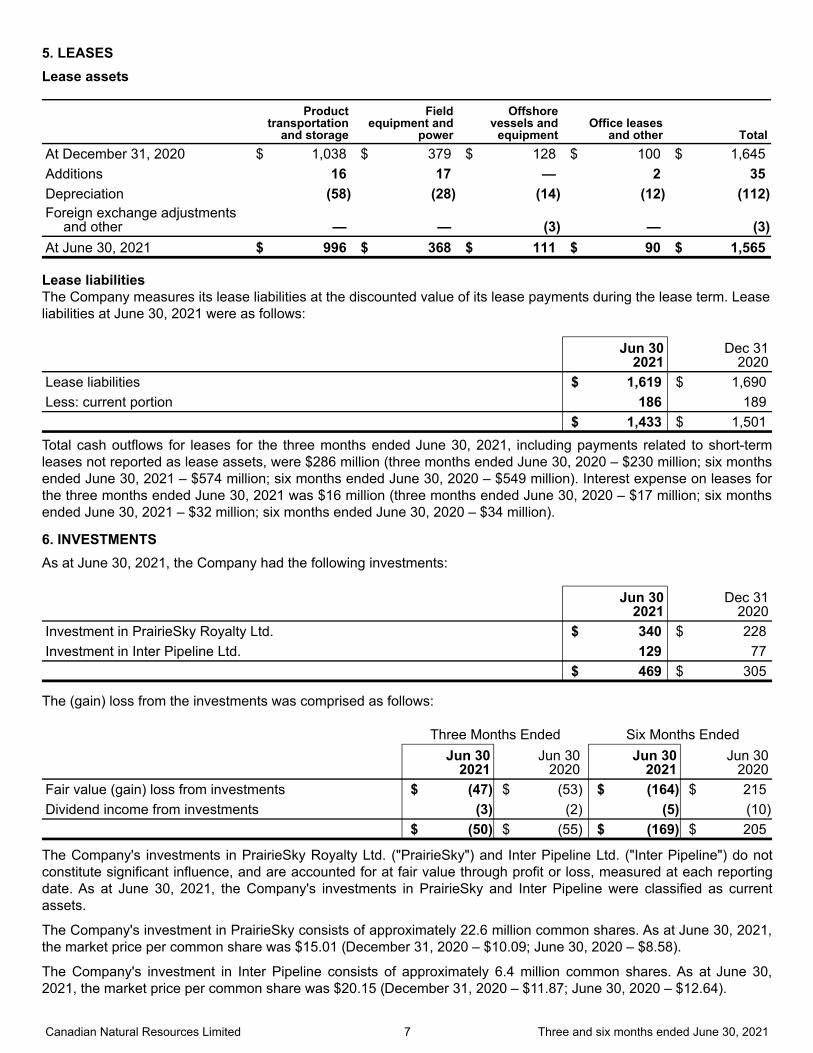
5. LEASES Lease assets
Producttransportation
and storage
Fieldequipment and
power
Offshorevessels and
equipmentOffice leases
and other TotalAt December 31, 2020 $ 1,038 $ 379 $ 128 $ 100 $ 1,645 Additions 16 17 — 2 35 Depreciation (58) (28) (14) (12) (112) Foreign exchange adjustments
and other — — (3) — (3) At June 30, 2021 $ 996 $ 368 $ 111 $ 90 $ 1,565
Lease liabilitiesThe Company measures its lease liabilities at the discounted value of its lease payments during the lease term. Lease liabilities at June 30, 2021 were as follows:
Jun 30
2021Dec 31
2020Lease liabilities $ 1,619 $ 1,690 Less: current portion 186 189 $ 1,433 $ 1,501 Total cash outflows for leases for the three months ended June 30, 2021, including payments related to short-term leases not reported as lease assets, were $286 million (three months ended June 30, 2020 – $230 million; six months ended June 30, 2021 – $574 million; six months ended June 30, 2020 – $549 million). Interest expense on leases for the three months ended June 30, 2021 was $16 million (three months ended June 30, 2020 – $17 million; six months ended June 30, 2021 – $32 million; six months ended June 30, 2020 – $34 million).
6. INVESTMENTSAs at June 30, 2021, the Company had the following investments:
Jun 302021
Dec 312020
Investment in PrairieSky Royalty Ltd. $ 340 $ 228 Investment in Inter Pipeline Ltd. 129 77
$ 469 $ 305
The (gain) loss from the investments was comprised as follows:
Three Months Ended Six Months EndedJun 30
2021Jun 30
2020Jun 30
2021Jun 30
2020Fair value (gain) loss from investments $ (47) $ (53) $ (164) $ 215 Dividend income from investments (3) (2) (5) (10)
$ (50) $ (55) $ (169) $ 205
The Company's investments in PrairieSky Royalty Ltd. ("PrairieSky") and Inter Pipeline Ltd. ("Inter Pipeline") do not constitute significant influence, and are accounted for at fair value through profit or loss, measured at each reporting date. As at June 30, 2021, the Company's investments in PrairieSky and Inter Pipeline were classified as current assets.
The Company's investment in PrairieSky consists of approximately 22.6 million common shares. As at June 30, 2021, the market price per common share was $15.01 (December 31, 2020 – $10.09; June 30, 2020 – $8.58).
The Company's investment in Inter Pipeline consists of approximately 6.4 million common shares. As at June 30, 2021, the market price per common share was $20.15 (December 31, 2020 – $11.87; June 30, 2020 – $12.64).
Canadian Natural Resources Limited 7 Three and six months ended June 30, 2021
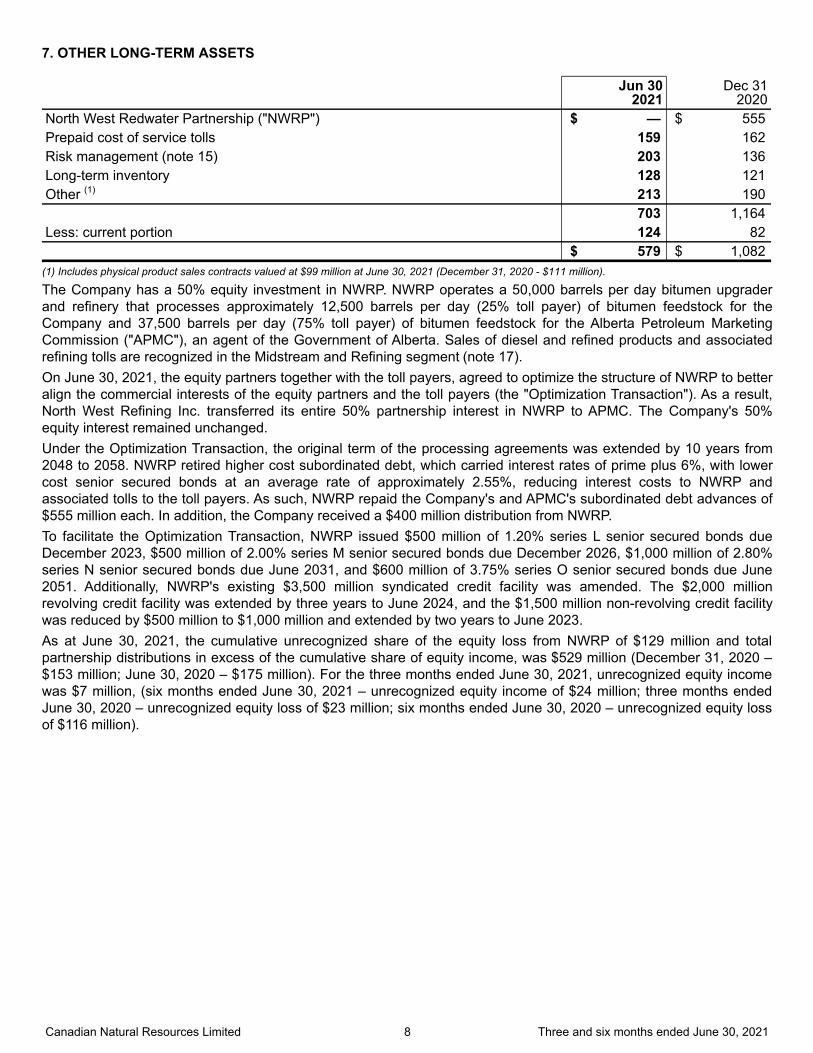
7. OTHER LONG-TERM ASSETS
Jun 30
2021Dec 31
2020North West Redwater Partnership ("NWRP") $ — $ 555 Prepaid cost of service tolls 159 162 Risk management (note 15) 203 136 Long-term inventory 128 121 Other (1) 213 190 703 1,164 Less: current portion 124 82 $ 579 $ 1,082
(1) Includes physical product sales contracts valued at $99 million at June 30, 2021 (December 31, 2020 - $111 million).
The Company has a 50% equity investment in NWRP. NWRP operates a 50,000 barrels per day bitumen upgrader and refinery that processes approximately 12,500 barrels per day (25% toll payer) of bitumen feedstock for the Company and 37,500 barrels per day (75% toll payer) of bitumen feedstock for the Alberta Petroleum Marketing Commission ("APMC"), an agent of the Government of Alberta. Sales of diesel and refined products and associated refining tolls are recognized in the Midstream and Refining segment (note 17).On June 30, 2021, the equity partners together with the toll payers, agreed to optimize the structure of NWRP to better align the commercial interests of the equity partners and the toll payers (the "Optimization Transaction"). As a result, North West Refining Inc. transferred its entire 50% partnership interest in NWRP to APMC. The Company's 50% equity interest remained unchanged. Under the Optimization Transaction, the original term of the processing agreements was extended by 10 years from 2048 to 2058. NWRP retired higher cost subordinated debt, which carried interest rates of prime plus 6%, with lower cost senior secured bonds at an average rate of approximately 2.55%, reducing interest costs to NWRP and associated tolls to the toll payers. As such, NWRP repaid the Company's and APMC's subordinated debt advances of $555 million each. In addition, the Company received a $400 million distribution from NWRP.To facilitate the Optimization Transaction, NWRP issued $500 million of 1.20% series L senior secured bonds due December 2023, $500 million of 2.00% series M senior secured bonds due December 2026, $1,000 million of 2.80% series N senior secured bonds due June 2031, and $600 million of 3.75% series O senior secured bonds due June 2051. Additionally, NWRP's existing $3,500 million syndicated credit facility was amended. The $2,000 million revolving credit facility was extended by three years to June 2024, and the $1,500 million non-revolving credit facility was reduced by $500 million to $1,000 million and extended by two years to June 2023.As at June 30, 2021, the cumulative unrecognized share of the equity loss from NWRP of $129 million and total partnership distributions in excess of the cumulative share of equity income, was $529 million (December 31, 2020 – $153 million; June 30, 2020 – $175 million). For the three months ended June 30, 2021, unrecognized equity income was $7 million, (six months ended June 30, 2021 – unrecognized equity income of $24 million; three months ended June 30, 2020 – unrecognized equity loss of $23 million; six months ended June 30, 2020 – unrecognized equity loss of $116 million).
Canadian Natural Resources Limited 8 Three and six months ended June 30, 2021
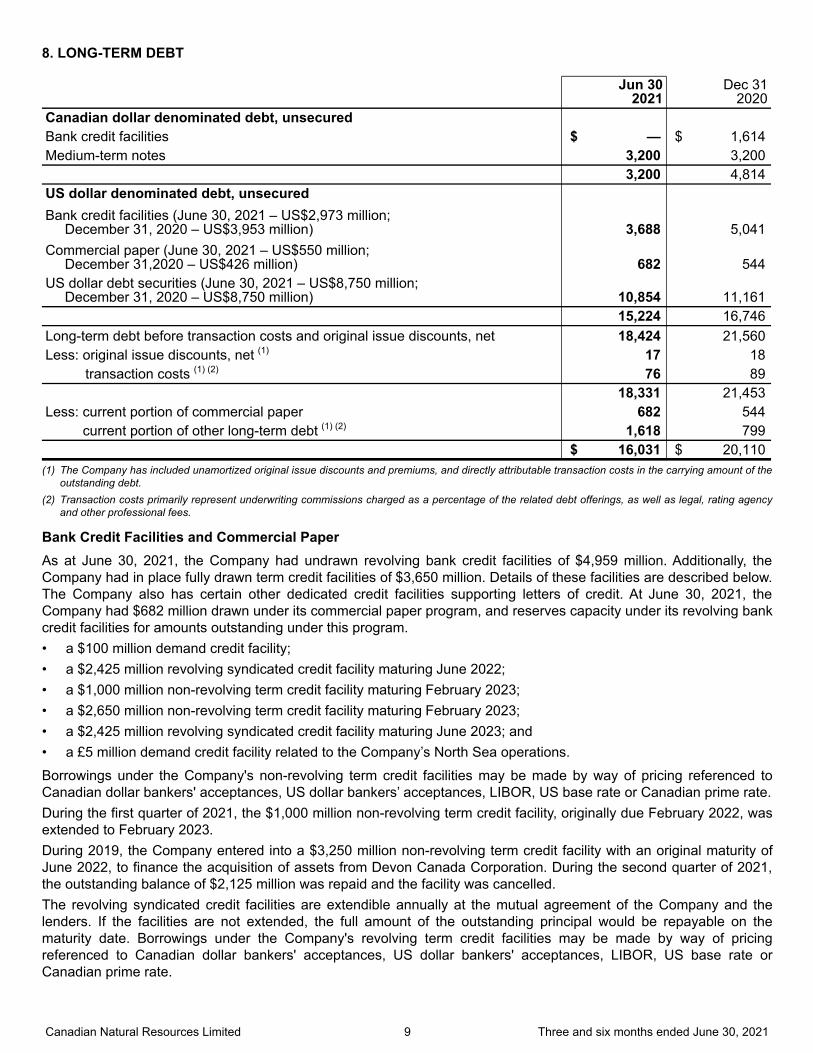
8. LONG-TERM DEBT
Jun 30
2021Dec 31
2020Canadian dollar denominated debt, unsecured Bank credit facilities $ — $ 1,614 Medium-term notes 3,200 3,200 3,200 4,814 US dollar denominated debt, unsecured Bank credit facilities (June 30, 2021 – US$2,973 million; December 31, 2020 – US$3,953 million) 3,688 5,041 Commercial paper (June 30, 2021 – US$550 million; December 31,2020 – US$426 million) 682 544 US dollar debt securities (June 30, 2021 – US$8,750 million; December 31, 2020 – US$8,750 million) 10,854 11,161 15,224 16,746 Long-term debt before transaction costs and original issue discounts, net 18,424 21,560 Less: original issue discounts, net (1) 17 18
transaction costs (1) (2) 76 89 18,331 21,453 Less: current portion of commercial paper 682 544
current portion of other long-term debt (1) (2) 1,618 799 $ 16,031 $ 20,110
(1) The Company has included unamortized original issue discounts and premiums, and directly attributable transaction costs in the carrying amount of the outstanding debt.
(2) Transaction costs primarily represent underwriting commissions charged as a percentage of the related debt offerings, as well as legal, rating agency and other professional fees.
Bank Credit Facilities and Commercial PaperAs at June 30, 2021, the Company had undrawn revolving bank credit facilities of $4,959 million. Additionally, the Company had in place fully drawn term credit facilities of $3,650 million. Details of these facilities are described below. The Company also has certain other dedicated credit facilities supporting letters of credit. At June 30, 2021, the Company had $682 million drawn under its commercial paper program, and reserves capacity under its revolving bank credit facilities for amounts outstanding under this program.• a $100 million demand credit facility;• a $2,425 million revolving syndicated credit facility maturing June 2022;• a $1,000 million non-revolving term credit facility maturing February 2023;• a $2,650 million non-revolving term credit facility maturing February 2023;• a $2,425 million revolving syndicated credit facility maturing June 2023; and• a £5 million demand credit facility related to the Company’s North Sea operations.
Borrowings under the Company's non-revolving term credit facilities may be made by way of pricing referenced to Canadian dollar bankers' acceptances, US dollar bankers’ acceptances, LIBOR, US base rate or Canadian prime rate. During the first quarter of 2021, the $1,000 million non-revolving term credit facility, originally due February 2022, was extended to February 2023.During 2019, the Company entered into a $3,250 million non-revolving term credit facility with an original maturity of June 2022, to finance the acquisition of assets from Devon Canada Corporation. During the second quarter of 2021, the outstanding balance of $2,125 million was repaid and the facility was cancelled.The revolving syndicated credit facilities are extendible annually at the mutual agreement of the Company and the lenders. If the facilities are not extended, the full amount of the outstanding principal would be repayable on the maturity date. Borrowings under the Company's revolving term credit facilities may be made by way of pricing referenced to Canadian dollar bankers' acceptances, US dollar bankers' acceptances, LIBOR, US base rate or Canadian prime rate.
Canadian Natural Resources Limited 9 Three and six months ended June 30, 2021
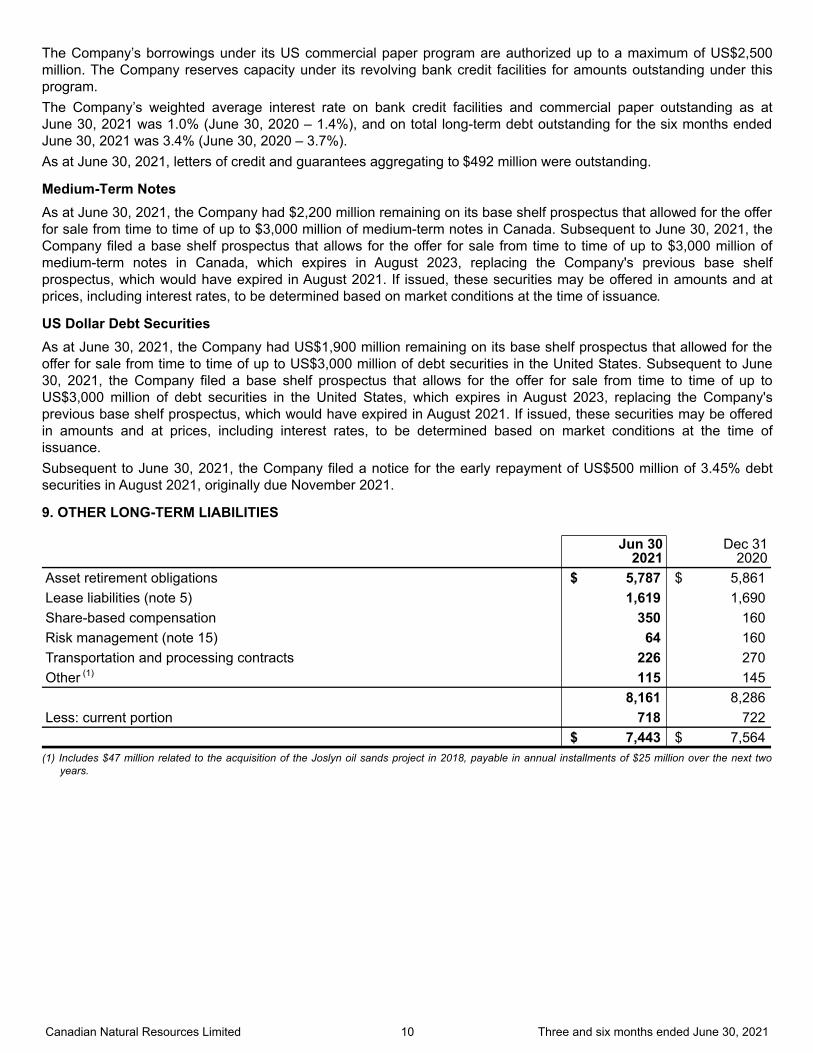
The Company’s borrowings under its US commercial paper program are authorized up to a maximum of US$2,500 million. The Company reserves capacity under its revolving bank credit facilities for amounts outstanding under this program.The Company’s weighted average interest rate on bank credit facilities and commercial paper outstanding as at June 30, 2021 was 1.0% (June 30, 2020 – 1.4%), and on total long-term debt outstanding for the six months ended June 30, 2021 was 3.4% (June 30, 2020 – 3.7%).As at June 30, 2021, letters of credit and guarantees aggregating to $492 million were outstanding.
Medium-Term NotesAs at June 30, 2021, the Company had $2,200 million remaining on its base shelf prospectus that allowed for the offer for sale from time to time of up to $3,000 million of medium-term notes in Canada. Subsequent to June 30, 2021, the Company filed a base shelf prospectus that allows for the offer for sale from time to time of up to $3,000 million of medium-term notes in Canada, which expires in August 2023, replacing the Company's previous base shelf prospectus, which would have expired in August 2021. If issued, these securities may be offered in amounts and at prices, including interest rates, to be determined based on market conditions at the time of issuance.
US Dollar Debt SecuritiesAs at June 30, 2021, the Company had US$1,900 million remaining on its base shelf prospectus that allowed for the offer for sale from time to time of up to US$3,000 million of debt securities in the United States. Subsequent to June 30, 2021, the Company filed a base shelf prospectus that allows for the offer for sale from time to time of up to US$3,000 million of debt securities in the United States, which expires in August 2023, replacing the Company's previous base shelf prospectus, which would have expired in August 2021. If issued, these securities may be offered in amounts and at prices, including interest rates, to be determined based on market conditions at the time of issuance. Subsequent to June 30, 2021, the Company filed a notice for the early repayment of US$500 million of 3.45% debt securities in August 2021, originally due November 2021.
9. OTHER LONG-TERM LIABILITIES
Jun 30
2021Dec 31
2020Asset retirement obligations $ 5,787 $ 5,861 Lease liabilities (note 5) 1,619 1,690 Share-based compensation 350 160 Risk management (note 15) 64 160 Transportation and processing contracts 226 270 Other (1) 115 145 8,161 8,286 Less: current portion 718 722 $ 7,443 $ 7,564
(1) Includes $47 million related to the acquisition of the Joslyn oil sands project in 2018, payable in annual installments of $25 million over the next two years.
Canadian Natural Resources Limited 10 Three and six months ended June 30, 2021
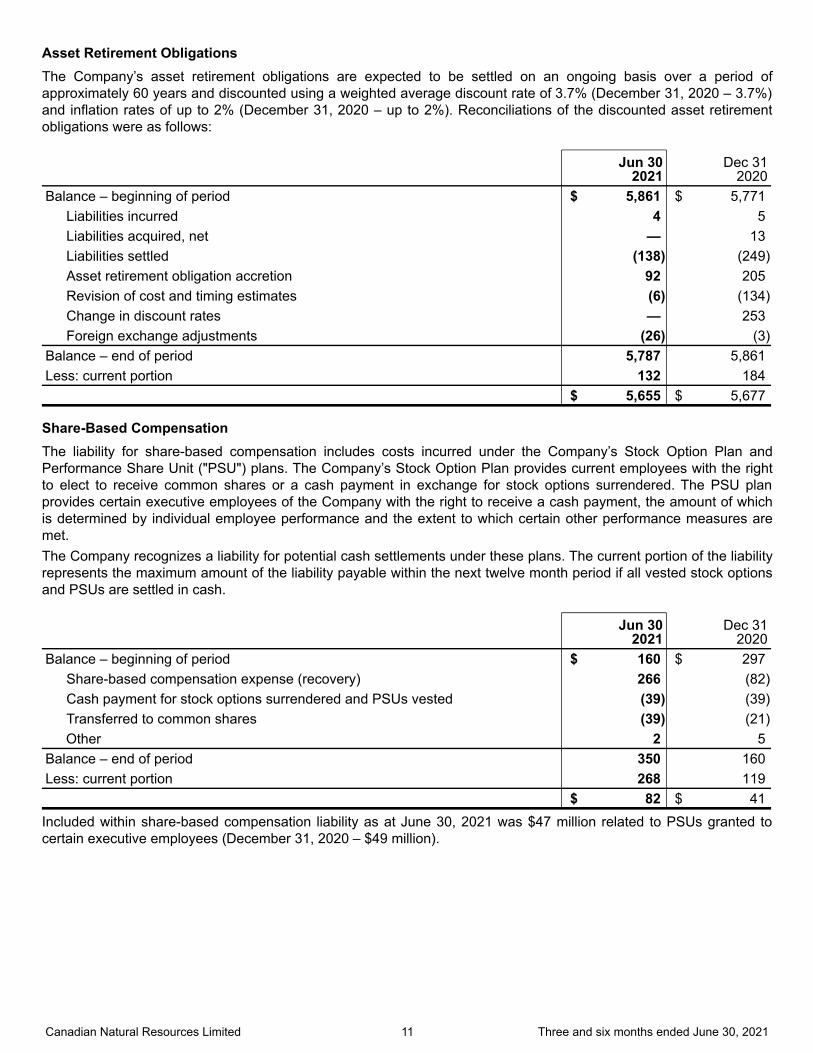
Asset Retirement ObligationsThe Company’s asset retirement obligations are expected to be settled on an ongoing basis over a period of approximately 60 years and discounted using a weighted average discount rate of 3.7% (December 31, 2020 – 3.7%) and inflation rates of up to 2% (December 31, 2020 – up to 2%). Reconciliations of the discounted asset retirement obligations were as follows:
Jun 30
2021Dec 31
2020Balance – beginning of period $ 5,861 $ 5,771
Liabilities incurred 4 5 Liabilities acquired, net — 13 Liabilities settled (138) (249) Asset retirement obligation accretion 92 205 Revision of cost and timing estimates (6) (134) Change in discount rates — 253 Foreign exchange adjustments (26) (3)
Balance – end of period 5,787 5,861 Less: current portion 132 184 $ 5,655 $ 5,677
Share-Based CompensationThe liability for share-based compensation includes costs incurred under the Company’s Stock Option Plan and Performance Share Unit ("PSU") plans. The Company’s Stock Option Plan provides current employees with the right to elect to receive common shares or a cash payment in exchange for stock options surrendered. The PSU plan provides certain executive employees of the Company with the right to receive a cash payment, the amount of which is determined by individual employee performance and the extent to which certain other performance measures are met. The Company recognizes a liability for potential cash settlements under these plans. The current portion of the liability represents the maximum amount of the liability payable within the next twelve month period if all vested stock options and PSUs are settled in cash.
Jun 30
2021Dec 31
2020Balance – beginning of period $ 160 $ 297
Share-based compensation expense (recovery) 266 (82) Cash payment for stock options surrendered and PSUs vested (39) (39) Transferred to common shares (39) (21)
Other 2 5 Balance – end of period 350 160 Less: current portion 268 119 $ 82 $ 41 Included within share-based compensation liability as at June 30, 2021 was $47 million related to PSUs granted to certain executive employees (December 31, 2020 – $49 million).
Canadian Natural Resources Limited 11 Three and six months ended June 30, 2021
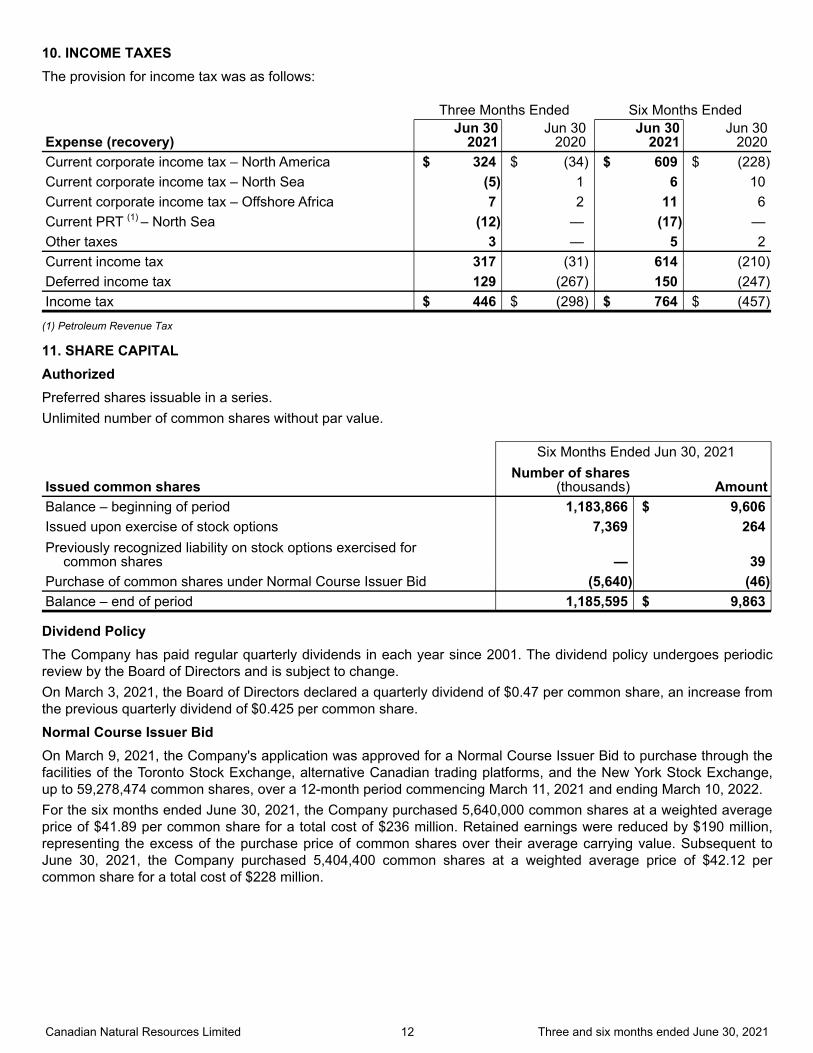
10. INCOME TAXESThe provision for income tax was as follows:
Three Months Ended Six Months Ended
Expense (recovery)Jun 30
2021Jun 30
2020Jun 30
2021Jun 30
2020Current corporate income tax – North America $ 324 $ (34) $ 609 $ (228) Current corporate income tax – North Sea (5) 1 6 10 Current corporate income tax – Offshore Africa 7 2 11 6 Current PRT (1) – North Sea (12) — (17) — Other taxes 3 — 5 2 Current income tax 317 (31) 614 (210) Deferred income tax 129 (267) 150 (247) Income tax $ 446 $ (298) $ 764 $ (457)
(1) Petroleum Revenue Tax
11. SHARE CAPITALAuthorizedPreferred shares issuable in a series.Unlimited number of common shares without par value.
Six Months Ended Jun 30, 2021
Issued common sharesNumber of shares
(thousands) AmountBalance – beginning of period 1,183,866 $ 9,606 Issued upon exercise of stock options 7,369 264 Previously recognized liability on stock options exercised for
common shares — 39 Purchase of common shares under Normal Course Issuer Bid (5,640) (46) Balance – end of period 1,185,595 $ 9,863
Dividend PolicyThe Company has paid regular quarterly dividends in each year since 2001. The dividend policy undergoes periodic review by the Board of Directors and is subject to change.On March 3, 2021, the Board of Directors declared a quarterly dividend of $0.47 per common share, an increase from the previous quarterly dividend of $0.425 per common share.
Normal Course Issuer BidOn March 9, 2021, the Company's application was approved for a Normal Course Issuer Bid to purchase through the facilities of the Toronto Stock Exchange, alternative Canadian trading platforms, and the New York Stock Exchange, up to 59,278,474 common shares, over a 12-month period commencing March 11, 2021 and ending March 10, 2022. For the six months ended June 30, 2021, the Company purchased 5,640,000 common shares at a weighted average price of $41.89 per common share for a total cost of $236 million. Retained earnings were reduced by $190 million, representing the excess of the purchase price of common shares over their average carrying value. Subsequent to June 30, 2021, the Company purchased 5,404,400 common shares at a weighted average price of $42.12 per common share for a total cost of $228 million.
Canadian Natural Resources Limited 12 Three and six months ended June 30, 2021
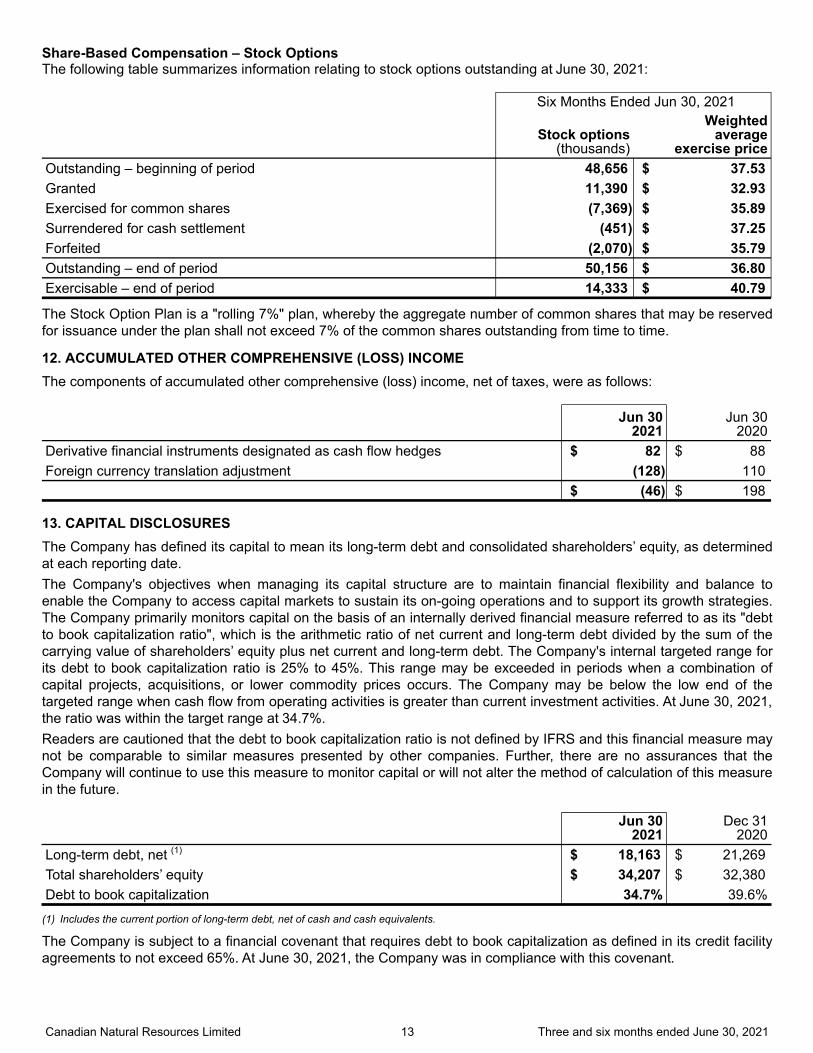
Share-Based Compensation – Stock OptionsThe following table summarizes information relating to stock options outstanding at June 30, 2021:
Six Months Ended Jun 30, 2021
Stock options
(thousands)
Weighted average
exercise priceOutstanding – beginning of period 48,656 $ 37.53 Granted 11,390 $ 32.93 Exercised for common shares (7,369) $ 35.89 Surrendered for cash settlement (451) $ 37.25 Forfeited (2,070) $ 35.79 Outstanding – end of period 50,156 $ 36.80 Exercisable – end of period 14,333 $ 40.79
The Stock Option Plan is a "rolling 7%" plan, whereby the aggregate number of common shares that may be reserved for issuance under the plan shall not exceed 7% of the common shares outstanding from time to time.
12. ACCUMULATED OTHER COMPREHENSIVE (LOSS) INCOMEThe components of accumulated other comprehensive (loss) income, net of taxes, were as follows:
Jun 30
2021Jun 30
2020Derivative financial instruments designated as cash flow hedges $ 82 $ 88 Foreign currency translation adjustment (128) 110 $ (46) $ 198
13. CAPITAL DISCLOSURESThe Company has defined its capital to mean its long-term debt and consolidated shareholders’ equity, as determined at each reporting date.The Company's objectives when managing its capital structure are to maintain financial flexibility and balance to enable the Company to access capital markets to sustain its on-going operations and to support its growth strategies. The Company primarily monitors capital on the basis of an internally derived financial measure referred to as its "debt to book capitalization ratio", which is the arithmetic ratio of net current and long-term debt divided by the sum of the carrying value of shareholders’ equity plus net current and long-term debt. The Company's internal targeted range for its debt to book capitalization ratio is 25% to 45%. This range may be exceeded in periods when a combination of capital projects, acquisitions, or lower commodity prices occurs. The Company may be below the low end of the targeted range when cash flow from operating activities is greater than current investment activities. At June 30, 2021, the ratio was within the target range at 34.7%.Readers are cautioned that the debt to book capitalization ratio is not defined by IFRS and this financial measure may not be comparable to similar measures presented by other companies. Further, there are no assurances that the Company will continue to use this measure to monitor capital or will not alter the method of calculation of this measure in the future.
Jun 30
2021Dec 31
2020Long-term debt, net (1) $ 18,163 $ 21,269 Total shareholders’ equity $ 34,207 $ 32,380 Debt to book capitalization 34.7% 39.6%
(1) Includes the current portion of long-term debt, net of cash and cash equivalents.
The Company is subject to a financial covenant that requires debt to book capitalization as defined in its credit facility agreements to not exceed 65%. At June 30, 2021, the Company was in compliance with this covenant.
Canadian Natural Resources Limited 13 Three and six months ended June 30, 2021
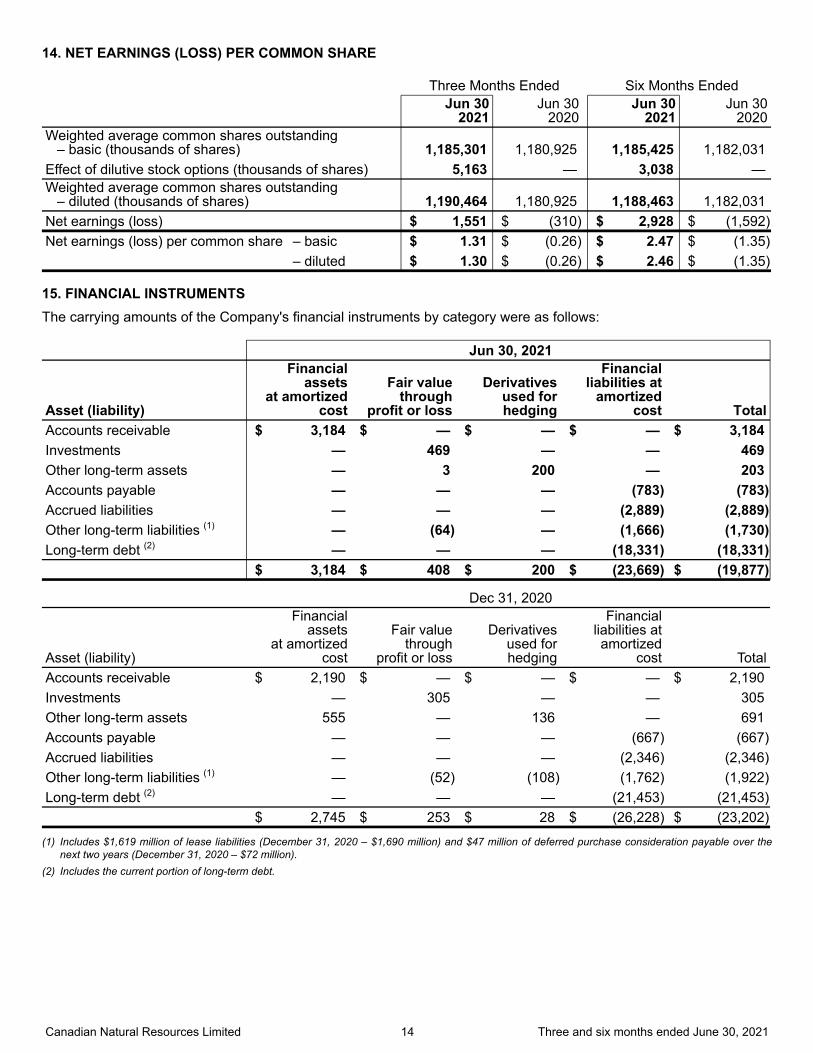
14. NET EARNINGS (LOSS) PER COMMON SHARE
Three Months Ended Six Months Ended
Jun 30
2021Jun 30
2020Jun 30
2021Jun 30
2020Weighted average common shares outstanding – basic (thousands of shares) 1,185,301 1,180,925 1,185,425 1,182,031 Effect of dilutive stock options (thousands of shares) 5,163 — 3,038 — Weighted average common shares outstanding – diluted (thousands of shares) 1,190,464 1,180,925 1,188,463 1,182,031 Net earnings (loss) $ 1,551 $ (310) $ 2,928 $ (1,592) Net earnings (loss) per common share – basic $ 1.31 $ (0.26) $ 2.47 $ (1.35) – diluted $ 1.30 $ (0.26) $ 2.46 $ (1.35)
15. FINANCIAL INSTRUMENTSThe carrying amounts of the Company's financial instruments by category were as follows:
Jun 30, 2021
Asset (liability)
Financial assets
at amortized cost
Fair value through
profit or loss
Derivatives used for hedging
Financial liabilities at
amortizedcost Total
Accounts receivable $ 3,184 $ — $ — $ — $ 3,184 Investments — 469 — — 469 Other long-term assets — 3 200 — 203 Accounts payable — — — (783) (783) Accrued liabilities — — — (2,889) (2,889) Other long-term liabilities (1) — (64) — (1,666) (1,730) Long-term debt (2) — — — (18,331) (18,331) $ 3,184 $ 408 $ 200 $ (23,669) $ (19,877)
Dec 31, 2020
Asset (liability)
Financial assets
at amortized cost
Fair value through
profit or loss
Derivatives used for hedging
Financial liabilities at amortized
cost TotalAccounts receivable $ 2,190 $ — $ — $ — $ 2,190 Investments — 305 — — 305 Other long-term assets 555 — 136 — 691 Accounts payable — — — (667) (667) Accrued liabilities — — — (2,346) (2,346) Other long-term liabilities (1) — (52) (108) (1,762) (1,922) Long-term debt (2) — — — (21,453) (21,453) $ 2,745 $ 253 $ 28 $ (26,228) $ (23,202)
(1) Includes $1,619 million of lease liabilities (December 31, 2020 – $1,690 million) and $47 million of deferred purchase consideration payable over the next two years (December 31, 2020 – $72 million).
(2) Includes the current portion of long-term debt.
Canadian Natural Resources Limited 14 Three and six months ended June 30, 2021
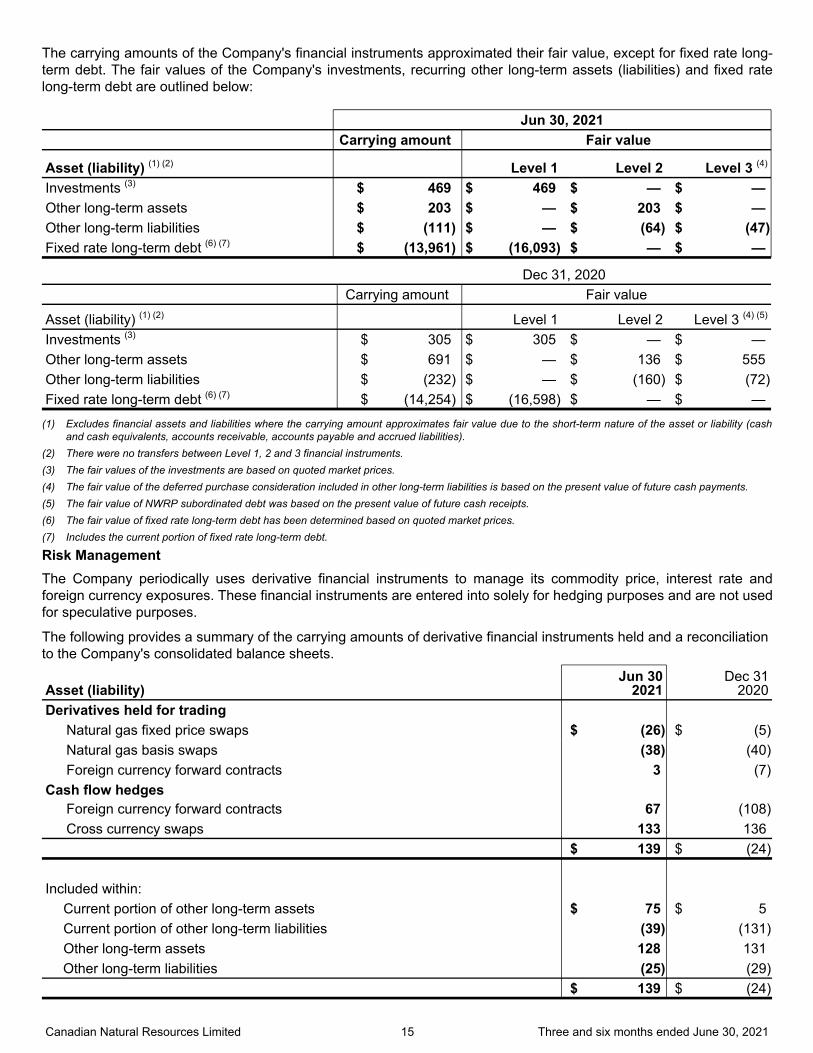
The carrying amounts of the Company's financial instruments approximated their fair value, except for fixed rate long-term debt. The fair values of the Company's investments, recurring other long-term assets (liabilities) and fixed rate long-term debt are outlined below:
Jun 30, 2021 Carrying amount Fair value
Asset (liability) (1) (2) Level 1 Level 2 Level 3 (4)
Investments (3) $ 469 $ 469 $ — $ — Other long-term assets $ 203 $ — $ 203 $ — Other long-term liabilities $ (111) $ — $ (64) $ (47) Fixed rate long-term debt (6) (7) $ (13,961) $ (16,093) $ — $ —
Dec 31, 2020 Carrying amount Fair value
Asset (liability) (1) (2) Level 1 Level 2 Level 3 (4) (5)
Investments (3) $ 305 $ 305 $ — $ — Other long-term assets $ 691 $ — $ 136 $ 555 Other long-term liabilities $ (232) $ — $ (160) $ (72) Fixed rate long-term debt (6) (7) $ (14,254) $ (16,598) $ — $ —
(1) Excludes financial assets and liabilities where the carrying amount approximates fair value due to the short-term nature of the asset or liability (cash and cash equivalents, accounts receivable, accounts payable and accrued liabilities).
(2) There were no transfers between Level 1, 2 and 3 financial instruments.(3) The fair values of the investments are based on quoted market prices.(4) The fair value of the deferred purchase consideration included in other long-term liabilities is based on the present value of future cash payments.(5) The fair value of NWRP subordinated debt was based on the present value of future cash receipts.(6) The fair value of fixed rate long-term debt has been determined based on quoted market prices.(7) Includes the current portion of fixed rate long-term debt.
Risk ManagementThe Company periodically uses derivative financial instruments to manage its commodity price, interest rate and foreign currency exposures. These financial instruments are entered into solely for hedging purposes and are not used for speculative purposes.
The following provides a summary of the carrying amounts of derivative financial instruments held and a reconciliation to the Company's consolidated balance sheets.
Asset (liability)Jun 30
2021Dec 31
2020Derivatives held for trading
Natural gas fixed price swaps $ (26) $ (5) Natural gas basis swaps (38) (40) Foreign currency forward contracts 3 (7)
Cash flow hedges
Foreign currency forward contracts 67 (108) Cross currency swaps 133 136
$ 139 $ (24)
Included within:
Current portion of other long-term assets $ 75 $ 5 Current portion of other long-term liabilities (39) (131) Other long-term assets 128 131 Other long-term liabilities (25) (29)
$ 139 $ (24)
Canadian Natural Resources Limited 15 Three and six months ended June 30, 2021
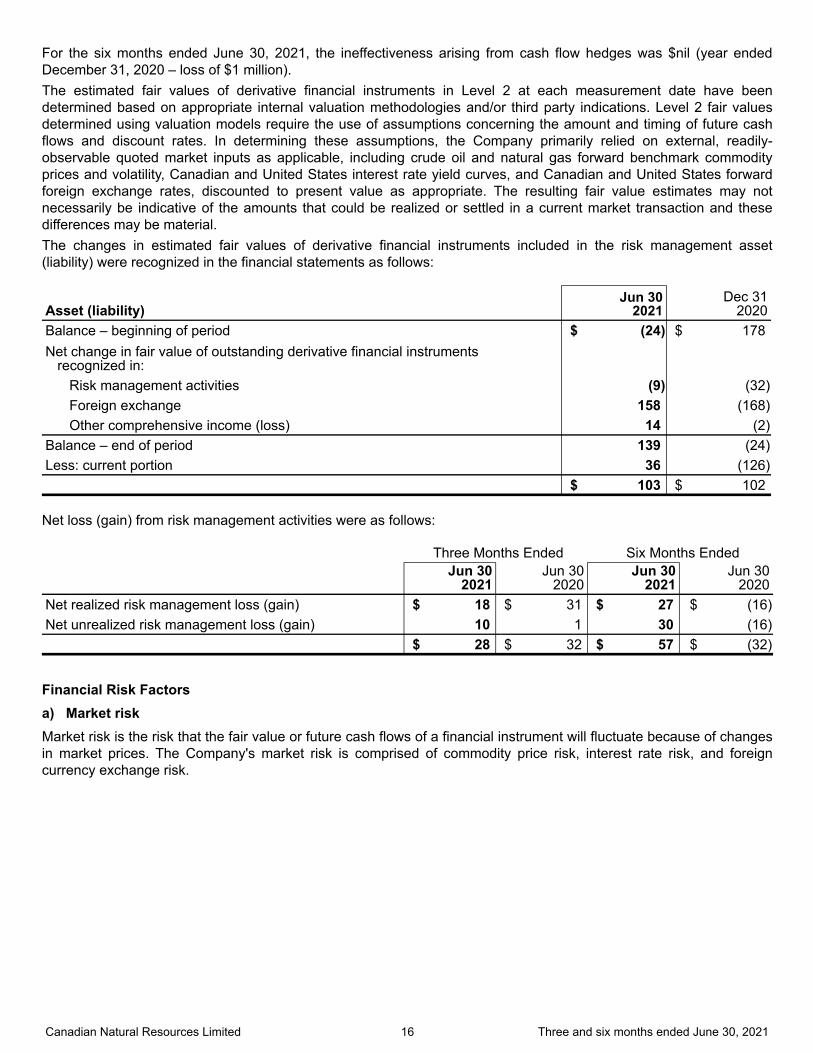
For the six months ended June 30, 2021, the ineffectiveness arising from cash flow hedges was $nil (year ended December 31, 2020 – loss of $1 million).The estimated fair values of derivative financial instruments in Level 2 at each measurement date have been determined based on appropriate internal valuation methodologies and/or third party indications. Level 2 fair values determined using valuation models require the use of assumptions concerning the amount and timing of future cash flows and discount rates. In determining these assumptions, the Company primarily relied on external, readily-observable quoted market inputs as applicable, including crude oil and natural gas forward benchmark commodity prices and volatility, Canadian and United States interest rate yield curves, and Canadian and United States forward foreign exchange rates, discounted to present value as appropriate. The resulting fair value estimates may not necessarily be indicative of the amounts that could be realized or settled in a current market transaction and these differences may be material.The changes in estimated fair values of derivative financial instruments included in the risk management asset (liability) were recognized in the financial statements as follows:
Asset (liability)Jun 30
2021Dec 31
2020Balance – beginning of period $ (24) $ 178 Net change in fair value of outstanding derivative financial instruments
recognized in:
Risk management activities (9) (32) Foreign exchange 158 (168) Other comprehensive income (loss) 14 (2)
Balance – end of period 139 (24) Less: current portion 36 (126) $ 103 $ 102
Net loss (gain) from risk management activities were as follows:
Three Months Ended Six Months Ended
Jun 30
2021Jun 30
2020Jun 30
2021Jun 30
2020Net realized risk management loss (gain) $ 18 $ 31 $ 27 $ (16) Net unrealized risk management loss (gain) 10 1 30 (16) $ 28 $ 32 $ 57 $ (32)
Financial Risk Factorsa) Market riskMarket risk is the risk that the fair value or future cash flows of a financial instrument will fluctuate because of changes in market prices. The Company's market risk is comprised of commodity price risk, interest rate risk, and foreign currency exchange risk.
Canadian Natural Resources Limited 16 Three and six months ended June 30, 2021
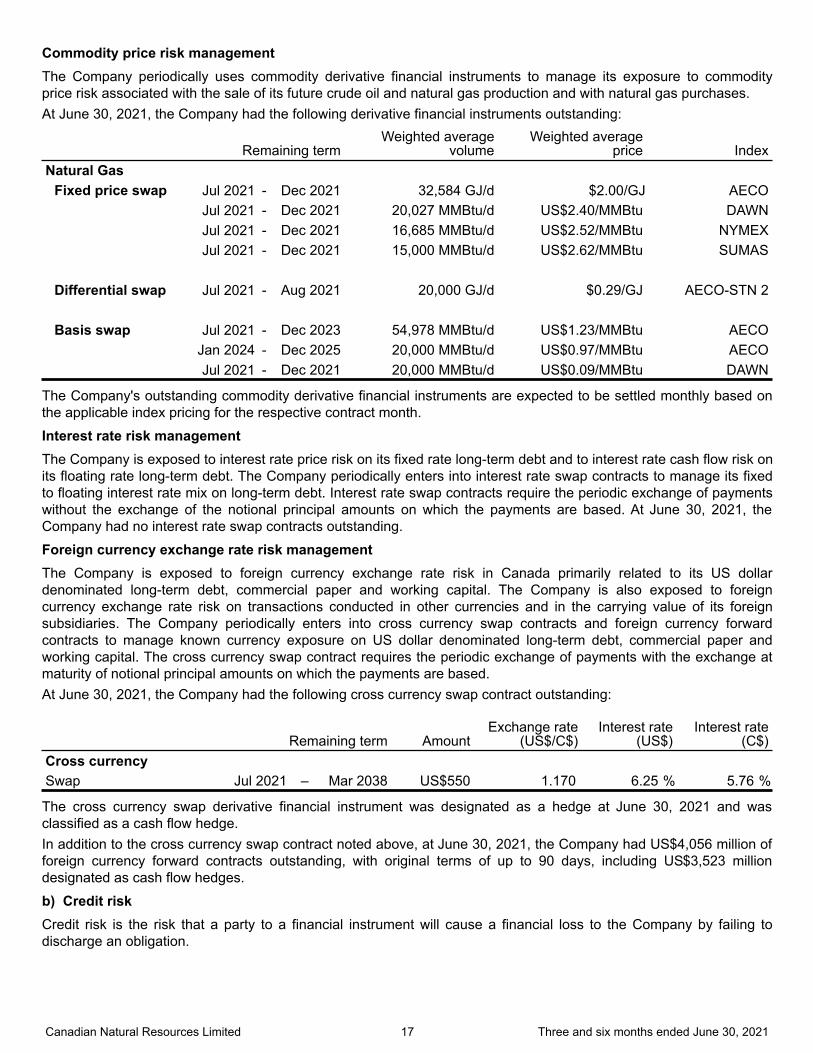
Commodity price risk managementThe Company periodically uses commodity derivative financial instruments to manage its exposure to commodity price risk associated with the sale of its future crude oil and natural gas production and with natural gas purchases. At June 30, 2021, the Company had the following derivative financial instruments outstanding:
Remaining termWeighted average
volumeWeighted average
price IndexNatural Gas
Fixed price swap Jul 2021 - Dec 2021 32,584 GJ/d $2.00/GJ AECOJul 2021 - Dec 2021 20,027 MMBtu/d US$2.40/MMBtu DAWNJul 2021 - Dec 2021 16,685 MMBtu/d US$2.52/MMBtu NYMEXJul 2021 - Dec 2021 15,000 MMBtu/d US$2.62/MMBtu SUMAS
Differential swap Jul 2021 - Aug 2021 20,000 GJ/d $0.29/GJ AECO-STN 2
Basis swap Jul 2021 - Dec 2023 54,978 MMBtu/d US$1.23/MMBtu AECOJan 2024 - Dec 2025 20,000 MMBtu/d US$0.97/MMBtu AECOJul 2021 - Dec 2021 20,000 MMBtu/d US$0.09/MMBtu DAWN
The Company's outstanding commodity derivative financial instruments are expected to be settled monthly based on the applicable index pricing for the respective contract month.
Interest rate risk managementThe Company is exposed to interest rate price risk on its fixed rate long-term debt and to interest rate cash flow risk on its floating rate long-term debt. The Company periodically enters into interest rate swap contracts to manage its fixed to floating interest rate mix on long-term debt. Interest rate swap contracts require the periodic exchange of payments without the exchange of the notional principal amounts on which the payments are based. At June 30, 2021, the Company had no interest rate swap contracts outstanding.
Foreign currency exchange rate risk managementThe Company is exposed to foreign currency exchange rate risk in Canada primarily related to its US dollar denominated long-term debt, commercial paper and working capital. The Company is also exposed to foreign currency exchange rate risk on transactions conducted in other currencies and in the carrying value of its foreign subsidiaries. The Company periodically enters into cross currency swap contracts and foreign currency forward contracts to manage known currency exposure on US dollar denominated long-term debt, commercial paper and working capital. The cross currency swap contract requires the periodic exchange of payments with the exchange at maturity of notional principal amounts on which the payments are based.At June 30, 2021, the Company had the following cross currency swap contract outstanding:
Remaining term Amount
Exchange rate(US$/C$)
Interest rate(US$)
Interest rate(C$)
Cross currency
Swap Jul 2021 – Mar 2038 US$550 1.170 6.25 % 5.76 %
The cross currency swap derivative financial instrument was designated as a hedge at June 30, 2021 and was classified as a cash flow hedge.In addition to the cross currency swap contract noted above, at June 30, 2021, the Company had US$4,056 million of foreign currency forward contracts outstanding, with original terms of up to 90 days, including US$3,523 million designated as cash flow hedges.
b) Credit riskCredit risk is the risk that a party to a financial instrument will cause a financial loss to the Company by failing to discharge an obligation.
Canadian Natural Resources Limited 17 Three and six months ended June 30, 2021
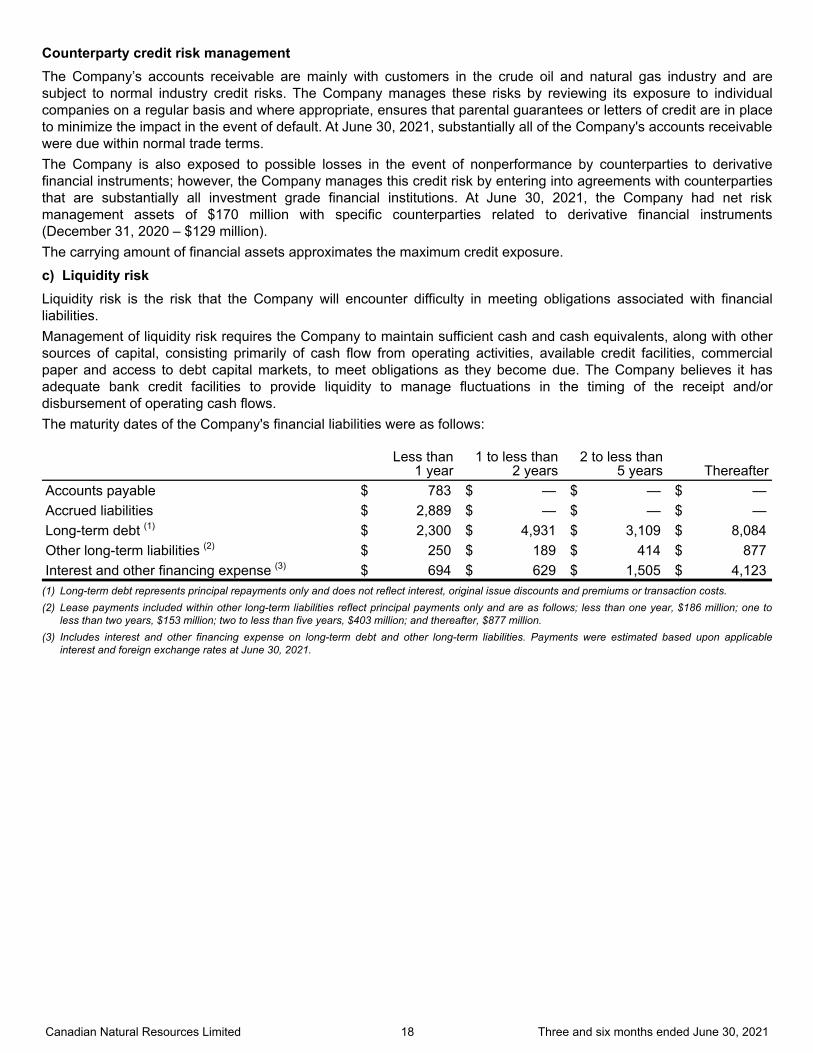
Counterparty credit risk management The Company’s accounts receivable are mainly with customers in the crude oil and natural gas industry and are subject to normal industry credit risks. The Company manages these risks by reviewing its exposure to individual companies on a regular basis and where appropriate, ensures that parental guarantees or letters of credit are in place to minimize the impact in the event of default. At June 30, 2021, substantially all of the Company's accounts receivable were due within normal trade terms.The Company is also exposed to possible losses in the event of nonperformance by counterparties to derivative financial instruments; however, the Company manages this credit risk by entering into agreements with counterparties that are substantially all investment grade financial institutions. At June 30, 2021, the Company had net risk management assets of $170 million with specific counterparties related to derivative financial instruments (December 31, 2020 – $129 million). The carrying amount of financial assets approximates the maximum credit exposure.
c) Liquidity risk Liquidity risk is the risk that the Company will encounter difficulty in meeting obligations associated with financial liabilities.Management of liquidity risk requires the Company to maintain sufficient cash and cash equivalents, along with other sources of capital, consisting primarily of cash flow from operating activities, available credit facilities, commercial paper and access to debt capital markets, to meet obligations as they become due. The Company believes it has adequate bank credit facilities to provide liquidity to manage fluctuations in the timing of the receipt and/or disbursement of operating cash flows.The maturity dates of the Company's financial liabilities were as follows:
Less than
1 year1 to less than
2 years2 to less than
5 years ThereafterAccounts payable $ 783 $ — $ — $ — Accrued liabilities $ 2,889 $ — $ — $ — Long-term debt (1) $ 2,300 $ 4,931 $ 3,109 $ 8,084 Other long-term liabilities (2) $ 250 $ 189 $ 414 $ 877 Interest and other financing expense (3) $ 694 $ 629 $ 1,505 $ 4,123
(1) Long-term debt represents principal repayments only and does not reflect interest, original issue discounts and premiums or transaction costs. (2) Lease payments included within other long-term liabilities reflect principal payments only and are as follows; less than one year, $186 million; one to
less than two years, $153 million; two to less than five years, $403 million; and thereafter, $877 million.(3) Includes interest and other financing expense on long-term debt and other long-term liabilities. Payments were estimated based upon applicable
interest and foreign exchange rates at June 30, 2021.
Canadian Natural Resources Limited 18 Three and six months ended June 30, 2021
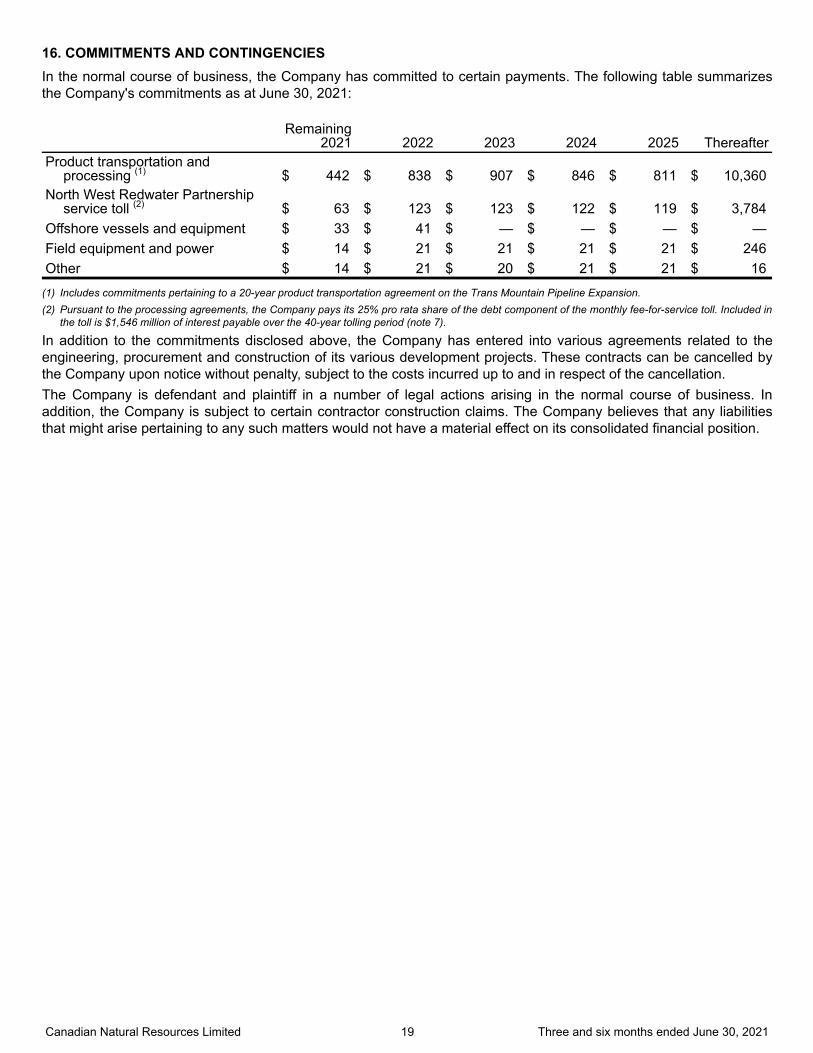
16. COMMITMENTS AND CONTINGENCIESIn the normal course of business, the Company has committed to certain payments. The following table summarizes the Company's commitments as at June 30, 2021:
Remaining
2021 2022 2023 2024 2025 ThereafterProduct transportation and
processing (1) $ 442 $ 838 $ 907 $ 846 $ 811 $ 10,360 North West Redwater Partnership
service toll (2) $ 63 $ 123 $ 123 $ 122 $ 119 $ 3,784 Offshore vessels and equipment $ 33 $ 41 $ — $ — $ — $ — Field equipment and power $ 14 $ 21 $ 21 $ 21 $ 21 $ 246 Other $ 14 $ 21 $ 20 $ 21 $ 21 $ 16
(1) Includes commitments pertaining to a 20-year product transportation agreement on the Trans Mountain Pipeline Expansion. (2) Pursuant to the processing agreements, the Company pays its 25% pro rata share of the debt component of the monthly fee-for-service toll. Included in
the toll is $1,546 million of interest payable over the 40-year tolling period (note 7).
In addition to the commitments disclosed above, the Company has entered into various agreements related to the engineering, procurement and construction of its various development projects. These contracts can be cancelled by the Company upon notice without penalty, subject to the costs incurred up to and in respect of the cancellation. The Company is defendant and plaintiff in a number of legal actions arising in the normal course of business. In addition, the Company is subject to certain contractor construction claims. The Company believes that any liabilities that might arise pertaining to any such matters would not have a material effect on its consolidated financial position.
Canadian Natural Resources Limited 19 Three and six months ended June 30, 2021
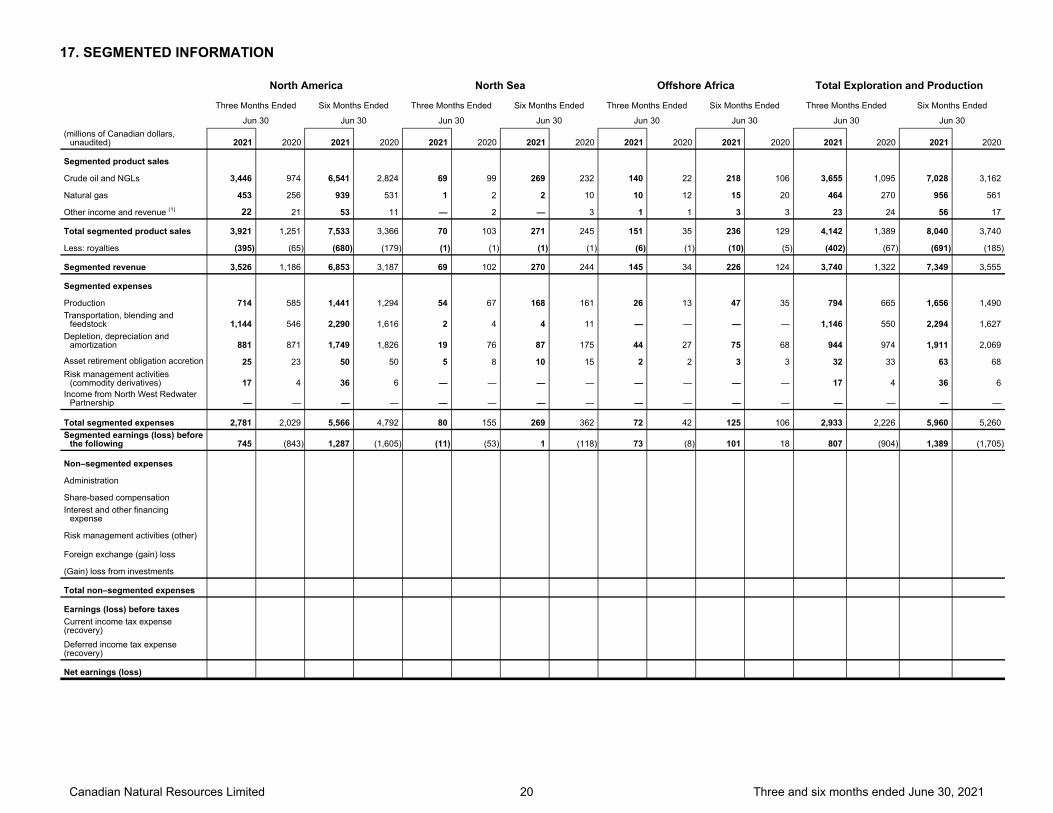
17. SEGMENTED INFORMATION
North America North Sea Offshore Africa Total Exploration and Production
Three Months Ended Six Months Ended Three Months Ended Six Months Ended Three Months Ended Six Months Ended Three Months Ended Six Months Ended
Jun 30 Jun 30 Jun 30 Jun 30 Jun 30 Jun 30 Jun 30 Jun 30(millions of Canadian dollars,
unaudited) 2021 2020 2021 2020 2021 2020 2021 2020 2021 2020 2021 2020 2021 2020 2021 2020
Segmented product sales
Crude oil and NGLs 3,446 974 6,541 2,824 69 99 269 232 140 22 218 106 3,655 1,095 7,028 3,162
Natural gas 453 256 939 531 1 2 2 10 10 12 15 20 464 270 956 561
Other income and revenue (1) 22 21 53 11 — 2 — 3 1 1 3 3 23 24 56 17
Total segmented product sales 3,921 1,251 7,533 3,366 70 103 271 245 151 35 236 129 4,142 1,389 8,040 3,740
Less: royalties (395) (65) (680) (179) (1) (1) (1) (1) (6) (1) (10) (5) (402) (67) (691) (185)
Segmented revenue 3,526 1,186 6,853 3,187 69 102 270 244 145 34 226 124 3,740 1,322 7,349 3,555
Segmented expenses
Production 714 585 1,441 1,294 54 67 168 161 26 13 47 35 794 665 1,656 1,490 Transportation, blending and
feedstock 1,144 546 2,290 1,616 2 4 4 11 — — — — 1,146 550 2,294 1,627 Depletion, depreciation and
amortization 881 871 1,749 1,826 19 76 87 175 44 27 75 68 944 974 1,911 2,069
Asset retirement obligation accretion 25 23 50 50 5 8 10 15 2 2 3 3 32 33 63 68 Risk management activities
(commodity derivatives) 17 4 36 6 — — — — — — — — 17 4 36 6 Income from North West Redwater
Partnership — — — — — — — — — — — — — — — —
Total segmented expenses 2,781 2,029 5,566 4,792 80 155 269 362 72 42 125 106 2,933 2,226 5,960 5,260 Segmented earnings (loss) before
the following 745 (843) 1,287 (1,605) (11) (53) 1 (118) 73 (8) 101 18 807 (904) 1,389 (1,705)
Non–segmented expenses
Administration
Share-based compensation Interest and other financing
expense
Risk management activities (other)
Foreign exchange (gain) loss
(Gain) loss from investments
Total non–segmented expenses
Earnings (loss) before taxes Current income tax expense (recovery) Deferred income tax expense (recovery)
Net earnings (loss)
Canadian Natural Resources Limited 20 Three and six months ended June 30, 2021
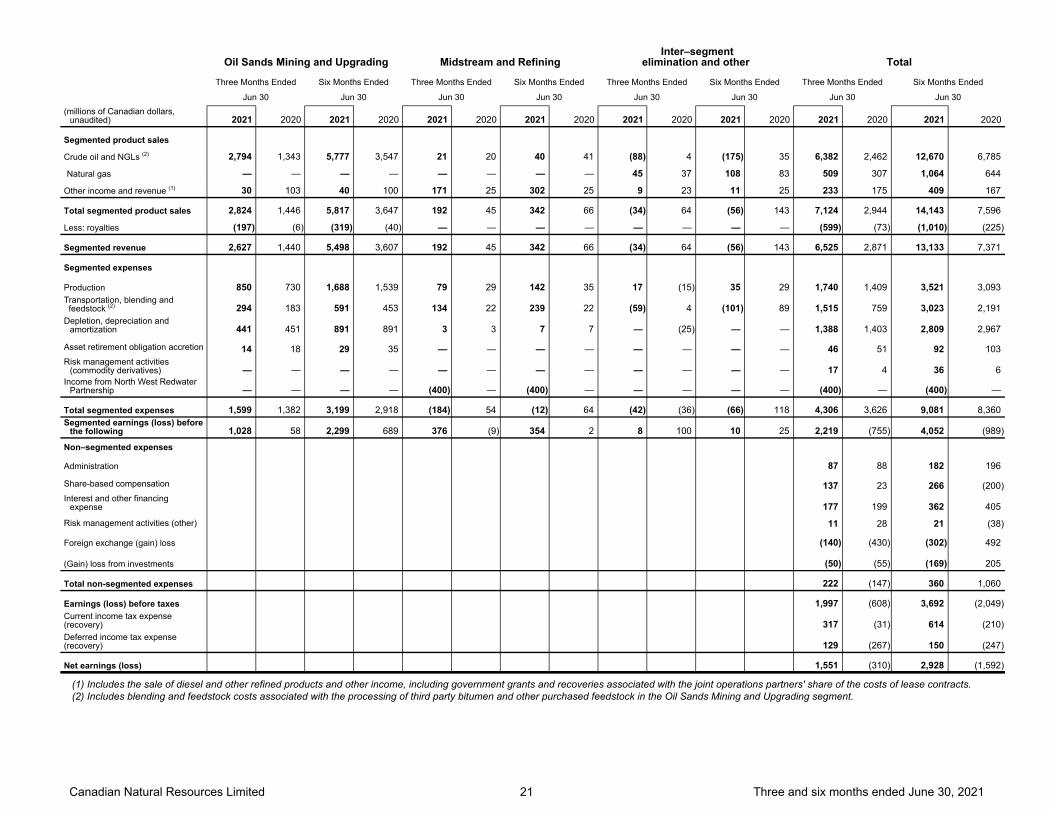
Oil Sands Mining and Upgrading Midstream and Refining Inter–segment
elimination and other
Total
Three Months Ended Six Months Ended Three Months Ended Six Months Ended Three Months Ended Six Months Ended Three Months Ended Six Months Ended
Jun 30 Jun 30 Jun 30 Jun 30 Jun 30 Jun 30 Jun 30 Jun 30(millions of Canadian dollars,
unaudited) 2021 2020 2021 2020 2021 2020 2021 2020 2021 2020 2021 2020 2021 2020 2021 2020
Segmented product sales
Crude oil and NGLs (2) 2,794 1,343 5,777 3,547 21 20 40 41 (88) 4 (175) 35 6,382 2,462 12,670 6,785
Natural gas — — — — — — — — 45 37 108 83 509 307 1,064 644
Other income and revenue (1) 30 103 40 100 171 25 302 25 9 23 11 25 233 175 409 167
Total segmented product sales 2,824 1,446 5,817 3,647 192 45 342 66 (34) 64 (56) 143 7,124 2,944 14,143 7,596
Less: royalties (197) (6) (319) (40) — — — — — — — — (599) (73) (1,010) (225)
Segmented revenue 2,627 1,440 5,498 3,607 192 45 342 66 (34) 64 (56) 143 6,525 2,871 13,133 7,371
Segmented expenses
Production 850 730 1,688 1,539 79 29 142 35 17 (15) 35 29 1,740 1,409 3,521 3,093 Transportation, blending and feedstock (2) 294 183 591 453 134 22 239 22 (59) 4 (101) 89 1,515 759 3,023 2,191 Depletion, depreciation and
amortization 441 451 891 891 3 3 7 7 — (25) — — 1,388 1,403 2,809 2,967
Asset retirement obligation accretion 14 18 29 35 — — — — — — — — 46 51 92 103 Risk management activities
(commodity derivatives) — — — — — — — — — — — — 17 4 36 6 Income from North West Redwater
Partnership — — — — (400) — (400) — — — — — (400) — (400) —
Total segmented expenses 1,599 1,382 3,199 2,918 (184) 54 (12) 64 (42) (36) (66) 118 4,306 3,626 9,081 8,360 Segmented earnings (loss) before
the following 1,028 58 2,299 689 376 (9) 354 2 8 100 10 25 2,219 (755) 4,052 (989)
Non–segmented expenses
Administration 87 88 182 196
Share-based compensation 137 23 266 (200) Interest and other financing
expense 177 199 362 405
Risk management activities (other) 11 28 21 (38)
Foreign exchange (gain) loss (140) (430) (302) 492
(Gain) loss from investments (50) (55) (169) 205
Total non-segmented expenses 222 (147) 360 1,060
Earnings (loss) before taxes 1,997 (608) 3,692 (2,049) Current income tax expense (recovery) 317 (31) 614 (210) Deferred income tax expense (recovery) 129 (267) 150 (247)
Net earnings (loss) 1,551 (310) 2,928 (1,592)
(1) Includes the sale of diesel and other refined products and other income, including government grants and recoveries associated with the joint operations partners' share of the costs of lease contracts.(2) Includes blending and feedstock costs associated with the processing of third party bitumen and other purchased feedstock in the Oil Sands Mining and Upgrading segment.
Canadian Natural Resources Limited 21 Three and six months ended June 30, 2021
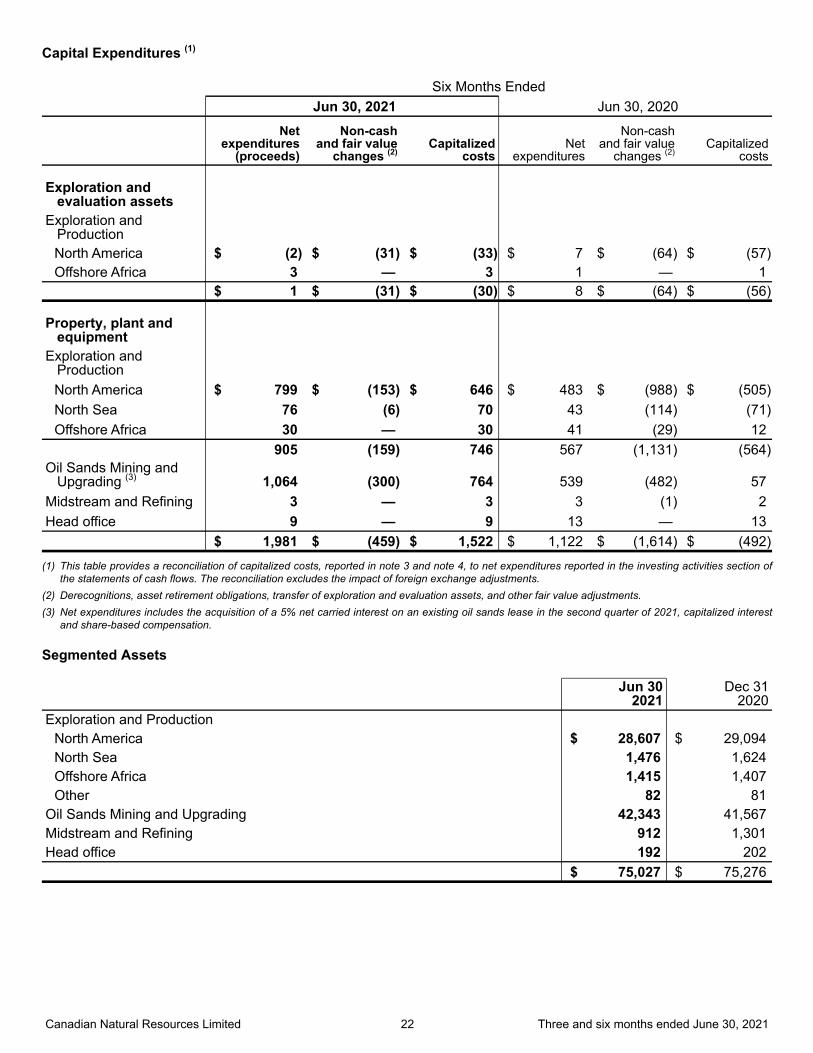
Capital Expenditures (1)
Six Months Ended Jun 30, 2021 Jun 30, 2020
Net expenditures
(proceeds)
Non-cashand fair value
changes (2) Capitalized
costsNet
expenditures
Non-cashand fair value
changes (2)Capitalized
costs
Exploration and evaluation assets
Exploration and Production
North America $ (2) $ (31) $ (33) $ 7 $ (64) $ (57) Offshore Africa 3 — 3 1 — 1
$ 1 $ (31) $ (30) $ 8 $ (64) $ (56)
Property, plant and equipment
Exploration and Production
North America $ 799 $ (153) $ 646 $ 483 $ (988) $ (505) North Sea 76 (6) 70 43 (114) (71) Offshore Africa 30 — 30 41 (29) 12
905 (159) 746 567 (1,131) (564) Oil Sands Mining and Upgrading (3) 1,064 (300) 764 539 (482) 57 Midstream and Refining 3 — 3 3 (1) 2 Head office 9 — 9 13 — 13 $ 1,981 $ (459) $ 1,522 $ 1,122 $ (1,614) $ (492)
(1) This table provides a reconciliation of capitalized costs, reported in note 3 and note 4, to net expenditures reported in the investing activities section of the statements of cash flows. The reconciliation excludes the impact of foreign exchange adjustments.
(2) Derecognitions, asset retirement obligations, transfer of exploration and evaluation assets, and other fair value adjustments.(3) Net expenditures includes the acquisition of a 5% net carried interest on an existing oil sands lease in the second quarter of 2021, capitalized interest
and share-based compensation.
Segmented Assets
Jun 30
2021Dec 31
2020Exploration and Production
North America $ 28,607 $ 29,094 North Sea 1,476 1,624 Offshore Africa 1,415 1,407 Other 82 81
Oil Sands Mining and Upgrading 42,343 41,567 Midstream and Refining 912 1,301 Head office 192 202 $ 75,027 $ 75,276
Canadian Natural Resources Limited 22 Three and six months ended June 30, 2021
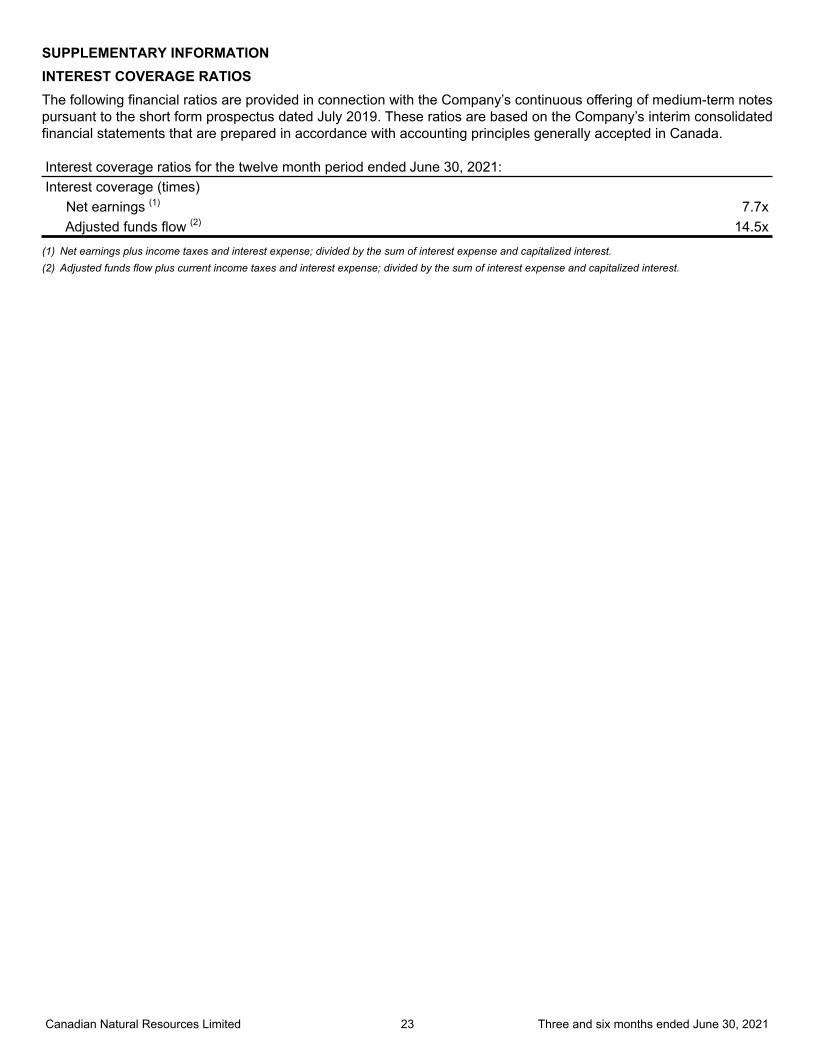
SUPPLEMENTARY INFORMATIONINTEREST COVERAGE RATIOSThe following financial ratios are provided in connection with the Company’s continuous offering of medium-term notes pursuant to the short form prospectus dated July 2019. These ratios are based on the Company’s interim consolidated financial statements that are prepared in accordance with accounting principles generally accepted in Canada.
Interest coverage ratios for the twelve month period ended June 30, 2021:Interest coverage (times)
Net earnings (1) 7.7x Adjusted funds flow (2) 14.5x
(1) Net earnings plus income taxes and interest expense; divided by the sum of interest expense and capitalized interest.(2) Adjusted funds flow plus current income taxes and interest expense; divided by the sum of interest expense and capitalized interest.
Canadian Natural Resources Limited 23 Three and six months ended June 30, 2021
Recommended