HANBURY EVANS WRIGHT VLATTAS + COMPANY • JULY 22, 2015
DRAFTCAMPUS MASTER PLAN
EXECUTIVE SUMMARYU N I V E R S I T Y O F A R K A N S A S AT P I N E B L U F F

acknowledgements
The planning team is grateful to all the dedicated people at the University of Arkansas at Pine Bluff who have devoted their vision, time, ideas and energy to the creation of this plan. A special thanks to the following individuals:
UAPB Executive Cabinet
Dr. Laurence B. Alexander, Chancellor Dr. Jacquelyn McCray, Interim Vice Chancellor, Academic Affairs Elbert Bennett, Vice Chancellor, Student Affairs Carla Martin, Interim Vice Chancellor, Finance and Administration Dr. Mary E. Benjamin, Vice Chancellor, Research and Innovation
James Tyson, Vice Chancellor, Development/Institutional Advancement
Janet Broiles, Chief of Staff
UAPB Steering Committee & Participants
Robert Wall, Director of Facilities Management
Ralph Owens, Dean of Student Life
Willette Totten, Director of Technical Services
Lonza Hardy Jr., Director of Athletics
Antonie Rice, Asso. Dean, School of Arts and Sciences
Linda Okiror, Asso. Vice Chancellor, Enrollment Management
Dr. Edmund Buckner, Asso. Dean for Agriculture Research and Ext.
Kara Brown, Asso. Dean of Student Activities / Student Involvement
Kay Turner, Director of Procurement
Master Plan Design Team
Hanbury Evans Wright Vlattas + Company
Scott Miller, Lead Planner
Reid Sabin, Campus Planner
John Dreiling, Project Manager
Yvonne M. Thibodeau, Space Planner
James Negri, Digital Artist
Elizabeth Morgan, Graphic Designer
Consultant Team
SCM Architects
EDSA, Inc., Landscape Design
McClelland Consulting Engineers, Inc., Civil Engineering
Cromwell Consulting Architects and Engineers, Inc., Infrastructure
The Sextant Group, Inc., Information Technology and Security

Dear UAPB Community and Friends:
It gives me great pleasure to present to you the Comprehensive Campus Master Plan for the University of Arkansas at Pine Bluff. Campus environments are constantly evolving as new buildings, varied architec-tural styles, and new landscape are incorporated. Quality facilities, spacious grounds and well-designed pathways can have a significant positive effect on the success of a higher educational institution in the 21st century.
The University of Arkansas at Pine Bluff is perfectly positioned to support innovation on our campus and contribute to the transformation of our region as we advance in the future. The new master plan provides an ambitious framework for the development of the university’s physical campus in the coming decades. Our physical campus is one of our most unique and valuable assets. This plan ensures that we continue to be responsible stewards of our 142 year-old institution. In keeping with the priorities established in our 2015 – 2020 strategic plan, the master plan envisions support for continued academic innovation and integration, focuses on the student experience and connects on a deeper level with the larger community.
The Master Plan for this campus is an inspiring look into the future, boldly establishing the direction for what the University of Arkansas at Pine Bluff will become. The formulation of this plan has been a highly inclusive process to ensure that the plan reflects our best collective thinking and shared vision. I would like to express my sincere appreciate to the leadership and members of the planning committee who have worked tirelessly on the development of this plan as well as our partners with the architecture and planning firm Hanbury Evans Wright Vlattas + Company. Our master plan aligns with our values, our principles, and our goals for the future. I look forward to our continued work together realize the goals of the plan.
Sincerely,
Laurence B. Alexander, J.D., Ph.D.Chancellor

contents
1.0 EXECUTIVE SUMMARY. . . . . . . . . . . . . . . . . . . . . . . . 51.1 Purpose . . . . . . . . . . . . . . . . . . . . . . . . . . . . . . . . . . . 61.2 Alignment with UAPB’s Strategic Plan . . . . . . . . . . . . . . . . . 71.3 Plan Drivers . . . . . . . . . . . . . . . . . . . . . . . . . . . . . . . . 81.4 Plan Principles . . . . . . . . . . . . . . . . . . . . . . . . . . . . . . . 81.5 Enrollment Projections and Space Needs Analysis . . . . . . . . . . 91.6 Master Plan Vision. . . . . . . . . . . . . . . . . . . . . . . . . . . . 111.7 Long Term Vision Plan . . . . . . . . . . . . . . . . . . . . . . . . . 12

PURPOSE
ALIGNMENT WITH UAPB’S STRATEGIC PLAN
PLAN DRIVERS
PLAN PRINCIPLES
ENROLLMENT PROJECTIONS AND SPACE NEEDS ANALYSIS
MASTER PLAN VISION
LONG TERM VISION PLAN
EXECUTIVE SUMMARY
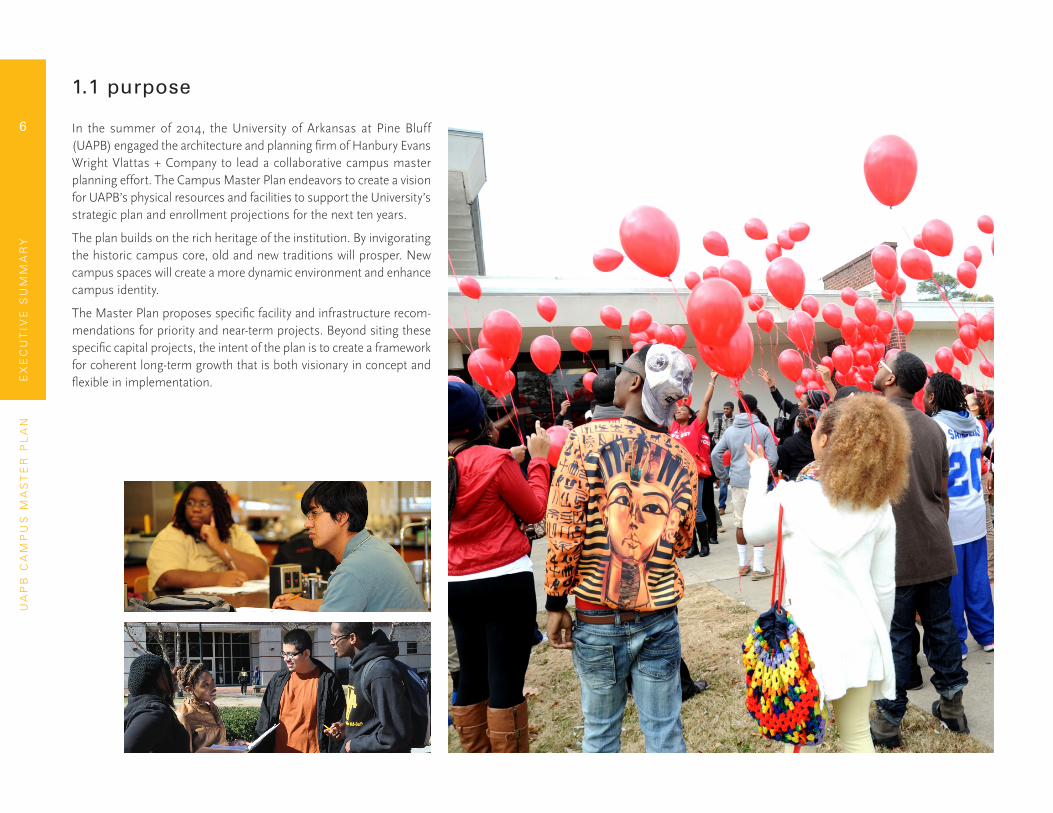
1.1 purpose
In the summer of 2014, the University of Arkansas at Pine Bluff (UAPB) engaged the architecture and planning firm of Hanbury Evans Wright Vlattas + Company to lead a collaborative campus master planning effort. The Campus Master Plan endeavors to create a vision for UAPB’s physical resources and facilities to support the University’s strategic plan and enrollment projections for the next ten years.
The plan builds on the rich heritage of the institution. By invigorating the historic campus core, old and new traditions will prosper. New campus spaces will create a more dynamic environment and enhance campus identity.
The Master Plan proposes specific facility and infrastructure recom-mendations for priority and near-term projects. Beyond siting these specific capital projects, the intent of the plan is to create a framework for coherent long-term growth that is both visionary in concept and flexible in implementation.
UA
PB
CA
MP
US
MA
ST
ER
PL
AN
EX
EC
UT
IVE
SU
MM
AR
Y
6

Figure 1.2-1, Growing the Pride - 2015-2020 Strategic Plan Priorities
The 2015 University of Arkansas at Pine Bluff Campus Master Plan supports the University’s Growing the Pride: 2015-2020 Strategic Plan and responds to Chancellor Alexander’s commitment made in the document:
The strength of UAPB lies in our ability to adjust and adapt to changing needs and demands. As such, we are committed to being more student-focused and more responsive to change with the goal of increasing student success and the removal of impediments to student retention, progression, and timely graduation. This plan is our commitment to become the University of choice by optimizing resources and providing an environment in which students can study, learn, and develop through their interaction with fellow students, faculty, staff, administrators, and community leaders.”
- Excerpt from Growing the Pride: 2015-2020 Strategic Plan
The physical plan will address all five of the Strategic Plan Priorities as listed on this page. It will provide recommendations that will affect academic excellence and student success. It will contribute to greater effectiveness and efficiency of University operations. It will represent future projects to help attract revenue and resources. It will also play a role in enhancing UAPB’s visibility and identity.
The primary function of the Campus Master Plan responds to Priority 3: Modernize and Upgrade University Infrastructure and Facilities. The plan recommends strategies for updating and expanding infrastructure systems to better serve the University into the future. It recommends land use strategies, building re-use opportunities and new facility locations that strengthen the overall campus framework. It also creates new places, spaces and connections that help to invigorate the living/learning environment.
“1.2 alignment with UAPB’s strategic plan
12
34
5
UA
PB
CA
MP
US
MA
ST
ER
PL
AN
EX
EC
UT
IVE
SU
MM
AR
Y
7
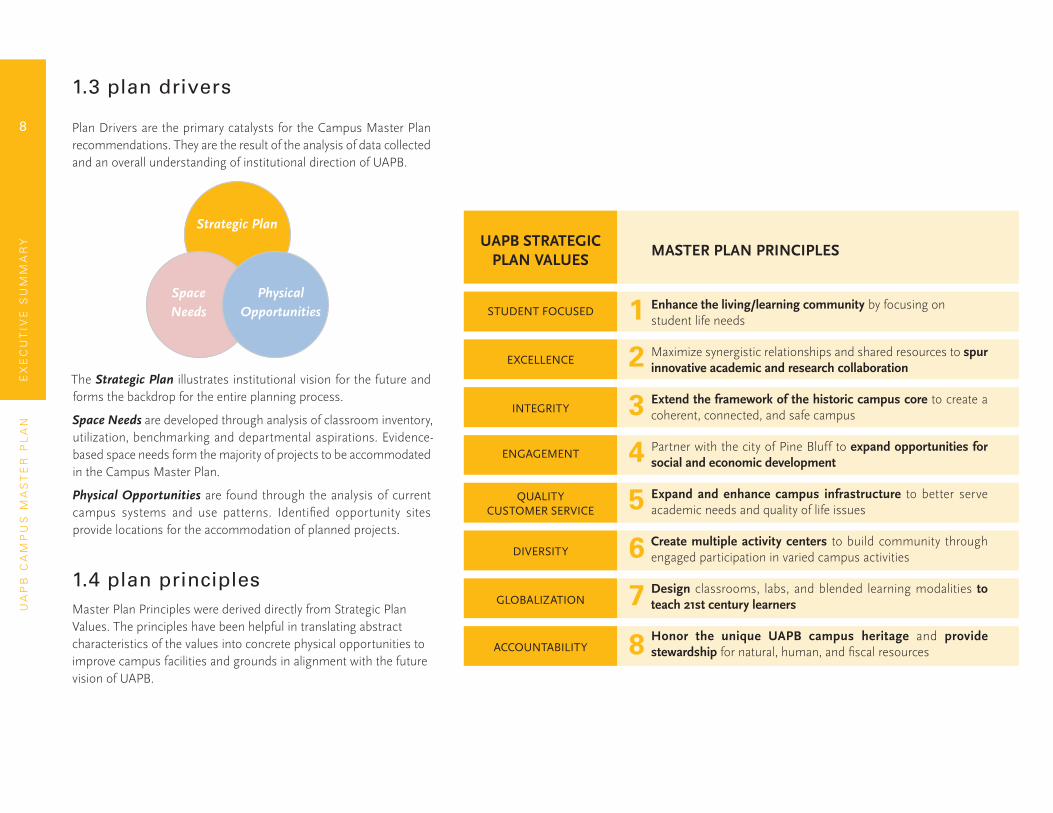
1.3 plan drivers
1.4 plan principles
MASTER PLAN PRINCIPLESUAPB STRATEGIC
PLAN VALUES
Enhance the living/learning community by focusing on student life needs
Maximize synergistic relationships and shared resources to spur innovative academic and research collaboration
Extend the framework of the historic campus core to create a coherent, connected, and safe campus
Partner with the city of Pine Bluff to expand opportunities for social and economic development
Expand and enhance campus infrastructure to better serve academic needs and quality of life issues
Create multiple activity centers to build community through engaged participation in varied campus activities
Design classrooms, labs, and blended learning modalities to teach 21st century learners
Honor the unique UAPB campus heritage and provide stewardship for natural, human, and fiscal resources
STUDENT FOCUSED
EXCELLENCE
INTEGRITY
ENGAGEMENT
QUALITY CUSTOMER SERVICE
DIVERSITY
GLOBALIZATION
ACCOUNTABILITY
Plan Drivers are the primary catalysts for the Campus Master Plan recommendations. They are the result of the analysis of data collected and an overall understanding of institutional direction of UAPB.
Space Needs
Physical Opportunities
Strategic Plan
The Strategic Plan illustrates institutional vision for the future and forms the backdrop for the entire planning process.
Space Needs are developed through analysis of classroom inventory, utilization, benchmarking and departmental aspirations. Evidence-based space needs form the majority of projects to be accommodated in the Campus Master Plan.
Physical Opportunities are found through the analysis of current campus systems and use patterns. Identified opportunity sites provide locations for the accommodation of planned projects.
Master Plan Principles were derived directly from Strategic Plan Values. The principles have been helpful in translating abstract characteristics of the values into concrete physical opportunities to improve campus facilities and grounds in alignment with the future vision of UAPB.
1
2
3
4
5
6
7
8
UA
PB
CA
MP
US
MA
ST
ER
PL
AN
EX
EC
UT
IVE
SU
MM
AR
Y
8

As part of the Master Plan, the planning team assessed the facilities needs by providing a detailed Space Utilization and Needs Analysis. In order to undertake the space needs analysis, the University provided data on enrollment, courses, staffing, and facilities. The space needs analysis assists in determining the magnitude of space needed for the current level of campus enrollment and activity. The analysis also includes a projection of space needs for the future planning horizon. To calculate the space needs, the consultant applied the space guidelines commonly used in the space analysis industry. These guidelines were adapted and augmented as appropriate dur-ing the analysis. Where guidelines did not exist for categories such as the non-Educational and General spaces, the consultant applied commonly used standards.
Current Space Needs Analysis The space needs analysis calculated the space requirements looking at the findings both for the campus as a whole and at a school level for each of the academic schools and major administrative divisions. Results of the campus-wide space needs analysis generated a space need of 17,000 ASF (assignable square feet) using data from the Fall 2013, with an enrollment of 2,615 students.
The space category with the greatest space need at the current time is Residential Facilities space. The Research & Service and Athletics and Recreation categories also show a significant need for addi-tional space, as does the Library category. Categories of space that are shown to have sufficient space include Classrooms and Class Laboratories.
Projected Space Needs Analysis Using projections into the future, the space need increases to nearly 244,000 ASF when enrollment reaches 4,000 students. Over 109,000 ASF of the calculated future year space need is in the Residential Facilities category. The Research & Service, Athletics and Study & Library space categories show significant need for additional space in the future, (Figure 1.5-2). The Student Center space also shows a projected future need.
1.5 enrollment projections and space needs analysis
PROJECTED SPACE NEEDS ANALYSIS, Figure 1.5-2
Calculated Current Space ASF PercentSpace Use Category ASF Requirement Difference Difference Classrooms & Service 66,884 51,010 15,874 24% Class Laboratories & Service 66,515 64,628 1,887 3% Open Laboratories & Service 24,254 28,600 (4,346) (18%) Research & Service 43,537 103,090 (59,553) (137%) Office & Service 168,306 148,945 19,361 12% Study/Library 36,858 63,860 (27,002) (73%) Physical Education 57,316 46,722 10,594 18% Recreation 17,237 46,000 (28,763) (167%) Athletics 65,914 100,000 (34,086) (52%) Special Use 36,447 54,500 (18,053) (50%) Assembly & Exhibit 28,836 21,000 7,836 27% Student Center 35,609 44,000 (8,391) (24%) General Use 20,805 33,800 (12,995) (62%) Support 43,075 40,740 2,335 5% Residential Facilities 231,791 341,260 (109,469) (47%) Health Care 5,005 4,000 1,005 20%TOTAL 948,389 1,192,155 (243,766) (26%)
CURRENT SPACE NEEDS ANALYSIS, Figure 1.5-1
Calculated Current Space ASF PercentSpace Use Category ASF Requirement Difference Difference Classrooms & Service 66,884 33,325 33,559 50% Class Laboratories & Service 66,515 45,565 20,950 31% Open Laboratories & Service 24,254 19,570 4,684 19% Research & Service 43,537 70,850 (27,313) (63%) Office & Service 168,306 122,700 45,606 27% Study/Library 36,858 47,555 (10,697) (29%) Physical Education 57,316 35,442 21,874 38% Recreation 17,237 35,300 (18,063) (105%) Athletics 65,914 100,000 (34,086) (52%) Special Use 36,447 36,430 17 0% Assembly & Exhibit 28,836 21,000 7,836 27% Student Center 35,609 28,765 6,844 19% General Use 20,805 24,175 (3,370) (16%) Support 43,075 40,740 2,335 5% Residential Facilities 231,791 301,260 (69,469) (30%) Health Care 5,005 2,615 2,390 48%TOTAL 948,389 965,292 (16,903) (2%)
UA
PB
CA
MP
US
MA
ST
ER
PL
AN
EX
EC
UT
IVE
SU
MM
AR
Y
9

Space Needs Analysis Meeting
The planning team used the data and information provided to document the utilization of classrooms and class laboratories. The data was used to analyze the space needed on campus at the current time and at a projected enrollment level for the future.
Classroom UtilizationIn the Fall 2013, the 57 classrooms analyzed for the campus averaged 18 hours of scheduled use per week, with 56 percent of the student stations filled when classrooms were in use. The classrooms average 23 assignable square feet (ASF) per student station. The average for weekly seat hours of use was 10.1 hours.
Analysis and Projections The consultant would expect to see the average weekly room hours to be in the range of 30 to 35 hours per week. The expectation for weekly seat hours is around 20 to 24. A common expected average for the percentage of seats filled is 65 to 70 percent. The consultant finds the average size of the student stations in classrooms on many campuses to be around 20 to 25 ASF.
The average room hours per week of scheduled use for the Fall term 2013 at UAPB is below the range that the consultant would expect to see, as are the weekly seat hours. The classroom student station occupancy is also below what might be expected. The space per student station average is within the expected range.
When the utilization findings were summarized by building, the classrooms located in Dawson-Hicks Hall showed the highest average hours per week of scheduled use. The ten classrooms in Dawson-Hicks averaged 31 hours per week of use. At the low end of utilization findings are the three classrooms in Hazzard Gym, which averaged only four hours per week of utilization.
When the utilization findings are summarized by school, the classrooms assigned to the School of Business and Management showed the highest average hours per week of scheduled use. The 10 class-rooms averaged 24 hours per week of use. At the lower end classrooms assigned to Military Science averaged four hours per week of use.
Classroom utilization findings compiled by classroom capacity showed the three classrooms in the group with 120 to 230 student stations averaged 28 weekly room hours of use. The classrooms with capacities of 40 and 45 to 58 student stations averaged the lowest weekly room hours (WRH) of use at 13 hours per week.
Review of classroom use by day and time of day showed the classrooms on campus were most heavily used on Monday and Wednesday mornings when 68 percent of classrooms were in use.
Class Laboratory Utilization The 43 class laboratories analyzed averaged 11 weekly room hours of use. When laboratories were in use, the student station occupancy averaged 63 percent. The consultant would expect to see the average for weekly room hours to be 20 to 24 hours per week of scheduled use with 70 percent to 80 percent of the student stations filled. The expectation for average seat hours is 14 to 20 weekly seat hours. The average room hours per week of scheduled use of class laboratories, the average percentage of student station occupancy, and the average weekly seat hours are all below the range that the consultant would expect to see.
CLASS LABORATORY UTILIZATION SUMMARY, Figure 1.5-4
UAPB Industry Utilization Expectation
Average Weekly Seat Hours 6.8 24
Average Weekly Room Hours 11 18
Average Student Station Occupancy 63 % 75 %
Average Space per Student Station 44
Number of Teaching Labs 43
UA
PB
CA
MP
US
MA
ST
ER
PL
AN
EX
EC
UT
IVE
SU
MM
AR
Y
10
CLASSROOM UTILIZATION SUMMARY, Figure 1.5-3
UAPB Industry Utilization Expectation
Average Weekly Seat Hours 10.1 24
Average Weekly Room Hours 18 35
Average Student Station Occupancy 56 % 65 %
Average Space per Student Station 23
Number of Classrooms 57

1.6 master plan vision
CAMPUS ANALYSISThe third “driver” of the Master Plan is the physical campus itself; its existing history, growth patterns, constraints and opportunities. After considerable analysis, the planning team outlined long-range land use and circulation strategies as a framework to accommodate future growth. Land use options compliment regional, city and neighbor-hood planning initiatives.
The recommended land use scheme builds on existing patterns to create and enhance identifiable campus districts. Most importantly, the academic district remains compact and easily navigable for pedestrians.
Figure 1.6-1, Existing Land Use Figure 1.6-2, Preferred Concept Land Use
800’
400’
ACADEMIC
RESEARCH
ACADEMIC/RESEARCH MIX
HOUSING
ATHLETIC/RECREATION
ADMINISTRATIVE
STUDENT SUPPORT
CAMPUS GATEWAY
MIXED-USE/RESEARCH MIX
CIVIC/GREEN WAY
SUPPORT
UA
PB
CA
MP
US
MA
ST
ER
PL
AN
EX
EC
UT
IVE
SU
MM
AR
Y
11

A Master Plan Program was established from the Space Needs Analysis, interviews with administration and academic department heads, and on-campus workshops. Priority projects reflect the Master Plan Principles especially to enhance the living/learning community and to spur innovative academic and research collaboration.
Figure 1.7-1, Long Term Vision Plan
NEW CONSTRUCTION
RENOVATION
EXISTING
FUTURE BUILDOUT
A
A
B
B
C
D
D
E
E
F
F
C
G
K
H
L
I
M
J
N
K
QL
P
MO
N
R
O
I
P
T
Q
G
R
S
J
T
U
U
U
H
S
800’
400’
Residence Halls
Student Center
Wellness Center
Nanoscience + Biotechnology
Track + Field / Soccer Facility
Public Safety / Welcome Center
Larrison Renovation
Kountz-Kyle Renovation
Harrold Complex Renovation
Adair Renovation
Biomedical / Life Sciences
Relocated Facilities
“One Stop Shop” – Student Services
Student Success
Basketball / Convocation Center
Conference Center
Hotel
Aquaculture / Fisheries
Expanded Library – Info Commons
Football Practice
Future Mixed-Use Development
LON
G-T
ER
MN
EA
R-T
ER
MP
RIO
RIT
Y
PROJECT RECOMMENDATIONS
University Park
Uni
vers
ity
Dr.
Oliver Rd.
LA P
rexy
Dav
is
McFadden Road
1.7 Long Term Vision Plan
UA
PB
CA
MP
US
MA
ST
ER
PL
AN
EX
EC
UT
IVE
SU
MM
AR
Y
12

Figure 1.7-2, Campus Districts
NORTH CAMPUS
RESIDENTIALVILLAGE
CAMPUSCORE
UNIVERSITYDRIVE
The Master Plan program on the previous page is described within this document with regard to priority and implementation phase. Projects have also been carefully sited to reinforce existing campus districts.
Through campus infill growth, the identity and life of each district will become stronger by siting more like elements. Where district overlap occurs, the opportunities for synergistic, collaborative, interdisciplinary and mixed-use projects are greatest. These types of projects will act as connectors between districts by bringing diverse groups together. The one-stop shop student services center shown at the overlap of the residential village and the campus core will be a convenient stop along the way for students from residence hall to classroom. The new research buildings and convocation and conference center on University Drive will bring together academics, researchers and the community in economic development for the City of Pine Bluff and the region.
Each district also has a central space to strengthen its sense of place. The main quad at the campus core is the symbolic center of the University, and with the addition of the new student center on the north side of the quad, it will become the center of activity on campus as well.
The student recreation field and basketball courts are the central space for the residential village. This outdoor space will create a new gathering space to build community among campus residents. Greater engagement with peers in known to enhance student success.
On the north side, beside the fields of the athletic venues, the park-ing lot between Golden Lion Stadium and the new soccer and track facility will be the center of activity. It will host tailgates, festivals and other athletics related events.
The University Drive district has two centers: one at the newly created ceremonial campus gateway east of Caldwell Hall and amphitheater across the street. This area could be home to large campus and city events. The other center is the newly created mixed-use “college town” that connects the academic core to athletics. Graduate and upper level student apartments, retail outlets, restaurants and incu-bator space will transform campus and community into a dynamic innovation zone.
UA
PB
CA
MP
US
MA
ST
ER
PL
AN
EX
EC
UT
IVE
SU
MM
AR
Y
13

Figure 1.7-3, Rendering of New Student Center in Campus Core
View Depicted in Rendering Above
CAMPUS CORE - STUDENT CENTER
The new Student Center will sit along the north side of the main quad bringing new life to the historic core of campus. Its east side will prominently face University Drive and therefore will also contribute to strengthening campus identity.
The main entry facing the quad is designed as a large covered front porch with ample seating to encourage the campus community to come together and socialize.
New dining spaces along the south side of the building will have outdoor seating that further invigorates the quad. The third level will have an outdoor rooftop terrace reminiscent of the one that was historically active at Davis Student Union. It will have views of the quad and out to Lake Saracen.
Cherry trees will line the north and south edges of the quad bringing spring color to campus as the weather encourages outdoor activities.
UA
PB
CA
MP
US
MA
ST
ER
PL
AN
EX
EC
UT
IVE
SU
MM
AR
Y
14

Figure 1.7-4, Rendering of University Avenue Corridor Looking North
UNIVERSITY DRIVE CORRIDOR
The University Drive corridor from the south is, by a large margin, the primary route to campus. In partnership with the City of Pine Bluff, the University Park neighborhood, and the Arkansas State Highway and Transportation Department, the University is transforming its front door and its public image.
A boulevard concept as it passes through campus, University Drive will be safer for pedestrians to cross with a landscaped center median. Trees, light poles and banners will line each side of the street to an-nounce the neighborhood and entry into campus. New sidewalks will encourage pedestrians and bikers to walk along the street.
A new ceremonial gateway to access Caldwell Hall includes a paved centerpiece in University Drive designed to both signify an important entry and to slow traffic through this zone. New monumental signage, lion statues, flagpoles and landscaping will create a more civically scaled campus gateway.
An amphitheater, convocation center, new research buildings and mixed-use buildings lining University Drive will bring new energy to this part of town that will benefit the community beyond UAPB.
These projects will symbolize the forward-thinking optimistic outlook of the University and spur economic development in this community.
View Depicted in Rendering Above
UA
PB
CA
MP
US
MA
ST
ER
PL
AN
EX
EC
UT
IVE
SU
MM
AR
Y
15
Recommended