CALIBRATION AND INTRALABORATORY QUALITY ASSESSMENT IN PULP AND PAPER & ALLIED INDUSTRIES
(CESS/IPMA PROJECTS)
SPONSORED BY
INDIAN PAPER MANUFACTURERS ASSOCIATION (IPMA)
CENTRAL PULP & PAPER RESEARCH INSTITUTE SAHARANPUR 247 001 (UP) INDIA
DECEMBER 2004

CALIBRATION AND INTRALABORATORY QUALITY ASSESSMENT IN PULP AND PAPER & ALLIED INDUSTRIES INDUSTRIES
(CESS/IPMA PROJECT)
Based on the work of
Dr. Y. V. Sood, P. C. Pande, Nisha, Renu Tyagi, R. Neethikumar
Under technical guidance of
Dr. A. G. Kulkarni
Director
Sponsored By
INDIAN PAPER MANUFACTURERS ASSOCIATION (IPMA)
CENTRAL PULP & PAPER RESEARCH INSTITUTE SAHARANPUR 247 001 (UP) INDIA
DECEMBER 2004

ACKNOWLEDGEMENT
The management of Central Pulp and Paper Research Institute is thankful to
M/S The West Coast Paper Mills Ltd., Dandeli (Karnataka), M/s Hindustan Paper
Corporation Ltd., Kagajnagar (Assam) and M/s J/K.Paper Ltd., Raigad (Orissa),
M/s Seshasayee Paper and Boards Ltd., Erode (TN) for supplying the desired
paper reel samples used for this project.
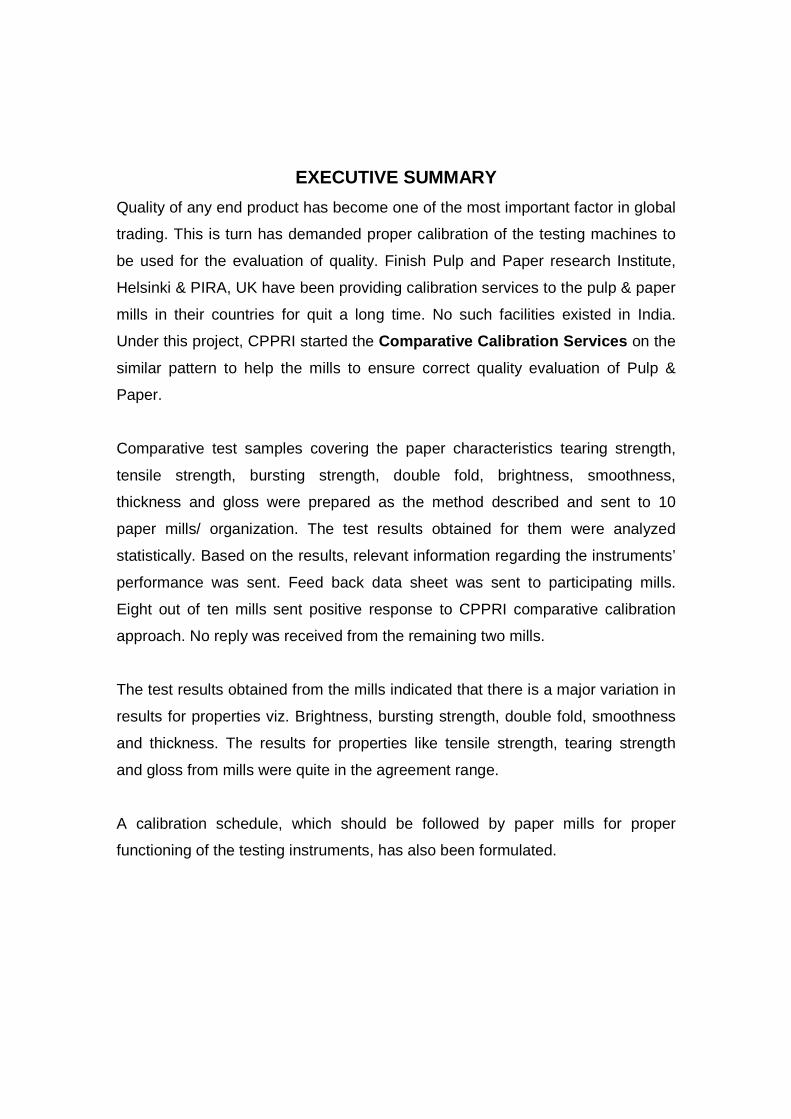
EXECUTIVE SUMMARY
Quality of any end product has become one of the most important factor in global
trading. This is turn has demanded proper calibration of the testing machines to
be used for the evaluation of quality. Finish Pulp and Paper research Institute,
Helsinki & PIRA, UK have been providing calibration services to the pulp & paper
mills in their countries for quit a long time. No such facilities existed in India.
Under this project, CPPRI started the Comparative Calibration Services on the
similar pattern to help the mills to ensure correct quality evaluation of Pulp &
Paper.
Comparative test samples covering the paper characteristics tearing strength,
tensile strength, bursting strength, double fold, brightness, smoothness,
thickness and gloss were prepared as the method described and sent to 10
paper mills/ organization. The test results obtained for them were analyzed
statistically. Based on the results, relevant information regarding the instruments’
performance was sent. Feed back data sheet was sent to participating mills.
Eight out of ten mills sent positive response to CPPRI comparative calibration
approach. No reply was received from the remaining two mills.
The test results obtained from the mills indicated that there is a major variation in
results for properties viz. Brightness, bursting strength, double fold, smoothness
and thickness. The results for properties like tensile strength, tearing strength
and gloss from mills were quite in the agreement range.
A calibration schedule, which should be followed by paper mills for proper
functioning of the testing instruments, has also been formulated.

TABLE OF CONTENTS
Contents P. No.
1. Introduction 1
2. Technical Approach 2
3. Preparation of Paper Samples 3
4. Effect of Moisture on Paper Characteristics 7
5. Calibration and Objective of Paper Testing 9
5.1 Accuracy of Different Tests 13
5.2 Uncertainty, Repeatability & Reproducibility 15
6. Mills/Organizations Selected for Participation
7. Properties Covered in this Service 17
8. Test Results Obtained & Observations 17
8.1 Brightness Measurement 22
8.2 Bursting Strength 23
8.3 Double Fold 23
8.4 Bendtsen Smoothness 23
8.5 Thickness 23
8.6 The Remaining Properties 24
9. Feedback from Participating Mills 24
10. Recommended Calibration Schedule for Paper Testing Instruments
25
11. Conclusions 27
12. References 28
13. Annexure I 29
14. Annexure II 30
15. Annexure III 46

This Equipment is Capable of Storing and This Equipment is Capable of Storing and This Equipment is Capable of Storing and This Equipment is Capable of Storing and Statistically Analyzing the Testing Data for Statistically Analyzing the Testing Data for Statistically Analyzing the Testing Data for Statistically Analyzing the Testing Data for Ten Different Paper CharacteristicsTen Different Paper CharacteristicsTen Different Paper CharacteristicsTen Different Paper Characteristics. Other Instruments Other Instruments Other Instruments Other Instruments Programmable Tear Tester, Programmable Tear Tester, Programmable Tear Tester, Programmable Tear Tester, Digital Micrometer, MultiDigital Micrometer, MultiDigital Micrometer, MultiDigital Micrometer, Multi----directional Gloss directional Gloss directional Gloss directional Gloss Tester, Auto type GurleyTester, Auto type GurleyTester, Auto type GurleyTester, Auto type Gurley SPS Tester.SPS Tester.SPS Tester.SPS Tester.
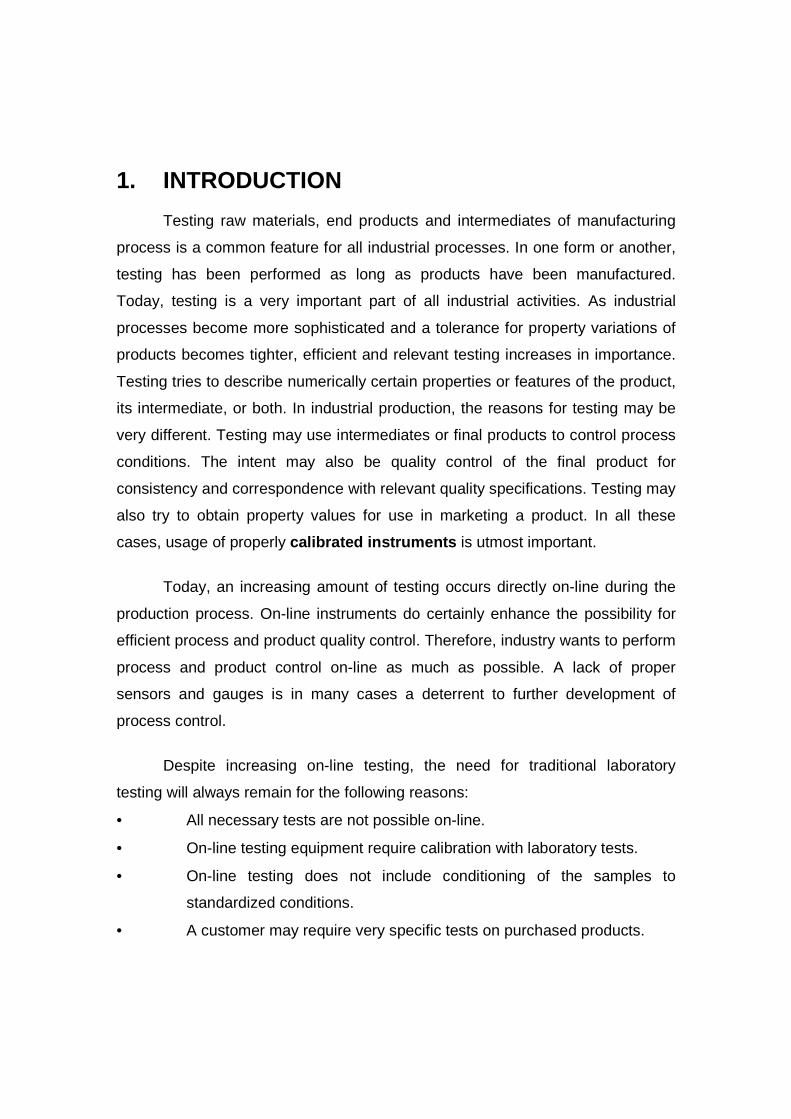
1. INTRODUCTION
Testing raw materials, end products and intermediates of manufacturing
process is a common feature for all industrial processes. In one form or another,
testing has been performed as long as products have been manufactured.
Today, testing is a very important part of all industrial activities. As industrial
processes become more sophisticated and a tolerance for property variations of
products becomes tighter, efficient and relevant testing increases in importance.
Testing tries to describe numerically certain properties or features of the product,
its intermediate, or both. In industrial production, the reasons for testing may be
very different. Testing may use intermediates or final products to control process
conditions. The intent may also be quality control of the final product for
consistency and correspondence with relevant quality specifications. Testing may
also try to obtain property values for use in marketing a product. In all these
cases, usage of properly calibrated instruments is utmost important.
Today, an increasing amount of testing occurs directly on-line during the
production process. On-line instruments do certainly enhance the possibility for
efficient process and product quality control. Therefore, industry wants to perform
process and product control on-line as much as possible. A lack of proper
sensors and gauges is in many cases a deterrent to further development of
process control.
Despite increasing on-line testing, the need for traditional laboratory
testing will always remain for the following reasons:
• All necessary tests are not possible on-line.
• On-line testing equipment require calibration with laboratory tests.
• On-line testing does not include conditioning of the samples to
standardized conditions.
• A customer may require very specific tests on purchased products.

To ensure the correct testing and functioning of the instruments it is
utmost important that these are calibrated according to standard methods. The
instruments not properly calibrated are liable to affect the proper quality
assessment of end product.
Quality of any end product has become one of the most important factors
in global trading. Evaluation of quality is closely linked with proper calibration of
the testing machines. Finish Pulp & Paper Research Institute, Helsinki & PIRA
UK etc have been providing calibration service to the pulp & paper mills in their
countries for quite a long time. This helps the mills to ensure correct quality
evaluation of pulp, paper & chemicals etc. It generates a confidence among the
users. In India many of the pulp & paper mills have very old and obsolete testing
machines. Ensuring the accurate performance these machines need regular
calibration and performance check. The Comparative Calibration Services are
required to help the pulp & paper mills to check the performance of testing
machines so that the desired quality parameters of the raw material and end
products are ensured. In the comparative calibration service calibration is not
done at the site however standard samples are supplied to the clients. This is the
practice being followed by Finnish Pulp & Paper Research Institute, Finland and
PIRA, U.K.
2. Technical Approach The following steps were adopted for comparative calibration services.
• Sophisticated imported instruments like programmable micrometer,
digital tear tester, gloss tester, Auto work station etc having facilities
of evaluating the results statistically were procured, installed and a
regular calibration schedule by CPPRI scientists and an outside
agency M/s Elof Hanson. New Delhi was followed. The existing
instruments in CPPRI paper testing laboratory were also calibrated
as per relevant ISO standard. The different grades of paper having
good formation in reels were procured from different mills and were

subjected to seasoning (conditioning under controlled atmosphere)
prior to be used as standard sample.
• The samples were evaluated for different characteristics using calibrated instruments.
• Standard comparative samples were prepared and sent to the mills for evaluation.
• The result received from mills were evaluated and mills was informed about the
� Action Limit � Performance of the equipment
3. Preparation of Paper Samples Paper is not homogenous material. In paper testing, the measurement is
often repeated several times to determine an average result that describes the
level of the property better than single measurement. A statistical distribution
always relates to the test result. The size and type of distribution depend not only
on the homogeneity of the material and the number of repetitions of the test but
also on other factors such as equipment and operator. For the preparation of
comparative paper samples, the paper samples selected were those which fell
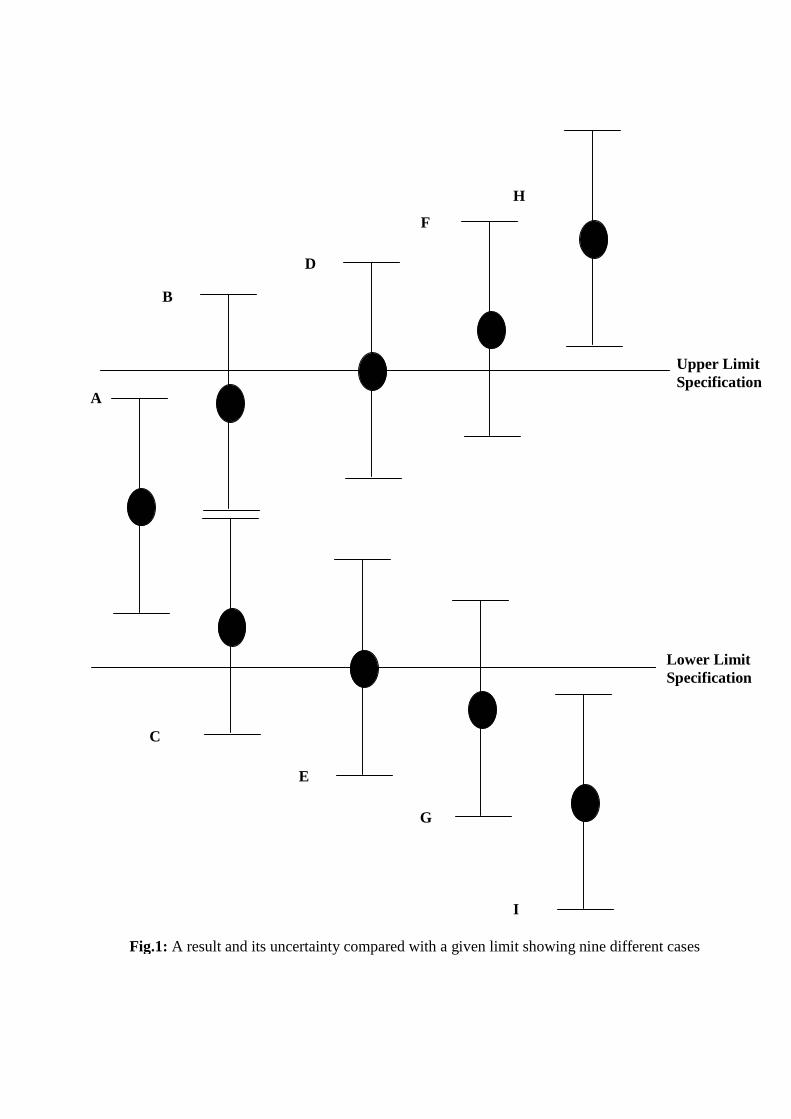
into Cases A, B, & C of Fig. 1 .
Case A:
The result and its uncertainty are both within the limits. Case B and C:
The result is within the limit but a small part of the uncertainty is outside
the limit. The result indicates that compliance is more probable than non-
compliance.
Case D and E: The result is on the limit itself and half the uncertainty is within the limit
and the other half outside the limit. The result indicates that compliance is as
probable as non-compliance.
Case F and G:
The result is outside the limit but a small part of uncertainty is within the
limit. The result indicates that non-compliance is more probable than compliance.

Case H and I:
Both the result and the uncertainty are outside the limit. The product
therefore does not comply with the specification.
Upper Limit Specification
A
B
D
F
H
C
E
G
I
Lower Limit Specification
Fig.1: A result and its uncertainty compared with a given limit showing nine different cases

The care was taken to avoid the hystersis effect in paper samples. The
strength properties of paper are dependent on ambient temperature and relative
humidity. More precisely it is the actual moisture content in the paper, regardless
of how it has obtained, which affects the strength. For the test material to attain a
stable equilibrium moisture content in a standardized atmosphere, the test piece
must be conditioned for a sufficiently long period of time. It is also important that
the conditioning to standard atmosphere always take place by starting from lower
humidity (about 30%) so called pre conditioning, in order to attain a reproducible
equilibrium moisture content (Fig. 3). This is because of the so called moisture
hystersis effect on the fibre material. Difference more than 2% can be obtained
because of the moisture hystersis effect (Fig. 2).

Hystersis Effect Nullified on Preconditioning
0
5
10
15
20
25
30
0 20 40 60 80 100 120
Relative Humidity (%)
Moi
stur
e (%
) DesorptionAbsorptionPreconditioning
Hystersis Effect on Moisture Content
0
5
10
15
20
25
30
0 20 40 60 80 100 120
Relative Humidity (%)
Moi
stur
e (%
)
Desorption
Absorption
Fig. 2: Hystersis Effect on Moisture Content
Fig. 3: Hystersis Effect nullified on Preconditioning

Internationally it has been recommended that the correct equilibrium moisture
content is that which is obtained on absorption. (Fig. 3).
4. Effect of Moisture on the Paper Characteristics The effect of moisture on different paper characteristics is shown in Fig. 4.
The tensile strength increases slightly to a maximum at 30-35% relative
humidity and then decreases quite rapidly at higher relative humidities. This
decrease can be attributed to a weakening of fiber-to-fiber bonding.
Tearing resistance increases over the entire range of relative humidity.
However, it is obvious that at some point above 80% the curve will fall off rapidly,
due to the disruption of interfiber bonding. The paper becomes more stretchable
and plastic with increasing moisture content. It is believed that this enables paper
to distribute tearing stresses over a large area, thereby increasing the amount of
stress absorbed before failure occurs. On the other hand, it is thought that the
rigidity and low stretch characteristic of dry paper localizes tearing stresses,
resulting in a low tearing strength.
Fig. 4: General Trend of Changes in Paper Properties with Relative Humidity
20 30 40 50 60 70 80
Relative Humidity (%)
Cha
nge
in P
rope
rty
FoldStiffnessTearTensileBurst

Stiffness continuously decreases with increasing moisture content. This is
primarily a result of increased fiber flexibility. Softness, which is inversely related
to stiffness, increases substantially with increased moisture content.
Consequently, in papers that require softness, additives are sometimes
employed that encourage high moisture content.
The bursting strength curve shows a broad maximum between 30% and
60% relative humidity. This can be interpreted in the following way.
Bursting strength is thought to be primarily a function of tensile strength
and stretch. From 20−35% relative humidity, both tensile and stretch increase,
producing an increasing burst; from 35−50% relative humidity, stretch continues
to increase and tensile falls off at an increasing rate, but stretch continues to
dominate and burst continues to rise although at a decreasing rate. Finally,
above 55% relative humidity, the decrease in tensile strength is greater than the
increase in stretch, and bursting strength decreases continuously.
Folding endurance is strongly influenced by moisture content, also,
increasing markedly up to 50−60% relative humidity and then falling off
thereafter. Even though the curve in Figure 4 shown above looks fairly
straightforward, it cannot be analyzed in a complex function involving tension,
compression, the stress-strain properties of the fibers, fiber flexibility, and
probably other factors yet to be discovered.
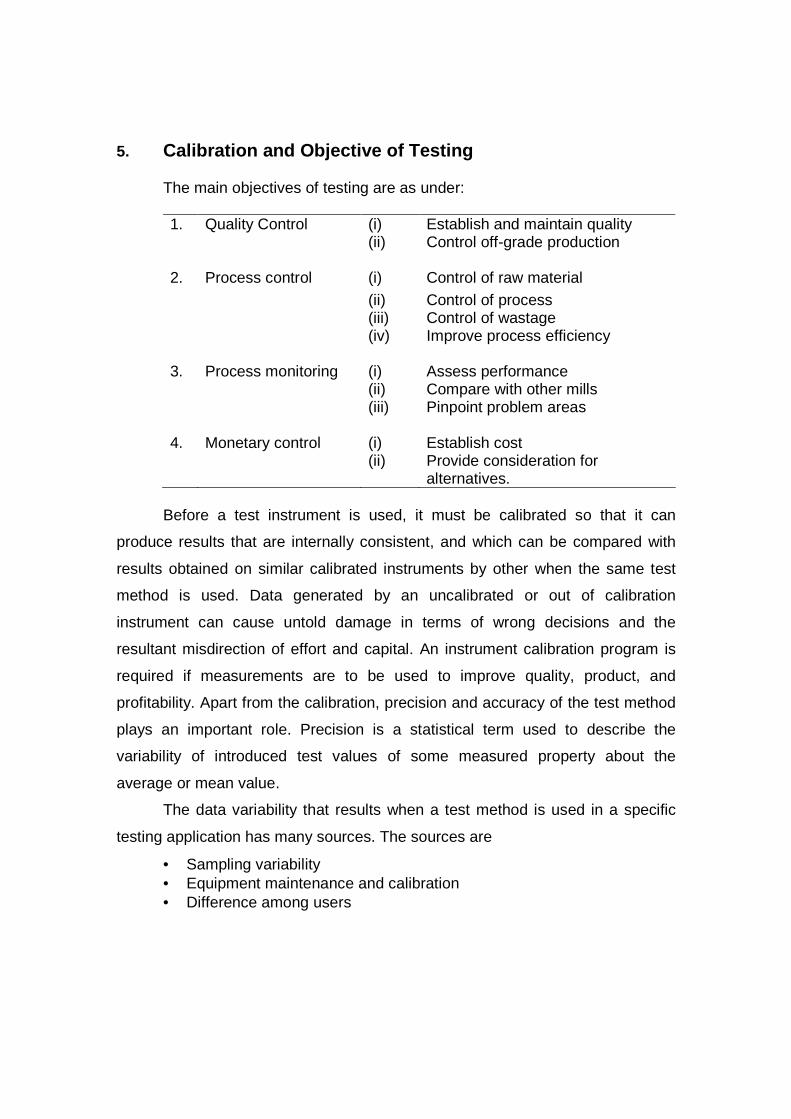
5. Calibration and Objective of Testing The main objectives of testing are as under:
1. Quality Control (i) Establish and maintain quality (ii) Control off-grade production
2. Process control (i) Control of raw material (ii) Control of process (iii) Control of wastage (iv) Improve process efficiency
3. Process monitoring (i) Assess performance (ii) Compare with other mills (iii) Pinpoint problem areas
4. Monetary control (i) Establish cost (ii) Provide consideration for
alternatives.
Before a test instrument is used, it must be calibrated so that it can
produce results that are internally consistent, and which can be compared with
results obtained on similar calibrated instruments by other when the same test
method is used. Data generated by an uncalibrated or out of calibration
instrument can cause untold damage in terms of wrong decisions and the
resultant misdirection of effort and capital. An instrument calibration program is
required if measurements are to be used to improve quality, product, and
profitability. Apart from the calibration, precision and accuracy of the test method
plays an important role. Precision is a statistical term used to describe the
variability of introduced test values of some measured property about the
average or mean value.
The data variability that results when a test method is used in a specific
testing application has many sources. The sources are
• Sampling variability • Equipment maintenance and calibration • Difference among users

Sound decision making requires data of known precision. Decision made
on imprecise data, particularly when the imprecision is unrecognized, can be
costly.
The accuracy of test result is also important. The term accurate is used to
describe the agreement of test results with some “absolute” correct value.
Because of the hygroscopic viscoelastic nature of paper and the products made
from it, there are few paper properties that can be treated as absolutes. Most
properties must be considered in relationship to a specific test method and the
accuracy defined on these terms. For example, because paper is hygroscopic,
the value of basis weight as a function of relative humidity with which the paper is
in equilibrium at the time of basis weight is determined. Unless a “standard
relative humidity” is used for measurement, numerous “basis weight” will result.
Similarly, because paper is viscoelastic, values determined vary. Mechanical
properties such as tensile and bursting strength vary as a function of rate at
which stress is applied to the paper tested, and the equilibrium relative humidity
at which the testing is conducted.
Instrument calibration and maintenance are both key to providing reliable
“accurate” test results.
For technical control of mill operations it is important that tests carried are
sufficiently accurate. A poor test or an improperly made test is sometimes worse
than no test at all. All testing procedures can be characterized by following:
� Their sensitivity (or instrument readability)
� Precision (a measure of the variation that can be expected when
repeated tests are made on the same specimen)
� Accuracy (the difference between the test value and true value)
There is sometimes confusion regarding the distinction between precision
and accuracy; precision is an assessment of test reproducibility, but says nothing
about the relationship of the test value to the true value. For example, if the
instrument is out of calibration and if a non-representative sample is being tested,

the test result in either case may be precise, but probably not accurate. Factors
affecting the precision or the accuracy of a test value are
1. Instrument readability
2. Instrument or test sensitivity
3. Sampling error
4. Procedural differences
5. Instrument calibration
6. Variation in correlation between measured property and desired
property
7. External factors
The precision of any test result can be defined statistically in terms of
standard deviation. It is frequently useful to convert the standard deviation into
percentage of median test value i.e. co-efficient of variation. One way to improve
test precision is to increase the number of test replications. However, greater
replications mean higher cost for some technician testing. The number of
replications specified for some common tests in different standards is listed in
Table I. Strict adherence to the number of replications is desired to get proper
results.
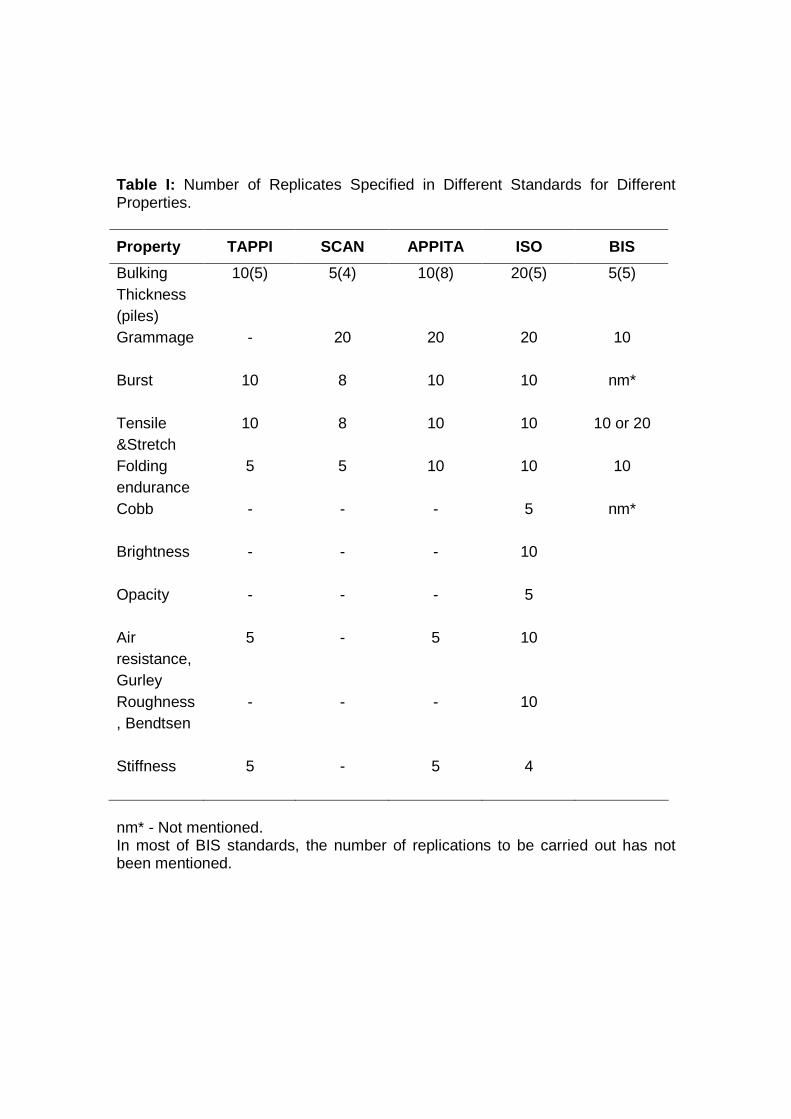
Table I: Number of Replicates Specified in Different Standards for Different Properties.
Property TAPPI SCAN APPITA ISO BIS
Bulking Thickness (piles)
10(5) 5(4) 10(8) 20(5) 5(5)
Grammage - 20 20 20
10
Burst 10 8 10 10
nm*
Tensile &Stretch
10 8 10 10 10 or 20
Folding endurance
5 5 10 10 10
Cobb - - - 5
nm*
Brightness - - - 10
Opacity - - - 5
Air resistance, Gurley
5 - 5 10
Roughness, Bendtsen
- - - 10
Stiffness 5 - 5 4
nm* - Not mentioned. In most of BIS standards, the number of replications to be carried out has not been mentioned.

5.1 Accuracy of Different Tests The variation, which is expected in the determination of different paper properties, is given as under (Table II). Table II: Reproducibility of different paper properties.
Property Repeatability* Comparability** Reproducibi lity*** Co-eff. of variation
Tensile 4.0 - 15 (Ref. 1) 2.6 to 11
(Ref. 10, 11) Bursting Strength
5.4 9.5 14.3 (Ref. 2) 4 to 10 (Ref. 12)
Thickness 1.25 - 5.5 (Ref. 3) 0.1 to 0.5 (Ref. 13)
Double fold
15 34 40 (Ref. 4) -
Tear 1.5 2.5 4.5(Ref. 5) 2 to 9 (Ref. 14)
Stiffness 3 to 5 7 to 12 9-20 (Ref. 6) 2 to 5 (Ref. 5) Cobb - - 10 (Ref. 7) -
Air-resistance
11 - 2 (Ref. 8) -
Opacity 0.64 - 0.77 (Ref. 9) -
*Repeatability – A limit within which agreement may be expected 95% time between two test results obtained under essentially the same conditions and from same homogenous sample of material. ** Comparability – A limit within which agreement may be expected 95% the time between two test results obtained under essentially the same conditions from samples of different materials being compared as to a particular property and having actually the same level of the measured property but differing perhaps markedly in other properties. *** Reproducibility – A limit within which agreement may be expected 95% of the time between two test results obtained in different standard laboratories for the same homogenous sample of material. It clearly indicates that double fold is the most unreliable test. In our paper
testing laboratory, we have observed that generally for most of the paper & board

tests, co-efficient of variation lies between 5% and 10%. Exceptions are
grammage and thickness, which give less; fold & stretch which give more.
In paper testing it is usual way to employ the mean value of a property as
a guide to judge the suitability of the material. Where the standard deviation or
co-efficient of variation result is calculated, this is normally done to determine the
confidence limits of the mean result. Although for some properties such as
substance, roughness and stiffness this data is normally adequate, for other
properties the mean value is in itself of little utility. The test value that is required
is the minimum value of the property that is likely to be encountered in practice.
This is true for instance for tensile strength and pick resistance. Occasionally
very low values of these properties could result in web breaks or the necessity for
frequent wash down on printing presses although the average value of the
relevant properties could be so high that trouble might not be anticipated if mean
alone were considered.
For example, if we have two paper Samples A & B which have mean
tensile strength of 5 kgf and standard deviation of 0.5 kgf and 0.1 kgf (Table III).
Table III : Paper Samples with Same Mean Value but Difference in Standard Deviation.
For A For B
90% of paper will have tensile strength between 4.5 & 5.5 kgf
90% paper will have tensile strength between 3.9 & 4.1 kgf
95% strength between 4.0 and 6.0 kgf.
95% strength between 3.8 and 4.2 kgf.
99.8% strength between 3.5 and 6.5 kgf.
99.8 % strength between 3.7 and 4.3 kgf.
If minimum tensile load desired in converting operation is 3.8 kgf, B will
give more web breaks than A. If minimum tensile load is 3.6 kgf, A will give more
web breaks.

5.2 Uncertainty, Repeatability and Reproducibility Uncertainty of a measurement is a parameter associated with the result of a
measurement that characterized the dispersion of the values reasonably
attributed to the measurand. The measurand is a particular quantity subject to
measurement.
The uncertainty of a result is a comparison of many uncertainty
components. It depends on material tested, sampling, principle of testing method,
instructions for performance, experience and competence of the personnel,
quality of the equipment and testing environment etc. Factors arising from
systematic effects such as components associated with corrections and
reference materials may also contribute to the dispersion.
A measurement result always consists of a value with information about
measurement uncertainty. The quality of the measurement result depends on the
error structure in the measurement process, while quality of the information about
measurement uncertainty is determined by our knowledge about the error
structure. A measurement that is not accompanied by some form of information
about measurement uncertainty in therefore of no use as a measurement result.
The paper industry has lacked guidance as to low measurement uncertainty
should be estimated in physical testing. Measuring correctly is important, but for
us in the paper industry, it is even more important to measure consistently. In
other words, a measurement performed on one occasion should be comparable
to measurement performed on other occasion in the same laboratory as well as
in other laboratories. The standard published SCAN G.6.00 contains all the
relevant information in this regard. A way of controlling measurement uncertainty
is following a regular calibration schedule. The frequency of calibration is
determined by the requirements for measurement quality.
Repeatability of result of measurement is the closeness of agreement
between results of successive measurements using the same material under the
same conditions. This mean the same operator repeats the measurements within

a short period of time without any changes in measurement procedure,
equipment or test conditions. Any variation noted this way describes the
repeatability of the measurement.
Reproducibility of result of measurements is the closeness of the
agreement between the results of measurements using different conditions of
measurements when defining reproducibility, any conditions can change
including the principle of the method. Statements about reproducibility therefore
require a specification of the conditions.
6. Mills/Organization Selected for Participation
The following mills which have well equipped paper testing laboratories
were chosen to try this CPPRI comparative testing calibration service
methodology.
� M/s Ballarpur Industries Ltd. (3 Units)
� M/s Hindustan Paper Corporation Ltd.
� M/s Mysore Paper mills Ltd.
� M/s ITC Bhadrachalam Paper & Boards Ltd.
� M/s Century Pulp & Paper Ltd.
� M/s Seshasayee Paper & Board Ltd.
� M/s J.K. Paper Corporation Ltd.
� M/s The West Coast Paper mills Ltd.
� M/s Star Paper mills Ltd.
� Kumarappa National Handmade Paper Institute
These mills were sent the paper samples and the test results obtained
from these mills were analyzed to check the performance of their instruments.
The findings were conveyed to them for taking appropriate action at their end.

7. Properties Covered in this Service The properties and the relevant standards followed covered under this
service are given in Table IV.
Table IV: Properties and Their Relevant Standard Test Methods.
Property Standard Test method
Tearing Strength ISO 1974:1990
Tensile Strength ISO 1924
Bursting Strength ISO 2758
Double Fold ISO 5626
Brightness ISO 2470
Smoothness ISO 8791-2
Thickness ISO R534
Gloss TAPPI 480-om-99
8. Test Results obtained and Observations The results obtained from the mills were analyzed.
The property was evaluated as per standard method. The action limit was
evaluated using formulae
Action limit: Mean ± 2.0 S.D. The report was sent to the mills in the following
format
Format in which the results were sent to the mills
Your Reference
Our Reference
Property Action Limit Mills’ Results Comments
X A to B A+, B− Results are in the limit
A−, B+ Results are outside the limits and probable cause of variation
The mill took appropriate action to rectify the instrument (e.g. Annexure III).
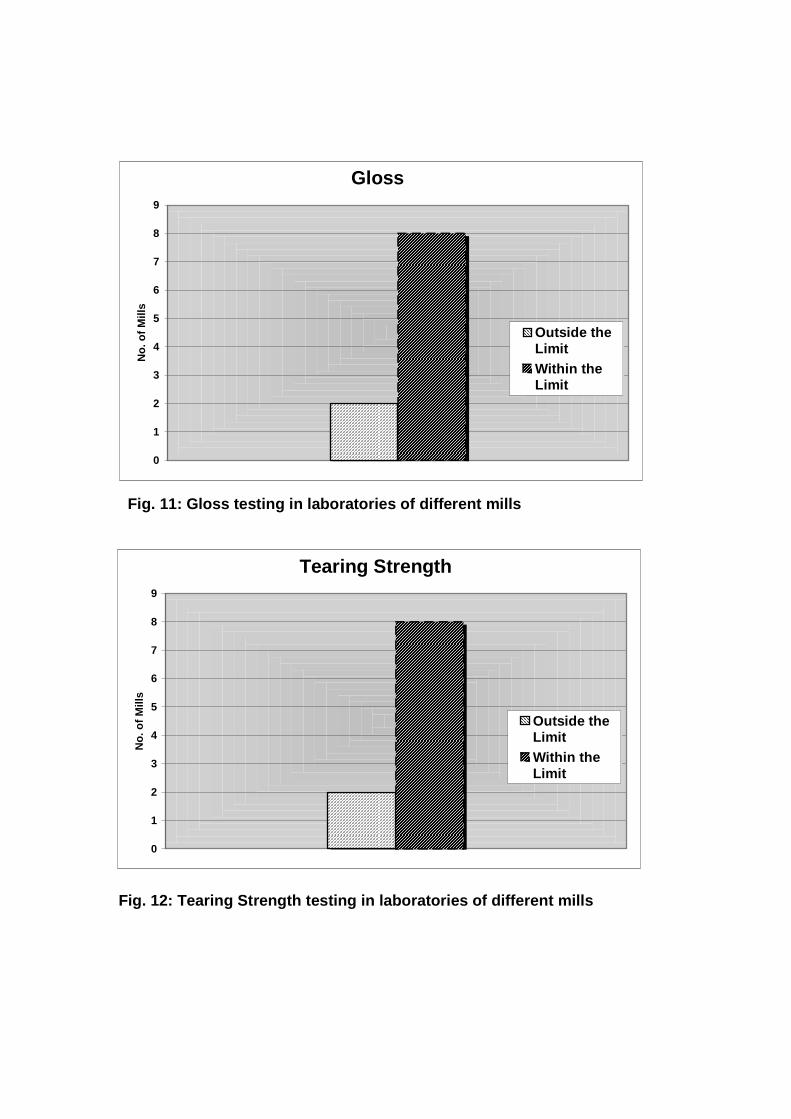
The analysis data obtained for different characteristics is depicted as bar diagram
(Figs. 5−−−−12).

Fig. 5: Tensile Strength testing in laboratories of different mills
Fig. 6: Thickness testing in laboratories of different mills
Fig. 7: Brightness testing in laboratories of different mills
Tensile Strength
0
2
4
6
8
10
12
Within Limits
No
of M
ills
Thickness
0
1
2
3
4
5
6
7
8
No.
of M
ills
Outside theLimit
Within theLimit
Brightness
0
1
2
3
4
5
6
7
No.
of M
ills
Outside theLimit
Within theLimit
Bursting Strength
0
1
2
3
4
5
6
7
No.
of M
ills
Outside theLimit
Within theLimit
Fig. 6: Thickness testing in laboratories of di fferent mills

Fig. 9: Double Fold testing in laboratories of diff erent mills
Fig. 10: Smoothness testing in laboratories o f different mills
Double Fold
0
1
2
3
4
5
6
7
No.
of M
ills
Outside theLimitWithin theLimit
Smoothness
0
1
2
3
4
5
6
7
No.
of M
ills
Outside theLimit
Within theLimit
Gloss
0
1
2
3
4
5
6
7
8
9
No.
of M
ills
Outside theLimitWithin theLimit
Fig. 11: Gloss testing in laboratories of different mills
Tearing Strength
0
1
2
3
4
5
6
7
8
9
No.
of M
ills
Outside theLimitWithin theLimit
Fig. 12: Tearing Strength testing in laboratories o f different mills
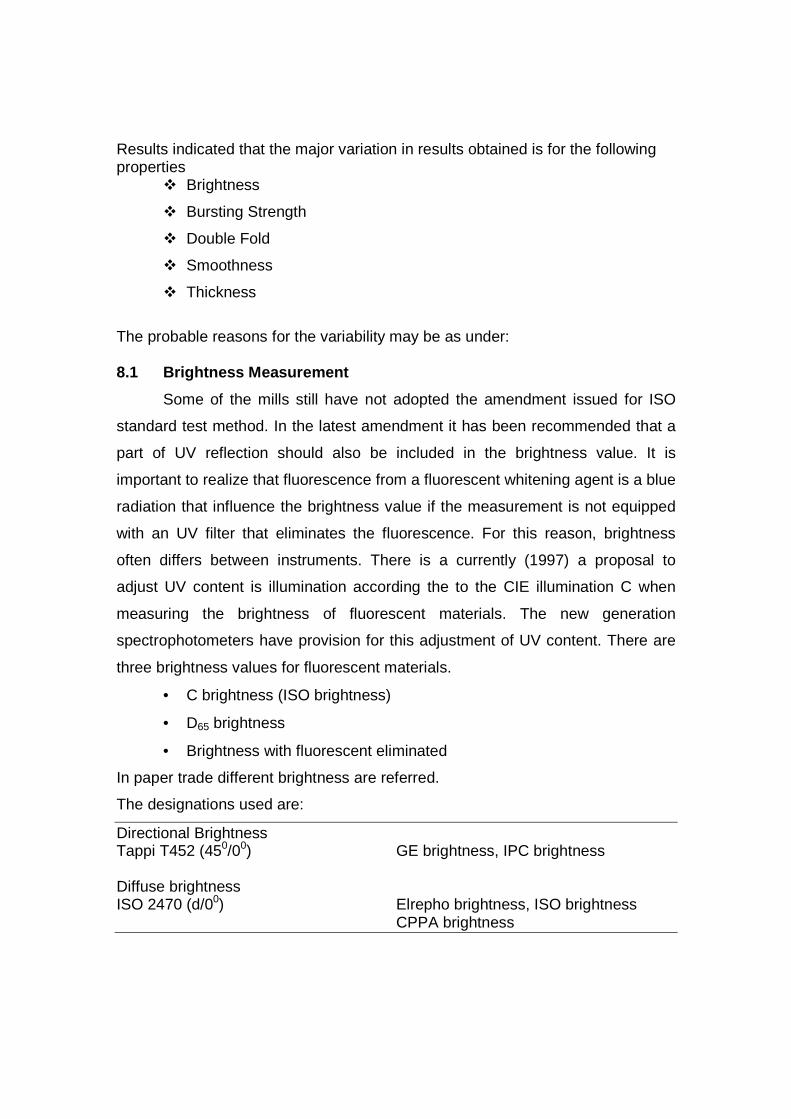
Results indicated that the major variation in results obtained is for the following properties
� Brightness
� Bursting Strength
� Double Fold
� Smoothness
� Thickness
The probable reasons for the variability may be as under: 8.1 Brightness Measurement
Some of the mills still have not adopted the amendment issued for ISO
standard test method. In the latest amendment it has been recommended that a
part of UV reflection should also be included in the brightness value. It is
important to realize that fluorescence from a fluorescent whitening agent is a blue
radiation that influence the brightness value if the measurement is not equipped
with an UV filter that eliminates the fluorescence. For this reason, brightness
often differs between instruments. There is a currently (1997) a proposal to
adjust UV content is illumination according the to the CIE illumination C when
measuring the brightness of fluorescent materials. The new generation
spectrophotometers have provision for this adjustment of UV content. There are
three brightness values for fluorescent materials.
• C brightness (ISO brightness)
• D65 brightness
• Brightness with fluorescent eliminated
In paper trade different brightness are referred.
The designations used are:
Directional Brightness Tappi T452 (450/00) GE brightness, IPC brightness Diffuse brightness ISO 2470 (d/00) Elrepho brightness, ISO brightness CPPA brightness

No direct method of transforming values from the one to the other is possible.
The difference is usually not greater than 2%.
8.2 Bursting Strength
Bursting strength is a complex paper property, which takes into
consideration tensile strength, stretch as well as density of the paper. For this
property the sheet clamping pressure is quite important and the bursting strength
value is dependent on the clamping pressure. The mills are required to take
appropriate action in this regard.
8.3 Double Fold
Double fold is very sensitive paper property. It depends on sheet structure,
atmospheric condition, loading rate and the type of instruments. The mills are
having different type of instrument viz. Kohler Molin, MIT, Schopper type. It is
quite difficult to correlate all these instruments. The variation in this characteristic
is always expected.
8.4 Bendtsen Smoothness
The variability obtained in this parameter is probably due to lack of auto
clamping and damaged measuring head in the instruments. The manual handling
of measuring head is more prone to operator’s skill. The operator personal skill in
putting the measuring head on the paper surface and time taken to read the
reading affects the results.
8.5 Thickness
Thickness is a critical measurement of the uniformity of paper or board today,
when thickness is monitored by on-line equipment, it is vital to have an accurate
thickness tester in the laboratory, in order to calibrate and verify the operation of
the on-line equipment. In spite of this, the micrometer is one of the most
overlooked instruments in many laboratories.

The micrometer should confirm to standard in:
• Lowering speed of the upper measuring face
• Contact pressure
• Good parallel alignment between the measuring faces
The conditions specified under different standard test methods are listed in Table V.
Table V: The Conditions of Measuring Thickness as Specified Under different Standard Methods.
Standard Method
Dead Weight Load, kg
Surface Size, cm 2 Lowering Speed, mm/s
SCAN P7 2 2 1
ISO 534 2 2 2
Tappi T411 1 2 0.8
The variation in the results obtained is probably due to different testers available
within the laboratories. The variation observed was more in case of bulking
thickness values.
8.6 The Remaining Properties
Tensile strength, tearing strength and gloss most of the mills have
given satisfactory results.
9. Feed back from participating mills
A questionnaire (given in Annexure I) was sent to these mills to get
information about the usefulness of CPPRI calibration approach. In this response
eight mills have responded (Annexure II). The positive remarks indicated by
these mills have shown that the approach is useful to the mills.
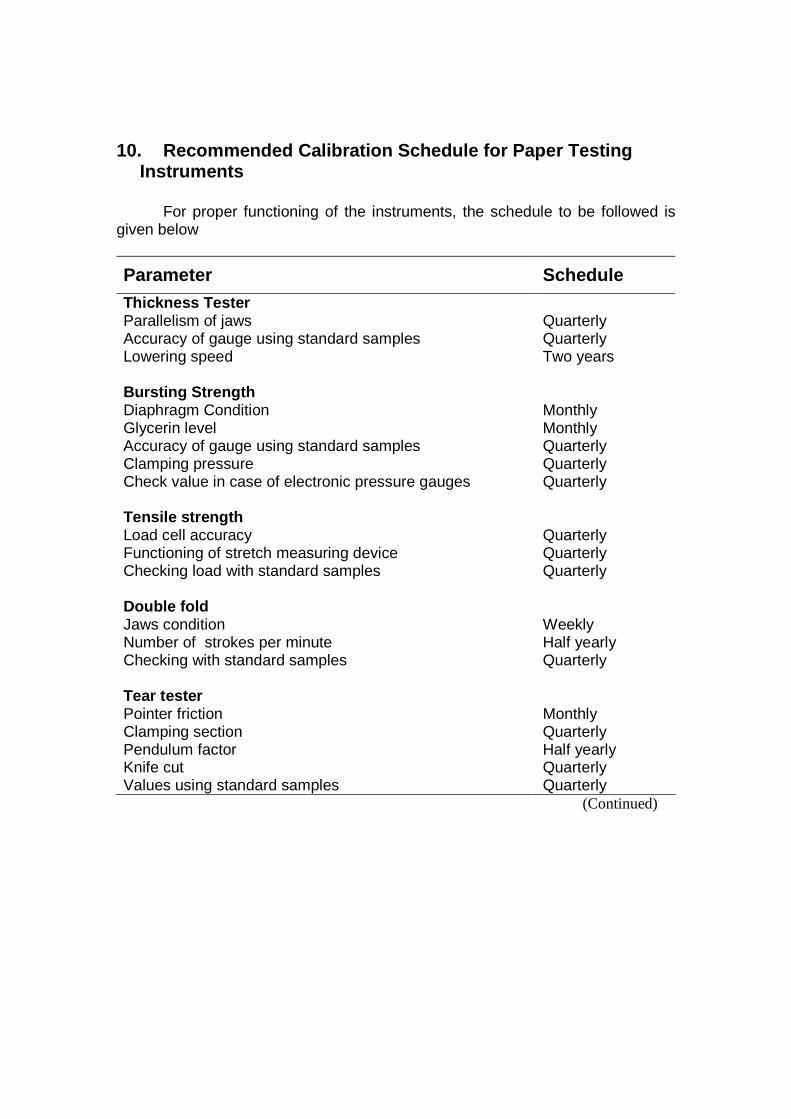
10. Recommended Calibration Schedule for Paper Test ing Instruments
For proper functioning of the instruments, the schedule to be followed is given below
Parameter Schedule Thickness Tester Parallelism of jaws Quarterly Accuracy of gauge using standard samples Quarterly Lowering speed Two years Bursting Strength Diaphragm Condition Monthly Glycerin level Monthly Accuracy of gauge using standard samples Quarterly Clamping pressure Quarterly Check value in case of electronic pressure gauges Quarterly Tensile strength Load cell accuracy Quarterly Functioning of stretch measuring device Quarterly Checking load with standard samples Quarterly Double fold Jaws condition Weekly Number of strokes per minute Half yearly Checking with standard samples Quarterly Tear tester Pointer friction Monthly Clamping section Quarterly Pendulum factor Half yearly Knife cut Quarterly Values using standard samples Quarterly
(Continued)

Brightness tester Calibration with standard plates Daily Calibration using standard samples Quarterly Bendtsen smoothness tester and Porosity tester Level of instrument Weekly Accuracy using standard samples Quarterly Gloss tester Calibration with standard plates Daily Verification with standard samples Quarterly
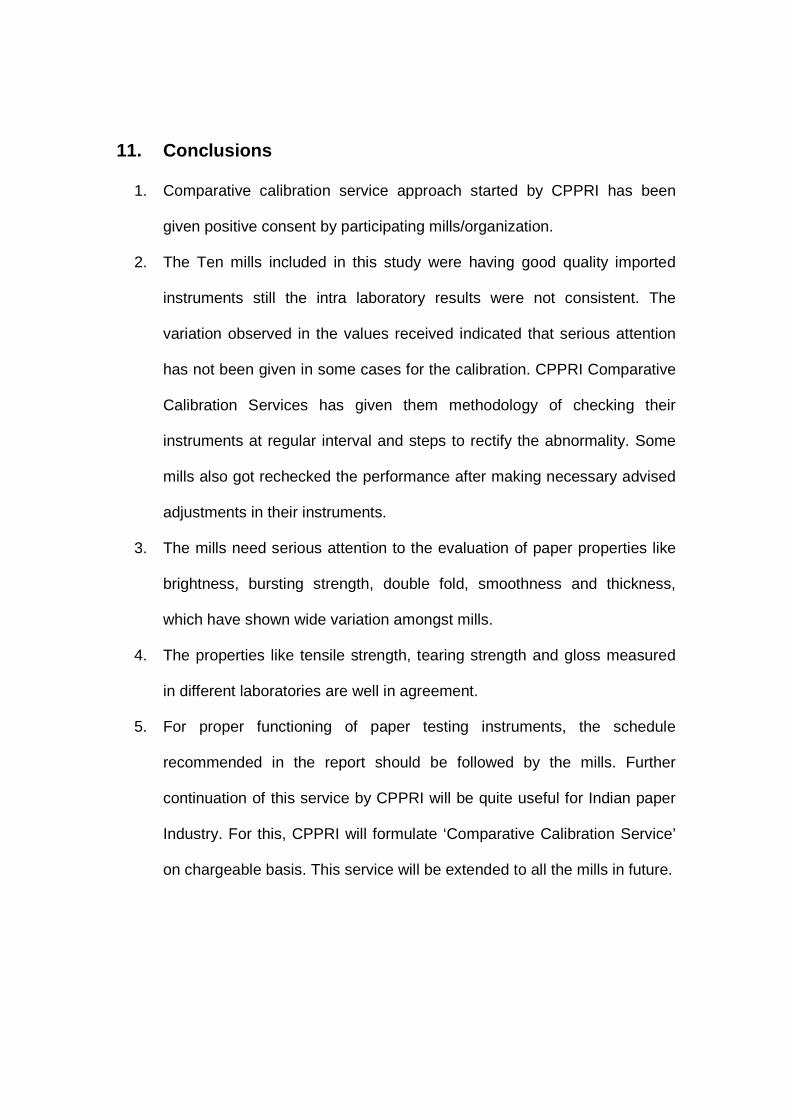
11. Conclusions
1. Comparative calibration service approach started by CPPRI has been
given positive consent by participating mills/organization.
2. The Ten mills included in this study were having good quality imported
instruments still the intra laboratory results were not consistent. The
variation observed in the values received indicated that serious attention
has not been given in some cases for the calibration. CPPRI Comparative
Calibration Services has given them methodology of checking their
instruments at regular interval and steps to rectify the abnormality. Some
mills also got rechecked the performance after making necessary advised
adjustments in their instruments.
3. The mills need serious attention to the evaluation of paper properties like
brightness, bursting strength, double fold, smoothness and thickness,
which have shown wide variation amongst mills.
4. The properties like tensile strength, tearing strength and gloss measured
in different laboratories are well in agreement.
5. For proper functioning of paper testing instruments, the schedule
recommended in the report should be followed by the mills. Further
continuation of this service by CPPRI will be quite useful for Indian paper
Industry. For this, CPPRI will formulate ‘Comparative Calibration Service’
on chargeable basis. This service will be extended to all the mills in future.

12. References
1. Tappi T 404-os-76
2. Tappi T 403-os-76
3. Tappi T 411-os-76
4. Tappi T 423-su-68
5. Tappi T 414-ts-65
6. Tappi T 489-os-76
7. Tappi T 441-os-69
8. Tappi T 460-os-75
9. Tappi T 425-os-75
10. BS 4415 : 1969
11. ISO Recommendation ISO/R 1924-1971
12. Appita P 403 rp - 73
13. Appita 427 Ts - 72
14. Appita P 400 m - 73
15. Appita P 431 rp – 73
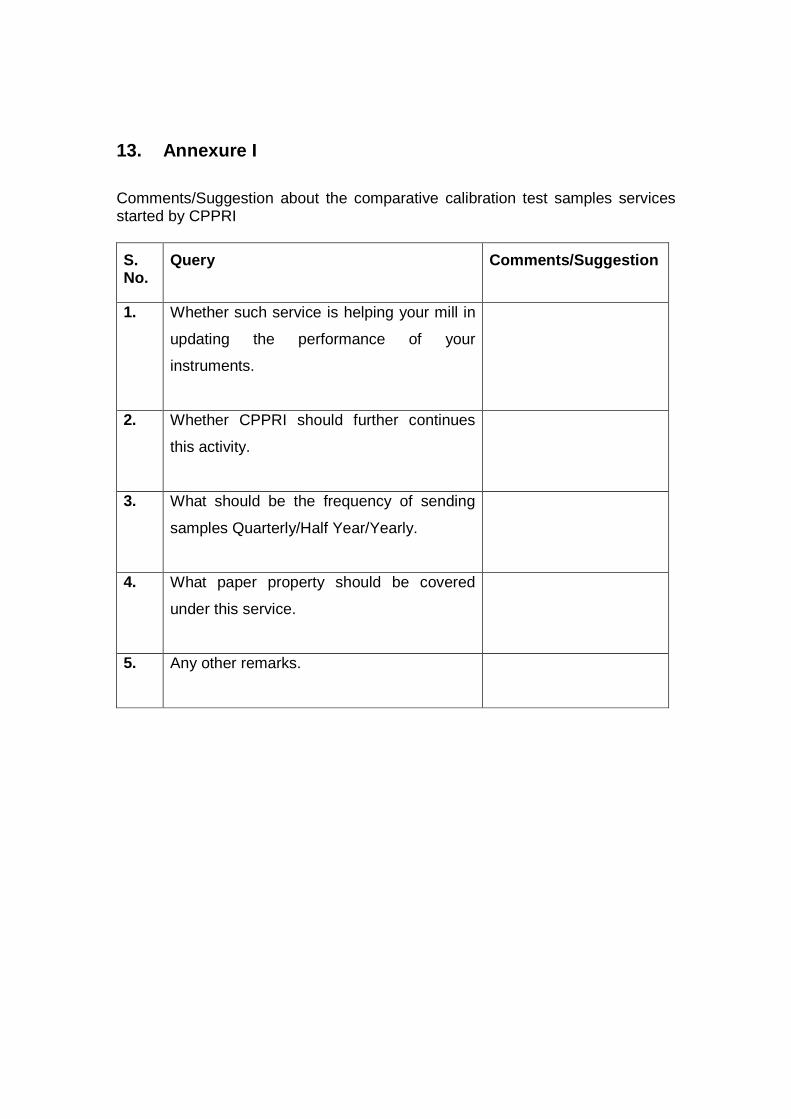
13. Annexure I
Comments/Suggestion about the comparative calibration test samples services started by CPPRI
S. No.
Query
Comments/Suggestion
1. Whether such service is helping your mill in
updating the performance of your
instruments.
2. Whether CPPRI should further continues
this activity.
3. What should be the frequency of sending
samples Quarterly/Half Year/Yearly.
4. What paper property should be covered
under this service.
5. Any other remarks.
Recommended