CRIME IN AMERICA:LET’S CLEAN UP THE
STREETS!
Chris Blees
Conner Faught
Ryan Shaffer

VIOLENT CRIME IN AMERICA
• Question: What factors lead to violent crime and do those factors vary by the size of the city?– Factors Examined:
• Percentage of Population Under the Poverty Line
• People per Family
• Distance from State Capitol
• Size of Police Force
• High School Graduation Rate
• Annual Precipitation
• Divorce Rate
• Average Travel Time to Work
• Percentage of Population that are Civilian Veterans
• Median Age

CITIES USED IN ANALYSIS• 250,000+
Atlanta, GAAurora, COBuffalo, NYPhoenix, AZPittsburgh, PATampa, FAToledo, OHSanta Ana, CAOakland, CAArlington, TX
• 100,000-250,000Richmond, VASan Bernardino, CASt. Petersburg, FAPortsmouth, VACharleston, SCPaterson, NJWestminster, COOrange, CABirmingham, ALSyracuse, NY
• 60,000-100,000Upper Darby Township, PATustin, CATuscaloosa, ALTracy, CATemecula, CASugar Land, TXBeaverton, ORBellflower, CAClifton, NJColumbia, MO
• 20,000-60,000Ames, IAAnderson, INBinghamton, NYBloomfield, NJBowling Green, KYBullhead City, AZGreenburgh Town, NYHendersonville, TNKirkland, WAMansfield, TX

DESCRIPTIVE STATISTICSMean Median Std Deviation Minimum Maximum Count
Under Poverty Line 15.33 16.1 7.680384606 3.9 31 40
People/Family 3.19225 3.105 0.345465034 2.8 4.72 40
Distance from State Capitol 134.5 99.5 125.9910457 0 426 40
Police Officers 421.425 166 569.313842 49 3220 40
HS Graduation % 65.36 65.95 16.33301417 31.2 90.1 40
Precipitation 34.21 38.8 15.08809685 4.7 55 40
% Divorced 10.2675 10.7 2.70871222 4.2 15.1 40
Time to Work 24.595 24 5.448262485 15 41.9 40
% Civilian Veterans 11.49 11.55 3.081441554 5 20.8 40
Median Age 33.065 33.2 3.855435723 23.6 41.8 40

EXPECTED RESULTS
Independent Variable Expected Relationship
Percentage of Population Under the Poverty Line
Positive
People Per Family Positive
Distance From State Capitol Positive
Size of Police Force Negative
High School Graduation Rate Negative
Annual Precipitation Positive
Divorce Rate Positive
Average Travel Time to Work Negative
Percentage of Population that are Civilian Veterans
Negative
Median Age Negative

REGRESSION ANALYSIS
Regression Statistics
Multiple R 0.883752474
R Square 0.781018435
Adjusted R Square 0.70550755
Standard Error 244.764056
Observations 40
ANOVA
df SS MS F Significance F
Regression 10 6196507.9 619650.7925 10.343 3.76919E-07
Residual 29 1737373.85 59909.4431
Total 39 7933881.775

REGRESSION ANALYSIS, CONT.
Coefficients Standard Error t Stat P-value
Intercept 995.1355138 1269.084842 0.784136317 0.439318415
% under Poverty Line 28.59096442 10.17992151 2.808564329 0.008813091
Average Number of People/Family -261.5593937 231.4495346 -1.130092545 0.267697831
Distance From State Capital(Miles) 0.634059133 0.427380986 1.483592282 0.14870513
Police Officers (2008) 0.156190091 0.085406716 1.828779961 0.077734615
High School Graduates (Percentage) -9.912498362 4.127235369 -2.401728391 0.022949078
Average Precipitation (inches) 6.874069669 3.886549608 1.768681829 0.087465669
% population divorced 34.65590142 21.0148204 1.649117183 0.109916154
mean travel time to work 27.86069548 12.24140536 2.275939295 0.030416635
% of population that are civilian veterans -44.10999457 20.55095204 -2.146372318 0.040341187
median age -6.946041193 14.88362894 -0.466690027 0.644208808
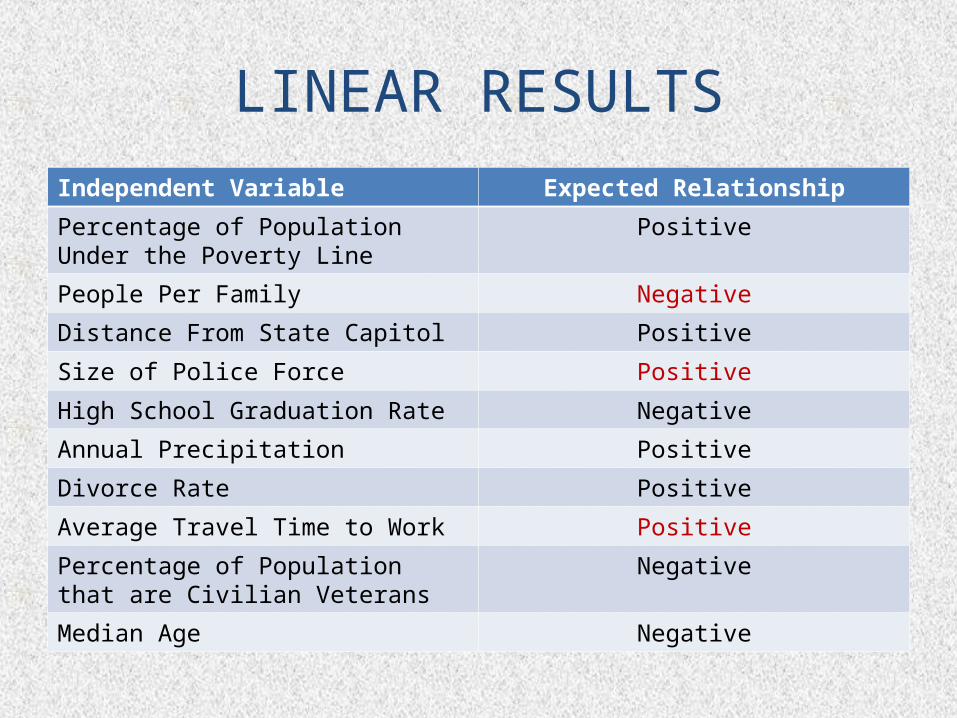
LINEAR RESULTS
Independent Variable Expected Relationship
Percentage of Population Under the Poverty Line
Positive
People Per Family Negative
Distance From State Capitol Positive
Size of Police Force Positive
High School Graduation Rate Negative
Annual Precipitation Positive
Divorce Rate Positive
Average Travel Time to Work Positive
Percentage of Population that are Civilian Veterans
Negative
Median Age Negative

VALIDITYBecause the test for homoscedasticity for the predicted values versus the residuals produces a notable ovoid shape, and because the histogram of the residuals produced a curve with a normal, bell-curve shape, the model appears to be valid.

CONCLUSIONS
• Of the factors we chose, only four had a significant impact on violent crime rates nationwide.
– Percentage of the population under the poverty line.
– High school graduation rate.
– Mean travel time to work.
– Percentage of the population that are civilian veterans.
• Possible limitations of our model could include:
– Small sample size (40 cities).
– Data taken from 2000.
– Only examines violent crimes.

SOURCES
• http://www.city-data.com/
• 2000 U.S. Census
• Bureau of Justice Statistics
Recommended