Business 205

Review
CorrelationMS5

Preview
Chi-Square

Types of Tests
Parametric Tests Assume normal and homogeneity of variance Require parameters
Z-test, T-test, 2-Group T, ANOVA
Non-parametric Tests Few (if any) assumptions about the population
distribution Rarely state a hypotheses in terms of a specific
parameter Chi-Square
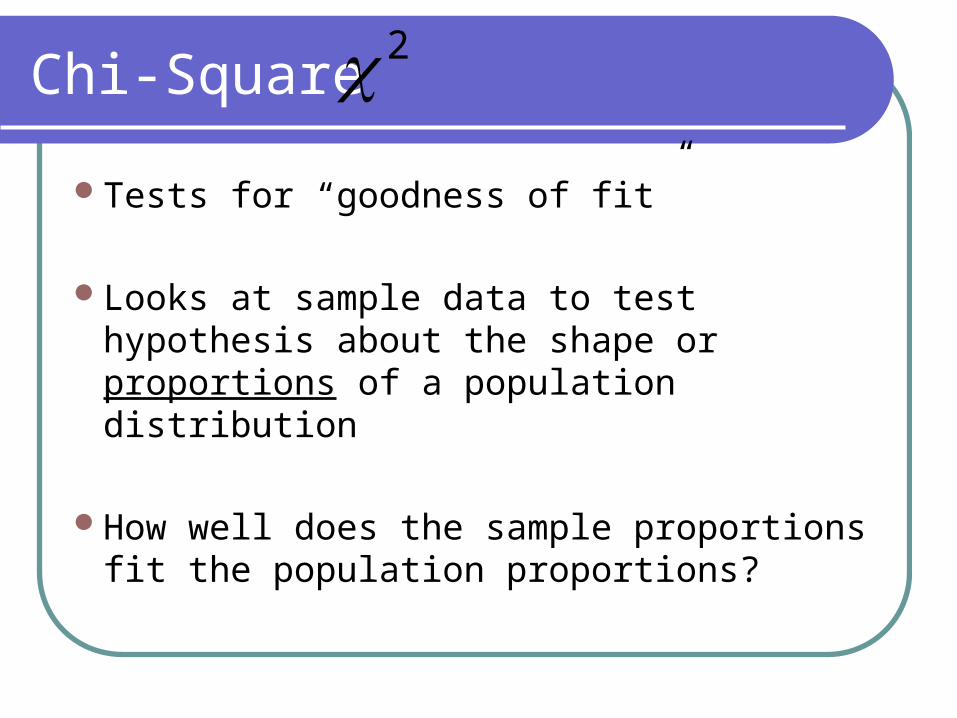
Chi-Square
Tests for “goodness of fit”
Looks at sample data to test hypothesis about the shape or proportions of a population distribution
How well does the sample proportions fit the population proportions?
2
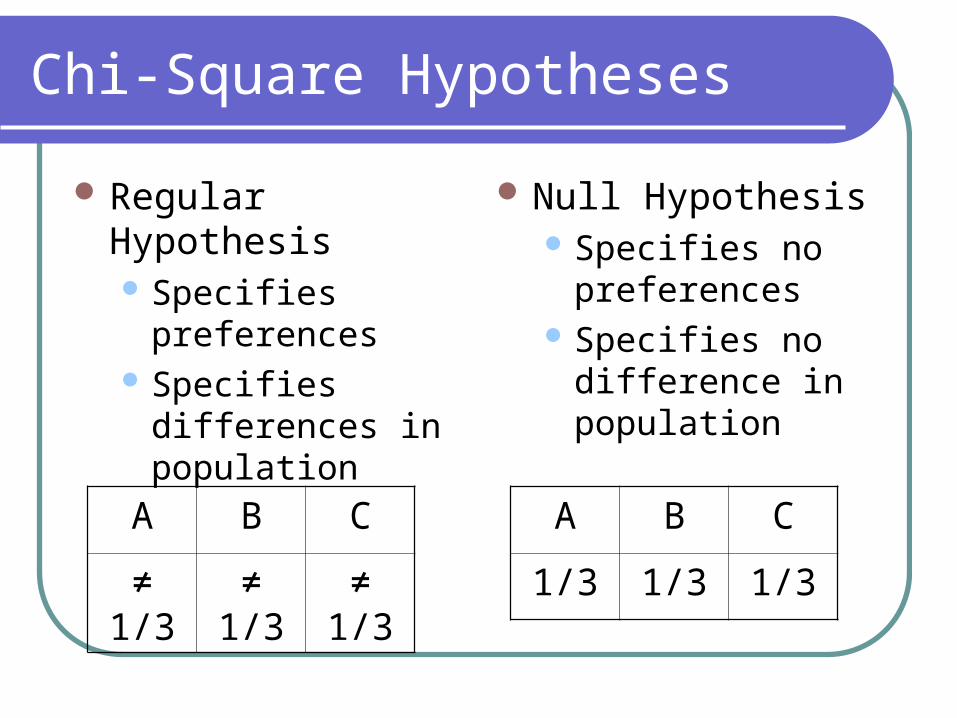
Chi-Square Hypotheses
Regular Hypothesis Specifies
preferences Specifies
differences in population
Null Hypothesis Specifies no
preferences Specifies no
difference in population
A B C
≠ 1/3 ≠ 1/3 ≠ 1/3
A B C
1/3 1/3 1/3

One-Sample Chi-Square χ2
Compares the goodness of fit of the data to that of the null hypothesis
Compares observed frequencies against expected frequencies
Looks at the difference between 1 IV with multiple levels

Observed Frequencies
Number of individuals from the sample who are classified in a particular category
How many times it occurs

Expected Scores/Frequencies
The frequency value that is predicted from the null hypothesis and the sample size.
N
Scores Individual 2 SampleOne

One-Sample Chi-Square
score expected
score expected - score observed 22

1 Sample Chi-Square Example
Student Observed Scores
1 29
2 19
3 18
4 25
5 17
6 10
7 15
8 11
18N
Scores Individual Scores Expected

Fill out the chart
Observed Scores (O)
Expected Scores (E)
O - E (O - E)2 (O - E)2
E
29 18 11 121 6.72
19 18 1 1 .06
18 18 0 0 0
25 18 7 49 2.72
17 18 -1 1 .06
10 18 -8 64 3.56
15 18 -3 9 .50
11 18 -7 49 2.72

Chi-Square
Chi-Square = (6.72+.06+0+2.72+.06+3.56+.50+2.72) =
16.34Critical Chi-Square value at an alpha
of .05 is 3.84. Accept that your sample is not from the
population because 16.34 is larger than 3.84.

Two Sample Chi-Square TestChi-Square Test for Independence
2 FactorsMany levelsTests whether or not there is a
relationship between 2 variables

Two Sample Chi-Square TestChi-Square Test for Independence
N
totalRow x alColumn tot Frequency Expected
df = (number of rows - 1)(number of columns - 1)
score expected
score expected - score observed ceIndependenfor Test Square-Chi
2

Two Sample Chi-Square TestChi-Square Test for Independence
Three different drug treatments are used to control hypertension. At the end of treatment, the investigator classifies patients as having either a favorable or unfavorable response to the medication. Your hypothesis is that there is a different between treatments.

Two Sample Chi-Square TestChi-Square Test for Independence
Treatment 1 Treatment 2 Treatment 3 Total in rows
Favorable 70 160 168
Unfavorable 30 40 32
Total in columns N = 500
1.) Total up each column2.) Total up each row3.) Find the expected score for each cell
N
totalRow x alColumn totE

Two Sample Chi-Square TestChi-Square Test for Independence
Treatment 1
Treatment 2
Treatment 3
Total in rows
Favorable 70(E = 79.6)
160(E = 159.2)
168(E = 159.2)
398
Unfavorable 30(E = 20.4)
40(E = 40.8)
32(E = 40.8)
102
Total in columns
100 200 200 N = 500

Two Sample Chi-Square TestChi-Square Test for Independence
Observed
Expected O-E (O-E)2 (O-E)2/E
70 (398)(100)/500 = 79.6 -9.6 92.16 1.15
30 (102)(100)/500 = 20.4 9.6 92.16 4.15
160 (398)(200)/500 = 159.2
.8 .64 .00
40 (102)(200)/500 = 40.8 -.8 .64 .01
168 (398)(200)/500 = 159.2
8.8 77.4 .48
32 (102)(200)/500 = 40.8 -8.8 77.4 1.89
Two Sample Chi-Square TestChi-Square Test for Independence
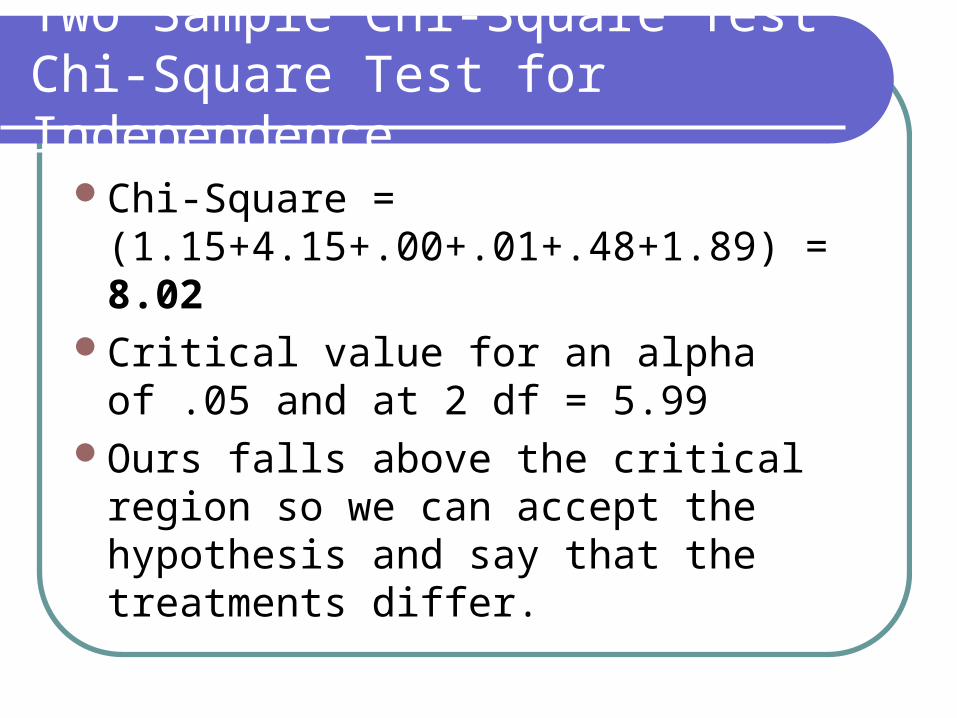
Chi-Square = (1.15+4.15+.00+.01+.48+1.89) = 8.02
Critical value for an alpha of .05 and at 2 df = 5.99
Ours falls above the critical region so we can accept the hypothesis and say that the treatments differ.

Reporting findingsChi-Square Test for Independence
The chi-square value is in the critical region. Therefore, we can reject the null hypothesis. There is a relationship between drug treatments and responses towards medication (2, n =500) = 8.02, p <.05.2

Chi-Square In Class Example
Hotel 1 Hotel 2 Hotel 3 Total in rows
Favorable 50 100 85
Unfavorable 10 20 16
Total in columnsN =
H1: There is a difference between hotels.

Excel: Chi-Square
DO NOT USE:CHIDIST( ) Only returns a probabilityFor Single Chi-Squares, you must program
that in by hand
CHITEST( ) Only returns a probabilityFor a test of independence (2 sample) you
must program that in by hand
Recommended