Evaluating the implications of the EU Steel Action Plan on
steel scrap production and trade BIR
World Recycling Convention
Warsaw, October 28, 2013
The EU has published in last June a new Steel Action Plan in response to calls for help from part of the steel industry.
The plan presents a list of measures aimed at alleviating the difficulties of the steel sector, in particular in the regions affected by recent closures, the decline in demand in Southern Europe, and the recurrent threat of cheap steel imports. The plan also mention a possibility to monitor or restrict scrap exports. “Given the reduced amount of CO2 in the production of scrap in Europe, non-discriminatory measures justified on environmental grounds could be envisaged, if necessary to address carbon leakage to non EU countries, provided that they do not result directly or indirectly in export restrictions”. (COM (2013) 407 pp 11). Laplace Conseil, an international consultant in metal and mining, is preparing an evaluation of the threat, measuring the potential impact on the scrap collecting and processing industry, so as to prepare an adequate response to the EU proposal.
Agenda
• Importance of the European EAF steel industry in the EU28
• Impact of EU proposed regulations and trade restrictions
• Reasons why the EU should support greater steel scrap recycling
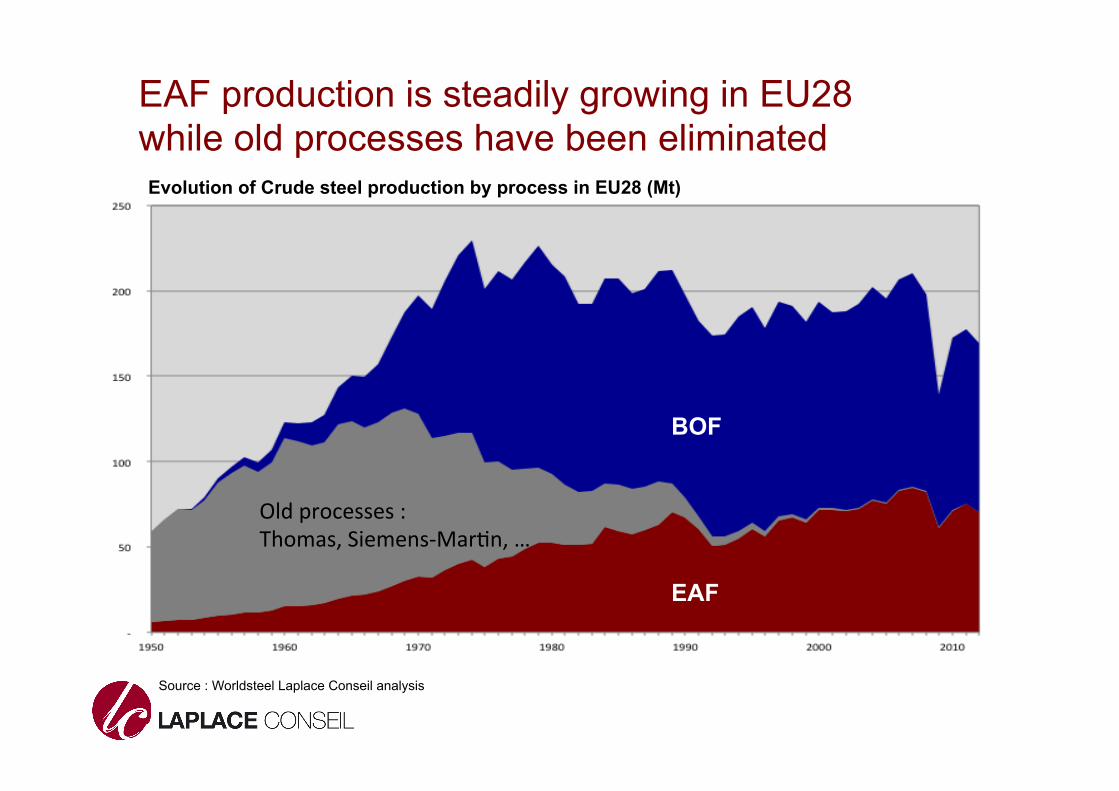
EAF production is steadily growing in EU28 while old processes have been eliminated Evolution of Crude steel production by process in EU28 (Mt)
BOF
EAF
Old processes : Thomas, Siemens-‐Mar6n, …
Source : Worldsteel Laplace Conseil analysis
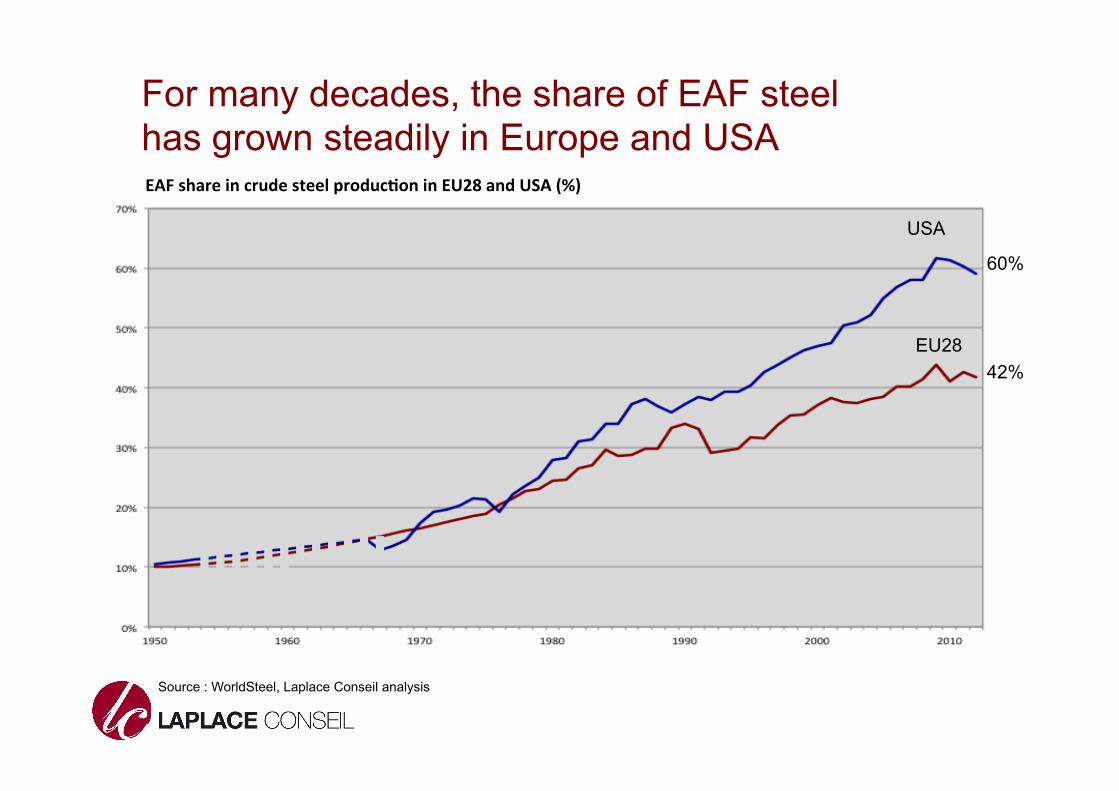
For many decades, the share of EAF steel has grown steadily in Europe and USA
Source : WorldSteel, Laplace Conseil analysis
EAF share in crude steel produc3on in EU28 and USA (%)
USA
EU28
60%
42%
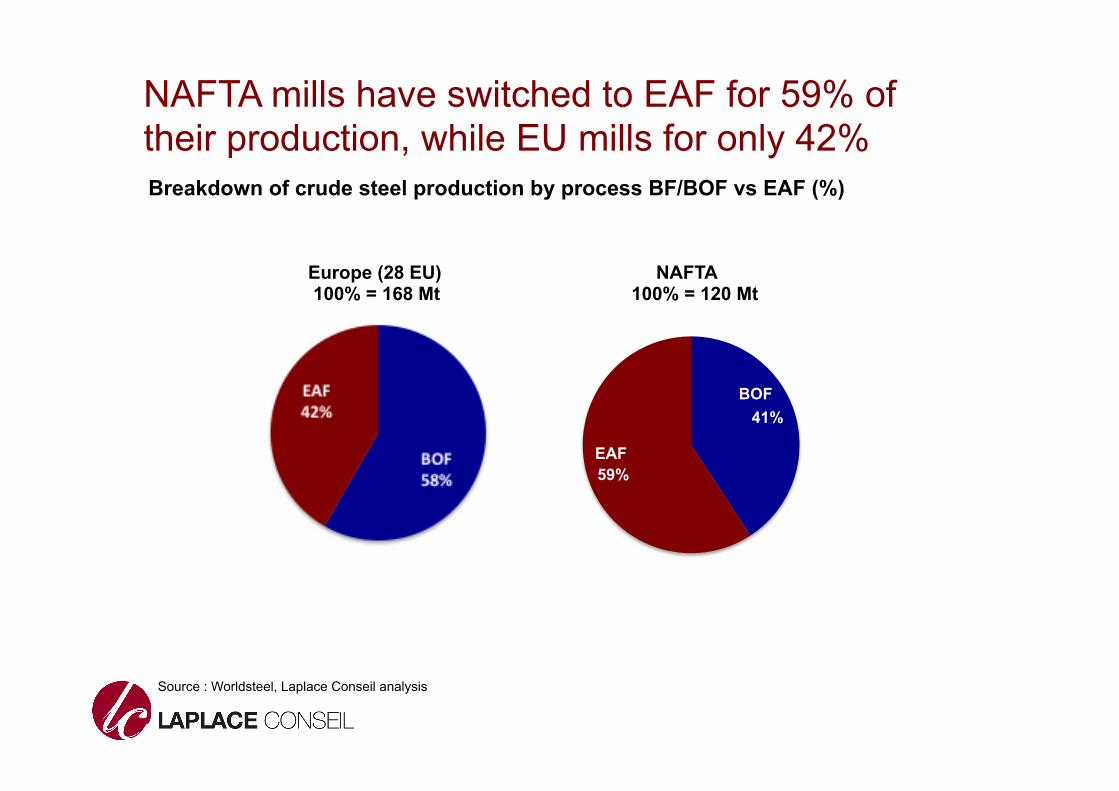
NAFTA mills have switched to EAF for 59% of their production, while EU mills for only 42%
41%
59%
Breakdown of crude steel production by process BF/BOF vs EAF (%)
EAF
Source : Worldsteel, Laplace Conseil analysis
Europe (28 EU) NAFTA 100% = 168 Mt 100% = 120 Mt
BOF
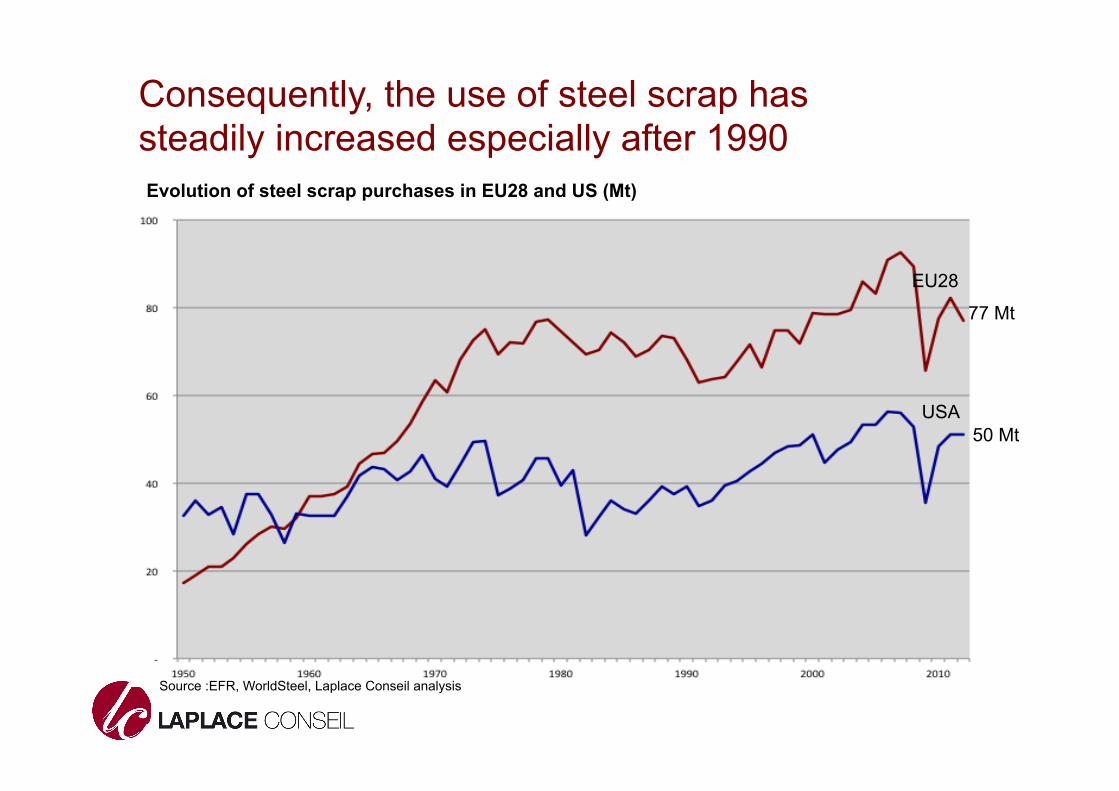
Consequently, the use of steel scrap has steadily increased especially after 1990 Evolution of steel scrap purchases in EU28 and US (Mt)
USA
EU28
77 Mt
50 Mt
Source :EFR, WorldSteel, Laplace Conseil analysis
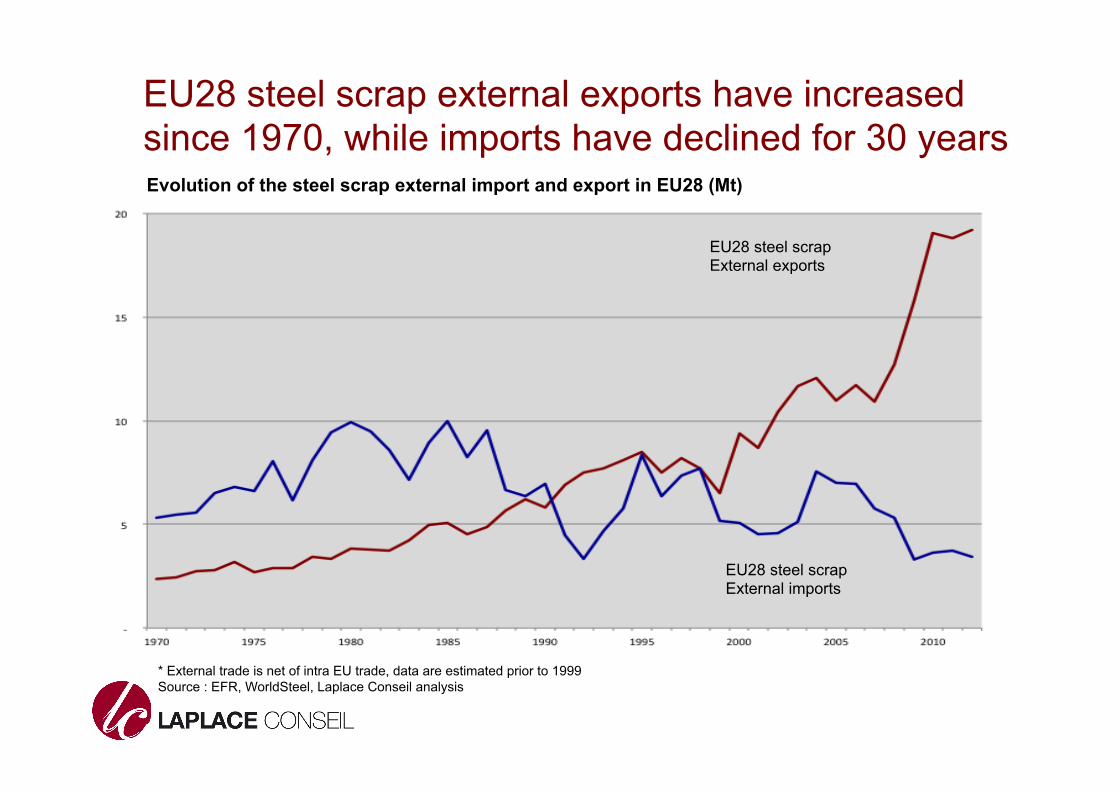
EU28 steel scrap external exports have increased since 1970, while imports have declined for 30 years
EU28 steel scrap External exports
EU28 steel scrap External imports
Evolution of the steel scrap external import and export in EU28 (Mt)
* External trade is net of intra EU trade, data are estimated prior to 1999 Source : EFR, WorldSteel, Laplace Conseil analysis
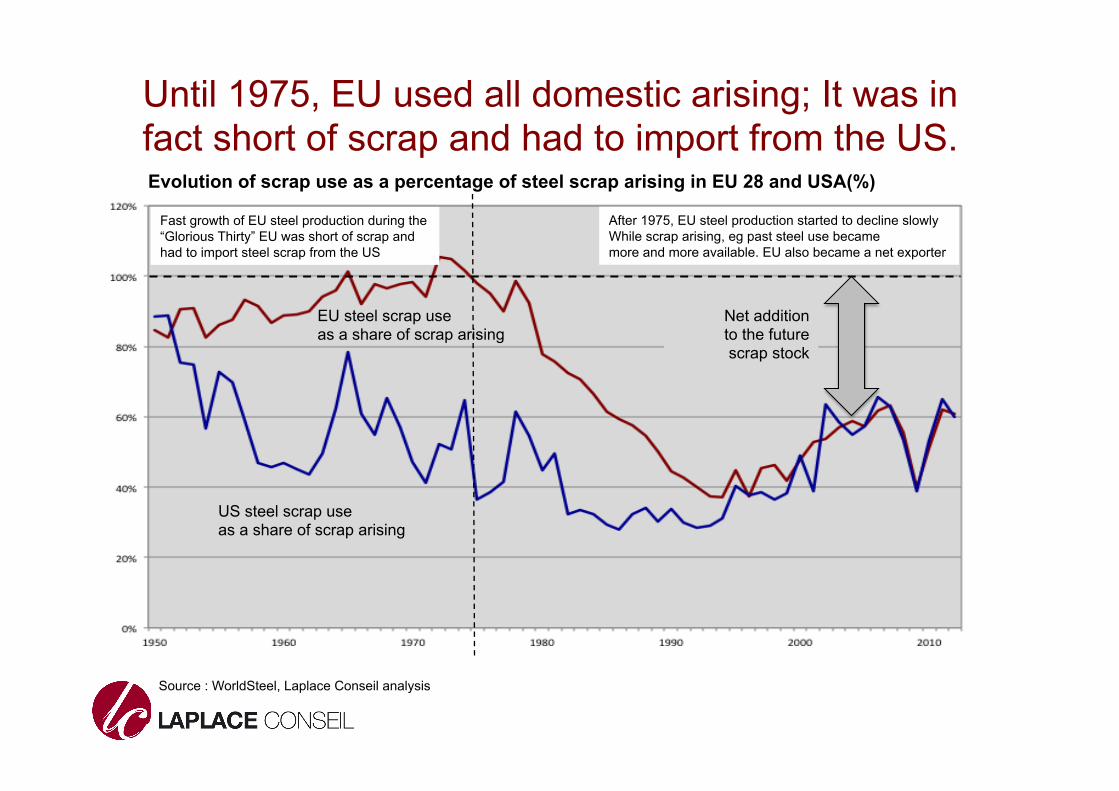
Until 1975, EU used all domestic arising; It was in fact short of scrap and had to import from the US.
EU steel scrap use as a share of scrap arising
US steel scrap use as a share of scrap arising
Fast growth of EU steel production during the “Glorious Thirty” EU was short of scrap and had to import steel scrap from the US
After 1975, EU steel production started to decline slowly While scrap arising, eg past steel use became more and more available. EU also became a net exporter
Evolution of scrap use as a percentage of steel scrap arising in EU 28 and USA(%)
Source : WorldSteel, Laplace Conseil analysis
Net addition to the future scrap stock
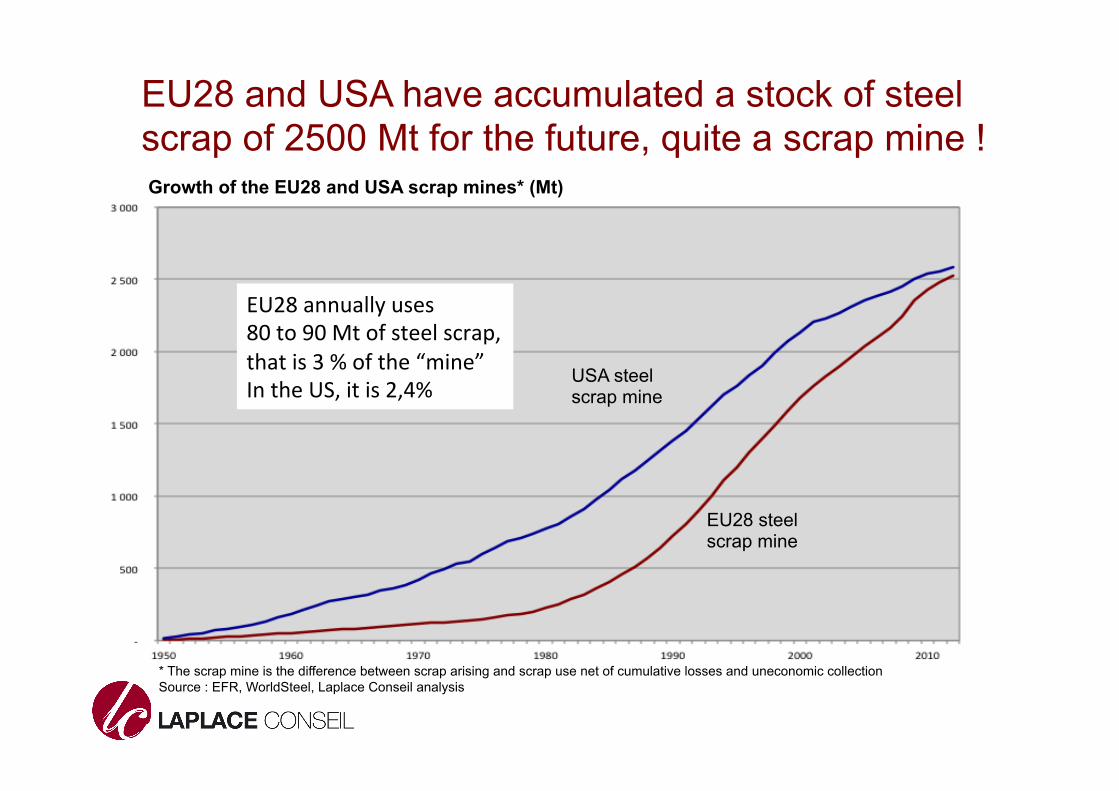
EU28 and USA have accumulated a stock of steel scrap of 2500 Mt for the future, quite a scrap mine !
USA steel scrap mine
EU28 steel scrap mine
Growth of the EU28 and USA scrap mines* (Mt)
* The scrap mine is the difference between scrap arising and scrap use net of cumulative losses and uneconomic collection Source : EFR, WorldSteel, Laplace Conseil analysis
EU28 annually uses 80 to 90 Mt of steel scrap, that is 3 % of the “mine” In the US, it is 2,4%
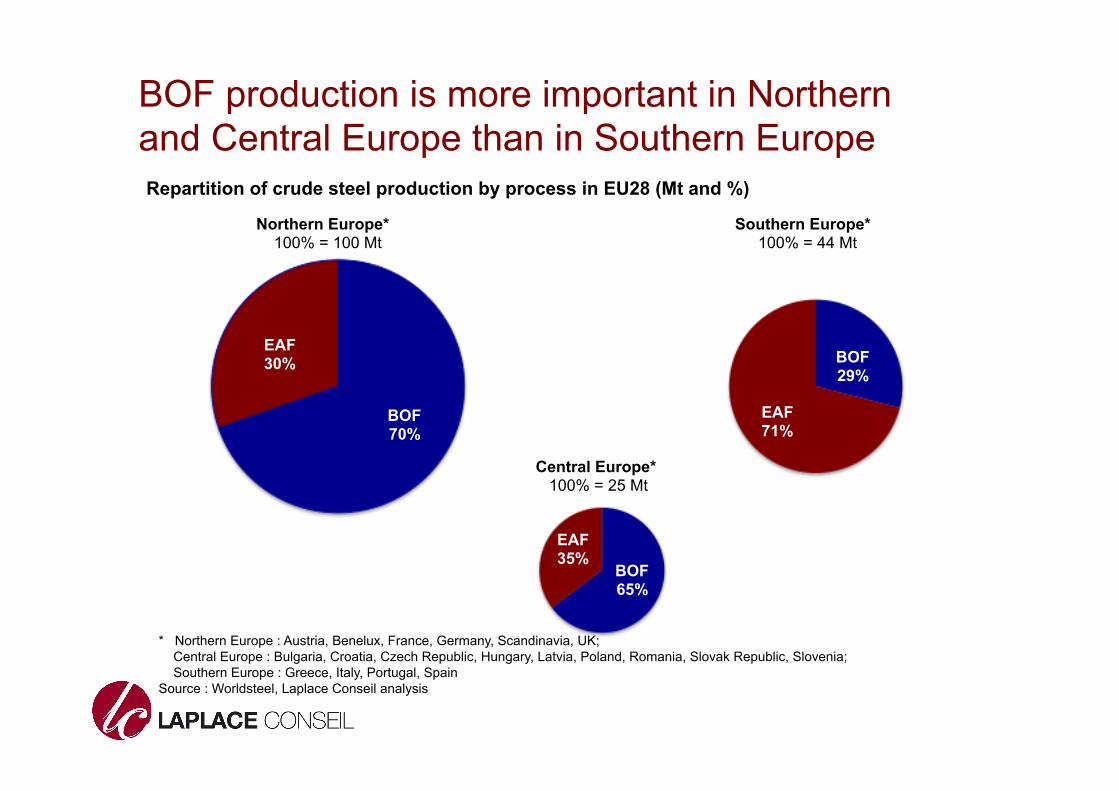
BOF production is more important in Northern and Central Europe than in Southern Europe
Northern Europe* Southern Europe* 100% = 100 Mt 100% = 44 Mt
Central Europe* 100% = 25 Mt
* Northern Europe : Austria, Benelux, France, Germany, Scandinavia, UK; Central Europe : Bulgaria, Croatia, Czech Republic, Hungary, Latvia, Poland, Romania, Slovak Republic, Slovenia; Southern Europe : Greece, Italy, Portugal, Spain Source : Worldsteel, Laplace Conseil analysis
BOF 70%
BOF 65%
BOF 29%
EAF 30%
EAF 71%
EAF 35%
Repartition of crude steel production by process in EU28 (Mt and %)
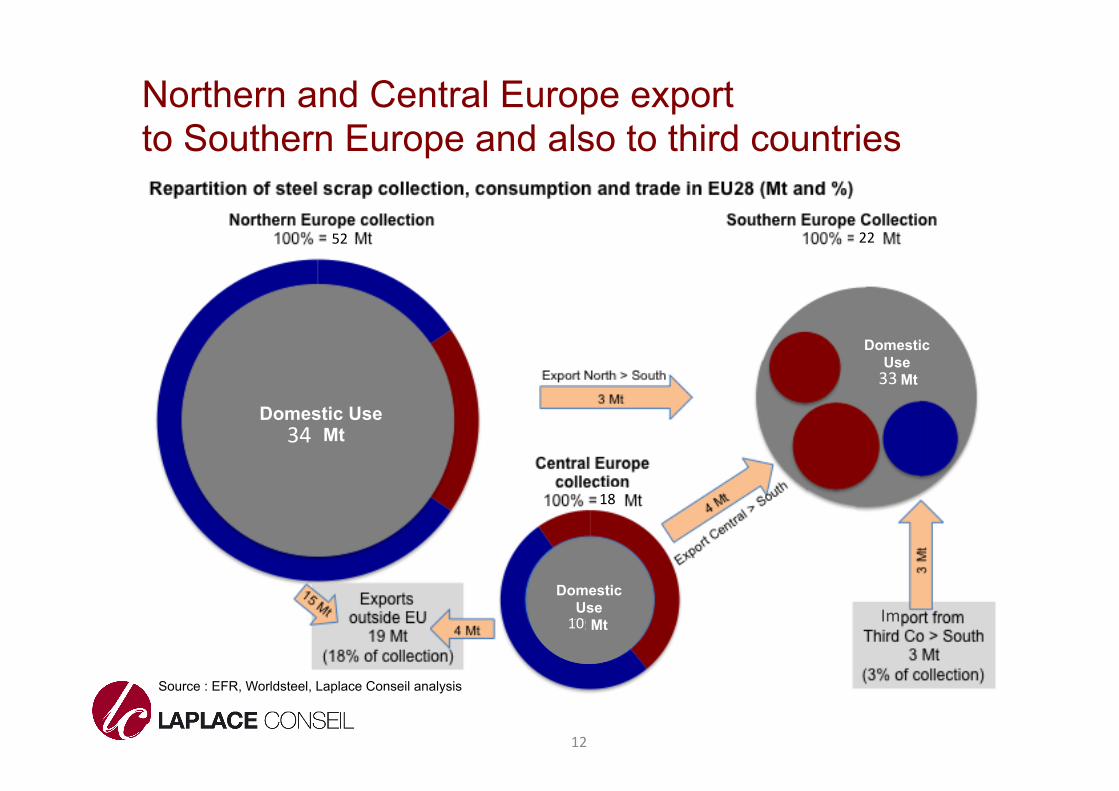
Northern and Central Europe export to Southern Europe and also to third countries
12
Source : EFR, Worldsteel, Laplace Conseil analysis
Domestic Use 43 Mt
Domestic Use
12 Mt
Domestic Use
36 Mt
34
52 22
18
33
10 Im
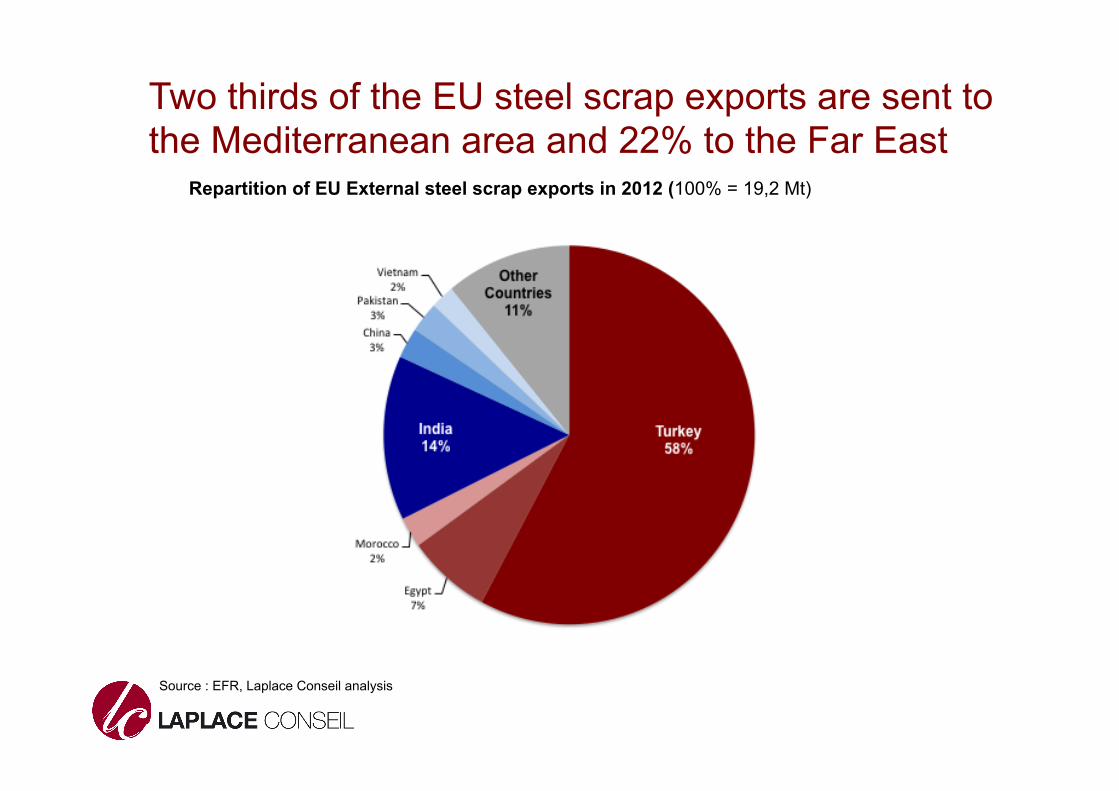
Two thirds of the EU steel scrap exports are sent to the Mediterranean area and 22% to the Far East
Repartition of EU External steel scrap exports in 2012 (100% = 19,2 Mt)
Source : EFR, Laplace Conseil analysis
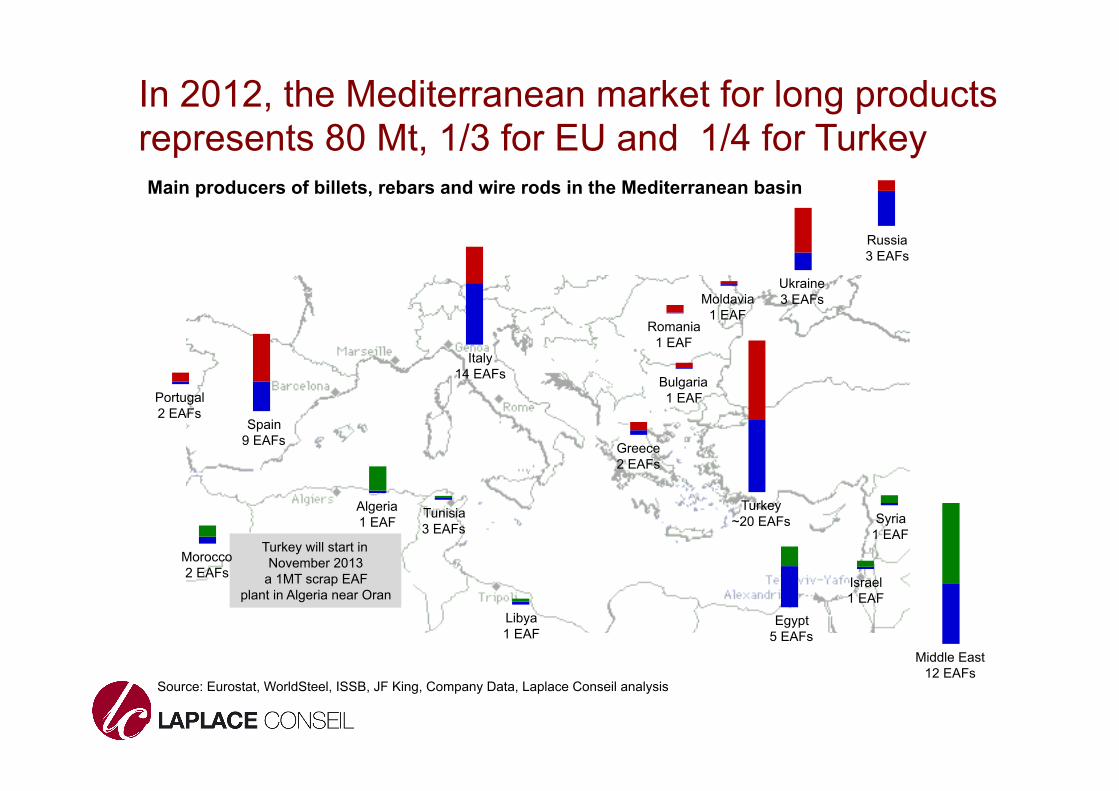
In 2012, the Mediterranean market for long products represents 80 Mt, 1/3 for EU and 1/4 for Turkey Main producers of billets, rebars and wire rods in the Mediterranean basin
Source: Eurostat, WorldSteel, ISSB, JF King, Company Data, Laplace Conseil analysis
Turkey will start in November 2013
a 1MT scrap EAF plant in Algeria near Oran
Bulgaria 1 EAF
Greece 2 EAFs
Italy 14 EAFs
Portugal 2 EAFs
Romania 1 EAF
Spain 9 EAFs
Moldavia 1 EAF
Russia 3 EAFs
Ukraine 3 EAFs
Turkey ~20 EAFs Syria
1 EAF
Israel 1 EAF
Middle East 12 EAFs
Algeria 1 EAF
Egypt 5 EAFs
Libya 1 EAF
Morocco 2 EAFs
Tunisia 3 EAFs
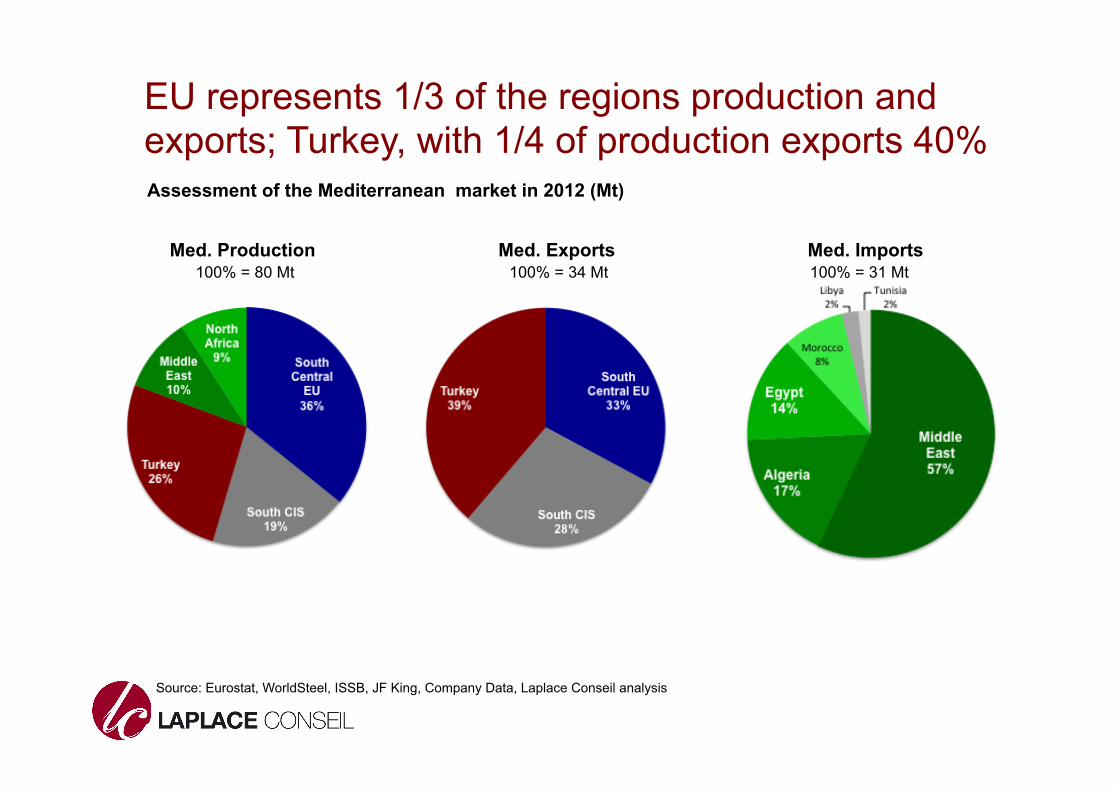
EU represents 1/3 of the regions production and exports; Turkey, with 1/4 of production exports 40%
Med. Production Med. Exports Med. Imports 100% = 80 Mt 100% = 34 Mt 100% = 31 Mt
Source: Eurostat, WorldSteel, ISSB, JF King, Company Data, Laplace Conseil analysis
Assessment of the Mediterranean market in 2012 (Mt)
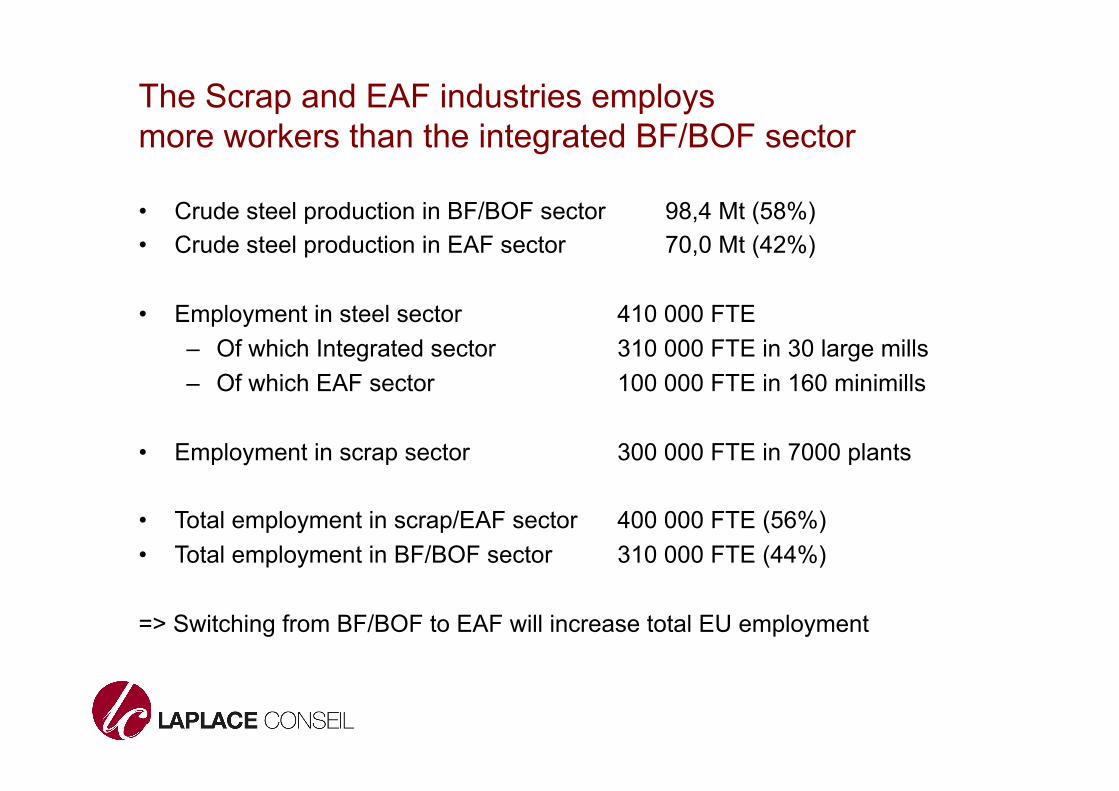
The Scrap and EAF industries employs more workers than the integrated BF/BOF sector
• Crude steel production in BF/BOF sector 98,4 Mt (58%) • Crude steel production in EAF sector 70,0 Mt (42%)
• Employment in steel sector 410 000 FTE – Of which Integrated sector 310 000 FTE in 30 large mills – Of which EAF sector 100 000 FTE in 160 minimills
• Employment in scrap sector 300 000 FTE in 7000 plants
• Total employment in scrap/EAF sector 400 000 FTE (56%) • Total employment in BF/BOF sector 310 000 FTE (44%)
=> Switching from BF/BOF to EAF will increase total EU employment
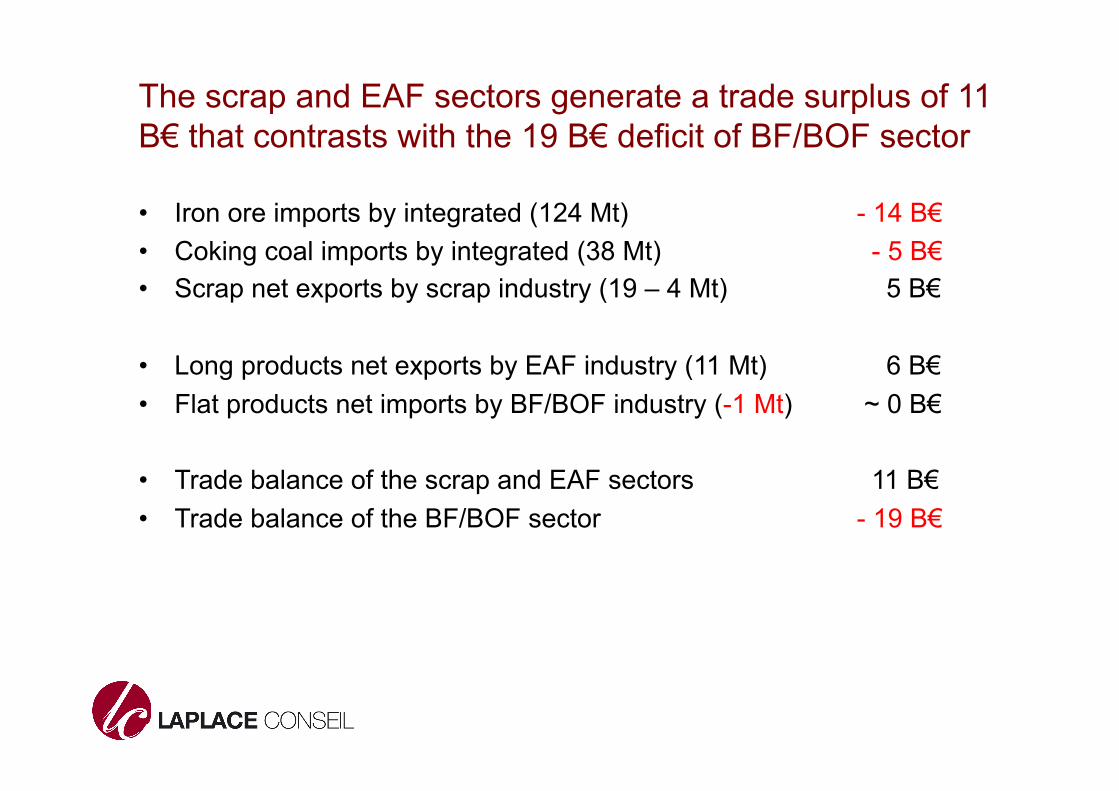
The scrap and EAF sectors generate a trade surplus of 11 B€ that contrasts with the 19 B€ deficit of BF/BOF sector
• Iron ore imports by integrated (124 Mt) - 14 B€ • Coking coal imports by integrated (38 Mt) - 5 B€ • Scrap net exports by scrap industry (19 – 4 Mt) 5 B€
• Long products net exports by EAF industry (11 Mt) 6 B€ • Flat products net imports by BF/BOF industry (-1 Mt) ~ 0 B€
• Trade balance of the scrap and EAF sectors 11 B€ • Trade balance of the BF/BOF sector - 19 B€
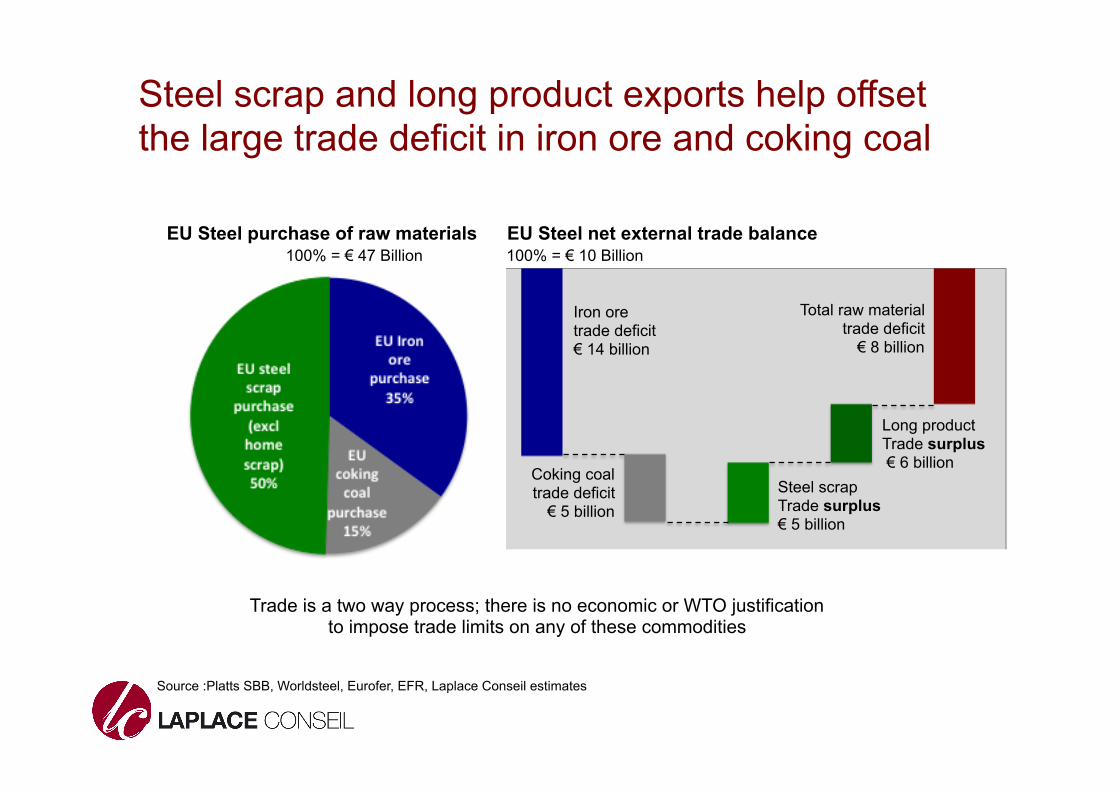
Steel scrap and long product exports help offset the large trade deficit in iron ore and coking coal
EU Steel purchase of raw materials EU Steel net external trade balance 100% = € 47 Billion 100% = € 10 Billion
Steel scrap Trade surplus € 5 billion
Total raw material trade deficit € 8 billion
Coking coal trade deficit € 5 billion
Iron ore trade deficit € 14 billion
Long product Trade surplus € 6 billion
Trade is a two way process; there is no economic or WTO justification to impose trade limits on any of these commodities
Source :Platts SBB, Worldsteel, Eurofer, EFR, Laplace Conseil estimates
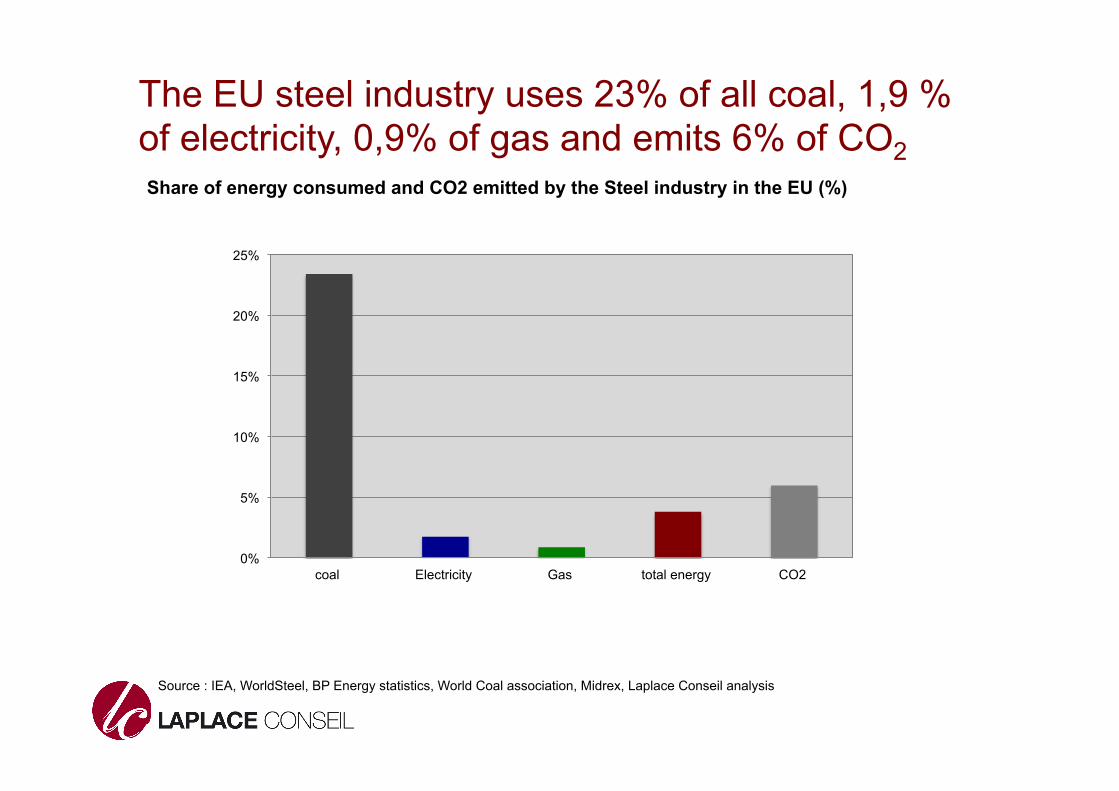
The EU steel industry uses 23% of all coal, 1,9 % of electricity, 0,9% of gas and emits 6% of CO2
0%
5%
10%
15%
20%
25%
coal Electricity Gas total energy CO2
Share of energy consumed and CO2 emitted by the Steel industry in the EU (%)
Source : IEA, WorldSteel, BP Energy statistics, World Coal association, Midrex, Laplace Conseil analysis
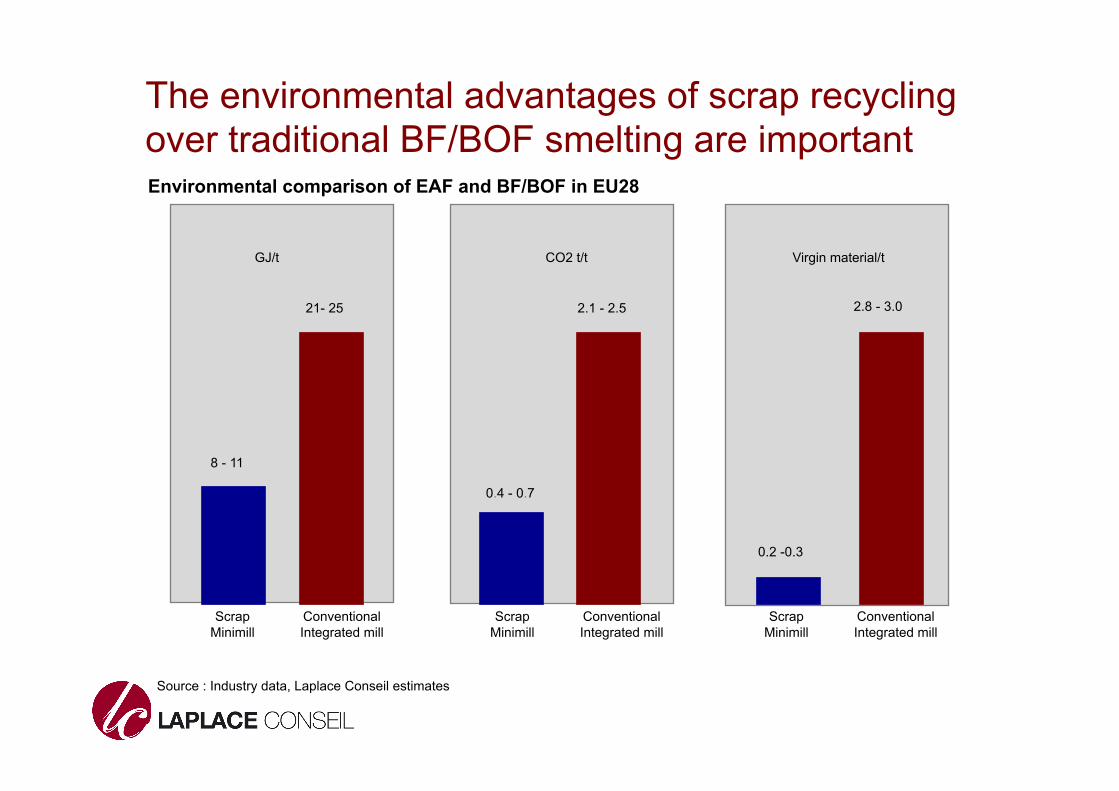
The environmental advantages of scrap recycling over traditional BF/BOF smelting are important
Source : Industry data, Laplace Conseil estimates
21- 25
8 - 11
2.1 - 2.5
Scrap Minimill
2.8 - 3.0
GJ/t CO2 t/t Virgin material/t
0.4 - 0.7
0.2 -0.3
Conventional Integrated mill
Scrap Minimill
Conventional Integrated mill
Scrap Minimill
Conventional Integrated mill
Environmental comparison of EAF and BF/BOF in EU28
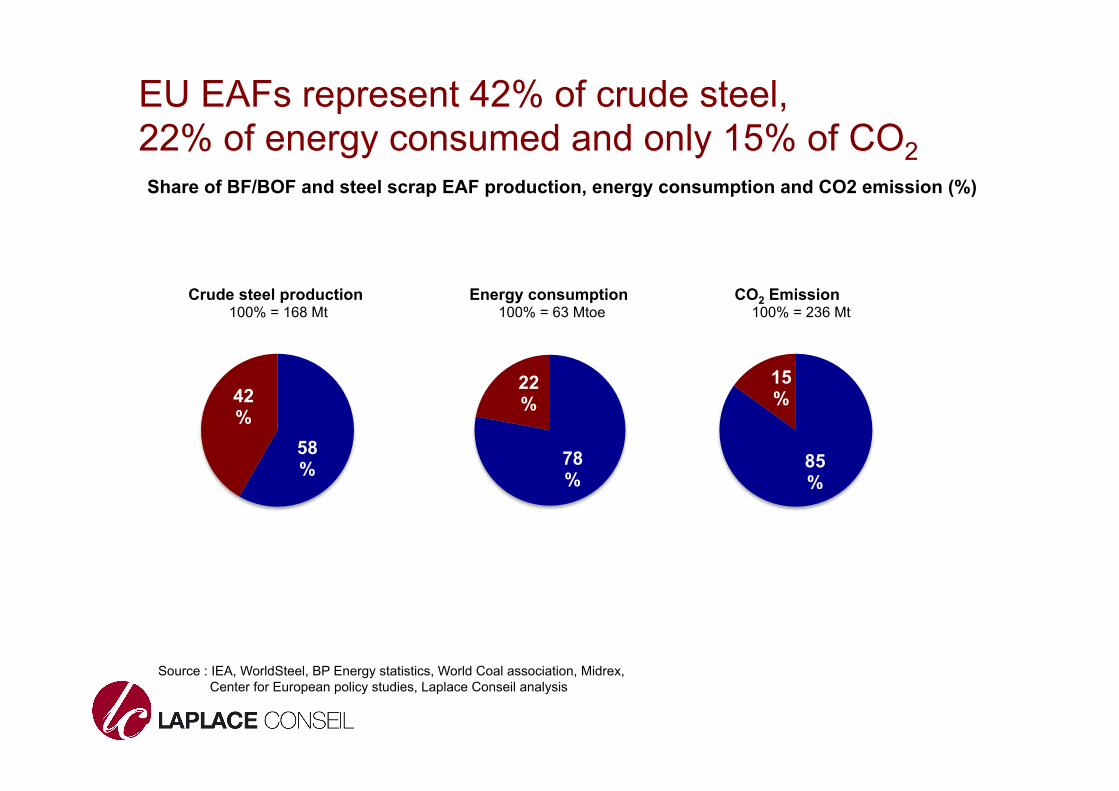
EU EAFs represent 42% of crude steel, 22% of energy consumed and only 15% of CO2
58%
42%
78%
22%
85%
15%
Share of BF/BOF and steel scrap EAF production, energy consumption and CO2 emission (%)
Crude steel production Energy consumption CO2 Emission 100% = 168 Mt 100% = 63 Mtoe 100% = 236 Mt
Source : IEA, WorldSteel, BP Energy statistics, World Coal association, Midrex, Center for European policy studies, Laplace Conseil analysis
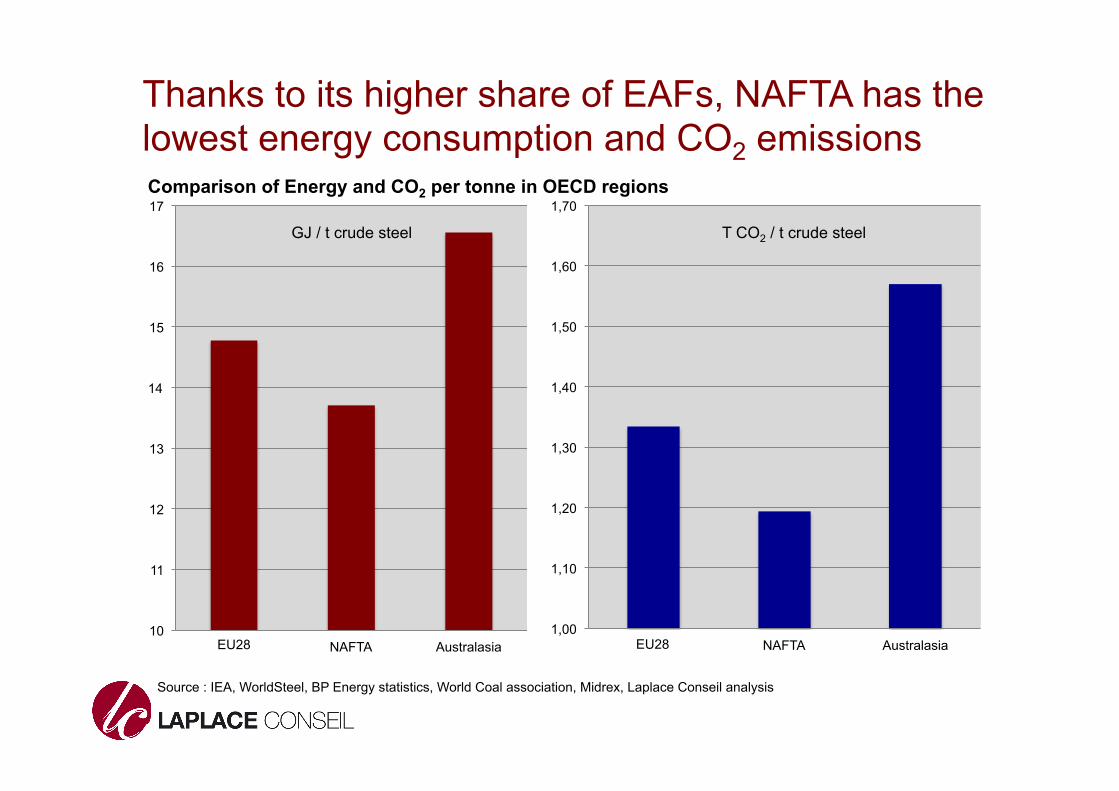
10
11
12
13
14
15
16
17
Europe 27 + TK NAFTA Australasia 1,00
1,10
1,20
1,30
1,40
1,50
1,60
1,70
Europe 27 + TK NAFTA Australasia
Thanks to its higher share of EAFs, NAFTA has the lowest energy consumption and CO2 emissions Comparison of Energy and CO2 per tonne in OECD regions
GJ / t crude steel T CO2 / t crude steel
Source : IEA, WorldSteel, BP Energy statistics, World Coal association, Midrex, Laplace Conseil analysis
EU28 EU28
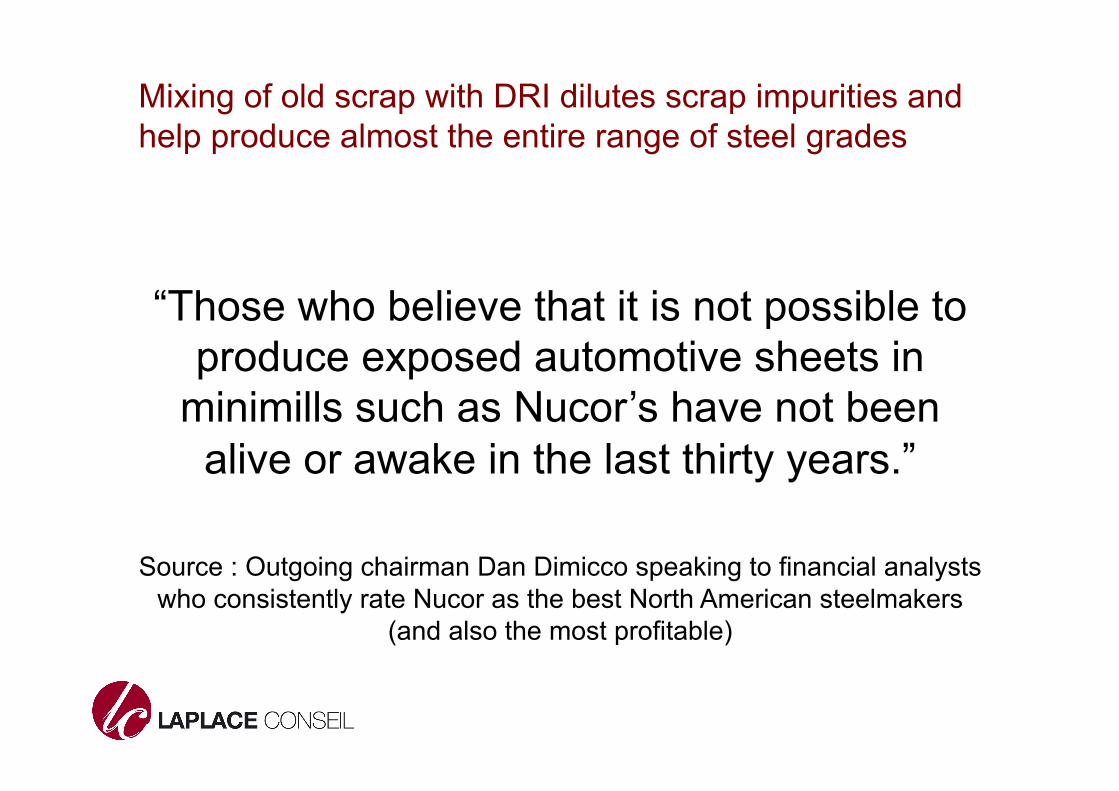
Mixing of old scrap with DRI dilutes scrap impurities and help produce almost the entire range of steel grades
“Those who believe that it is not possible to produce exposed automotive sheets in
minimills such as Nucor’s have not been alive or awake in the last thirty years.”
Source : Outgoing chairman Dan Dimicco speaking to financial analysts
who consistently rate Nucor as the best North American steelmakers (and also the most profitable)
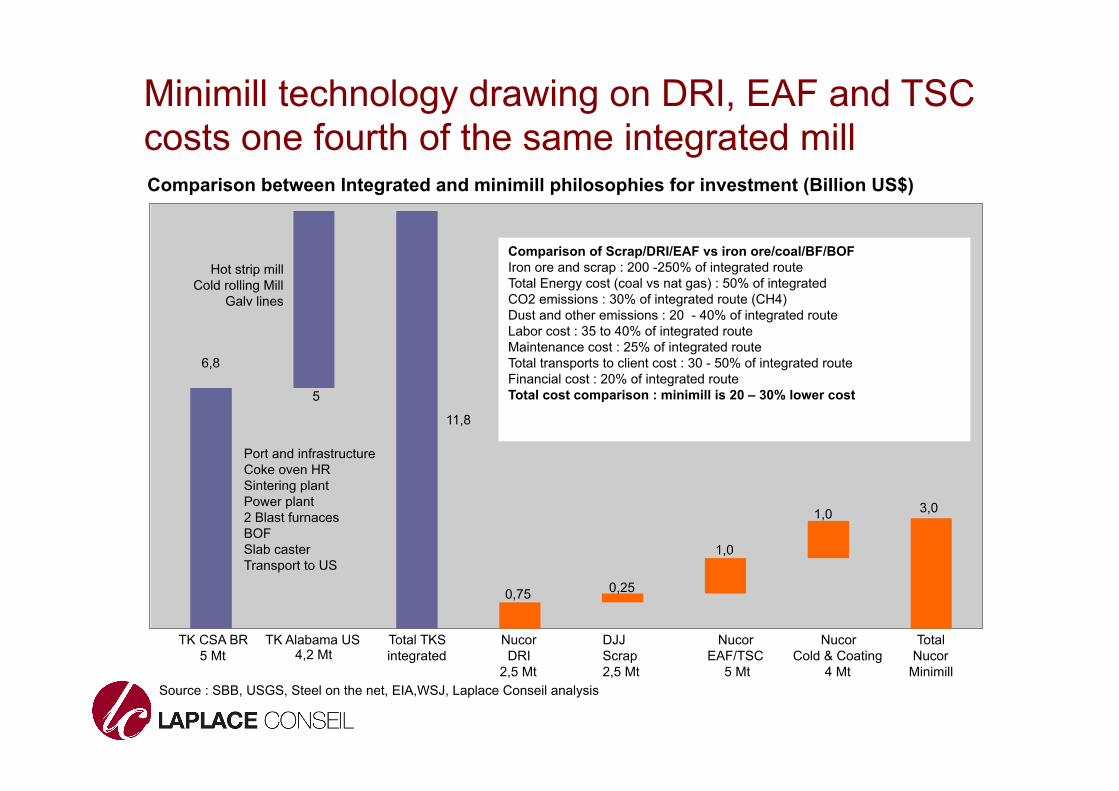
Minimill technology drawing on DRI, EAF and TSC costs one fourth of the same integrated mill
Source : SBB, USGS, Steel on the net, EIA,WSJ, Laplace Conseil analysis
Comparison between Integrated and minimill philosophies for investment (Billion US$)
6,8
11,8
0,75
3,0
5
0,25
1,0
1,0
TK CSA BR 5 Mt
TK Alabama US 4,2 Mt
Total TKS integrated
Nucor DRI
2,5 Mt
DJJ Scrap 2,5 Mt
Nucor EAF/TSC
5 Mt
Nucor Cold & Coating
4 Mt
Total Nucor
Minimill
Port and infrastructure Coke oven HR Sintering plant Power plant 2 Blast furnaces BOF Slab caster Transport to US
Hot strip mill Cold rolling Mill
Galv lines
Comparison of Scrap/DRI/EAF vs iron ore/coal/BF/BOF Iron ore and scrap : 200 -250% of integrated route Total Energy cost (coal vs nat gas) : 50% of integrated CO2 emissions : 30% of integrated route (CH4) Dust and other emissions : 20 - 40% of integrated route Labor cost : 35 to 40% of integrated route Maintenance cost : 25% of integrated route Total transports to client cost : 30 - 50% of integrated route Financial cost : 20% of integrated route Total cost comparison : minimill is 20 – 30% lower cost
The paradox :
The EU Scrap/EAF industries : • Produce 42% of all EU crude steel
• Employ 56% of total EU steel and scrap workers
• Generate a trade surplus of 11 B€ vs. a deficit of 19 B€ for BF/BOF
• Consume 22% of energy consumed by the steel sector
• Generate only 15% of the CO2 emitted by the steel sector
• Require 1/3 of the capital costs and maintenance expenditure per tonne produced
• Has to pay 54% of the total cost of EU Steel regulations.
• The scrap industry is now threatened with new regulations and restrictions
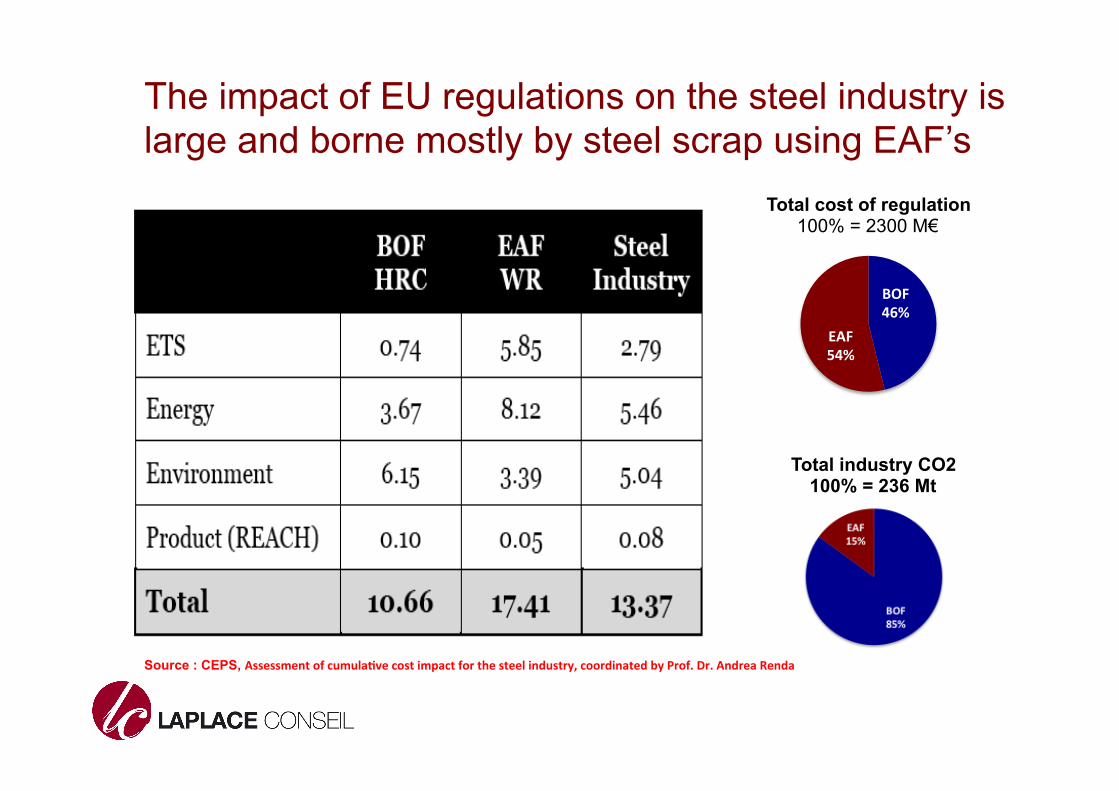
The impact of EU regulations on the steel industry is large and borne mostly by steel scrap using EAF’s
BOF 46%
EAF 54%
Total cost of regulation 100% = 2300 M€
Total industry CO2 100% = 236 Mt
Source : CEPS, Assessment of cumula3ve cost impact for the steel industry, coordinated by Prof. Dr. Andrea Renda
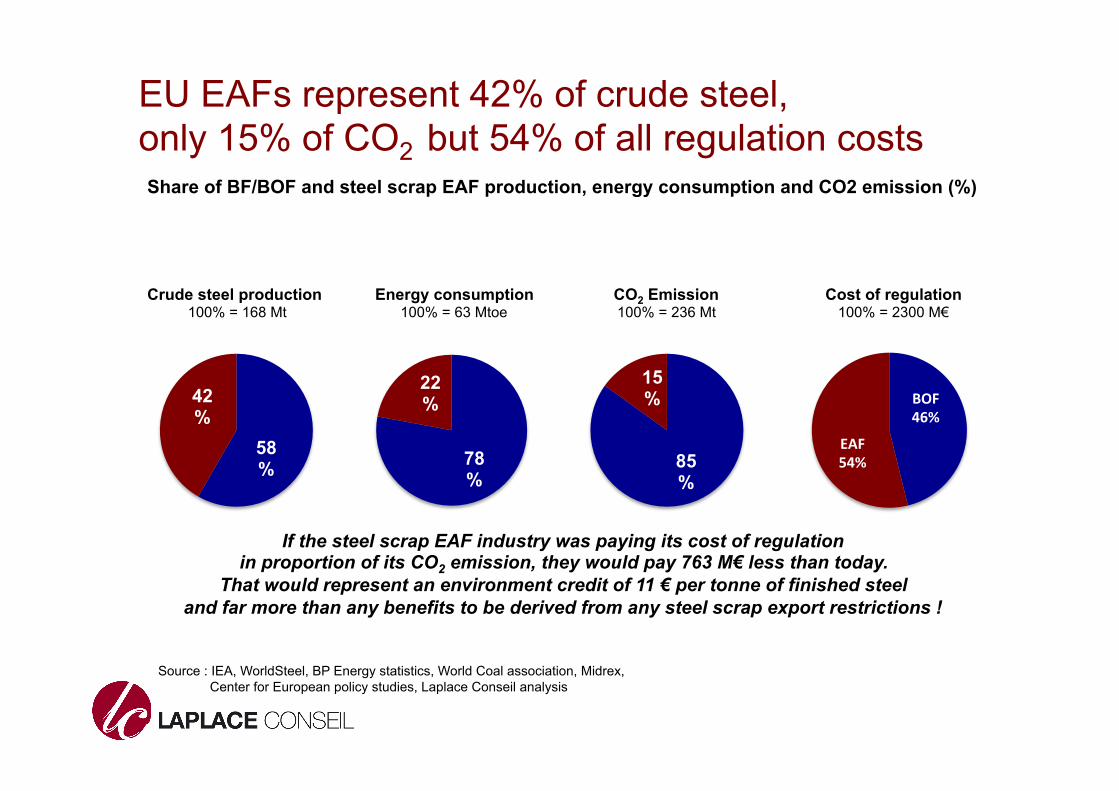
EU EAFs represent 42% of crude steel, only 15% of CO2 but 54% of all regulation costs
58%
42%
78%
22%
85%
15%
Share of BF/BOF and steel scrap EAF production, energy consumption and CO2 emission (%)
Crude steel production Energy consumption CO2 Emission Cost of regulation 100% = 168 Mt 100% = 63 Mtoe 100% = 236 Mt 100% = 2300 M€
Source : IEA, WorldSteel, BP Energy statistics, World Coal association, Midrex, Center for European policy studies, Laplace Conseil analysis
BOF 46%
EAF 54%
If the steel scrap EAF industry was paying its cost of regulation in proportion of its CO2 emission, they would pay 763 M€ less than today.
That would represent an environment credit of 11 € per tonne of finished steel and far more than any benefits to be derived from any steel scrap export restrictions !
Conclusions
Increasing the share of Scrap/EAF achieve the quadruple objectives of :
• Increasing combined employment in the steel and scrap industries
• Reducing energy consumption and CO2 emissions
• Improving the EU balance of trade
• Achieving better profitability for both industries
Thus leading to stronger economical growth and greater societal benefits.
Moreover, the EU proposed regulation would only have detrimental macroeconomic impact.
• First, export restrictions would have a major detrimental impact on the revenue for the scrap collecting and processing industry with a reduction in total revenue close to 18%. This would inevitably lead to a reduction in the 300 000 employees of the industry.
• Second, it would create major uncertainty for buyers and sellers of steel scrap by introducing a disconnection between EU prices and international prices, thus risking a reduction in overal recycling and a reduction in investment to promote sound recycling practices
• Third, it would create a major dispute with Turkey, a solid global ally and one of the largest buyers of steel scrap. The balance of trade between the EU and Turkey is strongly in favor of EU (75 B€ exports vs 48 B€ imports)
• Fourth, it would not help the Southern EAF producers while creating a major loss to Northern and Southern Scrap exporters.
Final remarks • The steel scrap industry and EAF steel makers enjoy a symbiotic
relationship that both parties have an interest in nurturing. • Recycling scrap provides major economic and societal benefits and
may help Europe preserve its industrial base. • The two partners, scrap collectors and EAF steelmakers should
create a stronger alliance to defend their common interests as well as the common good.
• In particular both partners should discuss with the Commission to : – Reduce the cost of existing regulations and avoid creating new
ones that could affect the steel scrap recycling industry. – Allocate the cost of regulations in proportion of CO2 emissions. – Harmonize scrap quality specifications to facilitate trade. – Favor the development of best available technologies in the EU.
Recommended