1
Bullying in the BasqueCountry
PRIMARY EDUCATION
2
Results in PrimaryEducation
FIRST REPORT
www.isei-ivei.net
3
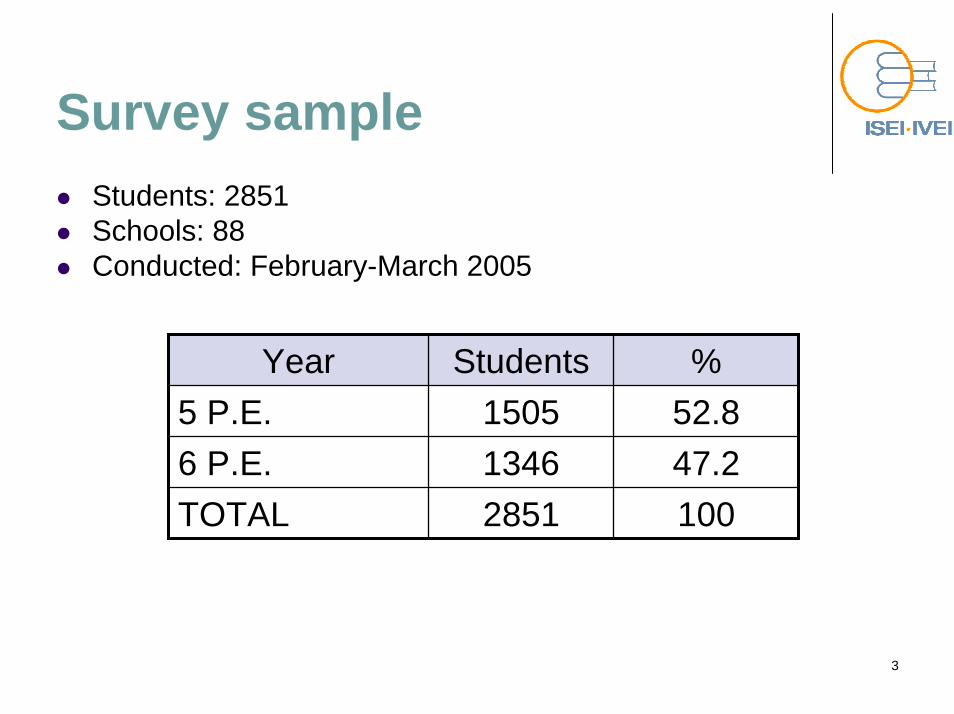
Survey sampleStudents: 2851Schools: 88Conducted: February-March 2005
Year Students %5 P.E. 1505 52.86 P.E. 1346 47.2TOTAL 2851 100
4
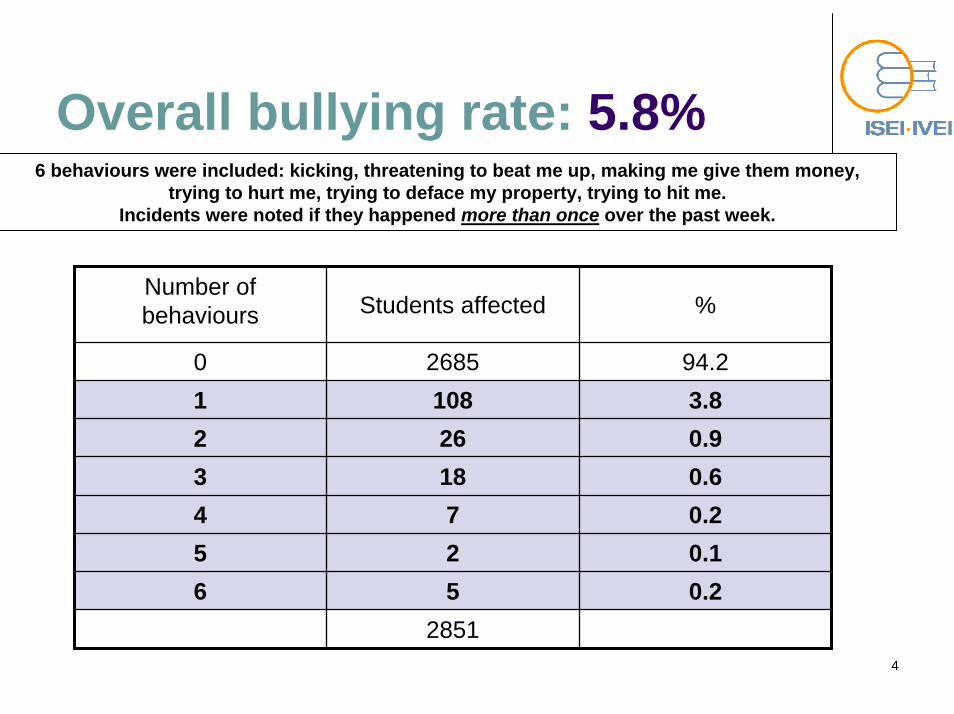
Overall bullying rate: 5.8%6 behaviours were included: kicking, threatening to beat me up, making me give them money,
trying to hurt me, trying to deface my property, trying to hit me.Incidents were noted if they happened more than once over the past week.
Number ofbehaviours Students affected %
0 2685 94.21 108 3.82 26 0.93 18 0.64 7 0.25 2 0.1
28516 5 0.2

5
Victims. Bullying rate
6,2
2,06
4,33
2,35
5,515,5
0
1
2
3
4
5
6
7
5th PE 6th PE 1st SE 2nd SE 3rd SE 4th SE
YEAR
Primary mean
Second. mean

6
More in 6th and more psychological intimidationThe bullying rate goes up in the last years of Primary Education and drops in Secondary. The greatest incidence occurs in the 6th year of Primary.Studies showing data by year or age, for comparison purposes, are hard to come by. A study of English Primary schools puts the rate at 10% (Whitney&Smith 1993). Most studies combine Primary and Secondary.As we will see, psychological abuse is much more common than physical abuse in both Primary and Secondary Education, but it is harassment nonetheless.

7
Witness rates(% often +always)
Frequency of incidents affecting others
2,3
4,5
4,7
6,6
8,5
15,7
16,6
17,4
23
32,2
33,9
36,1
48,6
1,6
3,8
3,3
9,6
12,9
22,6
20,2
24,2
18,6
19,4
49,4
49,4
55,3
0 10 20 30 40 50 60
Threatining wiht sticks/weapons
Forcing aginst w ill
Sexual harassement
Defacing belongings
Stealing belongings
Ignoring
Frightening wiht threats
Hiding belongings
Excluding
Hitting
Name-calling
Gossiping
Insulting
Secondary
Primary
The “hitting” rate is very different between Primary and Secondary Education.

8
Victim rates( % often +always)
Frequency of incidents affecting me
8,47,1
5,93,3
3,23,1
2,42,3
1,71,4
1,11,0
5,54,5
4,91,2
1,91,8
1,61,3
1,70,8
0,60,4
0,3 0,6
0 1 2 3 4 5 6 7 8 9 10
Name-calling or making funInsulting
GossipingHitting
ExcludingHiding belongings
Frightening with threatsIgnoring
Stealing belongingsDefacing belongingsSexual harassmentForcing against w ill
Threatening with sticks/weapons
PRIMARY
SECONDARY
Name-calling, insultingand hitting are verydifferent betweenPrimary and SecondaryEducation.
9
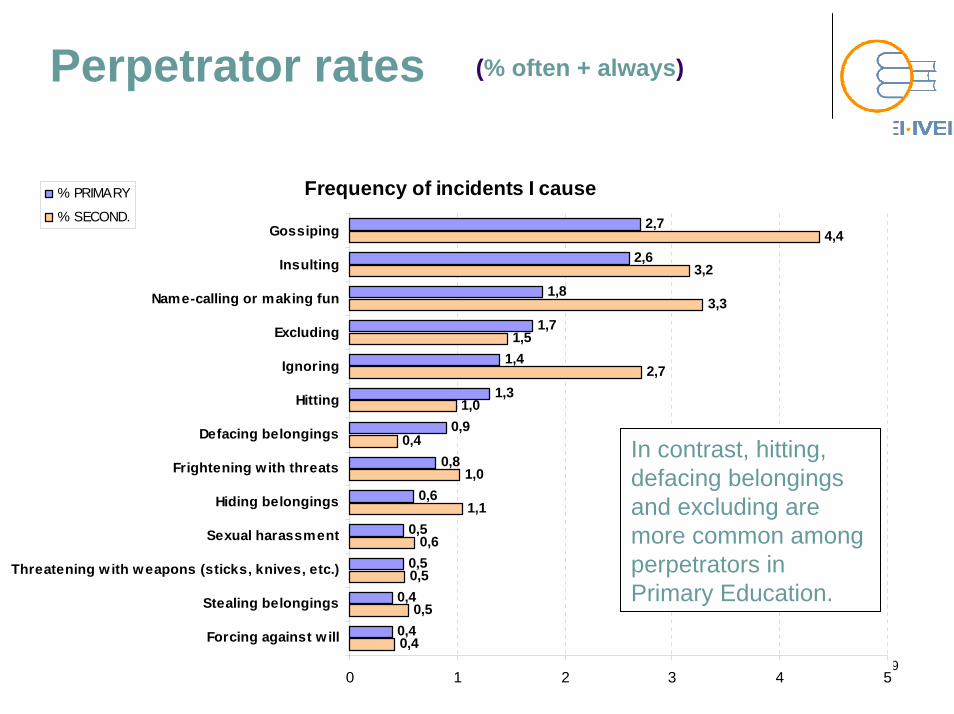
Perpetrator rates (% often + always)
Frequency of incidents I cause 2,7
2,6
1,8
1,7
1,4
1,3
0,9
0,8
0,6
0,5
0,5
0,4
0,4
4,4
3,2
3,3
1,5
2,7
1,0
0,4
1,0
1,1
0,6
0,5
0,5
0,4
0 1 2 3 4 5
Gossiping
Insulting
Name-calling or making fun
Excluding
Ignoring
Hitting
Defacing belongings
Frightening with threats
Hiding belongings
Sexual harassment
Threatening with weapons (sticks, knives, etc.)
Stealing belongings
Forcing against w ill
% PRIMARY
% SECOND.
In contrast, hitting, defacing belongingsand excluding are more common amongperpetrators in Primary Education.
10
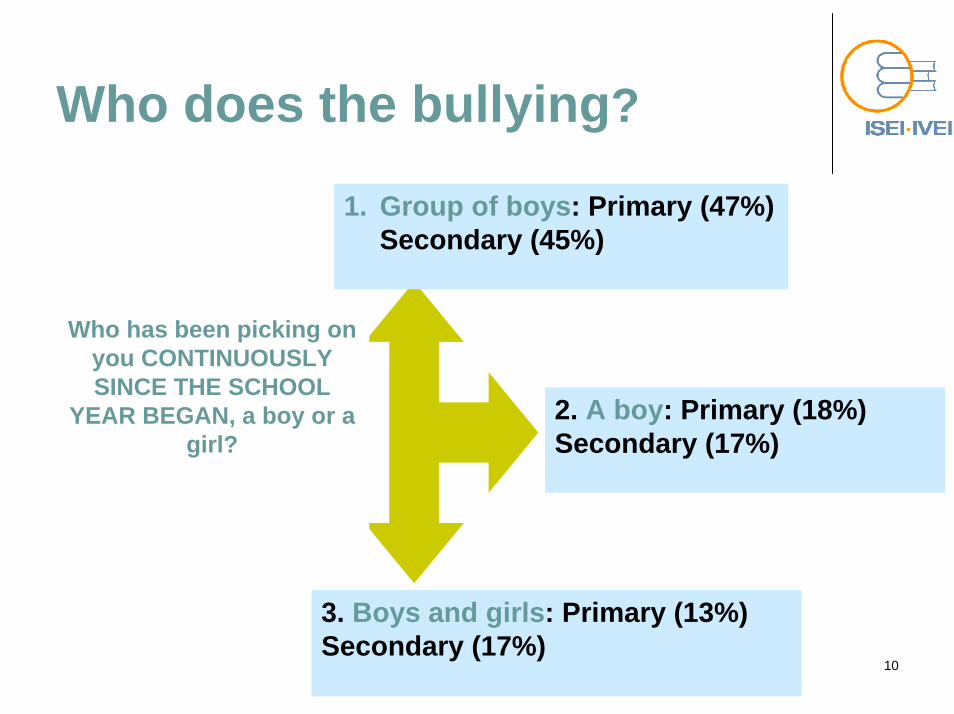
Who does the bullying?
1. Group of boys: Primary (47%) Secondary (45%)
3. Boys and girls: Primary (13%) Secondary (17%)
2. A boy: Primary (18%) Secondary (17%)
Who has been picking onyou CONTINUOUSLY SINCE THE SCHOOL
YEAR BEGAN, a boy or a girl?

11
Where are the bullies?1. In my class Primary (59%)
Secondary (60%)
In what GRADE is theperson who has picked on
you CONTINUOUSLY SINCE THE SCHOOL
YEAR BEGAN?
2. He/she is not in my class butis in my grade Primary (16%)Secondary (16%)
3. In an upper grade Primary (13%)Secondary (10%)
12
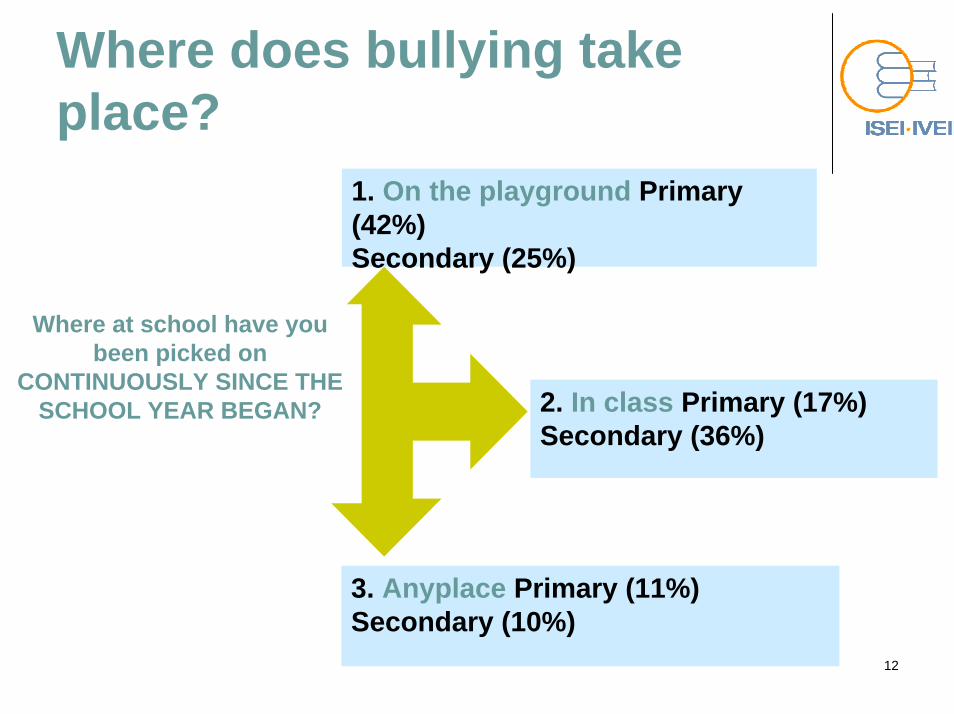
Where does bullying takeplace?
2. In class Primary (17%)Secondary (36%)
1. On the playground Primary(42%)Secondary (25%)
Where at school have youbeen picked on
CONTINUOUSLY SINCE THE SCHOOL YEAR BEGAN?
3. Anyplace Primary (11%)Secondary (10%)

13
Fear of going to school.
Have you been afraid to go to school?
63.9
31.6
3.3 1.20
10
20
30
40
50
60
70
Never Sometimes Often Almost every day
14
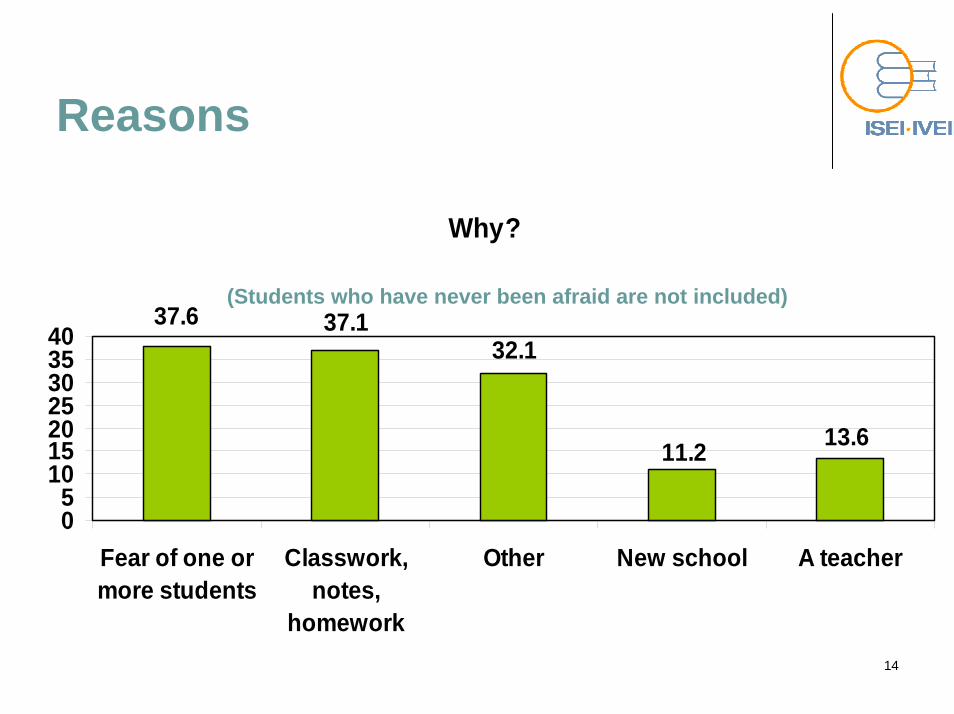
Reasons
Why?
37.6 37.132.1
11.2 13.6
05
10152025303540
Fear of one ormore students
Classwork,notes,
homework
Other New school A teacher
(Students who have never been afraid are not included)
15
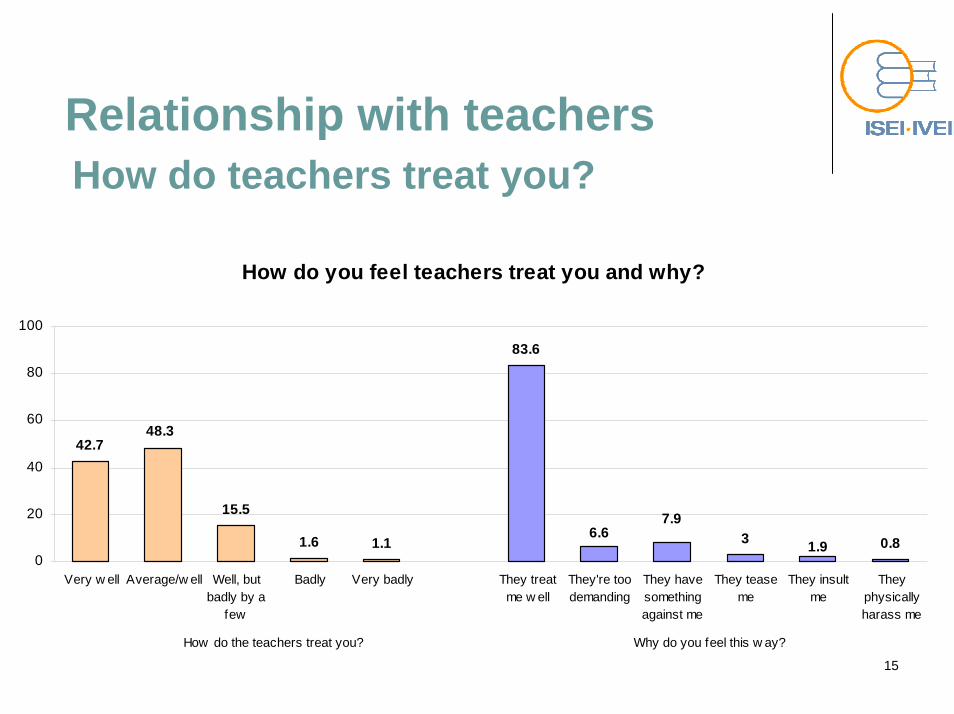
Relationship with teachersHow do teachers treat you?
How do you feel teachers treat you and why?
3 0.81.9
83.6
1.11.6
15.5
42.748.3
7.96.6
0
20
40
60
80
100
Very w ell Average/w ell Well, butbadly by a
few
Badly Very badly They treatme w ell
They're toodemanding
They havesomethingagainst me
They teaseme
They insultme
Theyphysicallyharass me
How do the teachers treat you? Why do you feel this w ay?

16
Who do students talk to when they are victims of bullying?
Who do students talk to?(percent of students who feel harassed)
51,746,7
60
18,414,3
0
20
40
60
80
No one picks on me Friends Family Teachers Nobody
.
17
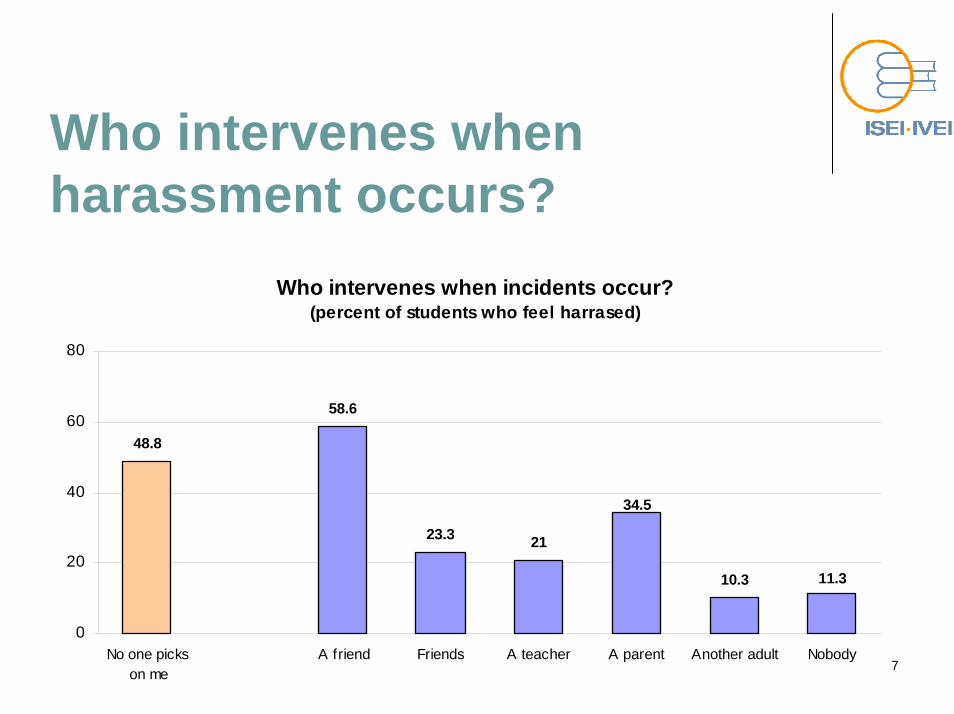
Who intervenes whenharassment occurs?
Who intervenes when incidents occur?(percent of students who feel harrased)
21
48.8
58.6
23.3
10.3
34.5
11.3
0
20
40
60
80
No one pickson me
A friend Friends A teacher A parent Another adult Nobody
18
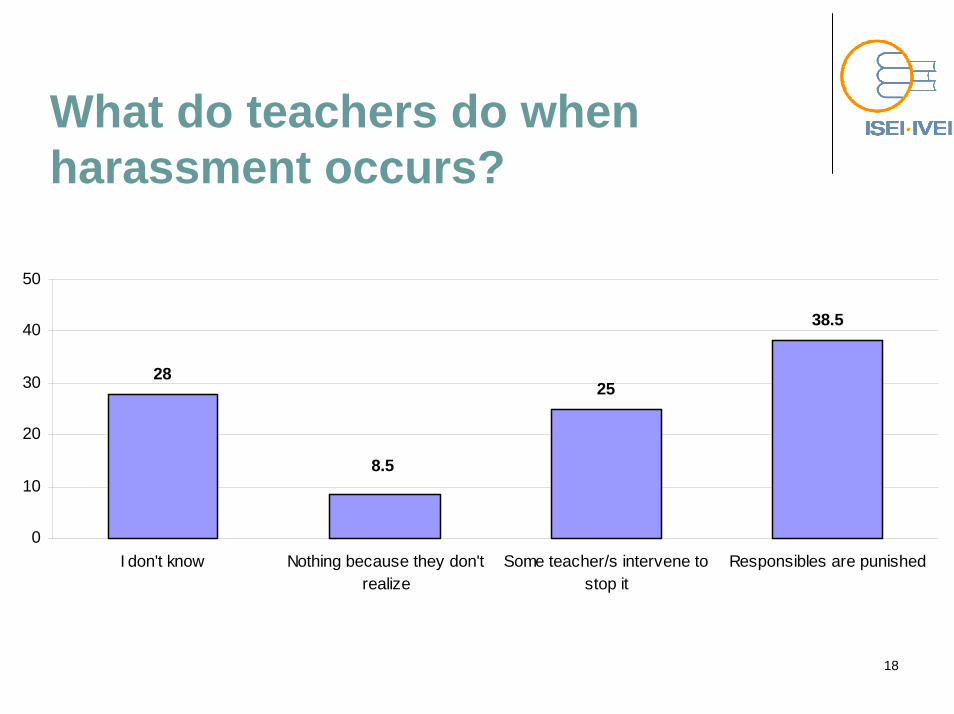
What do teachers do whenharassment occurs?
2825
38.5
8.5
0
10
20
30
40
50
I don't know Nothing because they don'trealize
Some teacher/s intervene tostop it
Responsibles are punished

19
Victims. Bullying rateGender
5.56.1
0
1
2
3
4
5
6
7
Boys Girls
Mean
20
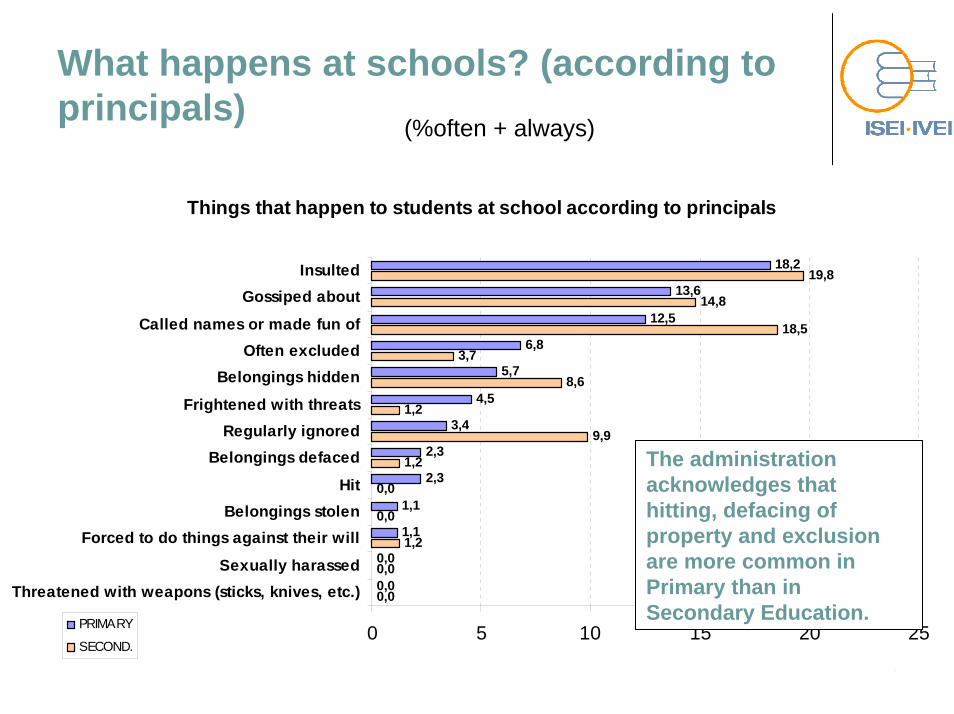
What happens at schools? (according toprincipals) (%often + always)
Things that happen to students at school according to principals
18,2
13,6
12,5
6,8
5,7
4,5
3,4
2,3
2,3
1,1
1,1
0,0
0,0
19,8
14,8
18,5
3,7
8,6
1,2
9,9
1,2
0,0
0,0
1,2
0,0
0,0
0 5 10 15 20 25
InsultedGossiped about
Called names or made fun ofOften excluded
Belongings hidden
Frightened with threatsRegularly ignored
Belongings defaced
HitBelongings stolen
Forced to do things against their will
Sexually harassedThreatened with weapons (sticks, knives, etc.)
PRIMARY
SECOND.
The administrationacknowledges thathitting, defacing ofproperty and exclusionare more common in Primary than in Secondary Education.
21
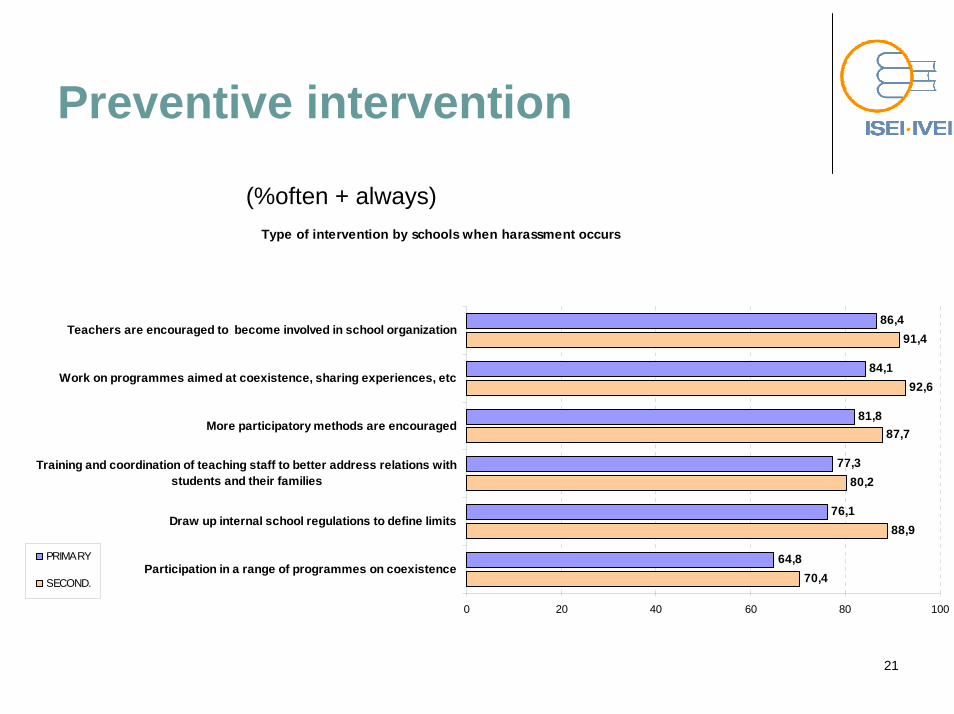
Preventive intervention
Type of intervention by schools when harassment occurs
70,4
88,9
80,2
87,7
92,6
91,4
64,8
76,1
77,3
81,8
84,1
86,4
0 20 40 60 80 100
Participation in a range of programmes on coexistence
Draw up internal school regulations to define limits
Training and coordination of teaching staff to better address relations withstudents and their families
More participatory methods are encouraged
Work on programmes aimed at coexistence, sharing experiences, etc
Teachers are encouraged to become involved in school organization
PRIMARY
SECOND.
(%often + always)

22
How do schools react? ( %often + always)
Intervention by schools when harassment occurs
93,2
83,0
69,3
55,7
36,4
34,1
14,8
6,8
4,5
1,1
0,0
75,3
77,8
85,2
72,8
54,3
66,7
8,6
13,6
19,8
1,2
1,2
0 20 40 60 80 100
Discuss the matter privately with people involved
Discuss the situation in class
Discuss the situation with the family
Inmediate action is taken by administration
Case referred to the Guidance Dept.
Report written up
External expert support is asked for
Disciplinary action brought before School Board
Responsibles are expelled
Incident is ignored
Police calledPRIMARYSECOND.
Perpetrators are talked to more in Primary school and the subject isdiscussed in class.

23
SummaryThe bullying rate is 5.8%.Students in their 6th year of Primary Education suffermore harassment than in 5th. Thr rate goes downstarting in 6th. 14.3% of victims among students don’t tell anyone.Percentages of peer harassment are higher as ‘witness’than as ‘victim’ or ‘perpetrator’.The main perpetrators are “groups of boys” and most of them are in the same class as the victim.Bullying occurs mainly on the playground.Friends and family members intervene the most whenharassment occurs.
Recommended