What is Mathematical Modeling?
At NCSSM, we consider a mathematical
experience in which students make choices
about how to use mathematics to create
representations of a real-world process to
be a form of mathematical modeling.
Modeling is the process of creating
representations (models) that help us
understand a phenomenon while using
mathematical concepts and the principles
and language of mathematical symbolism.

What is Mathematical Modeling?
“Mathematical Modeling is when you use
mathematics to understand a situation in
the real world, and then perhaps use it to
take action or even to predict the future,
and where both the real world situation and
the ensuing mathematics are taken
seriously.”
“What is Mathematical Modeling”.
H. Pollak, Teachers College, Columbia University.

Is it Modeling?
Are the students remembering?
or
Are the students thinking?

The Modeling Cycle
From SIAM Modeling Getting Started and Getting Solutions Handbookhttps://m3challenge.siam.org/resources/modeling-handbook

A Note about Modeling
For students to develop their mathematical
modeling skills, it is important for them to
be free to make decisions and try new ideas
at each stage in the modeling process.
Students, not their teachers, need to make
important decisions about where to focus
their attention, how to proceed, and, later
in the process, how to evaluate or assess
their models.
Students’ decisions and their own creativity
drive the modeling process.

“Frustration is often a first reaction on the part of students. For many, their past mathematics classroom experiences have led them to believe that when given a problem, they are supposed to be able to immediately search for, identify and apply the correct procedure. Thus, when they are unable to identify a particular procedure right away, they feel the problem is unfair, or that the teacher has poorly prepared the students for the task. . . .
Further, many students and teachers find it difficult to tolerate the inefficient approaches and wrong directions that typically surface early in the modeling episodes.”
Zawojewski, Judith S., Richard A. Lesh, and Lyn D. English. “A Models and Modeling Perspective on the Role of Small Group Learning Activities.” In Beyond Constructivism: Models and Modeling Perspectives on Mathematics Problem Solving, Learning, and Teaching, edited by Richard Lesh and Helen M. Doerr, pp. 337–58. Mahwah, N.J.: Lawrence Erlbaum Associates, Inc., 2003.
An Obstacle to Success

Ease in to Modeling
Incorporating smaller problems that require students to think and struggle is beneficial in its own right.
This also helps prime the students for more extensive modeling in the future.
One way this can be done is by giving students problems to work on before showing them a new technique.
Another approach can be to take away some details of a problem so that they must make decisions about what information they need.

Running Data
During a run through Durham, the following data were collected:

Running Data
Instead of asking a Calculus class “What is the average speed of the runner between 𝑡 = 0 and 𝑡 = 7: 21?”,
I ask “What questions could we explore with this data?”
Some questions generated were:
• How did the speed change on inclines/declines?
• What was the runner’s pace?
• How did speed vary over the run?
• How fast was the runner going at some particular time?
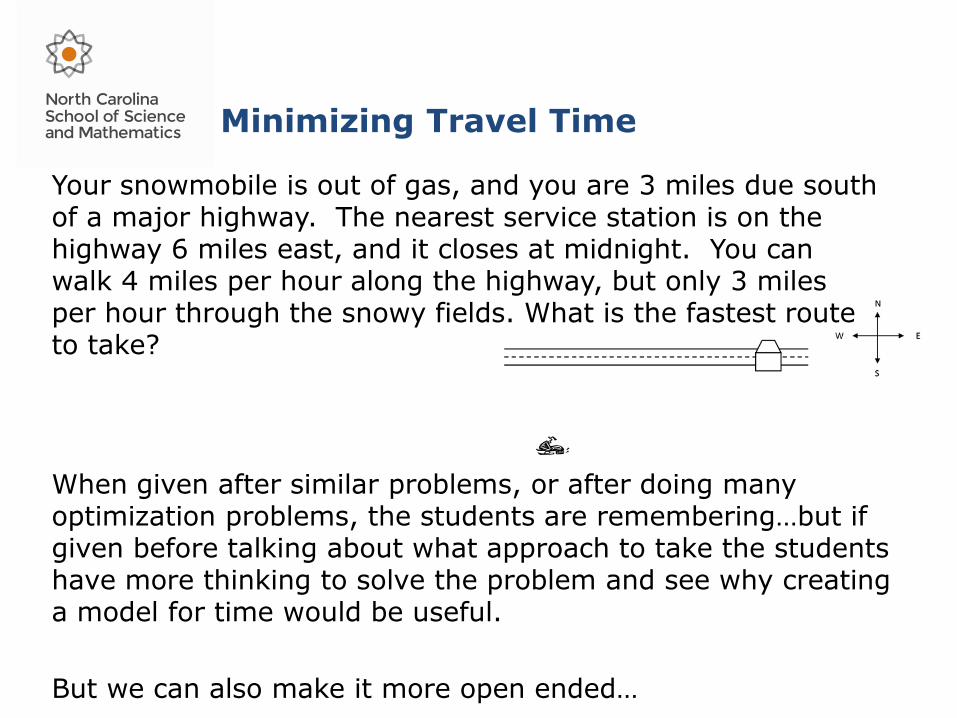
Minimizing Travel Time
When given after similar problems, or after doing many optimization problems, the students are remembering…but if given before talking about what approach to take the students have more thinking to solve the problem and see why creating a model for time would be useful.
But we can also make it more open ended…
Your snowmobile is out of gas, and you are 3 miles due south of a major highway. The nearest service station is on the highway 6 miles east, and it closes at midnight. You can walk 4 miles per hour along the highway, but only 3 miles per hour through the snowy fields. What is the fastest route to take?

Minimizing Travel Time – A variation
It is well known that hilly/rocky terrain slows one’s walking speed (common estimates specify that the average walking speed is about 3 miles in an hour on level ground with an extra hour added in for each 2000 feet of elevation). Suppose a hiker is walking along elevated terrain toward a level road. The hiker is 3 miles due south of the road and traveling toward a rest area that is 6 miles east along the road. Assume the hiker can travel 3 mph on the road. Explore how different slower speeds through the elevated terrain will affect her optimal path.
𝑇 =9 + 6 − 𝑟 2
𝑘+
𝑟
3, 0 ≤ 𝑟 ≤ 6
where 𝑘 = speed through elevated terrain
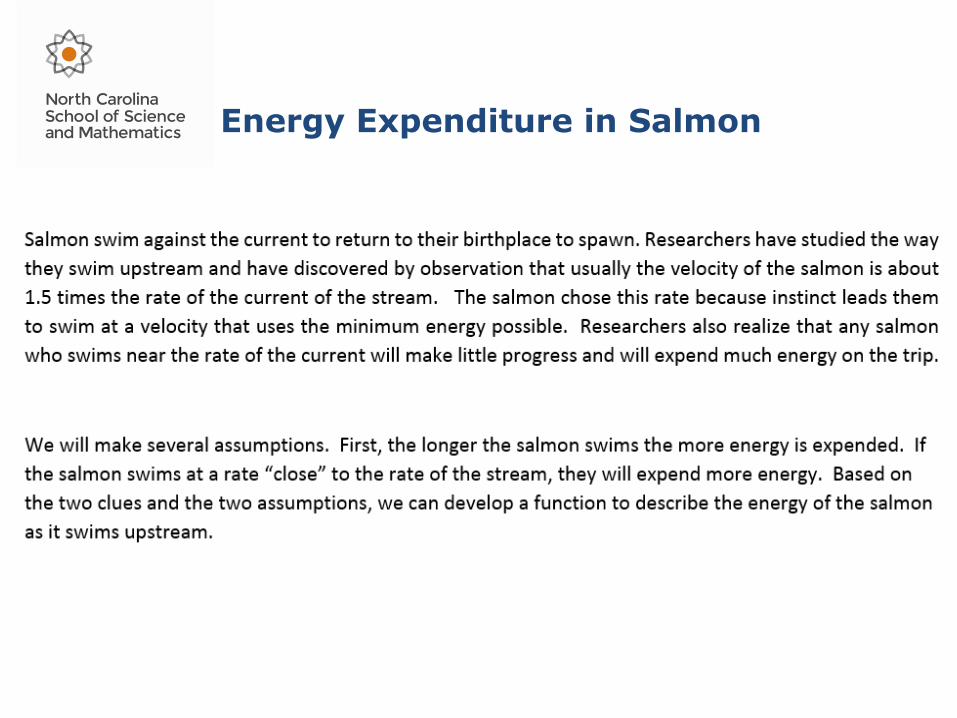
Energy Expenditure in Salmon

Energy Expenditure in Salmon

Energy Expenditure in Salmon
Simplest with 𝑣 − 𝑟 in the denominator: 𝐸 𝑣 =1
𝑣−𝑟
This doesn’t work due to incorrect long term behavior…
Next effort: 𝐸 𝑣 =𝑣
𝑣−𝑟
This doesn’t work since this function will not have a local minimum.
Then we can explore 𝐸 𝑣 =𝑣𝑝
𝑣−𝑟for various values of 𝑝.
Through exploration or using calculus we find that 𝑝 = 3 gives the minimum at the correct location.

A Teacher’s Role in Modeling
A teacher’s first job in the modeling
process, is offering appropriate problems.
The social and biological sciences offer
many nice problems that do not require a
technical background. The modeling
process will go more smoothly if you begin
by engaging the students in the problem in
some way such as with discussion, videos,
or simulation.
The students’ experiences or lack of
experience with open ended modeling
problems will affect the problem choices.

A Teacher’s Role in Modeling
Throughout the modeling activity, the
teacher is listening to their ideas and asking
questions that might cause them to rethink
their approach.
Students may need suggestions about a
new direction to try, encouragement to
continue pursuing their current approach,
or nudging to abandon an unproductive
strategy.

Mantids & Modeling
Some modeling activities are tightly
focused, giving students limited ability to
“go their own way” as they create a solution
to a problem, but decisions must be made.
These work well for students with limited
experience in modeling.
In the Mantid problem, modeling comes in
the form of choosing appropriate functions
to represent data, as well as making
decisions about how to combine and
transform functions.

Satiation
(cg)11 18 23 31 35 40 46 53 59 66 70 72 75 86 90
Reaction Distance
(mm)65 52 44 42 34 23 23 8 4 0 0 0 0 0 0
Reaction Distance vs. Satiation
We will make a scatter plot of the data to determine what type of function will best fit the data.
http://betterlesson.com/community/lesson/547204/the-math-of-mantids-a-math-lesson-involving-functions-graphing-and-bugs

Reaction Distance vs. Satiation

Finding a Model
The function below models the relationship between Satiation (S) and the Reaction Distance (R) a mantid will travel for food.
𝑅 𝑆 = −1.24𝑆 + 76.26 if 0 ≤ 𝑆 < 61.5
0 if 𝑆 ≥ 61.5
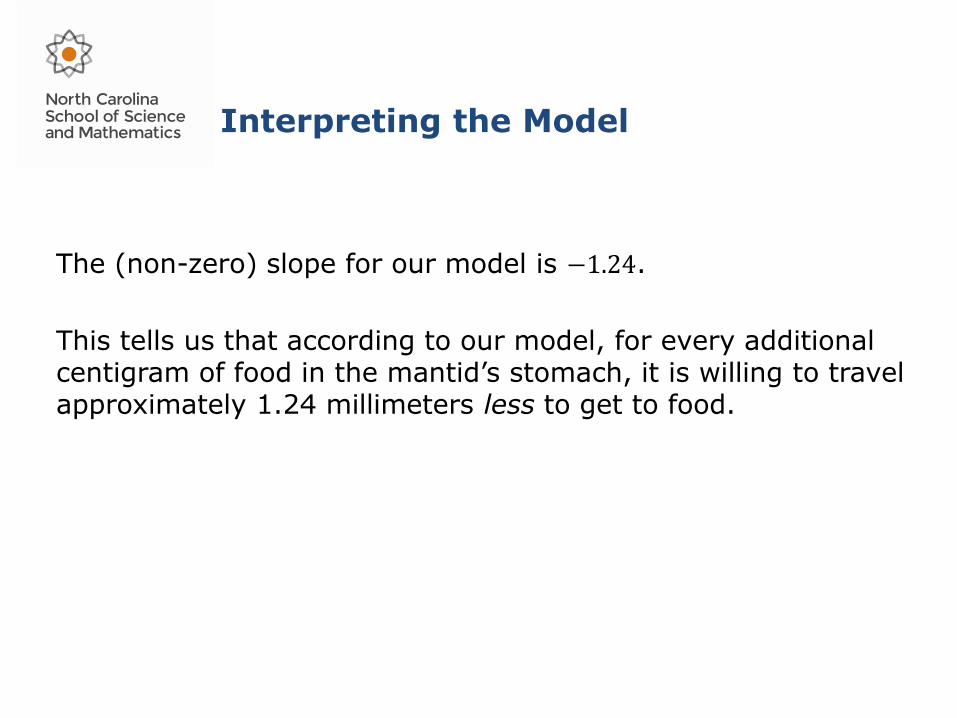
Interpreting the Model
The (non-zero) slope for our model is −1.24.
This tells us that according to our model, for every additional centigram of food in the mantid’s stomach, it is willing to travel approximately 1.24 millimeters less to get to food.

Satiation vs. Time
Time
(hr)0 1 2 3 4 5 6 8 10
Satiation (cg) 94 90 85 82 88 83 70 66 68
Time
(hr)12 16 19 20 24 28 36 48 72
Satiation (cg) 50 46 51 41 32 29 14 17 8
We will again make a scatter plot of the data to determine what type of function will fit best.

Satiation vs. Time

Finding a Model
The biologists assume that the mantid will digest a fixed percentage of the food in its stomach each hour. That information, together with the graph, tells us that an exponential function should be a good fit.
Through investigation, we find the following function models this behavior well:
𝑺 = 𝟎. 𝟗𝟔𝑻 ⋅ 𝟗𝟒, where 𝑇 is the number of hours since the mantidhas filled its stomach and 𝑆 is its satiation in cg.
Notice that 0.96 is the percentage of food in the mantid’sstomach and 94 represents the initial satiation.

Combining the Models
Notice the relationship between our two functions:
𝑅 𝑆 = −1.24𝑆 + 76.26 𝑖𝑓 0 ≤ 𝑆 < 61.5
0 𝑖𝑓 𝑆 ≥ 61.5
𝑆 𝑇 = 0.96𝑇 ⋅ 94
The output for the second is the same quantity as the input for the first.
We can write a function for Reaction Distance in terms of time as a composition of functions.
The non-zero part is:
𝑅 𝑆 𝑇 = −1.24 ⋅ 0.96𝑇 ⋅ 94 + 76.26
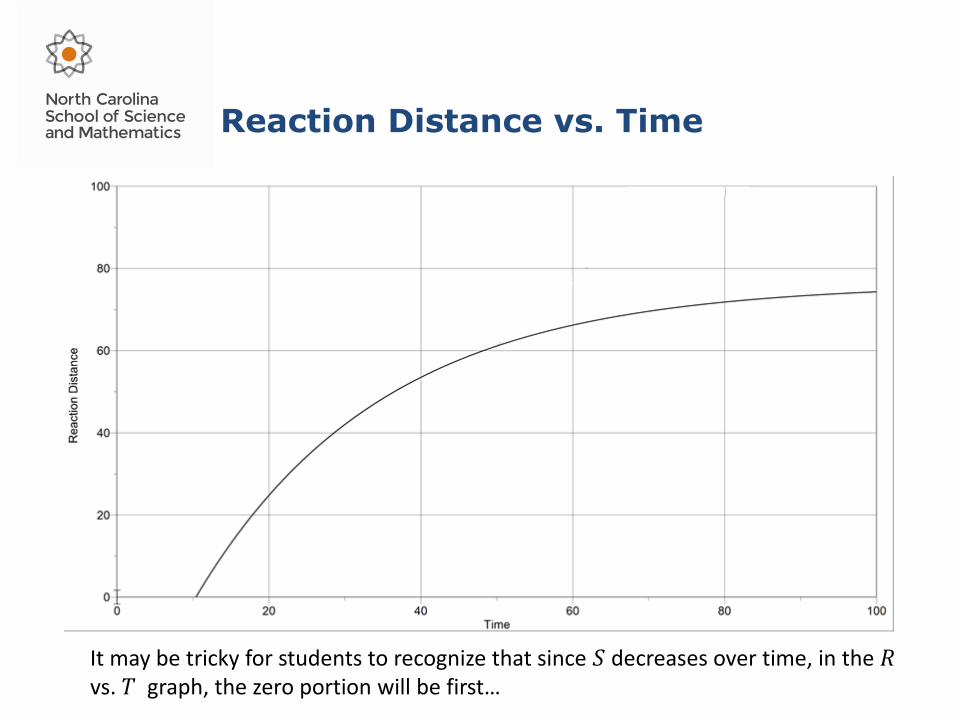
Reaction Distance vs. Time
It may be tricky for students to recognize that since 𝑆 decreases over time, in the 𝑅vs. 𝑇 graph, the zero portion will be first…

Driving for Gas
Every driver recognizes the fluctuations in
gas prices that happen almost on a weekly
basis. Is it worth the drive across town for
less expensive gas?
If you know the locations and the prices at all gasoline stations, at which station should you buy your gas?
Create an App that would allow users to choose the best gas station to visit.
This problem is a variation on a problem developed for class use by Landy Godbold (Westminster School in Atlanta).
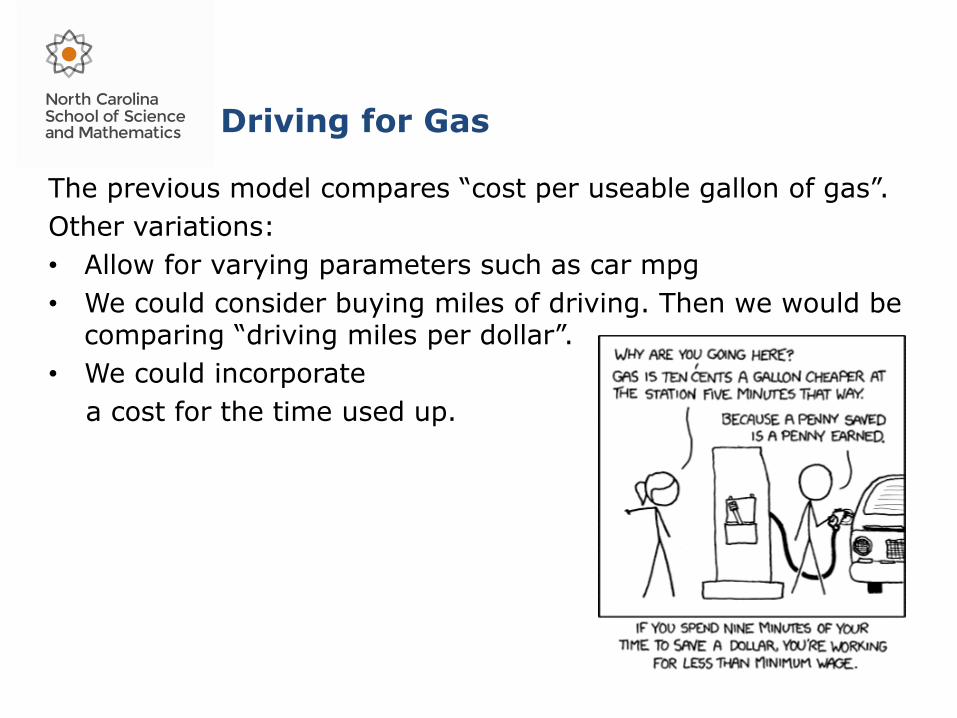
Image from xkcd.com

Driving for Gas
Advanced students should be able to refine the problem on their own to create a more clearly defined question to answer. For beginning students, the teacher will need to formulate the problem in a more tractable and clean form.
For example:
You drive to school every day. On the route you take from home to school, there are several gas stations. Unfortunately, the prices on your route are always high. A friend tells you she buys her gas at a station several miles off your normal route where the prices are cheaper. Would it be more economical for you to drive the extra distance for the less expensive gas than to purchase gas along your route?

Driving for Gas
We encourage our students to create a small, specific version of the problem and try to answer the question about that specific model. This special case will help the students clarify the problem, determine the important variables, and suggest approaches that could be useful for the general case. One example of such a problem is:
Suppose there is a station on your normal route that sells gas for $3.50 a gallon. A station 5 miles off your route sells gas for $3.35 a gallon. Should you travel the extra distance to buy gas at that station?

Driving for Gas
Why wouldn’t we drive the five miles to buy cheaper gas? If we changed the problem so that the cheap gas is 50 miles away, we can quickly see that we would use up the money we saved in purchasing the less expensive gas by driving to the station. This tells us that the number of miles per gallon (mpg) of our car gets driving in town would be an important factor, and suggests that the answer to the question might be different for two students who drive different cars.
The student driving an SUV getting 15 mpg might be less likely to drive the 10 miles (5 miles out to the station and 5 miles back to your route) than a student driving a small car getting 40 mpg. We now have a more refined problem on which we can work.

Driving for Gas
• Let 𝑃∗ represent the price per gallon at the station along our route and 𝑃 the price per gallon at the station we are considering.
• Let 𝐷 represent the distance in miles from the normal route that must be driven to get to the gas station.
• Let 𝑀 represent the miles per gallon of the car you drive along the route to the gas station.
• Let 𝑇 represent the number of gallons of gas we purchase when we buy gas.
One possible metric we can use to compare gas stations is:𝑇 ⋅ 𝑃
𝑇 −2𝐷𝑀
< 𝑃∗
Driving for Gas
The previous model compares “cost per useable gallon of gas”.
Other variations:
• Allow for varying parameters such as car mpg
• We could consider buying miles of driving. Then we would be comparing “driving miles per dollar”.
• We could incorporate
a cost for the time used up.

Choosing Problems
If you have a good problem and want to
tailor it to a group of students consider
whether it is best to:
Scaffold – give more direction to help
beginning modelers avoid the frustration
Scale – help the students make simplifying
assumptions that scale the problem down,
making the problem easier to approach
Save – if neither of those will work,
consider saving the problem for later in the
students’ modeling education

A Teacher’s Role in Modeling
Having students share their results either
written or orally can be an effective way to
more formally assess the work of modeling.
Asking the students to focus their
writing/reflection on the process of
modeling is useful for helping students
become more proficient on future modeling
experiences.

A Teacher’s Role in Modeling
Writing about and/or presenting models and
results provides its own set of challenges
for high school students.
The students will need guidance as to how
to present their findings in a way that will
be understandable to someone who has not
been a part of the idea development.

A Teacher’s Role in Modeling
When projects are turned in, the teacher
needs to read the project from the student’s
point of view. Given their approach, what
did they do well and what could they have
done better? Can you repeat the process
they used? Did they see the strengths and
weaknesses of their model? Did they test
their model in some way?
Providing instructive feedback will help to
improve the quality of their work and their
writing.

Learning More about Modeling
Check out NCTM’s Annual Perspectives
on Mathematics Education 2016 for
more information and insight on
mathematical modeling.
Our chapter “Moving From Remembering to
Thinking: The Power of Mathematical
Modeling” contains more examples of how
NCSSM has used modeling in our courses.
http://www.nctm.org/Store/Products/Annual-
Perspectives-in-Math-Ed-2016--Mathematical-
Modeling/
Recommended