Justin ChalonerAlexandra DreisinMark Pragnell
AN ECONOMIC APPRAISALEvaluating the economic case for building 100,000 new social rent homes each yearA report by Capital Economics for SHOUT and the National Federation of ALMOs | June 2015
B U I L D I N GN E W S O C I A L
R E N T H O M E S

2 | BUILDING NEW SOCIAL RENT HOMES
This report has been commissioned by SHOUT and the National Federation of ALMOs. The views expressed remain those of Capital Economics and are not necessarily shared by SHOUT, the National Federation of ALMOs or their respective member organisations or sponsors. Likewise, Capital Economics does not necessarily share the views of those who have commissioned this report. While every effort has been made to ensure that the data quoted and used for the research behind this document is reliable, there is no guarantee that it is correct, and Capital Economics Limited and its subsidiaries can accept no liability whatsoever in respect of any errors or omissions. This document is a piece of economic research and is not intended to constitute investment advice, nor to solicit dealing in securities or investments.
A number of organisations have generously supported the commissioning of this report and SHOUT’s wider work:
Bushbury Hill Estate Management Board; Campbell Tickell; Coast & Country; Contour Homes; EMH Group; Endeavour Housing Association/North Star Group; Grand Union Housing Group; Human City Institute; Leeds and Yorkshire Housing Association; Leicestershire & Rutland Tenant Participation Forum; Liverpool Housing Trust; Luminus Group; Riverside; Soha Housing; South Liverpool Homes; South Yorkshire Housing Association; Thrive Homes; and Wellingborough Homes.
D I S C L A I M E R
A report by Capital Economics for SHOUT and the National Federation of ALMOs | 3
C O N T E N T S
31IMPACT OF
100,000 NEW SOCIAL RENT HOMES
EACH YEAR
61APPENDIX:
SENSITIVITY TESTS
39SOCIAL HOUSING AND AUSTERITY
68CONTACT
DETAILS
14HOUSING TENURE AND THE BENEFITS BILL
20THE BUSINESS CASE FOR NEW SOCIAL HOUSING
44BROADER KNOCK-ON SOCIAL WELFARE BENEFITS
47APPENDIX: ADDITIONAL ANALYTICAL DETAIL
7INTRODUCTION
4EXECUTIVE SUMMARY

4 | BUILDING NEW SOCIAL RENT HOMES
Capital Economics has been commissioned by SHOUT and the National Federation of ALMOs to evaluate the fiscal and economic impacts of additional social housing development funded in part
through a larger social housing grant programme.
E X E C U T I V E S U M M A R Y

A report by Capital Economics for SHOUT and the National Federation of ALMOs | 5
Currently, more and more low-income families are being housed in the private rented sector at an increasing cost to the welfare system, while the number of dwellings available on a lower cost social rent tenure is falling. The current allocation of public expenditure to housing does not take into account the future costs to the welfare system of meeting higher rents in the private rented sector and ‘affordable rent’ social housing. It is therefore a form of fiscal myopia: saving pennies in the short term only to waste pounds in the future.
From our analysis, we have a stark and clear finding: the government would achieve better value for taxpayers’ money, as well as improve the living standards of many low-income households, if it were to part fund the delivery of 100,000 new social rent homes each year rather than continue with its existing policy.
There is broad agreement that the rate at which homes are being built is at least 100,000 units lower per annum than is needed to keep pace with rising demand. The misalignment of supply and demand is causing housing costs to become increasingly unaffordable for households across all tenures. This has not always been an issue. From the late 1940s to the mid 1970s, support by government for the construction of social rent homes played a major part in the economy sustaining much higher levels of housing development.
Meanwhile, current housing policy — under which, at best, little housing is being built at traditional social rents, and only very modest levels of build for so-called ‘affordable rent’ is taking place — is unsustainable. Even leaving aside the additional cost to the welfare system of supporting tenants paying affordable rents, the total amount of social housing being built is not matching demand, with the consequence that growing numbers of low-income households live in private landlord properties, typically requiring much higher levels of housing benefit. (See chapter 1.)
The lack of homes for social rent is creating additional strain, not just for households’ finances, but also for the public sector’s £24.4 billion housing benefit bill. On average, tenants in the private rented sector receive £110 per week compared with £89 per week
in the social rented sector. Almost always, taxpayers pay more to families in private rented accommodation than in a social rent tenure. (See chapter 2.)
With an increasing proportion of welfare claimants accommodated privately, the overall bill for housing benefit payments is set to accelerate – worsening the government’s structural deficit now but also into the longer term.
If trends over the past parliament were to continue, total expenditure on housing benefits in the United Kingdom would increase to £197.3 billion by 2065-66, up from £24.4 billion today — with households in the private rented sector accounting for 63 per cent of the total, compared to 37 per cent today.
Investment in new social rent housing offers a solution that is fiscally sustainable and economically efficient.
Increasing the stock of social rent housing — through either acquisition or, most sensibly, new construction — requires investment by social landlords, and some level of upfront contribution from the state. In almost all circumstances, construction of social rent housing is viable economically and fiscally once future savings to the government’s housing benefits bill are taken into account properly. By disbursing grant that permits the building of new social rent housing, the government can achieve savings in its future expenditure on housing benefits – as well as providing a home for a low income family and meeting other possible objectives, such as urban regeneration and renewal. Once built, the debt service, management and maintenance of properties can be met from rents, and a social asset is created, which will endure for decades, if not centuries. (See chapter 3.)
Building more social rent homes is a realistic and practical policy. Given current conditions in labour and materials markets, and the need to secure sites, there cannot be a step change in residential construction overnight — but our analysis suggests that a steady build-up to 100,000 new homes annually by 2020-21 is reasonable. This gives adequate time

6 | BUILDING NEW SOCIAL RENT HOMES
for the construction industry and its supply chain to develop the necessary capacity. Likewise, social rent housing providers, and their investors, will have sufficient time to plan properly new housing developments under any new funding regime. Meanwhile, additional construction activity will provide a fillip to the economy and to tax revenues. Every additional pound of investment in construction is estimated to stimulate an extra £2.84 of economic output in supply chains and through the higher spending of employees, and an extra 56 pence of new tax revenues for the exchequer. (See chapter 4.)
A programme of building 100,000 new homes each year for social rent part-funded by government grant will deliver a sustained structural improvement to public sector finances — by reducing spending on welfare payments and stimulating higher tax receipts from a more vibrant home building industry. By 2065-66, the horizon for the Office of Budget Responsibility’s long-term fiscal projections, we estimate that, under current policies public sector net debt would be 86.0 per cent of gross domestic product compared to 80.8 per cent under this proposal, a cost of £0.9 trillion in nominal terms; public sector net borrowing would be 4.7 per cent of national output rather than 4.2 per cent, an annual cost of £91 billion. This is equivalent to four fifths of current spending on the National Health Service in England.
In the initial years, the incremental welfare savings and new tax receipts will be less than that needed to fund the government’s contribution to the new homes — so additional public sector borrowing will be required. On cautious assumptions, we estimate that the net impact on public sector net borrowing will peak in 2019-20 at no more than 0.13 per cent of gross domestic product. (See chapter 4.)
While an increase in borrowing in the near-term would be necessary, the policy will be creating a net surplus for public coffers by 2034-35. The improvement to government finances will be particularly welcome then as the United Kingdom grapples with an ageing population and growing pension demand.
Nevertheless, given the aftermath of the 2007/8 financial crisis and subsequent recession, the government has quite rightly focused on reining in its expenditure and reducing the public sector deficit and debt. In applying ‘austerity’, policymakers must exercise fiscal common sense. Government expenditure isn’t all the same, and not all borrowing is equal. Indeed, borrowing to invest in assets that will reduce future public expenditure is not only efficient fiscally, it is likely to be welcomed by financial markets. Increased grant funding for social rent housing must be seen in this light. (See chapter 5.)
And, there are further socio-economic benefits to increased social rent housing that we have not captured in our fiscal arithmetic. There are wider knock-on impacts that touch areas of public interest such as health, wellbeing and education. New social rented homes are built to decent home standards with good energy efficiency ratings. Families aren’t forced to underheat their homes due to constrained budgets, significantly helping to improve health outcomes. What’s more social rent homes typically provide a more secure tenure for households. Children are less likely to move schools in-year or miss lessons due to illness, which improves their educational attainment and future mobility. Housing which better meets the needs of older people should mitigate the pressures on public service budgets which will grow as the population ages. (See chapter 6.)
The economic and fiscal case for building new social rent housing is unanswerable.

A report by Capital Economics for SHOUT and the National Federation of ALMOs | 7
In this section, we outline the background and context to the funding difficulties facing the social housing sector. In particular,
we set out briefly the role of social housing within the overall context of Britain’s housing shortage and review how the
changing nature of government priorities has affected its funding over recent years.
I N T R O D U C T I O N
8 | BUILDING NEW SOCIAL RENT HOMES
1 . 1 B R I TA I N ’ S H O U S I N G S H O R TA G E
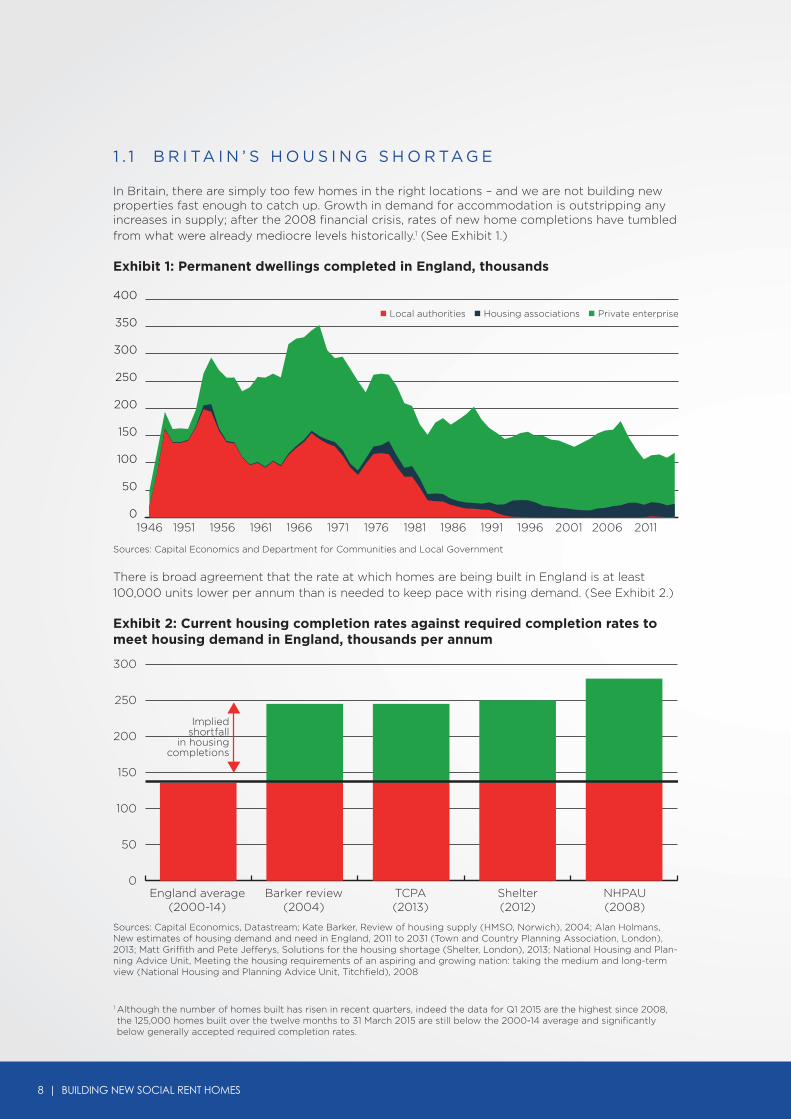
In Britain, there are simply too few homes in the right locations – and we are not building new properties fast enough to catch up. Growth in demand for accommodation is outstripping any increases in supply; after the 2008 financial crisis, rates of new home completions have tumbled from what were already mediocre levels historically.1 (See Exhibit 1.)
Exhibit 1: Permanent dwellings completed in England, thousands
There is broad agreement that the rate at which homes are being built in England is at least 100,000 units lower per annum than is needed to keep pace with rising demand. (See Exhibit 2.)
Exhibit 2: Current housing completion rates against required completion rates to meet housing demand in England, thousands per annum
Sources: Capital Economics and Department for Communities and Local Government
Sources: Capital Economics, Datastream; Kate Barker, Review of housing supply (HMSO, Norwich), 2004; Alan Holmans, New estimates of housing demand and need in England, 2011 to 2031 (Town and Country Planning Association, London), 2013; Matt Griffith and Pete Jefferys, Solutions for the housing shortage (Shelter, London), 2013; National Housing and Plan-ning Advice Unit, Meeting the housing requirements of an aspiring and growing nation: taking the medium and long-term view (National Housing and Planning Advice Unit, Titchfield), 2008
0
50
100
150
200
250
300
350
400
1946 1951 1956 1961 1966 1971 1976 1981 1986 1991 1996 2001 2006 2011
England average(2000-14)
Impliedshortfall
in housingcompletions
Barker review(2004)
TCPA(2013)
Shelter(2012)
NHPAU(2008)
0
50
100
150
200
250
300
1 Although the number of homes built has risen in recent quarters, indeed the data for Q1 2015 are the highest since 2008, the 125,000 homes built over the twelve months to 31 March 2015 are still below the 2000-14 average and significantly below generally accepted required completion rates.
n Local authorities n Housing associations n Private enterprise
A report by Capital Economics for SHOUT and the National Federation of ALMOs | 9
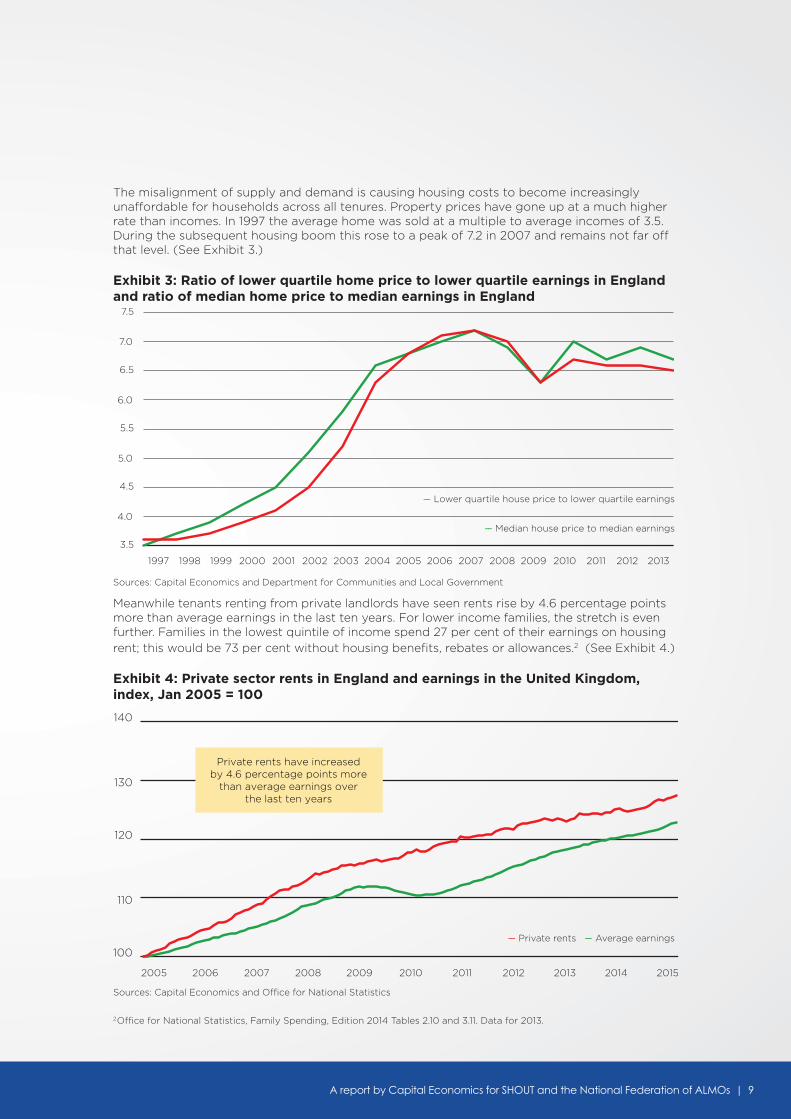
The misalignment of supply and demand is causing housing costs to become increasingly unaffordable for households across all tenures. Property prices have gone up at a much higher rate than incomes. In 1997 the average home was sold at a multiple to average incomes of 3.5. During the subsequent housing boom this rose to a peak of 7.2 in 2007 and remains not far off that level. (See Exhibit 3.)
Exhibit 3: Ratio of lower quartile home price to lower quartile earnings in England and ratio of median home price to median earnings in England
Sources: Capital Economics and Department for Communities and Local Government
Meanwhile tenants renting from private landlords have seen rents rise by 4.6 percentage points more than average earnings in the last ten years. For lower income families, the stretch is even further. Families in the lowest quintile of income spend 27 per cent of their earnings on housing rent; this would be 73 per cent without housing benefits, rebates or allowances.2 (See Exhibit 4.)
Exhibit 4: Private sector rents in England and earnings in the United Kingdom, index, Jan 2005 = 100
Sources: Capital Economics and Office for National Statistics
3.5
4.0
4.5
5.0
5.5
6.0
6.5
7.0
7.5
1997 1998 1999 2000 2001 2002 2003 2004 2005 2006 2007 2008 2009 2010 2011 2012 2013
100
110
120
130
140
2005 2006 2007 2008 2009 2010 2011 2012 2013 2014 2015
Private rents have increasedby 4.6 percentage points more
than average earnings overthe last ten years
2 Office for National Statistics, Family Spending, Edition 2014 Tables 2.10 and 3.11. Data for 2013.
–– Median house price to median earnings
–– Lower quartile house price to lower quartile earnings
–– Private rents –– Average earnings
10 | BUILDING NEW SOCIAL RENT HOMES
1 . 2 T H E R O L E O F S O C I A L H O U S I N G
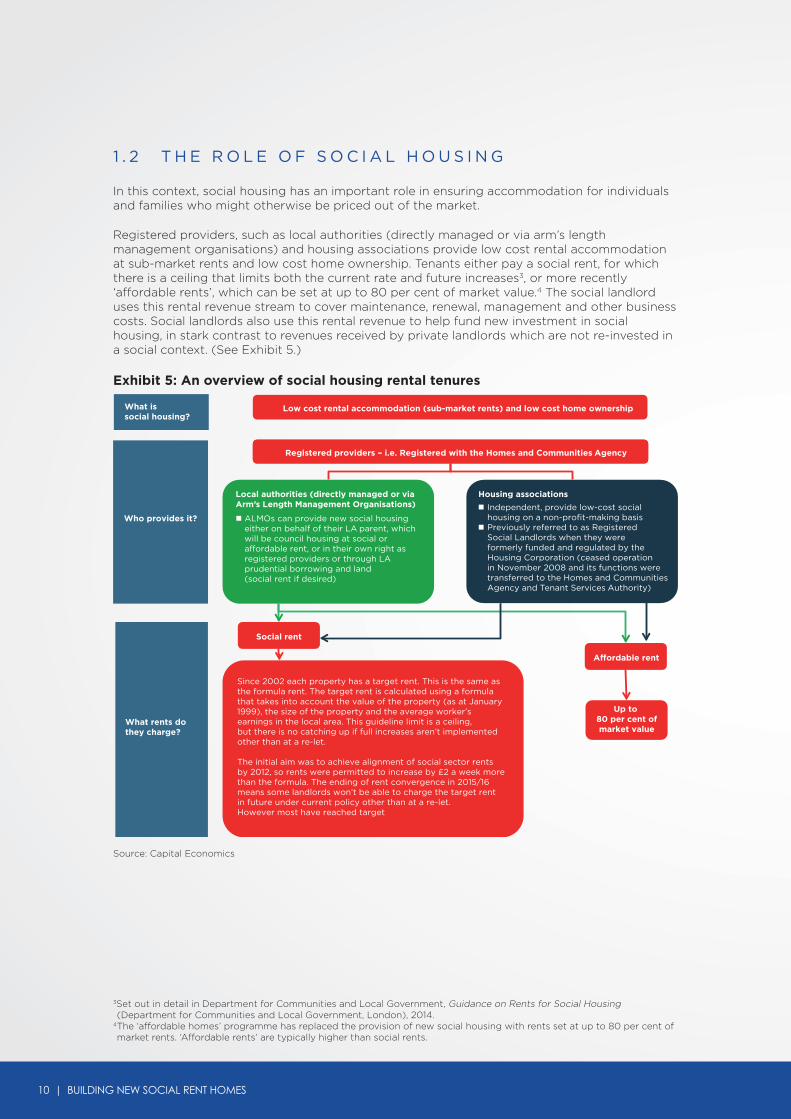
In this context, social housing has an important role in ensuring accommodation for individuals and families who might otherwise be priced out of the market.
Registered providers, such as local authorities (directly managed or via arm’s length management organisations) and housing associations provide low cost rental accommodation at sub-market rents and low cost home ownership. Tenants either pay a social rent, for which there is a ceiling that limits both the current rate and future increases3, or more recently ‘affordable rents’, which can be set at up to 80 per cent of market value.4 The social landlord uses this rental revenue stream to cover maintenance, renewal, management and other business costs. Social landlords also use this rental revenue to help fund new investment in social housing, in stark contrast to revenues received by private landlords which are not re-invested in a social context. (See Exhibit 5.)
Exhibit 5: An overview of social housing rental tenures
What issocial housing?
Low cost rental accommodation (sub-market rents) and low cost home ownership
Who provides it?
What rents dothey charge?
Registered providers – i.e. Registered with the Homes and Communities Agency
Social rent
Affordable rent
Up to 80 per cent ofmarket value
Since 2002 each property has a target rent. This is the same asthe formula rent. The target rent is calculated using a formula that takes into account the value of the property (as at January 1999), the size of the property and the average worker’s earnings in the local area. This guideline limit is a ceiling, but there is no catching up if full increases aren’t implemented other than at a re-let.
The initial aim was to achieve alignment of social sector rents by 2012, so rents were permitted to increase by £2 a week more than the formula. The ending of rent convergence in 2015/16 means some landlords won’t be able to charge the target rentin future under current policy other than at a re-let. However most have reached target
Local authorities (directly managed or viaArm’s Length Management Organisations)
ALMOs can provide new social housing either on behalf of their LA parent, which will be council housing at social oraffordable rent, or in their own right as registered providers or through LA prudential borrowing and land (social rent if desired)
Housing associations
Independent, provide low-cost social housing on a non-profit-making basis
Previously referred to as Registered Social Landlords when they were formerly funded and regulated by the Housing Corporation (ceased operation in November 2008 and its functions were transferred to the Homes and Communities Agency and Tenant Services Authority)
3Set out in detail in Department for Communities and Local Government, Guidance on Rents for Social Housing (Department for Communities and Local Government, London), 2014.
4 The ‘affordable homes’ programme has replaced the provision of new social housing with rents set at up to 80 per cent of market rents. ‘Affordable rents’ are typically higher than social rents.
Source: Capital Economics
A report by Capital Economics for SHOUT and the National Federation of ALMOs | 11
1 . 3 T H E C H A N G I N G N AT U R E O F G O V E R N M E N T P R I O R I T I E S
Investment in new affordable housing has been funded through a mix of sources, primarily coming from central government grants, but also including debt secured on existing stock and future rental income streams, ‘planning gain’ negotiated by local authorities from private property developers, and proceeds from the sale of existing housing stock.
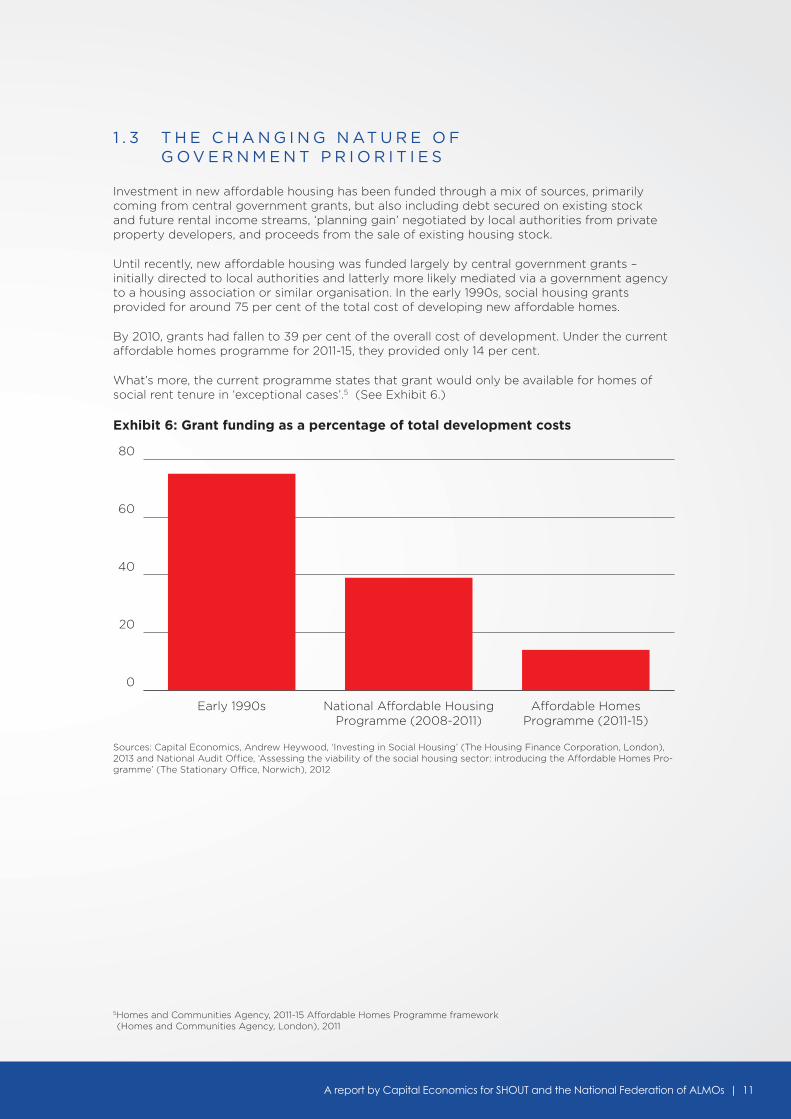
Until recently, new affordable housing was funded largely by central government grants – initially directed to local authorities and latterly more likely mediated via a government agency to a housing association or similar organisation. In the early 1990s, social housing grants provided for around 75 per cent of the total cost of developing new affordable homes.
By 2010, grants had fallen to 39 per cent of the overall cost of development. Under the current affordable homes programme for 2011-15, they provided only 14 per cent.
What’s more, the current programme states that grant would only be available for homes of social rent tenure in ‘exceptional cases’.5 (See Exhibit 6.)
Exhibit 6: Grant funding as a percentage of total development costs
5Homes and Communities Agency, 2011-15 Affordable Homes Programme framework (Homes and Communities Agency, London), 2011
Sources: Capital Economics, Andrew Heywood, ‘Investing in Social Housing’ (The Housing Finance Corporation, London), 2013 and National Audit Office, ‘Assessing the viability of the social housing sector: introducing the Affordable Homes Pro-gramme’ (The Stationary Office, Norwich), 2012
0
20
40
60
80
Affordable HomesProgramme (2011-15)
National Affordable HousingProgramme (2008-2011)
Early 1990s
12 | BUILDING NEW SOCIAL RENT HOMES
6HM Treasury, Charter for Budget Responsibility: Autumn Statement 2014 update (HM Treasury, London), 2014
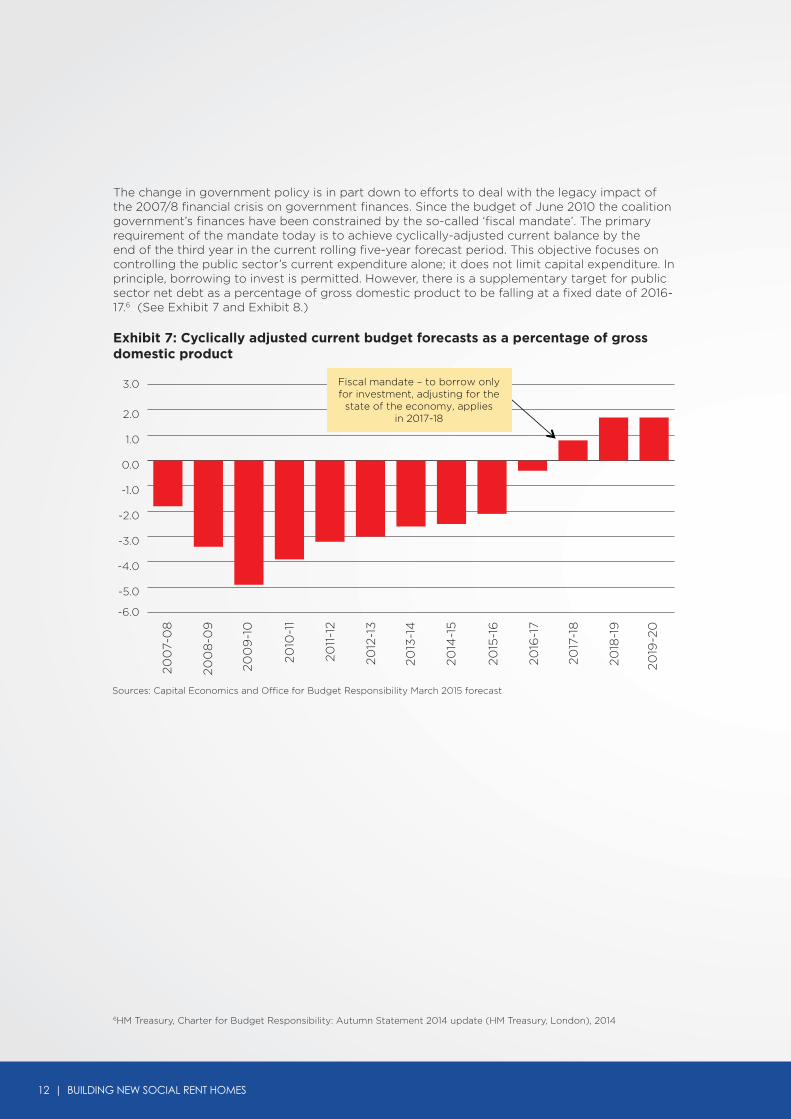
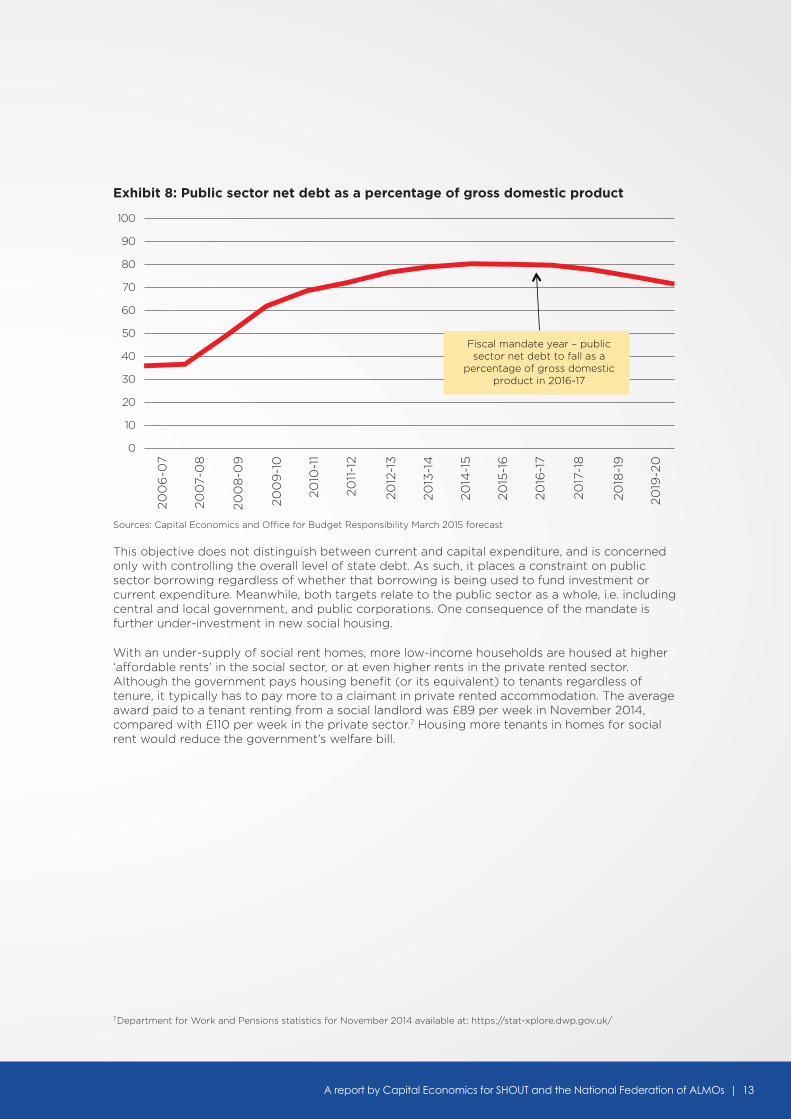
The change in government policy is in part down to efforts to deal with the legacy impact of the 2007/8 financial crisis on government finances. Since the budget of June 2010 the coalition government’s finances have been constrained by the so-called ‘fiscal mandate’. The primary requirement of the mandate today is to achieve cyclically-adjusted current balance by the end of the third year in the current rolling five-year forecast period. This objective focuses on controlling the public sector’s current expenditure alone; it does not limit capital expenditure. In principle, borrowing to invest is permitted. However, there is a supplementary target for public sector net debt as a percentage of gross domestic product to be falling at a fixed date of 2016-17.6 (See Exhibit 7 and Exhibit 8.)
Exhibit 7: Cyclically adjusted current budget forecasts as a percentage of gross domestic product
Sources: Capital Economics and Office for Budget Responsibility March 2015 forecast
-6.0
-5.0
-4.0
-3.0
-2.0
-1.0
0.0
1.0
2.0
3.0
200
7-0
8
200
8-0
9
200
9-1
0
2010
-11
2011
-12
2012
-13
2013
-14
2014
-15
2015
-16
2016
-17
2017
-18
2018
-19
2019
-20
Fiscal mandate – to borrow onlyfor investment, adjusting for the
state of the economy, appliesin 2017-18
A report by Capital Economics for SHOUT and the National Federation of ALMOs | 13
7 Department for Work and Pensions statistics for November 2014 available at: https://stat-xplore.dwp.gov.uk/
This objective does not distinguish between current and capital expenditure, and is concerned only with controlling the overall level of state debt. As such, it places a constraint on public sector borrowing regardless of whether that borrowing is being used to fund investment or current expenditure. Meanwhile, both targets relate to the public sector as a whole, i.e. including central and local government, and public corporations. One consequence of the mandate is further under-investment in new social housing.
With an under-supply of social rent homes, more low-income households are housed at higher ‘affordable rents’ in the social sector, or at even higher rents in the private rented sector. Although the government pays housing benefit (or its equivalent) to tenants regardless of tenure, it typically has to pay more to a claimant in private rented accommodation. The average award paid to a tenant renting from a social landlord was £89 per week in November 2014, compared with £110 per week in the private sector.7 Housing more tenants in homes for social rent would reduce the government’s welfare bill.
Exhibit 8: Public sector net debt as a percentage of gross domestic product
Sources: Capital Economics and Office for Budget Responsibility March 2015 forecast
0
10
20
30
40
50
60
70
80
90
100
200
7-0
8
200
6-0
7
200
8-0
9
200
9-1
0
2010
-11
2011
-12
2012
-13
2013
-14
2014
-15
2015
-16
2016
-17
2017
-18
2018
-19
2019
-20
Fiscal mandate year – publicsector net debt to fall as a
percentage of gross domesticproduct in 2016-17

14 | BUILDING NEW SOCIAL RENT HOMES
In this section, we examine the consequences of housing tenure in the context of the government’s expenditure on welfare benefits.
H O U S I N G T E N U R E A N D T H E B E N E F I T S B I L L
A report by Capital Economics for SHOUT and the National Federation of ALMOs | 15
2 . 1 H O U S I N G B E N E F I T A N D T H E G O V E R N M E N T ’ S W E L FA R E B I L L
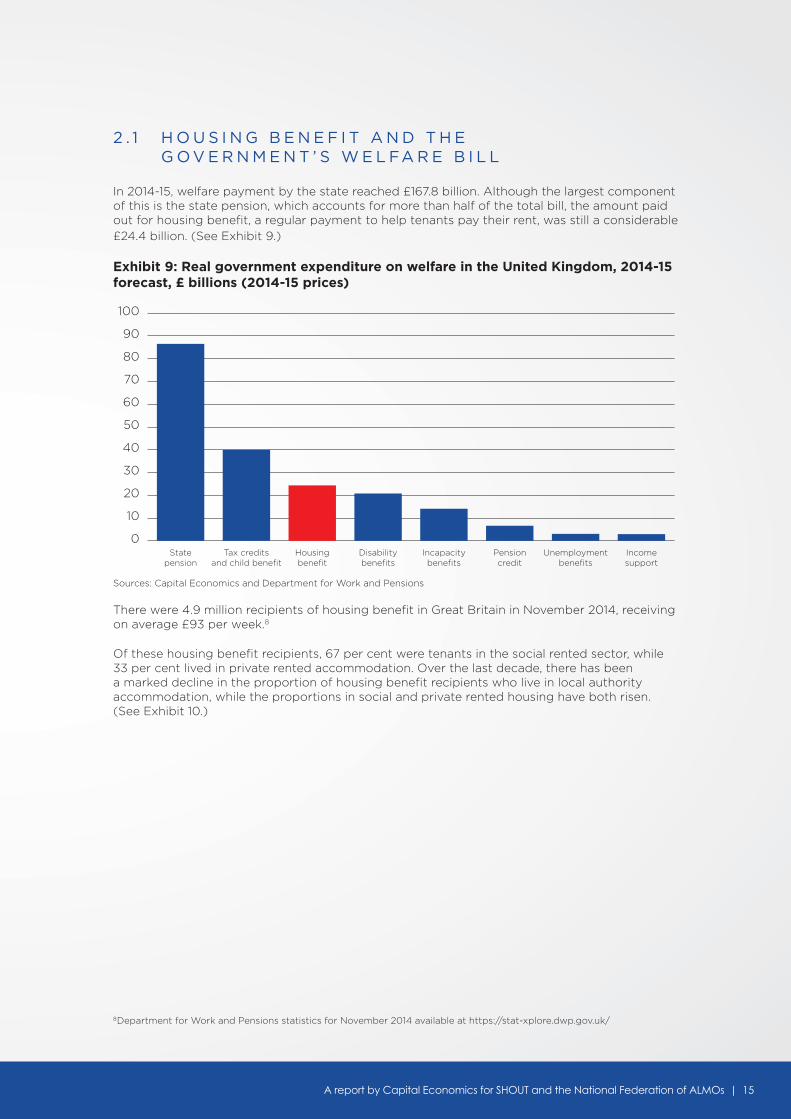
In 2014-15, welfare payment by the state reached £167.8 billion. Although the largest component of this is the state pension, which accounts for more than half of the total bill, the amount paid out for housing benefit, a regular payment to help tenants pay their rent, was still a considerable £24.4 billion. (See Exhibit 9.)
Exhibit 9: Real government expenditure on welfare in the United Kingdom, 2014-15 forecast, £ billions (2014-15 prices)
There were 4.9 million recipients of housing benefit in Great Britain in November 2014, receiving on average £93 per week.8
Of these housing benefit recipients, 67 per cent were tenants in the social rented sector, while 33 per cent lived in private rented accommodation. Over the last decade, there has been a marked decline in the proportion of housing benefit recipients who live in local authority accommodation, while the proportions in social and private rented housing have both risen. (See Exhibit 10.)
Sources: Capital Economics and Department for Work and Pensions
0
10
20
30
40
50
60
70
80
90
100
Incomesupport
Unemploymentbenefits
Pensioncredit
Incapacitybenefits
Disabilitybenefits
Housingbenefit
Tax creditsand child benefit
Statepension
8 Department for Work and Pensions statistics for November 2014 available at https://stat-xplore.dwp.gov.uk/
16 | BUILDING NEW SOCIAL RENT HOMES
9 Department for Work and Pensions statistics for November 2014 available at: https://stat-xplore.dwp.gov.uk/
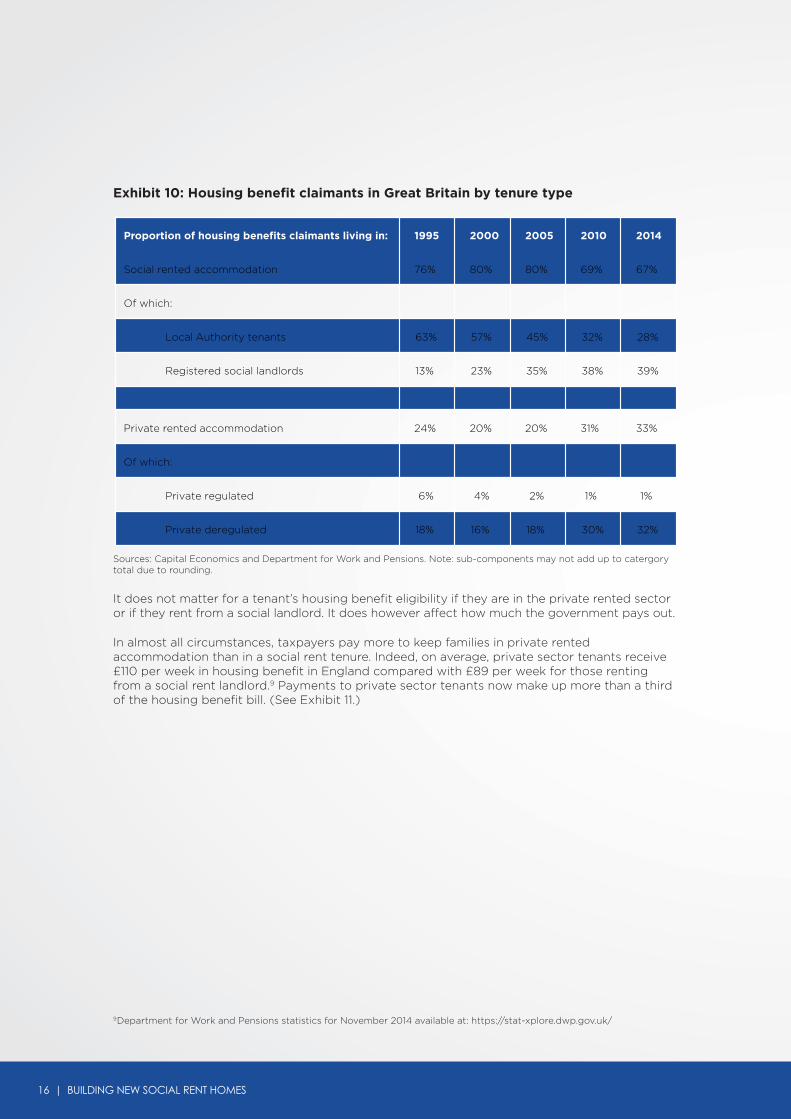
Exhibit 10: Housing benefit claimants in Great Britain by tenure type
Sources: Capital Economics and Department for Work and Pensions. Note: sub-components may not add up to catergory total due to rounding.
It does not matter for a tenant’s housing benefit eligibility if they are in the private rented sector or if they rent from a social landlord. It does however affect how much the government pays out.
In almost all circumstances, taxpayers pay more to keep families in private rented accommodation than in a social rent tenure. Indeed, on average, private sector tenants receive £110 per week in housing benefit in England compared with £89 per week for those renting from a social rent landlord.9 Payments to private sector tenants now make up more than a third of the housing benefit bill. (See Exhibit 11.)
Proportion of housing benefits claimants living in: 1995 2000 2005 2010 2014
Social rented accommodation 76% 80% 80% 69% 67%
Of which:
Local Authority tenants 63% 57% 45% 32% 28%
Registered social landlords 13% 23% 35% 38% 39%
Private rented accommodation 24% 20% 20% 31% 33%
Of which:
Private regulated 6% 4% 2% 1% 1%
Private deregulated 18% 16% 18% 30% 32%
A report by Capital Economics for SHOUT and the National Federation of ALMOs | 17
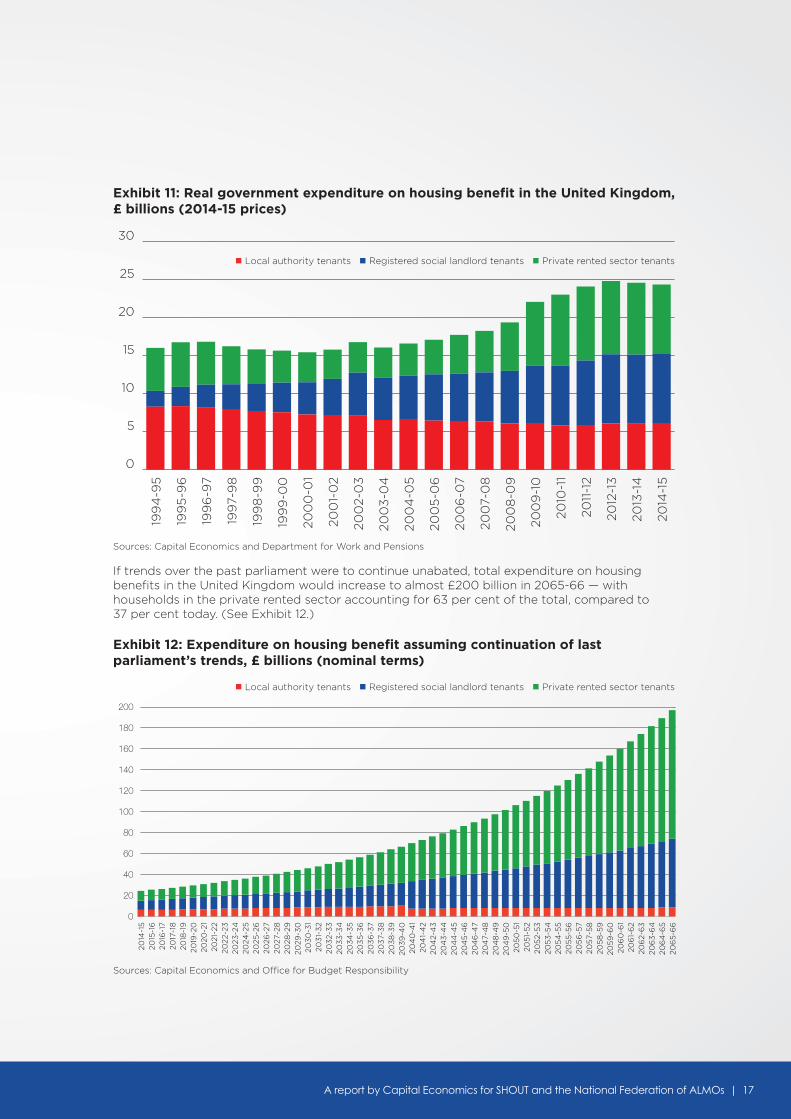
Exhibit 11: Real government expenditure on housing benefit in the United Kingdom, £ billions (2014-15 prices)
If trends over the past parliament were to continue unabated, total expenditure on housing benefits in the United Kingdom would increase to almost £200 billion in 2065-66 — with households in the private rented sector accounting for 63 per cent of the total, compared to 37 per cent today. (See Exhibit 12.)
Exhibit 12: Expenditure on housing benefit assuming continuation of last parliament’s trends, £ billions (nominal terms)
Sources: Capital Economics and Department for Work and Pensions
Sources: Capital Economics and Office for Budget Responsibility
0
5
10
15
20
25
30
2014
-15
2013
-14
2012
-13
2011
-12
2010
-11
200
9-1
0
200
8-0
9
200
7-0
8
200
6-0
7
200
5-0
6
200
4-0
5
200
3-0
4
200
2-0
3
200
1-0
2
200
0-0
1
199
9-0
0
199
8-9
9
199
7-9
8
199
6-9
7
199
5-9
6
199
4-9
5
0
20
40
60
80
100
120
140
160
180
200
2014
-15
20
15-1
6
2016
-17
2017
-18
20
18-1
9
2019
-20
20
20-2
1 20
21-2
2 20
22-2
3
2023
-24
20
24-2
5
2025
-26
20
26-2
7 20
27-2
8
2028
-29
20
29-3
0
203
0-3
1 20
31-
32
203
2-3
3
203
3-3
4
203
4-3
5
203
5-3
6
203
6-3
7 20
37-
38
20
38
-39
20
39
-40
20
40
-41
204
1-4
2 20
42-
43
20
43
-44
20
44
-45
20
45
-46
20
46
-47
204
7-4
8
204
8-4
9
204
9-5
0
205
0-5
1 20
51-
52
205
2-5
3
205
3-5
4
205
4-5
5
205
5-5
6
205
6-5
7 20
57-
58
20
58
-59
20
59
-60
20
60
-61
206
1-6
2 20
62-
63
20
63
-64
20
64
-65
20
65
-66
n Local authority tenants n Registered social landlord tenants n Private rented sector tenants
n Local authority tenants n Registered social landlord tenants n Private rented sector tenants

18 | BUILDING NEW SOCIAL RENT HOMES
2 . 2 A N A LY S I N G R E P R E S E N TAT I V E H O U S E H O L D S
Of course, the benefits system as a whole is complicated – and one must be careful about generalising. The amount of benefits received by a specific individual or household will depend on a wide variety of different factors – such as level of income, employment status and number of dependent children in the household. The average, or even what’s most typical, may not be representative; indeed, they may be misleading.
Nevertheless, the treatment of support for housing costs specifically within the benefits system is less complicated. By and large, the amount received by a household as contribution to these costs is based on the actual rent paid. There are exceptions – such as for younger single occupancy households or for those close to the benefits cap, but generally the higher the rent, the greater the payment by the state.
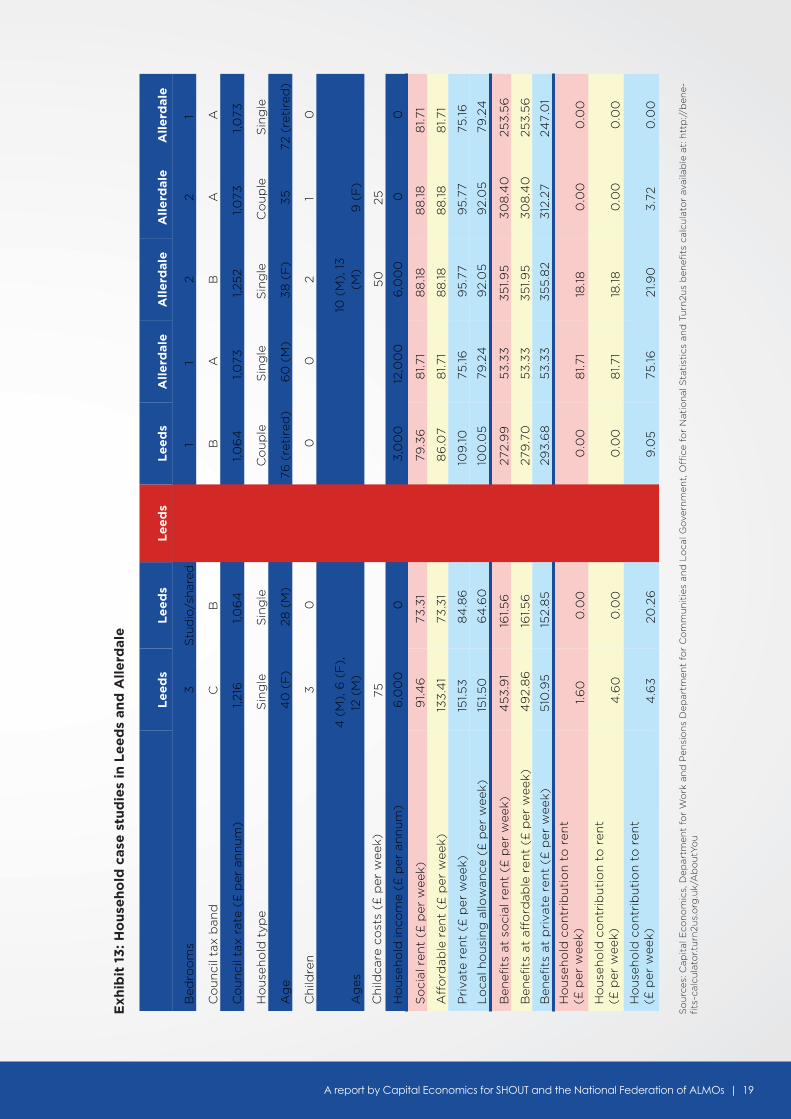
We have calculated the benefits payable to a wide and representative range of exemplar households, and their details are reported in their entirety in the appendix. For the sake of clarity and brevity, we illustrate the point here with reference to only one example.
We consider a couple with one child aged eleven years old in a two-bedroom property in Leeds. One parent is employed with an annual income of £12,000.
This family would likely pay rent of £127.29 per week if they lived in private rental accommodation, and would receive benefits totalling £204.21. In the equivalent social rent home, they would pay a maximum of £85.41, whilst receiving £176.84 in assistance from the state. (See example 3 in Exhibit 13.)
It’s a win-win if the household is accommodated in a social rent property. In this scenario, the government pays £27.37 per week less in benefits if the family rents from a social rent rather than private landlord. Meanwhile, the family themselves have £14.51 per week more in spending money after paying their rent.
This illustrative scenario is representative of almost all of the cases we examined. Out of 36 cases, 29 are win-win; like our Leeds example, being accommodated in social housing means a lower benefits bill for the government and higher disposable income for the family.
There are substantial variations in the arithmetic for different households. The key factors are:
n Location – Our family would receive £384.18 in benefits in Camden for a private rented home and £230.57 for social rented
n Bedroom requirement – A retired couple in a one-bedroom home in Leeds would yield a saving of £20.69 per week for the government whilst a single parent with three children in a three-bedroom home would save £57.04 for the state, compared with £27.37 per week for our family in a two-bedroom property
We estimate that for 81.5 per cent of all households in England receiving housing benefit (or equivalent) and living in private tenure, both the state and the families would be better off in a social rather than private tenure. These households represent 30.6 per cent of the government’s current total housing benefit bill in England or £7.4 billion each year.
There are few instances where social tenure does not provide the same win-win advantages over private.
One is when we consider a single person of working age over 35 in Allerdale, a local authority in rural northern England. Here the social rent of £81.71 per week for a one bedroom home is greater than the cost of renting in the private rented sector, £75.16. The other examples relate to single retired people in Allerdale or single childless households aged under 35 years old in Brent, North Devon, Leeds and Leicester. (Full details are in the appendix).
There is, of course, a third tenure in addition to social rent and private rent: ‘affordable rent’. But even here the results are similar. In 24 of our 36 examples the government would spend less on benefits if the household was paying social rather than ‘affordable rent’ but only five of these are win-win where the household saves as well. In one case, a single childless person in Brent, the household is worse off after benefits under social rent than ‘affordable rent’ even though the government would make a saving. (See appendix for further details.)
A report by Capital Economics for SHOUT and the National Federation of ALMOs | 19
Exh
ibit
13
: Ho
use
ho
ld c
ase
stu
die
s in
Le
ed
s an
d A
lle
rdal
e
So
urc
es: C
apit
al E
con
om
ics,
Dep
artm
ent
for
Wo
rk a
nd
Pen
sio
ns
Dep
artm
ent
for
Co
mm
un
itie
s an
d L
oca
l Go
vern
men
t, O
ffice
fo
r N
atio
nal
Sta
tist
ics
and
Tu
rn2u
s b
enefi
ts c
alcu
lato
r av
aila
ble
at:
htt
p://
ben
e-fi
ts-c
alcu
lato
r.tu
rn2u
s.o
rg.u
k/A
bo
utY
ou
Le
ed
s L
ee
ds
Le
ed
s L
ee
ds
All
erd
ale
A
lle
rdal
e
All
erd
ale
A
lle
rdal
e
Bed
roo
ms
3
Stu
dio
/sha
red
2
1 1
2 2
1
Co
un
cil t
ax b
and
C
B
B
B
A
B
A
A
Co
un
cil t
ax r
ate
(£ p
er a
nn
um
) 1,2
16
1,06
4
1,06
4
1,06
4
1,073
1,2
52
1,073
1,0
73
Ho
use
ho
ld t
ype
Sin
gle
S
ing
le
Co
up
le
Co
up
le
Sin
gle
S
ing
le
Co
up
le
Sin
gle
Ag
e 4
0 (
F)
28 (
M)
34
76
(re
tire
d)
60
(M
) 3
8 (
F)
35
72
(re
tire
d)
Ch
ildre
n
3
0
1 0
0
2
1 0
Ag
es
4 (
M),
6 (
F),
12
(M
) 11
(F)
10 (
M),
13
(M
) 9
(F
)
Ch
ildca
re c
ost
s (£
per
wee
k)
75
25
50
25
Ho
use
ho
ld in
com
e (£
per
an
nu
m)
6,0
00
0
12
,00
0
3,0
00
12
,00
0
6,0
00
0
0
So
cial
ren
t (£
per
wee
k)
91.4
6
73.3
1 8
5.4
1 79
.36
8
1.71
88
.18
88
.18
81.7
1
Aff
ord
able
ren
t (£
per
wee
k)
133
.41
73.3
1 10
3.2
8
86
.07
81.7
1 8
8.18
8
8.18
8
1.71
Pri
vate
ren
t (£
per
wee
k)
151.5
3
84
.86
12
7.29
10
9.10
75
.16
95
.77
95
.77
75.16
Lo
cal h
ou
sin
g a
llow
ance
(£
per
wee
k)
151.5
0
64
.60
12
2.3
6
100
.05
79
.24
9
2.0
5
92.
05
79
.24
Ben
efit
s at
so
cial
ren
t (£
per
wee
k)
45
3.9
1 16
1.56
17
6.8
4
272.
99
5
3.3
3
35
1.95
3
08
.40
25
3.5
6
Ben
efit
s at
aff
ord
able
ren
t (£
per
wee
k)
49
2.8
6
161.5
6
185
.13
279
.70
5
3.3
3
35
1.95
3
08
.40
25
3.5
6
Ben
efit
s at
pri
vate
ren
t (£
per
wee
k)
510
.95
15
2.8
5
204
.21
293
.68
5
3.3
3
35
5.8
2 3
12.2
7 24
7.0
1
Ho
use
ho
ld c
on
trib
uti
on
to
ren
t(£
per
wee
k)
1.6
0
0.0
0
85
.41
0.0
0
81.7
1 18
.18
0.0
0
0.0
0
Ho
use
ho
ld c
on
trib
uti
on
to
ren
t(£
per
wee
k)
4.6
0
0.0
0
94
.99
0
.00
8
1.71
18.18
0
.00
0
.00
Ho
use
ho
ld c
on
trib
uti
on
to
ren
t(£
per
wee
k)4
.63
20
.26
9
9.9
2 9
.05
75
.16
21.9
0
3.7
2 0
.00

20 | BUILDING NEW SOCIAL RENT HOMES
In this section we look at the business case for new social housing – in particular we assess the cost of building new homes, calculate
the value of the asset’s future income stream and consider the welfare savings the government can make if tenants are housed in
a social rent tenure.
T H E B U S I N E S S C A S E F O R N E W S O C I A L H O U S I N G

A report by Capital Economics for SHOUT and the National Federation of ALMOs | 21
3 . 1 A S T Y L I S E D M O D E L F O R R E M U N E R AT I N G S O C I A L R E N T H O U S I N G D E V E L O P M E N T
In order to evaluate the business case for building new social housing, we have developed a stylised economic viability model. (See Exhibit 14.)
To keep things simple, we assume that there are only two sources of funding for a new social rent home:
n Social landlord — which can raise finance in the markets against the future revenue stream from renting out the property at the applicable social rent rate (less ongoing maintenance, renewal and managements costs). In our calculations, we either take account of: only the first 25 years of future net rental revenues; or the first 25 years of net revenues plus the likely market value of the property at the end of 25 years assuming it remains in social rent tenure
n Government — which, for the purposes of this analysis, we assume will only contribute funds up to the present value of the future savings in housing benefits expenditure it will accrue from moving a family out of higher cost private rental accommodation. We apply the Treasury’s Green Book discount rate of 3.5 per cent, which is recommended by them for evaluation of government investment projects
We test the viability of new building in a range of locations and for different sizes of home by comparing the potential for these two sources of funding to pay for the building and land costs of a new home.
This stylised approach is a tough test.
In reality, there are other sources of funding for new social rent housing, which we are not taking into account. Contributions can be sought by local authorities from private developers through ‘Section 106’ agreements. Government departments, local authorities and other agencies can gift (or sell/lease at below market rates) their surplus or under-deployed land to social landlords in order to reduce land costs of new social rent homes. The government may wish to increase its contribution to take account of other positive impacts and knock-on benefits — such as urban regeneration and renewal. Moreover, currently, government grant is seen (inaccurately) by many as a deadweight subsidy payment to social landlords. In our tests, there is no subsidy, in that sense, whatsoever. The government is only contributing money on the basis that it is fiscally efficient for them to do so.
Meanwhile, our stylised model is silent on the process and mechanisms of the government’s contribution. It could be delivered through reforms to the existing grant regime and institutions; it could be a new regime. This is an issue for others to deliberate on.

22 | BUILDING NEW SOCIAL RENT HOMES
Exhibit 14: A stylised economic viability model for the development of new social housing
Source: Capital Economics
Building costs
Construction costs
Land costs
Government contribution
Social landlord contribution
Welfare savings from paying reduced housing benefit if tenants pay social rents
and not affordable or private rents
Income stream from social rents
Recognition of asset value
Costs
Sources ofdevelopment funding
Viability of new social housing
+
-
=
Ongoing costs
- Maintenance and renewal costs
Management and risk costs
3 . 2 A S S E S S I N G T H E B U S I N E S S C A S E
Our analysis shows that, even using our tough test, in almost all circumstances, construction of new social rent housing is viable economically and fiscally once the future savings to the gov-ernment’s housing benefits bill are taken into account properly.
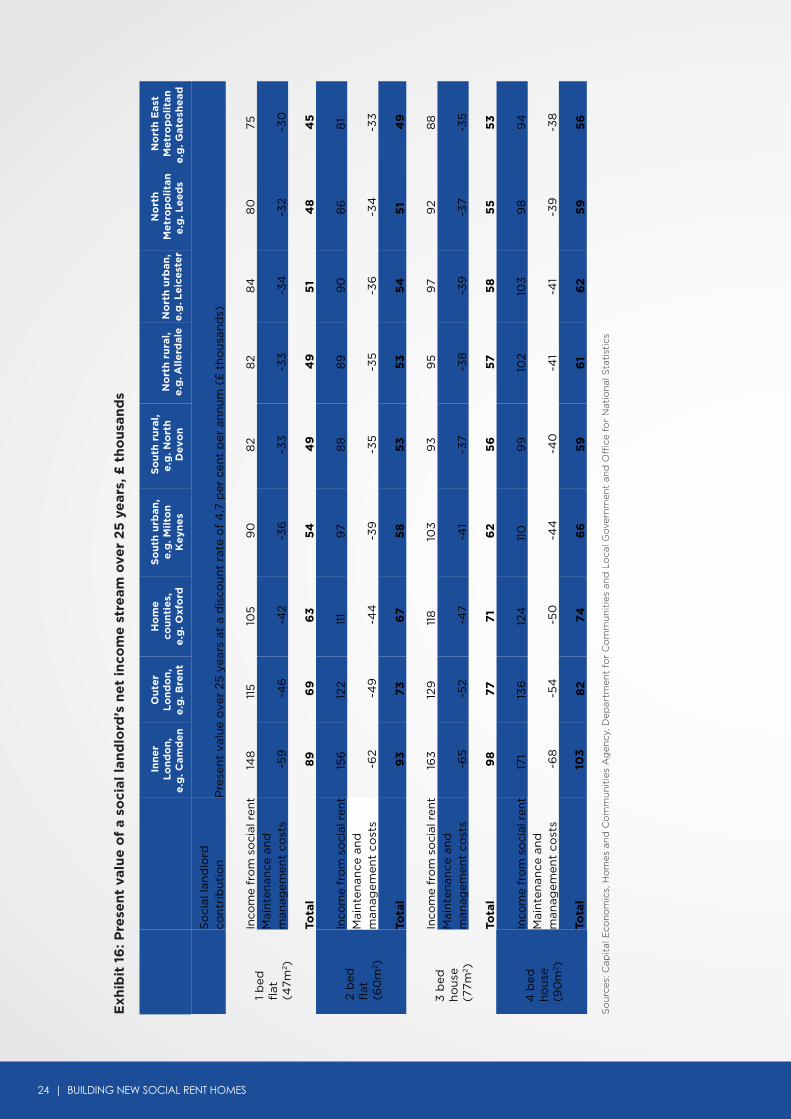
Landlords will struggle to fund the building of new homes for social rent on the basis of their likely future revenues alone. For example, a one bed flat in Milton Keynes will cost a social landlord around £74,000 to build plus an extra £19,000 to acquire the land for the block — a total of £93,000. (See Exhibit 15.) Once built, they can let the property out under a social rent tenancy for up to £90 per week. Over a 25-year period and allowing for maintenance, renewal and management costs, this would allow the landlord to borrow up to £54,000 now against the future rental income stream. (See Exhibit 16.)
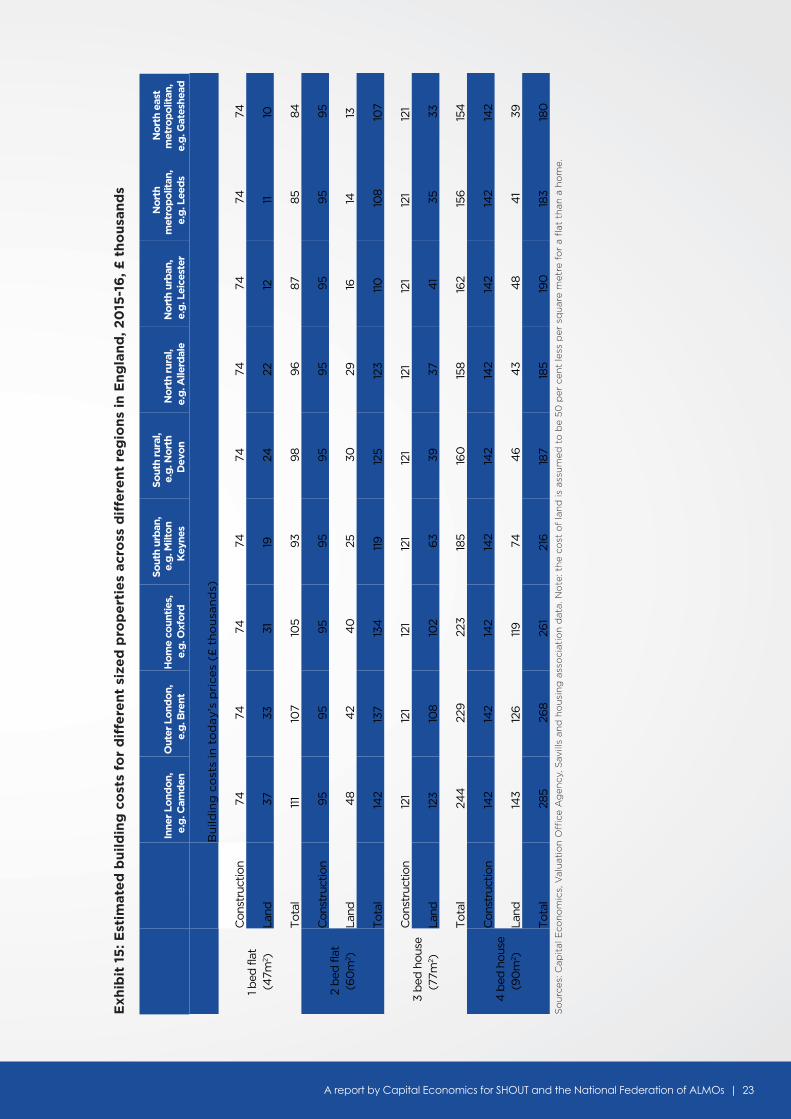
A report by Capital Economics for SHOUT and the National Federation of ALMOs | 23
Exh
ibit
15
: Est
imat
ed
bu
ild
ing
co
sts
for
dif
fere
nt
size
d p
rop
ert
ies
acro
ss d
iffe
ren
t re
gio
ns
in E
ng
lan
d, 2
015
-16
, £ t
ho
usa
nd
s
So
urc
es: C
apit
al E
con
om
ics,
Val
uat
ion
Offi
ce A
gen
cy, S
avill
s an
d h
ou
sin
g a
sso
ciat
ion
dat
a. N
ote
: th
e co
st o
f la
nd
is a
ssu
med
to
be
50
per
cen
t le
ss p
er s
qu
are
met
re f
or
a fl
at t
han
a h
om
e.
Inne
r Lo
ndo
n,
e.g
. Cam
den
O
uter
Lo
ndo
n,
e.g
. Bre
nt
Ho
me
coun
ties
, e.
g. O
xfo
rd
Sout
h ur
ban
, e.
g. M
ilto
n K
eyne
s
Sout
h ru
ral,
e.g
. No
rth
Dev
on
No
rth
rura
l, e.
g. A
llerd
ale
No
rth
urb
an,
e.g
. Lei
cest
er
No
rth
met
rop
olit
an,
e.g
. Lee
ds
No
rth
east
m
etro
po
litan
, e.
g. G
ates
head
Bu
ildin
g c
ost
s in
to
day
’s p
rice
s (£
th
ou
san
ds)
1 bed
flat
(4
7m2 )
Con
stru
ctio
n 74
74
74
74
74
74
74
74
74
Land
37
33
31
19
24
22
12
11
10
Tota
l 11
1 10
7 10
5 93
98
96
87
85
84
2 b
ed fl
at
(60
m2 )
Con
stru
ctio
n 95
95
95
95
95
95
95
95
95
Land
4
8 4
2 4
0
25
30
29
16
14
13
Tota
l 14
2 13
7 13
4
119
125
123
110
10
8 10
7
3 b
ed h
ouse
(7
7m2 )
Con
stru
ctio
n 12
1 12
1 12
1 12
1 12
1 12
1 12
1 12
1 12
1
Land
12
3 10
8 10
2 63
39
37
4
1 35
33
Tota
l 24
4
229
223
185
160
15
8 16
2 15
6 15
4
4 b
ed h
ouse
(9
0m
2 )
Con
stru
ctio
n 14
2 14
2 14
2 14
2 14
2 14
2 14
2 14
2 14
2
Land
14
3 12
6 11
9 74
4
6 4
3 4
8 4
1 39
Tota
l 28
5 26
8 26
1 21
6 18
7 18
5 19
0
183
180
24 | BUILDING NEW SOCIAL RENT HOMES
So
urc
es: C
apit
al E
con
om
ics,
Ho
mes
an
d C
om
mu
nit
ies
Ag
ency
, Dep
artm
ent
for
Co
mm
un
itie
s an
d L
oca
l Go
vern
men
t an
d O
ffice
fo
r N
atio
nal
Sta
tist
ics
Exh
ibit
16
: Pre
sen
t va
lue
of
a so
cial
lan
dlo
rd’s
ne
t in
com
e s
tre
am o
ver
25
ye
ars,
£ t
ho
usa
nd
s
Inn
er
Lo
nd
on
,e
.g. C
amd
en
Ou
ter
Lo
nd
on
,e
.g. B
ren
t
Ho
me
cou
nti
es,
e.g
. Oxf
ord
So
uth
urb
an,
e.g
. Mil
ton
Ke
yne
s
So
uth
ru
ral,
e.g
. No
rth
D
evo
nN
ort
h r
ura
l,e
.g. A
lle
rdal
eN
ort
h u
rban
,e
.g. L
eic
est
er
No
rth
Me
tro
po
lita
ne
.g. L
ee
ds
No
rth
Eas
tM
etr
op
oli
tan
e.g
. Gat
esh
ead
So
cial
lan
dlo
rd
con
trib
uti
on
P
rese
nt
valu
e o
ver
25 y
ears
at
a d
isco
un
t ra
te o
f 4
.7 p
er c
ent
per
an
nu
m (
£ t
ho
usa
nd
s)
1 b
edfl
at(4
7m2 )
Inco
me
fro
m s
oci
al r
ent
148
11
5
105
9
0
82
82
84
8
0
75
Mai
nte
nan
ce a
nd
m
anag
emen
t co
sts
-59
-4
6
-42
-36
-3
3
-33
-3
4
-32
-30
Tota
l 8
9
69
6
3
54
4
9
49
5
1 4
8
45
2 b
edfl
at(6
0m
2 )
Inco
me
fro
m s
oci
al r
ent
156
12
2 11
1 9
7 8
8
89
9
0
86
8
1 M
ain
ten
ance
an
d
man
agem
ent
cost
s -6
2 -4
9
-44
-3
9
-35
-3
5
-36
-3
4
-33
Tota
l 9
3
73
6
7
58
5
3
53
5
4
51
49
3 b
edh
ou
se(7
7m2 )
Inco
me
fro
m s
oci
al r
ent
163
12
9
118
10
3
93
9
5
97
92
88
M
ain
ten
ance
an
d
man
agem
ent
cost
s -6
5
-52
-47
-41
-37
-38
-3
9
-37
-35
Tota
l 9
8
77
7
1 6
2
56
5
7
58
5
5
53
4 b
edh
ou
se
(90
m2 )
Inco
me
fro
m s
oci
al r
ent
171
136
12
4
110
9
9
102
103
9
8
94
M
ain
ten
ance
an
d
man
agem
ent
cost
s -6
8
-54
-5
0
-44
-4
0
-41
-41
-39
-3
8
Tota
l 10
3
82
7
4
66
5
9
61
62
5
9
56

A report by Capital Economics for SHOUT and the National Federation of ALMOs | 25
With building costs totalling £93,000, plus £54,000 that a landlord can borrow up against the future rental income stream, this leaves a shortfall of £39,000 to fund construction of the new home. If construction is to proceed, the shortfall has to be made up if the new home is to be built through some combination of government grant and/or local authority contribution.
The latter may include ‘Section 106’ requirements on private developments or the deployment of council-owned land. Government grant available for new social rent housing has fallen markedly over the last 25 years. In the early 1990s grants provided for around 75 per cent of total cost of developing new social homes; this has reduced to fourteen per cent under the current affordable homes programme for 2011 to 2015 or an average of £16,989 for each new home.10 What’s more, this limited grant is now only available for housing let on an ‘affordable rent’ rather than social rent tenure other than in ‘exceptional cases’.
These levels of grant reflect a fiscal myopia; the government saving pennies in the short term only to waste pounds in the future.
As we have shown, by disbursing grant that permits the building of a new social rent housing, the government can achieve savings in its future expenditure on housing benefits – as well as providing a home for a low income family. In most cases, these future savings are more than enough to remunerate the original outlay of grant – using the government’s own investment appraisal criteria.
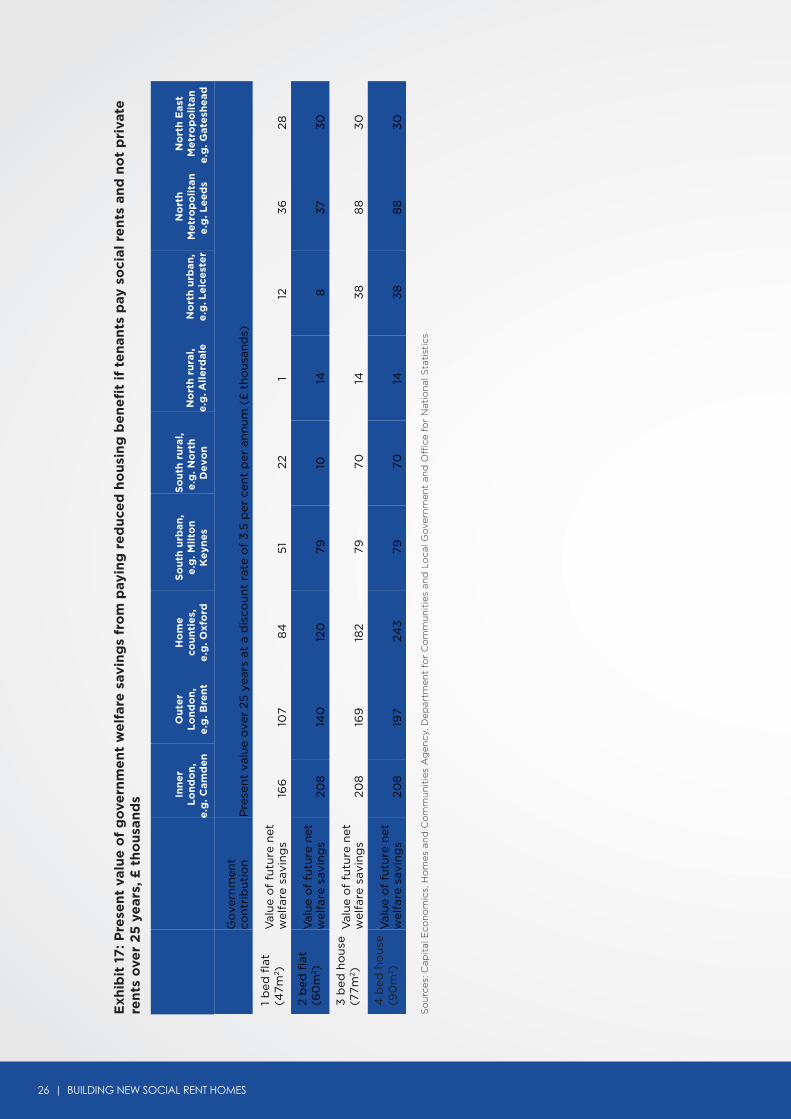
In the case of the one-bedroom flat in Milton Keynes, if it were occupied by a couple eligible for housing benefit who would have otherwise been housed in
private accommodation, the government would save £32 each week through lower welfare payments (and it would free up an extra £700 annually of spending money for the recipients). These future savings alone would justify the government contributing up to £51,000 towards the construction of the property — which more than covers the £39,000 shortfall. (See Exhibit 17.)
In other words, it is fiscally and economically efficient for the government to meet the social landlord’s shortfall on the construction costs of the one bedroom flat in Milton Keynes.
It is important to reiterate: our calculations of the government’s contribution is based only on future savings to welfare expenditure through reduced housing benefit liabilities. There are other reasons why the state may help fund social rent housing that we have not included. While our analysis has found that there are many areas where the benefit to the exchequer through housing benefit savings is greater, such as in London, the home counties or flats in other cities, such as Leicester and Leeds, there may still be a strong case for investment in other areas. There is a case for public sector investment in social housing in parts of the country with historically weaker economies and lower property values in order to help rebalance the British economy — while locally there may be strong logic for public intervention to help kick-start regeneration and renewal, or to mitigate other socio-economic ills.
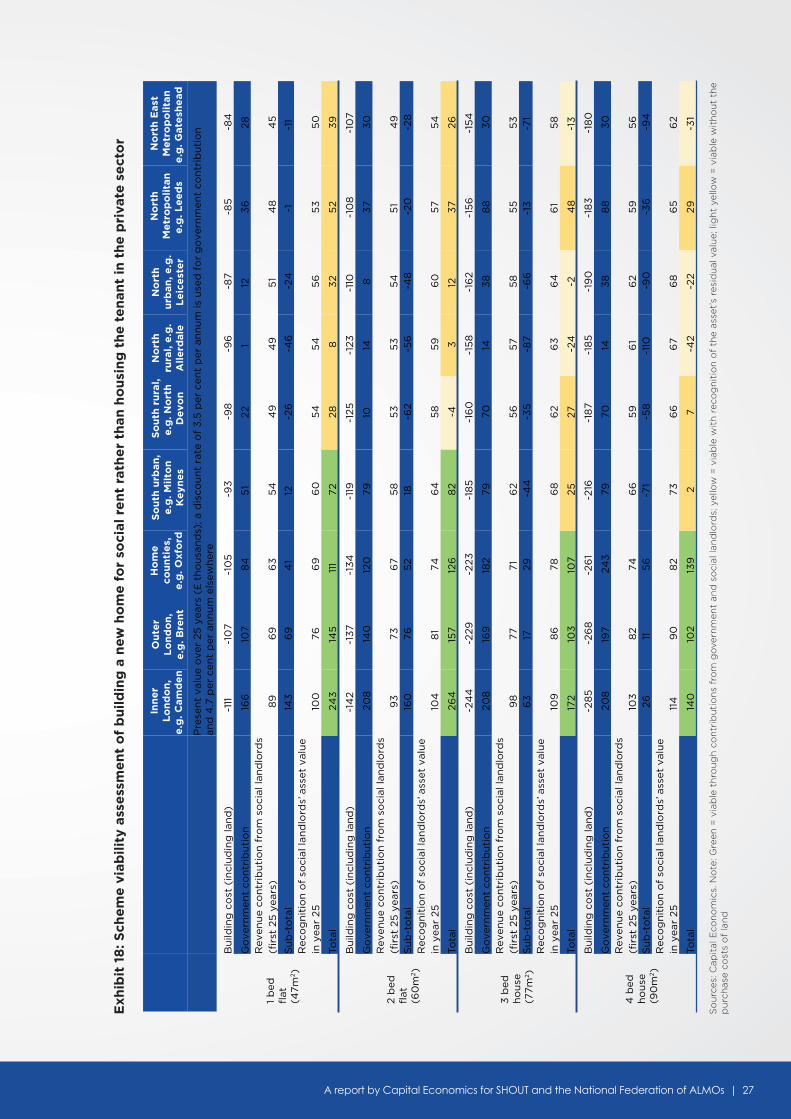
There are substantial variations in the fiscal arithmetic — mostly dependent on location and the size of dwelling. But across our 36 exemplars, fourteen are like the Milton Keynes property. (These are highlighted in green in Exhibit 18.)
10 Homes and Communities Agency, Affordable Homes Programme 2011 to 2015: quarterly updates summary report (Homes and Communities Agency, London), 2014
26 | BUILDING NEW SOCIAL RENT HOMES
Exh
ibit
17
: Pre
sen
t va
lue
of
go
vern
me
nt
we
lfar
e s
avin
gs
fro
m p
ayin
g r
ed
uce
d h
ou
sin
g b
en
efi
t if
te
nan
ts p
ay s
oci
al r
en
ts a
nd
no
t p
riva
te
ren
ts o
ver
25
ye
ars,
£ t
ho
usa
nd
s
So
urc
es: C
apit
al E
con
om
ics,
Ho
mes
an
d C
om
mu
nit
ies
Ag
ency
, Dep
artm
ent
for
Co
mm
un
itie
s an
d L
oca
l Go
vern
men
t an
d O
ffice
fo
r N
atio
nal
Sta
tist
ics
Go
vern
men
t co
ntr
ibu
tio
n
Pre
sen
t va
lue
ove
r 25
yea
rs a
t a
dis
cou
nt
rate
of
3.5
per
cen
t p
er a
nn
um
(£
th
ou
san
ds)
1 b
ed f
lat
(47m
2 )
Val
ue
of
futu
re n
et
wel
fare
sav
ing
s 16
6
107
84
5
1 22
1
12
36
28
2 b
ed f
lat
(60
m2 )
Val
ue
of
futu
re n
et
wel
fare
sav
ing
s 20
8
140
12
0
79
10
14
8
37
30
3 b
ed h
ou
se(7
7m2 )
V
alu
e o
f fu
ture
net
w
elfa
re s
avin
gs
208
16
9
182
79
70
14
38
8
8
30
4 b
ed h
ou
se(9
0m
2 )
Val
ue
of
futu
re n
et
wel
fare
sav
ing
s 20
8
197
243
79
70
14
3
8
88
3
0
Inn
er
Lo
nd
on
,e
.g. C
amd
en
Ou
ter
Lo
nd
on
,e
.g. B
ren
t
Ho
me
cou
nti
es,
e.g
. Oxf
ord
So
uth
urb
an,
e.g
. Mil
ton
Ke
yne
s
So
uth
ru
ral,
e.g
. No
rth
D
evo
nN
ort
h r
ura
l,e
.g. A
lle
rdal
eN
ort
h u
rban
,e
.g. L
eic
est
er
No
rth
Me
tro
po
lita
ne
.g. L
ee
ds
No
rth
Eas
tM
etr
op
oli
tan
e.g
. Gat
esh
ead
A report by Capital Economics for SHOUT and the National Federation of ALMOs | 27
Exh
ibit
18
: Sch
em
e v
iab
ilit
y as
sess
me
nt
of
bu
ild
ing
a n
ew h
om
e f
or
soci
al r
en
t ra
the
r th
an h
ou
sin
g t
he
te
nan
t in
th
e p
riva
te s
ect
or
So
urc
es: C
apit
al E
con
om
ics.
No
te: G
reen
= v
iab
le t
hro
ug
h c
on
trib
uti
on
s fr
om
go
vern
men
t an
d s
oci
al la
nd
lord
s; y
ello
w =
via
ble
wit
h r
eco
gn
itio
n o
f th
e as
set’s
res
idu
al v
alu
e; li
gh
t ye
llow
= v
iab
le w
ith
ou
t th
e p
urc
has
e co
sts
of
lan
d
Pre
sen
t va
lue
ove
r 25
yea
rs (
£ t
ho
usa
nd
s); a
dis
cou
nt
rate
of
3.5
per
cen
t p
er a
nn
um
is u
sed
fo
r g
ove
rnm
ent
con
trib
uti
on
and
4.7
per
cen
t p
er a
nn
um
els
ewh
ere
1 b
edfl
at(4
7m2 )
Bu
ildin
g c
ost
(in
clu
din
g la
nd
) -1
11
-10
7 -1
05
-9
3
-98
-9
6
-87
-85
-8
4
Go
vern
men
t co
ntr
ibu
tio
n
166
10
7 8
4
51
22
1 12
3
6
28
Rev
enu
e co
ntr
ibu
tio
n f
rom
so
cial
lan
dlo
rds
(fir
st 2
5 y
ears
) 8
9
69
6
3
54
4
9
49
5
1 4
8
45
Su
b-t
ota
l 14
3
69
4
1 12
-2
6
-46
-2
4
-1
-11
Rec
og
nit
ion
of
soci
al la
nd
lord
s’ a
sset
val
ue
in y
ear
25
100
76
6
9
60
5
4
54
5
6
53
5
0
Tota
l 24
3
145
11
1 72
28
8
3
2 5
2 3
9
2 b
edfl
at(6
0m
2 )
Bu
ildin
g c
ost
(in
clu
din
g la
nd
) -1
42
-13
7 -1
34
-1
19
-125
-1
23
-110
-1
08
-1
07
Go
vern
men
t co
ntr
ibu
tio
n
208
14
0
120
79
10
14
8
3
7 3
0
Rev
enu
e co
ntr
ibu
tio
n f
rom
so
cial
lan
dlo
rds
(fir
st 2
5 y
ears
) 9
3
73
67
58
5
3
53
5
4
51
49
S
ub
-to
tal
160
76
5
2 18
-6
2 -5
6
-48
-2
0
-28
R
eco
gn
itio
n o
f so
cial
lan
dlo
rds’
ass
et v
alu
e in
yea
r 25
10
4
81
74
64
5
8
59
6
0
57
54
Tota
l 26
4
157
126
8
2 -4
3
12
3
7 26
3 b
edh
ou
se(7
7m2 )
Bu
ildin
g c
ost
(in
clu
din
g la
nd
) -2
44
-2
29
-223
-1
85
-1
60
-1
58
-1
62
-15
6
-15
4
Go
vern
men
t co
ntr
ibu
tio
n
208
16
9
182
79
70
14
38
8
8
30
R
even
ue
con
trib
uti
on
fro
m s
oci
al la
nd
lord
s (f
irst
25
yea
rs)
98
77
71
6
2 5
6
57
58
5
5
53
S
ub
-to
tal
63
17
29
-4
4
-35
-8
7 -6
6
-13
-7
1 R
eco
gn
itio
n o
f so
cial
lan
dlo
rds’
ass
et v
alu
e in
yea
r 25
10
9
86
78
6
8
62
63
6
4
61
58
172
103
10
7 25
27
-2
4
-2
48
-1
3
4 b
edh
ou
se(9
0m
2 )
Bu
ildin
g c
ost
(in
clu
din
g la
nd
) -2
85
-2
68
-2
61
-216
-1
87
-18
5
-19
0
-18
3
-18
0
Go
vern
men
t co
ntr
ibu
tio
n
208
19
7 24
3
79
70
14
38
8
8
30
R
even
ue
con
trib
uti
on
fro
m s
oci
al la
nd
lord
s (f
irst
25
yea
rs)
103
8
2 74
6
6
59
6
1 6
2 5
9
56
S
ub
-to
tal
26
11
56
-7
1 -5
8
-110
-9
0
-36
-9
4
Rec
og
nit
ion
of
soci
al la
nd
lord
s’ a
sset
val
ue
in y
ear
25
114
9
0
82
73
66
6
7 6
8
65
6
2
Tota
l
Tota
l
140
10
2 13
9
2 7
-42
-22
29
-31
No
rth
Eas
tM
etr
op
oli
tan
e.g
. Gat
esh
ead
No
rth
Me
tro
po
lita
ne
.g. L
ee
ds
No
rth
urb
an, e
.g.
Le
ice
ste
r
No
rth
rura
l, e
.g.
All
erd
ale
So
uth
ru
ral,
e.g
. No
rth
D
evo
n
So
uth
urb
an,
e.g
. Mil
ton
Ke
yne
s
Ho
me
cou
nti
es,
e.g
. Oxf
ord
Ou
ter
Lo
nd
on
,e
.g. B
ren
t
Inn
er
Lo
nd
on
,e
.g. C
amd
en

28 | BUILDING NEW SOCIAL RENT HOMES
What we haven’t considered so far is that the landlord still has a working and valuable asset at the end of the 25-year appraisal period.
In a further fifteen of our 36 cases, government welfare savings and the landlord’s net rent income over 25 years are not adequate by themselves to fund construction and land acquisition — however, if the residual values of properties after 25 years are also taken into consideration, they are. (These are highlighted in bright yellow in Exhibit 18.)
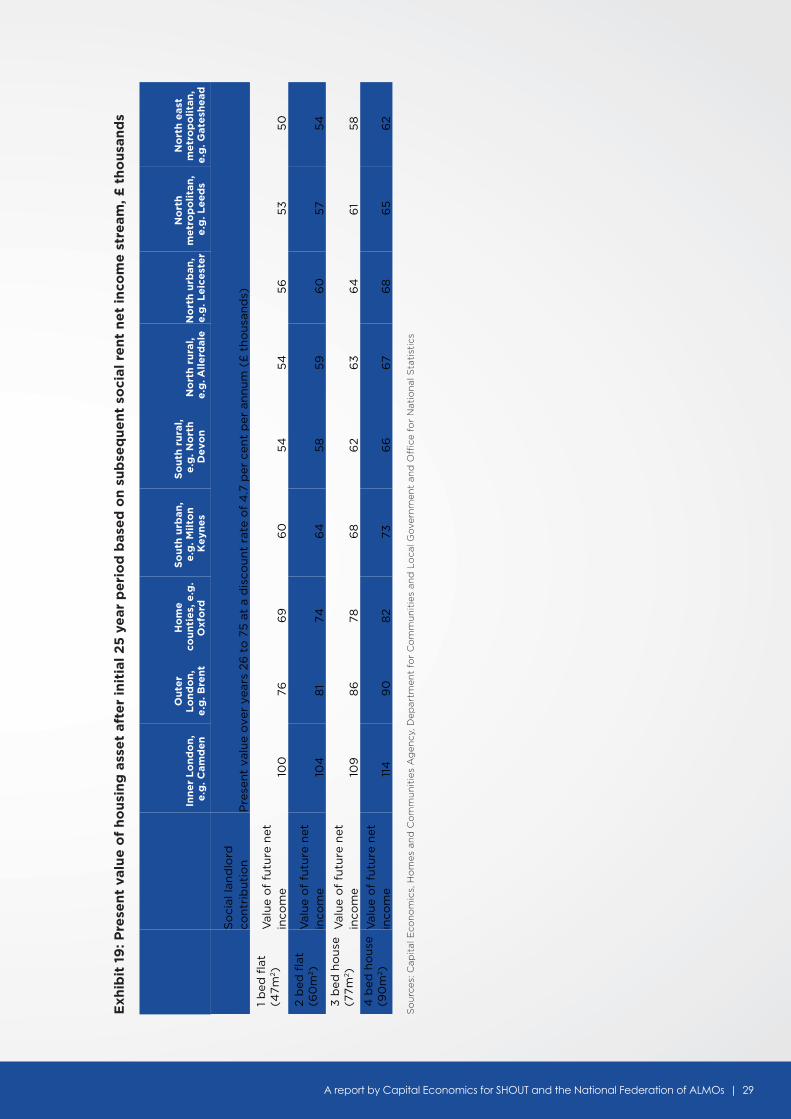
We have taken a cautious view of residual asset values — i.e. how much each property could be sold for after the 25-year appraisal period. We have not considered private open market prices but, instead, have assumed that all properties remain within the social rent sector with any future landlord only able to access a social rent tenure income. (See Exhibit 19.)
Our earlier example of a family occupying a two-bedroom property in Leeds falls into this category. A new two-bedroom flat will cost around £108,000 to build, including the purchase of the land. Discounting over 25 years at housing associations’ average cost of capital, the maximum social rent of £85 per week (less maintenance, renewal, management and other business costs) should allow the landlord to raise £51,000 towards the development costs — leaving a shortfall of £57,000. Taking into account future savings on housing benefits alone, the government should fund up to £37,000 of the shortfall — so £20,000 remains.
Nevertheless, building a two-bedroom social rent flat in Leeds is viable if the social landlord can access the future value of the property. Assuming that the property remained in a social rent tenure, we estimate that its residual
value after 25 years should be worth the equivalent of £57,000 today when discounted back at housing associations’ average cost of capital. (See Exhibit 19.)
In this example, if the social landlord can borrow £20,000 today against the residual value of the home after 25 years, construction can proceed. In theory, the markets should be willing to offer finance for such a reliable and long-term income generating asset. In practice, there may be difficulties putting together deals where the business plan extends beyond 25 years.
If so, there may be a role for the government either to provide these longer term loans to social landlords or, more pragmatically, to offer some form of partial guarantee for them to encourage private sector lenders. The latter has the advantage of not adding to public sector spending or borrowing except in the unlikely event of any such guarantee being called upon.
In a small minority of cases, some of the shortfall will remain even after both government welfare savings and the residual value of the property is taken into account. This occurs in seven of our 36 examples, typically larger properties in locations outside the southeast of England. (These are highlighted in pale yellow in Exhibit 18.)
In all of these examples, the various funding sources would be adequate to cover construction costs but not all of the costs of acquiring the land. Here, construction can proceed if under-utilised public land could be (part) gifted to the social landlord, or if the government provides grant in recognition of other social benefits arising from the new homes, such as urban regeneration and renewal.
A report by Capital Economics for SHOUT and the National Federation of ALMOs | 29
Exh
ibit
19
: Pre
sen
t va
lue
of
ho
usi
ng
ass
et
afte
r in
itia
l 2
5 y
ear
pe
rio
d b
ase
d o
n s
ub
seq
ue
nt
soci
al r
en
t n
et
inco
me
str
eam
, £ t
ho
usa
nd
s
So
urc
es: C
apit
al E
con
om
ics,
Ho
mes
an
d C
om
mu
nit
ies
Ag
ency
, Dep
artm
ent
for
Co
mm
un
itie
s an
d L
oca
l Go
vern
men
t an
d O
ffice
fo
r N
atio
nal
Sta
tist
ics
Inn
er
Lo
nd
on
, e
.g. C
amd
en
Ou
ter
Lo
nd
on
, e
.g. B
ren
t
Ho
me
co
un
tie
s, e
.g.
Oxf
ord
So
uth
urb
an,
e.g
. Mil
ton
K
eyn
es
So
uth
ru
ral,
e.g
. No
rth
D
evo
n
No
rth
ru
ral,
e.g
. All
erd
ale
N
ort
h u
rban
, e
.g. L
eic
est
er
No
rth
m
etr
op
oli
tan
, e
.g. L
ee
ds
No
rth
eas
t m
etr
op
oli
tan
, e
.g. G
ate
she
ad
So
cial
lan
dlo
rd
con
trib
uti
on
P
rese
nt
valu
e o
ver
year
s 26
to
75
at
a d
isco
un
t ra
te o
f 4
.7 p
er c
ent
per
an
nu
m (
£ t
ho
usa
nd
s)
1 b
ed f
lat
(47m
2 )V
alu
e o
f fu
ture
net
in
com
e 10
0
76
69
6
0
54
5
4
56
5
3
50
2 b
ed f
lat
(60
m2 )
V
alu
e o
f fu
ture
net
in
com
e 10
4
81
74
64
5
8
59
6
0
57
54
3
bed
ho
use
(77m
2 )
Val
ue
of
futu
re n
et
inco
me
109
8
6
78
68
6
2 6
3
64
6
1 5
8
4 b
ed h
ou
se(9
0m
2 )
V
alu
e o
f fu
ture
net
in
com
e 11
4
90
8
2 73
6
6
67
68
6
5
62
30 | BUILDING NEW SOCIAL RENT HOMES
3 . 3 S O C I A L V E R S U S A F F O R D A B L E R E N T T E N U R E S
So far, our analysis has focused on the welfare gains to be made from moving housing benefit recipients out of private tenure and into social rent. Of course, recipients of housing benefit (or its equivalent) may also be tenants in ‘affordable rent’ properties. The government can still make substantial savings from housing a tenant in a property for social rent rather than affordable rent, even though the difference between the rents payable is smaller than with the private sector.
We estimate that the government’s contribution would be sufficient to cover the construction shortfall in twelve of our 36 cases, for example a three-bedroom home in Oxford.
If the residual value of the social landlord’s property asset after 25 years is recognised, an additional thirteen examples would be covered, such as a two-bedroom flat in Milton Keynes or our two-bedroom home in Leeds. In eleven cases though, for example a two-bedroom flat in Allerdale or a four-bedroom home in Gateshead, the welfare savings would fall short.11 In seven of these cases, the various funding sources would be adequate to cover construction costs but not all of the costs of acquiring the land. In the remaining four cases, the various funding sources would be adequate to cover at least 89 per cent of construction costs but not the costs of acquiring the land.
11 See the appendix for further details
A report by Capital Economics for SHOUT and the National Federation of ALMOs | 31
In this section, we evaluate the impact of constructing 100,000 new social rent units each year for government finances, the wider
economy and families’ standards of living.
I M PA C T O F 1 0 0 , 0 0 0 N E W S O C I A L R E N T H O M E S E A C H Y E A R
32 | BUILDING NEW SOCIAL RENT HOMES
4 . 1 D E L I V E R I N G N E W H O M E S N AT I O N A L LY
We have been asked by SHOUT and the National Federation of ALMOs to compare the likely fiscal impacts of a potential policy of government support for the building of 100,000 new social rent homes each year with those of the existing regime.
We test an exemplar policy of building 100,000 new housing units for social rent12 each year, of which 24,500 are built by local authorities or arm’s length management organisations and 85,000 receive a government grant of £59,000 per unit. (See Exhibit 20.)
Exhibit 20: Policy assumptions
Sources: Capital Economics
Variable Assumption(s)
Current policy Total of 31,500 units for social or affordable rent built each year
5,500 social rent units are completed each year, of which 2,500 are built throughsection 106 contributions
25,000 affordable rent units are completed each year supported by government grant of £16,000 per unit
1,000 affordable rent completed each year without government grant through section 106 contributions
Exemplar policy 100,000 social rent units are completed each year from 2020/21
24,500 of these are by local authorities or Arms Length Management Organisations
85,000 are supported through government grant. We use our calculated requirement of £59,000 per unit as the level of grant
3,000 are built through section 106 contributions
20,000 social rent units house tenants who don’t receive housing benefit
Underlying economic
assumptions
Short term forecasts for public finances, inflation, and gross domestic product taken
from the Office for Budget Responsibility’s March 2015 outlook
Long term forecasts for public finances, inflation, and gross domestic product taken
from the Office for Budget Responsibility’s July 2014 fiscal sustainability report
12 For a current definition of social rent see Department for Communities and Local Government, Guidance on Rent for Social Housing (Department for Communities and Local Government, London) 2014
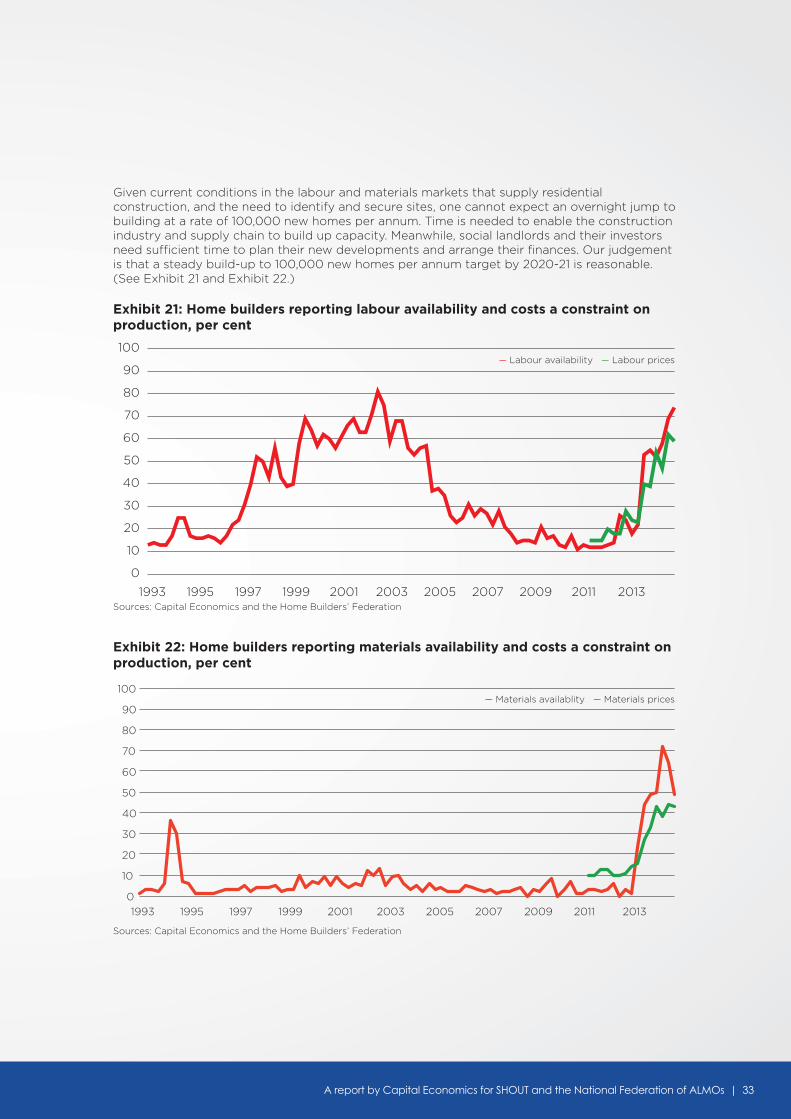
A report by Capital Economics for SHOUT and the National Federation of ALMOs | 33
Given current conditions in the labour and materials markets that supply residential construction, and the need to identify and secure sites, one cannot expect an overnight jump to building at a rate of 100,000 new homes per annum. Time is needed to enable the construction industry and supply chain to build up capacity. Meanwhile, social landlords and their investors need sufficient time to plan their new developments and arrange their finances. Our judgement is that a steady build-up to 100,000 new homes per annum target by 2020-21 is reasonable. (See Exhibit 21 and Exhibit 22.)
Exhibit 21: Home builders reporting labour availability and costs a constraint on production, per cent
Exhibit 22: Home builders reporting materials availability and costs a constraint on production, per cent
Sources: Capital Economics and the Home Builders’ Federation
Sources: Capital Economics and the Home Builders’ Federation
0
10
20
30
40
50
60
70
80
90
100
1993 1995 1997 1999 2001 2003 2005 2007 2009 2011 2013
0
10
20
30
40
50
60
70
80
90
100
1993 1995 1997 1999 2001 2003 2005 2007 2009 2011 2013
–– Labour availability –– Labour prices
–– Materials availablity –– Materials prices
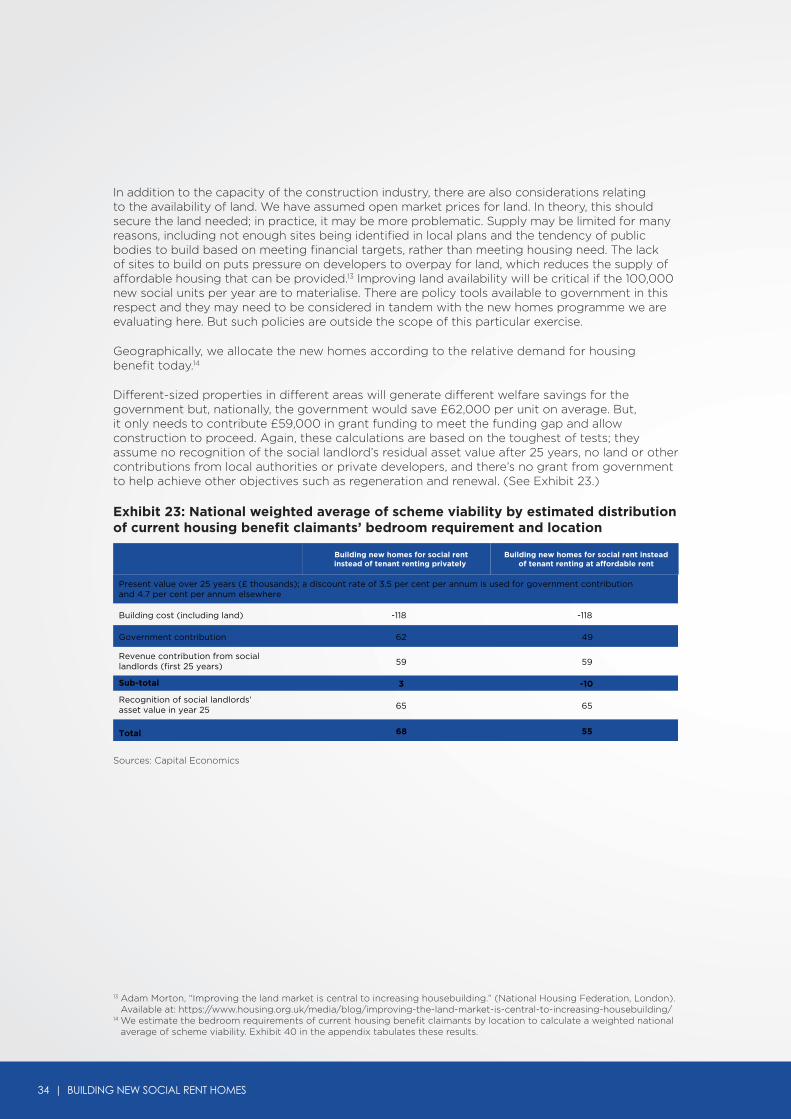
34 | BUILDING NEW SOCIAL RENT HOMES
In addition to the capacity of the construction industry, there are also considerations relating to the availability of land. We have assumed open market prices for land. In theory, this should secure the land needed; in practice, it may be more problematic. Supply may be limited for many reasons, including not enough sites being identified in local plans and the tendency of public bodies to build based on meeting financial targets, rather than meeting housing need. The lack of sites to build on puts pressure on developers to overpay for land, which reduces the supply of affordable housing that can be provided.13 Improving land availability will be critical if the 100,000 new social units per year are to materialise. There are policy tools available to government in this respect and they may need to be considered in tandem with the new homes programme we are evaluating here. But such policies are outside the scope of this particular exercise.
Geographically, we allocate the new homes according to the relative demand for housing benefit today.14
Different-sized properties in different areas will generate different welfare savings for the government but, nationally, the government would save £62,000 per unit on average. But, it only needs to contribute £59,000 in grant funding to meet the funding gap and allow construction to proceed. Again, these calculations are based on the toughest of tests; they assume no recognition of the social landlord’s residual asset value after 25 years, no land or other contributions from local authorities or private developers, and there’s no grant from government to help achieve other objectives such as regeneration and renewal. (See Exhibit 23.)
Exhibit 23: National weighted average of scheme viability by estimated distribution of current housing benefit claimants’ bedroom requirement and location
13 Adam Morton, “Improving the land market is central to increasing housebuilding.” (National Housing Federation, London). Available at: https://www.housing.org.uk/media/blog/improving-the-land-market-is-central-to-increasing-housebuilding/
14 We estimate the bedroom requirements of current housing benefit claimants by location to calculate a weighted national average of scheme viability. Exhibit 40 in the appendix tabulates these results.
Sources: Capital Economics
Present value over 25 years (£ thousands); a discount rate of 3.5 per cent per annum is used for government contributionand 4.7 per cent per annum elsewhere
Building cost (including land) -118 -118
Government contribution 62 49
Revenue contribution from sociallandlords (first 25 years) 59 59
Sub-total 3 -10
65 65
Total 68 55
Building new homes for social rentinstead of tenant renting privately
Building new homes for social rent insteadof tenant renting at affordable rent
Recognition of social landlords’asset value in year 25
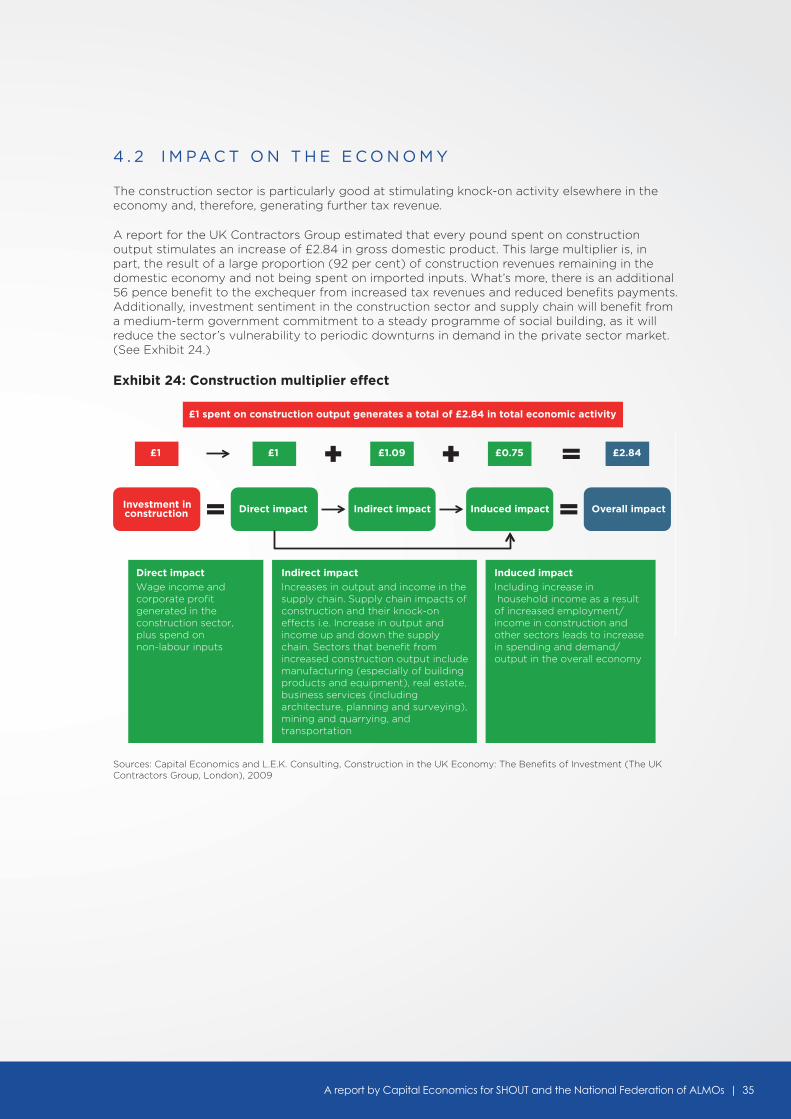
A report by Capital Economics for SHOUT and the National Federation of ALMOs | 35
Sources: Capital Economics and L.E.K. Consulting, Construction in the UK Economy: The Benefits of Investment (The UK Contractors Group, London), 2009
4 . 2 I M PA C T O N T H E E C O N O M Y
The construction sector is particularly good at stimulating knock-on activity elsewhere in the economy and, therefore, generating further tax revenue.
A report for the UK Contractors Group estimated that every pound spent on construction output stimulates an increase of £2.84 in gross domestic product. This large multiplier is, in part, the result of a large proportion (92 per cent) of construction revenues remaining in the domestic economy and not being spent on imported inputs. What’s more, there is an additional 56 pence benefit to the exchequer from increased tax revenues and reduced benefits payments. Additionally, investment sentiment in the construction sector and supply chain will benefit from a medium-term government commitment to a steady programme of social building, as it will reduce the sector’s vulnerability to periodic downturns in demand in the private sector market. (See Exhibit 24.)
Exhibit 24: Construction multiplier effect
£1 spent on construction output generates a total of £2.84 in total economic activity
£1 £1.09 £0.75 £2.84 £1
Investment in construction Direct impact Indirect impact Induced impact Overall impact
Direct impactWage income and corporate profit generated in the construction sector, plus spend on non-labour inputs
Indirect impactIncreases in output and income in the supply chain. Supply chain impacts of construction and their knock-on effects i.e. Increase in output and income up and down the supply chain. Sectors that benefit from increased construction output include manufacturing (especially of building products and equipment), real estate, business services (including architecture, planning and surveying), mining and quarrying, and transportation
Induced impactIncluding increase in household income as a result of increased employment/income in construction and other sectors leads to increase in spending and demand/output in the overall economy
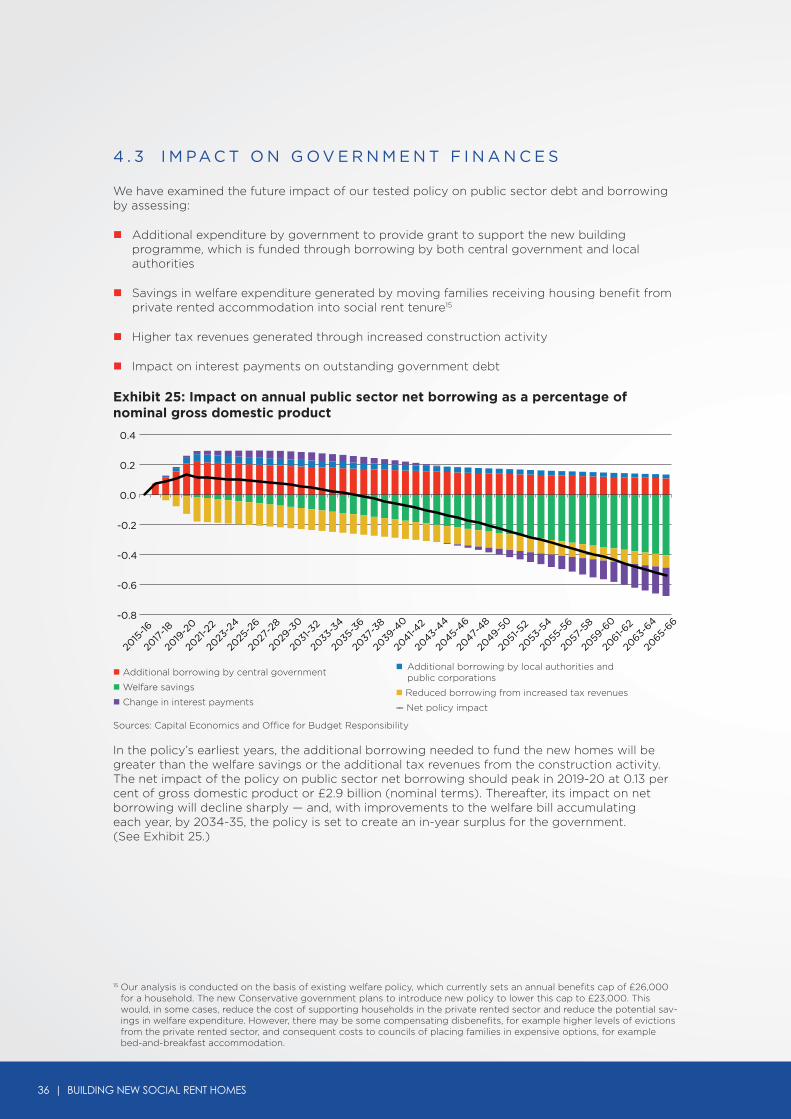
36 | BUILDING NEW SOCIAL RENT HOMES
4 . 3 I M PA C T O N G O V E R N M E N T F I N A N C E S
We have examined the future impact of our tested policy on public sector debt and borrowing by assessing:
n Additional expenditure by government to provide grant to support the new building programme, which is funded through borrowing by both central government and local authorities
n Savings in welfare expenditure generated by moving families receiving housing benefit from private rented accommodation into social rent tenure15
n Higher tax revenues generated through increased construction activity
n Impact on interest payments on outstanding government debt
Exhibit 25: Impact on annual public sector net borrowing as a percentage of nominal gross domestic product
Sources: Capital Economics and Office for Budget Responsibility
In the policy’s earliest years, the additional borrowing needed to fund the new homes will be greater than the welfare savings or the additional tax revenues from the construction activity. The net impact of the policy on public sector net borrowing should peak in 2019-20 at 0.13 per cent of gross domestic product or £2.9 billion (nominal terms). Thereafter, its impact on net borrowing will decline sharply — and, with improvements to the welfare bill accumulating each year, by 2034-35, the policy is set to create an in-year surplus for the government. (See Exhibit 25.)
-0.8
-0.6
-0.4
-0.2
0.0
0.2
0.4
2015
-16
2017
-18
2019
-20
2021
-22
2023
-24
2025
-26
2027
-28
2029
-30
2031
-32
2033
-34
2035
-36
2037
-38
2039
-40
2041-4
2
2043-
44
2045-
46
2047-
48
2049-5
0
2051
-52
2053
-54
2055
-56
2057
-58
2059
-60
2061-6
2
2063-
64
2065-
66
15 Our analysis is conducted on the basis of existing welfare policy, which currently sets an annual benefits cap of £26,000 for a household. The new Conservative government plans to introduce new policy to lower this cap to £23,000. This would, in some cases, reduce the cost of supporting households in the private rented sector and reduce the potential sav-ings in welfare expenditure. However, there may be some compensating disbenefits, for example higher levels of evictions from the private rented sector, and consequent costs to councils of placing families in expensive options, for example bed-and-breakfast accommodation.
n Additional borrowing by central government
n Welfare savings
n Change in interest payments
n Additional borrowing by local authorities and public corporations
n Reduced borrowing from increased tax revenues
–– Net policy impact
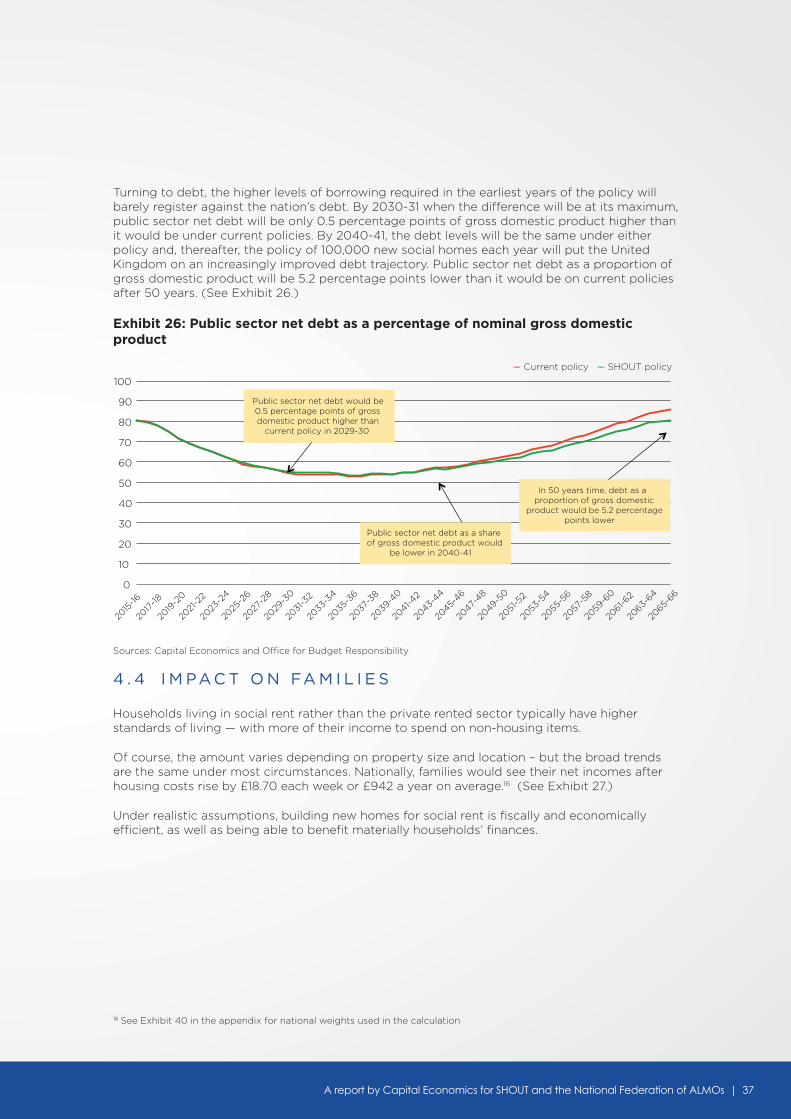
A report by Capital Economics for SHOUT and the National Federation of ALMOs | 37
Turning to debt, the higher levels of borrowing required in the earliest years of the policy will barely register against the nation’s debt. By 2030-31 when the difference will be at its maximum, public sector net debt will be only 0.5 percentage points of gross domestic product higher than it would be under current policies. By 2040-41, the debt levels will be the same under either policy and, thereafter, the policy of 100,000 new social homes each year will put the United Kingdom on an increasingly improved debt trajectory. Public sector net debt as a proportion of gross domestic product will be 5.2 percentage points lower than it would be on current policies after 50 years. (See Exhibit 26.)
Exhibit 26: Public sector net debt as a percentage of nominal gross domestic product
Sources: Capital Economics and Office for Budget Responsibility
4 . 4 I M PA C T O N FA M I L I E S
Households living in social rent rather than the private rented sector typically have higher standards of living — with more of their income to spend on non-housing items.
Of course, the amount varies depending on property size and location – but the broad trends are the same under most circumstances. Nationally, families would see their net incomes after housing costs rise by £18.70 each week or £942 a year on average.16 (See Exhibit 27.)
Under realistic assumptions, building new homes for social rent is fiscally and economically efficient, as well as being able to benefit materially households’ finances.
0
10
20
30
40
50
60
70
80
90
100
2015
-16
2017
-18
2019
-20
2021
-22
2023
-24
2025
-26
2027
-28
2029
-30
2031
-32
2033
-34
2035
-36
2037
-38
2039
-40
2041-4
2
2043-
44
2045-
46
2047-
48
2049-5
0
2051
-52
2053
-54
2055
-56
2057
-58
2059
-60
2061-6
2
2063-
64
2065-
66
In 50 years time, debt as a proportion of gross domestic
product would be 5.2 percentage points lower
Public sector net debt would be 0.5 percentage points of gross domestic product higher than
current policy in 2029-30
Public sector net debt as a share of gross domestic product would
be lower in 2040-41
16 See Exhibit 40 in the appendix for national weights used in the calculation
–– Current policy –– SHOUT policy
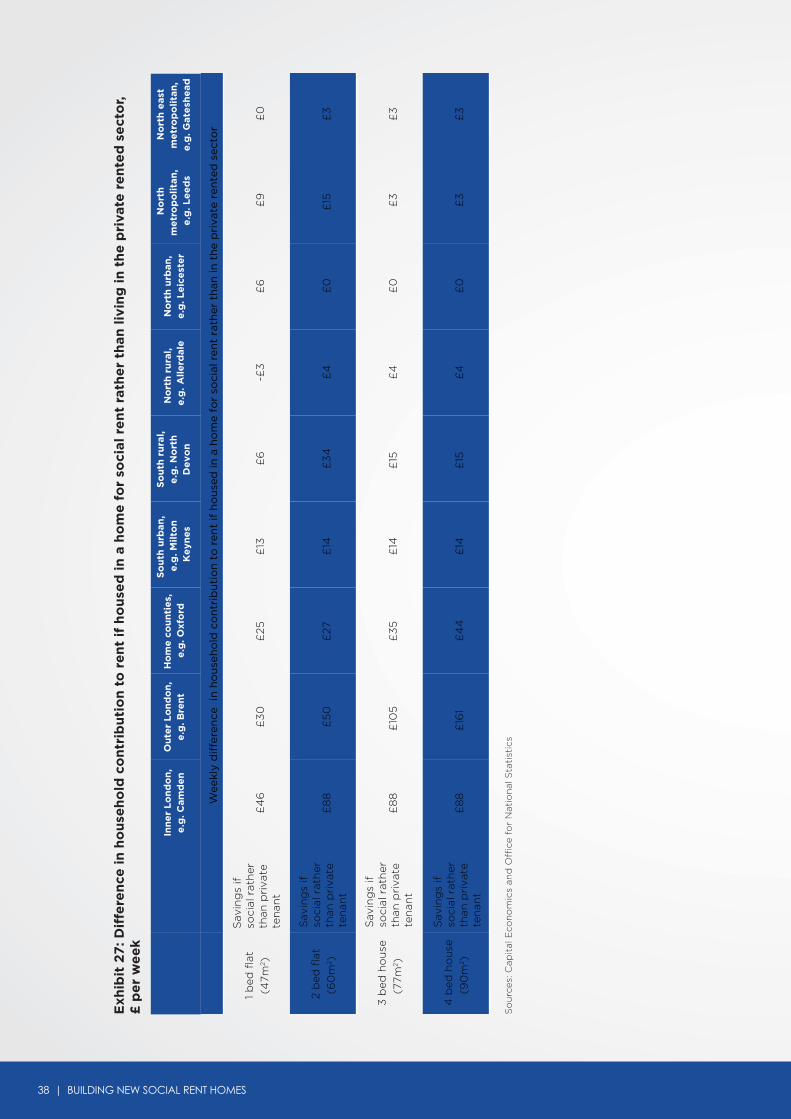
38 | BUILDING NEW SOCIAL RENT HOMES
So
urc
es: C
apit
al E
con
om
ics
and
Offi
ce f
or
Nat
ion
al S
tati
stic
s
Inn
er
Lo
nd
on
, e
.g. C
amd
en
O
ute
r L
on
do
n,
e.g
. Bre
nt
Ho
me
co
un
tie
s,
e.g
. Oxf
ord
So
uth
urb
an,
e.g
. Mil
ton
K
eyn
es
So
uth
ru
ral,
e.g
. No
rth
D
evo
n
No
rth
ru
ral,
e.g
. A
llerd
ale
No
rth
urb
an,
e.g
. Le
ice
ste
r
No
rth
m
etr
op
oli
tan
, e
.g. L
ee
ds
No
rth
eas
t m
etr
op
oli
tan
, e
.g. G
ate
she
ad
Wee
kly
dif
fere
nce
in
ho
use
ho
ld c
on
trib
uti
on
to
ren
t if
ho
use
d in
a h
om
e fo
r so
cial
ren
t ra
ther
th
an in
th
e p
riva
te r
ente
d s
ecto
r
1 b
ed f
lat
(47m
2 )
Sav
ing
s if
soci
al r
ath
erth
an p
riva
tete
nan
t
£4
6£
30
£25
£13
£6
-£3
£6
£9
£0
2 b
ed f
lat
(60
m2 )
Sav
ing
s if
soci
al r
ath
erth
an p
riva
tete
nan
t £
88
£5
0£
27£
14£
34
£4
£0
£15
£3
3 b
ed h
ou
se
(77m
2 )
£8
8£
105
£3
5£
14£
15£
4£
0£
3£
3
4 b
ed h
ou
se
(90
m2 )
£
88
£16
1£
44
£14
£15
£4
£0
£3
£3
Sav
ing
s if
soci
al r
ath
erth
an p
riva
tete
nan
t
Sav
ing
s if
soci
al r
ath
erth
an p
riva
tete
nan
t
Exh
ibit
27
: Dif
fere
nce
in
ho
use
ho
ld c
on
trib
uti
on
to
re
nt
if h
ou
sed
in
a h
om
e f
or
soci
al r
en
t ra
the
r th
an l
ivin
g i
n t
he
pri
vate
re
nte
d s
ect
or,
£
pe
r w
ee
k

A report by Capital Economics for SHOUT and the National Federation of ALMOs | 39
In this section we examine how building new social housing at a significantly greater scale fits in with the current focus on government austerity and whether policies can mitigate any
increase in public sector borrowing over the coming parliament.
S O C I A L H O U S I N G A N D A U S T E R I T Y
40 | BUILDING NEW SOCIAL RENT HOMES
5 . 1 T H E M E R I T S O F A D D I T I O N A L B O R R O W I N G
The new Conservative government is committed to significant further reductions in public spending and a renewed focus on deficit reduction, the shape of which will become clearer in the budget planned for July 2015. Public investment in new social housing might therefore appear vulnerable. In fact, the more sensible stance would be to find ways of increasing investment, which would fundamentally enhance public sector finances.
To deliver the exemplar policy of 100,000 new homes each year, the public sector will need to increase its borrowing by more than it would have done otherwise in the initial years. The policy explored in this report would add to the level of government debt, so that by the end of the current parliament, it would be no more than 0.5 per cent or £8.8 billion higher than under existing arrangements.
In reality, the amount will be lower – because some of the additional cost can and should be met from private sector developer contributions and through redeployment of currently inefficiently used public land.
At first glance, one might think this increased borrowing flies in the face of the government’s commitment to continue significant reductions in spending as a share of gross domestic product. But this fails to recognise the underlying rationale for the current fiscal restraint: namely, to improve the fundamental sustainability of public sector finances.
Not all borrowing is the same.
Politicians are quite right to be concerned about increasing public debt in order to fund the day-to-day costs of public services. As a nation, we are living beyond our collective means if we have to borrow to pay teachers’ wages or to fund the welfare system we have voted for. But this is not what increasing investment in social housing implies.
One good reason for the government to borrow is to invest. ‘Investment’ can be a loaded term and, in modern political discourse, its meaning has often been stretched well beyond any definition to be found in either economics or accounting text books. But, in general, it represents the acquisition of fixed capital – physical assets such as infrastructure, buildings and machinery. These assets have long-term benefits, so it makes sense to borrow now in order to enhance productivity in the future. Compared with other kinds of infrastructure investment, social housing has the additional merit that, once built, the costs of management and maintenance are paid for by the rents tenants pay, in contrast to, for example, roads and schools.
Another sound reason for the government to borrow is to save. The creation of new social housing would significantly reduce the national welfare bill over any reasonable investment time horizon. Families, who would otherwise be housed in the private sector, would now be renting cheaper and better quality homes from a social landlord at a substantially lower cost to the state in annual welfare payments. Over 25 years the government would save £84 billion that would more than remunerate the initial cost of investment.

A report by Capital Economics for SHOUT and the National Federation of ALMOs | 41
5 . 2 G O V E R N M E N T B O R R O W I N G A N D F I S C A L TA R G E T S
Even if government borrowing does rise, there are good reasons to argue that not all public borrowing and spending should be treated the same in fiscal targets. The United Kingdom government targets total debt across the whole public sector. This isn’t standard international practice. Many countries monitor and target the general government measure, which includes both central and local government but excludes public corporations. The housing services activities of local authorities plus their arm’s length management organisations fall under the definition of public corporation and, therefore, their financial liabilities are included in public sector debt but not the general government measure.17
Had the government’s fiscal mandate followed European and international precedent, and been couched in terms of general government rather than public sector debt, it would not have limited affordable home investment conducted by public corporations. (See Exhibit 28.)
Exhibit 28: Public sector borrowing definitions and housing
Source: Capital Economics
We have previously interviewed a number of key individuals in the London bond markets, and they are generally relaxed about the use of general government rather than public sector debt measures (provided there was statistical transparency).18 Indeed, many said that they would welcome further public corporation borrowing if it were to invest sensibly into infrastructure and the built environment. What’s more, there is concern that the nation’s dysfunctional housing market, in London in particular, is eroding economic competitiveness.19 The markets are positive about the government borrowing to invest and borrowing to save.
Public sector Private sector
Count towards generalgovernment debt
Centralgovernment
Localgovernment
Public corporations, e.g. ALMOs, council
housing services and Network Rail
Non-profit corporations, e.g.
housing associations
For-profit corporations, e.g. private developers
Count towards public sector debt
17 Further details can be found in John Perry, Let’s get building (National Federation of ALMOs, York), 201218 Capital Economics, Let’s get building: The view from the City (Capital Economics, London), 201219 The City of London Corporation response to Budget 2015 available at http://news.cityoflondon.gov.uk/
city-of-london-corporation-response-to-budget-2015
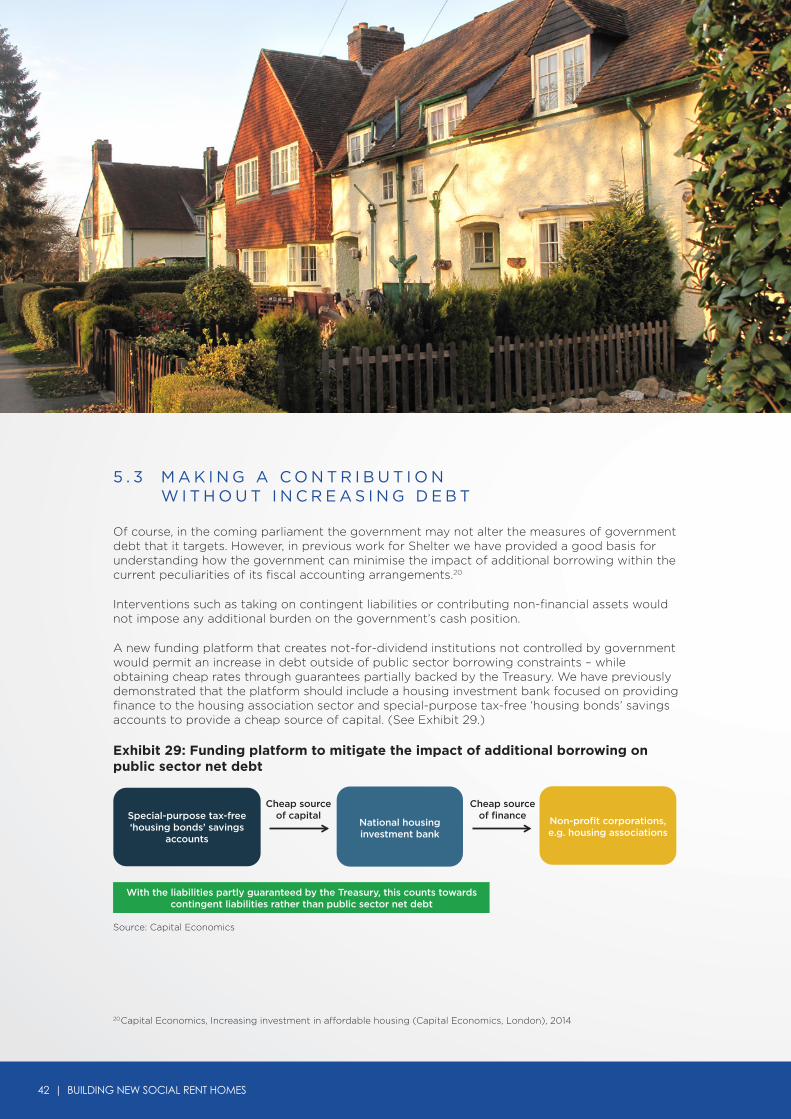
42 | BUILDING NEW SOCIAL RENT HOMES
5 . 3 M A K I N G A C O N T R I B U T I O N W I T H O U T I N C R E A S I N G D E B T
Of course, in the coming parliament the government may not alter the measures of government debt that it targets. However, in previous work for Shelter we have provided a good basis for understanding how the government can minimise the impact of additional borrowing within the current peculiarities of its fiscal accounting arrangements.20
Interventions such as taking on contingent liabilities or contributing non-financial assets would not impose any additional burden on the government’s cash position.
A new funding platform that creates not-for-dividend institutions not controlled by government would permit an increase in debt outside of public sector borrowing constraints – while obtaining cheap rates through guarantees partially backed by the Treasury. We have previously demonstrated that the platform should include a housing investment bank focused on providing finance to the housing association sector and special-purpose tax-free ‘housing bonds’ savings accounts to provide a cheap source of capital. (See Exhibit 29.)
Exhibit 29: Funding platform to mitigate the impact of additional borrowing on public sector net debt
Source: Capital Economics
Special-purpose tax-free ‘housing bonds’ savings
accounts
National housing investment bank
Non-profit corporations, e.g. housing associations
Cheap sourceof capital
Cheap sourceof finance
With the liabilities partly guaranteed by the Treasury, this counts towards contingent liabilities rather than public sector net debt
20 Capital Economics, Increasing investment in affordable housing (Capital Economics, London), 2014

A report by Capital Economics for SHOUT and the National Federation of ALMOs | 43
A national housing investment bank should have the economies of scale and specialised expertise to deliver cost-effective loans to housing associations. With liabilities partly guaranteed by the Treasury, it will be able to issue debt to the open market at favourable rates without detriment to public sector net debt measure. Meanwhile the creation of a new form of tax-free individual savings account, which is marketed and distributed by existing retail banks for a commission, would provide low-cost funds for the housing investment bank.
The government should make best use of its existing assets and deploy publicly owned land to improve the viability and bankability of projects. With land acquisition accounting for a large proportion of the development costs of new housing, the public sector can utilise its own portfolio of property with housing associations and developers to deliver housing schemes that require less up front financial investment.
It is entirely possible for the government not only to assist in delivering new housing for social rent, but also to enhance the sustainability of public finances with limited or no impact on its chosen target measures of borrowing and debt in its fiscal mandate.
Given the medium to long-term pressure on public finances, which are clearly set out by the Office for Budget Responsibility, it would be foolish to pass up the opportunity to make an early investment in heading off avoidable pressures. These pressures consist not just of means-tested benefit support for people in the private rented sector or ‘affordable rent’ housing, but the opportunity to build new stock which is well adapted to the needs of an increasing elderly population.
The Office for Budget Responsibility warns that rising health, pension and social care costs connected to Britain’s ageing population are the biggest challenges for public financing in the coming decades. Future governments would have to cut spending or increase taxes by £15 billion (2014 prices), which is roughly 0.9 per cent of gross domestic product, if they are to reduce the long-term level of national debt to a more sustainable level of 40 per cent of gross domestic product.21 The right housing, in the right locations, can reduce pressures on social care and primary and acute health care, and help to put the country’s finances back on a sustainable path.
21 Office for Budget Responsibility, Fiscal Sustainability report – July 2014 (The Stationary Office, Norwich), 2014

44 | BUILDING NEW SOCIAL RENT HOMES
In this section we examine the broader knock-on social welfare benefits of tenants renting new social housing properties.
B R O A D E R K N O C K- O N S O C I A L W E L FA R E B E N E F I T S
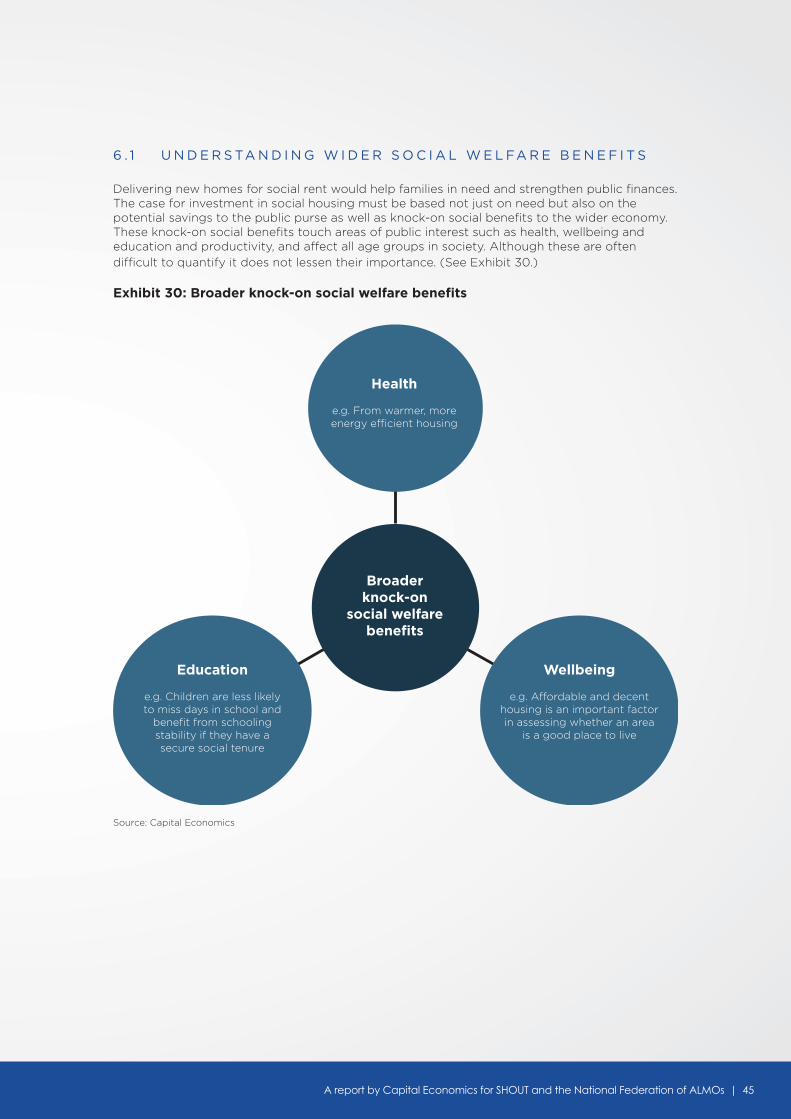
A report by Capital Economics for SHOUT and the National Federation of ALMOs | 45
6 . 1 U N D E R S TA N D I N G W I D E R S O C I A L W E L FA R E B E N E F I T S
Delivering new homes for social rent would help families in need and strengthen public finances. The case for investment in social housing must be based not just on need but also on the potential savings to the public purse as well as knock-on social benefits to the wider economy. These knock-on social benefits touch areas of public interest such as health, wellbeing and education and productivity, and affect all age groups in society. Although these are often difficult to quantify it does not lessen their importance. (See Exhibit 30.)
Exhibit 30: Broader knock-on social welfare benefits
Source: Capital Economics
Education
e.g. Children are less likely to miss days in school and
benefit from schooling stability if they have a secure social tenure
Wellbeing
e.g. Affordable and decent housing is an important factor in assessing whether an area
is a good place to live
Broader knock-on
social welfare benefits
Health
e.g. From warmer, more energy efficient housing

46 | BUILDING NEW SOCIAL RENT HOMES
Building new social homes would give many households a higher quality of living space than they would otherwise have had in older private rented sector properties. A higher standard of home will generally have better energy efficiency, keep its tenants warm and have lower risk of damp and mould. Minimising these risks would be particularly beneficial for typically more vulnerable members of society, such as older people. Cold homes, fuel poverty and problems with damp and mould are associated with cardiovascular and respiratory problems, while poorer quality housing stock has been associated with excess winter deaths in the United Kingdom compared with colder countries in Scandinavia.22 A healthier population would ease the burden on the National Health Service, with the total health cost of poor housing in England estimated as over £600 million each year.23
Much of the existing housing stock is not only of poor quality, but is also largely unsuitable for the needs of Britain’s ageing population. Indeed, the vast majority of severe hazards in poor housing are associated with people having falls.24 Developing new high quality social homes which are well-located, easy to manage, accessible and where support and care can be provided cost-effectively would help reduce public service pressure on social care and health.25 What’s more, new development of specialist housing and smaller properties for those wishing to downsize would help reduce the prevalence of under-occupation, across all tenures.26
Living in affordable and decent housing is important to families. Household incomes are likely to be higher after housing costs if they pay social rather than market rents, giving greater financial security and improving the wellbeing of the family. Moreover a less constrained budget will put households under less pressure to under-heat their homes and decrease the risk of stress and family conflict. Affordable decent housing was voted the fourth most important thing that people thought made an area a good place to live.27 Tenants are more likely to find a home is of decent standard in the social rented sector. For 2012, the English Housing Survey found that a third of homes in the private rented sector were not of a decent standard, compared with just fifteen per cent in the social rented sector.28
Good quality social housing can also level opportunities in childhood and future participation in the labour market. Poor housing conditions have a damaging impact on learning and productivity. Children living in overcrowded or damp conditions are more likely to miss school.29 Meanwhile, social housing can provide a secure tenure for families and eliminate the need to move schools frequently. Educational attainment suffers when children are forced to move schools within the school year. Attending a single school can provide children with a stable influence and enhance their learning outcomes, providing not only better employment prospects for them in the future but also a more productive workforce for the economy.
22 Paul Wilkinson et al., Cold comfort – the social and environmental determinants of excess winter deaths in England, 1986-96(The Policy Press, Bristol), 2001
23 Maggie Davidson et al., The real cost of poor housing (BRE electronic publications), 201024 NHS Future Forum, Integration: a report from the NHS Future Forum (Department of Health, London), 201225 Martin Wheatley, are housing associations ready for an ageing population? (The Smith Institute, London), 201526 Richard Best and Jeremy Porteus, Housing our Ageing Population: Plan for Implementation (All party parliamentary
group on housing and care for older people, London), 2012 and Claudia Wood, The top of the Ladder (Demos, London) 2013
27 Department for Communities and Local Government, Place Survey 2008 (Department for Communities and Local Government, London), 2008
28 Department for Communities and Local Government, English housing survey 2012 (Department for Communities and Local Government, London), 2014
29 Shelter, Chance of a lifetime – the impact of bad housing on children’s lives (Shelter, London), 2006

A report by Capital Economics for SHOUT and the National Federation of ALMOs | 47
A P P E N D I X : A D D I T I O N A L A N A LY T I C A L D E TA I L
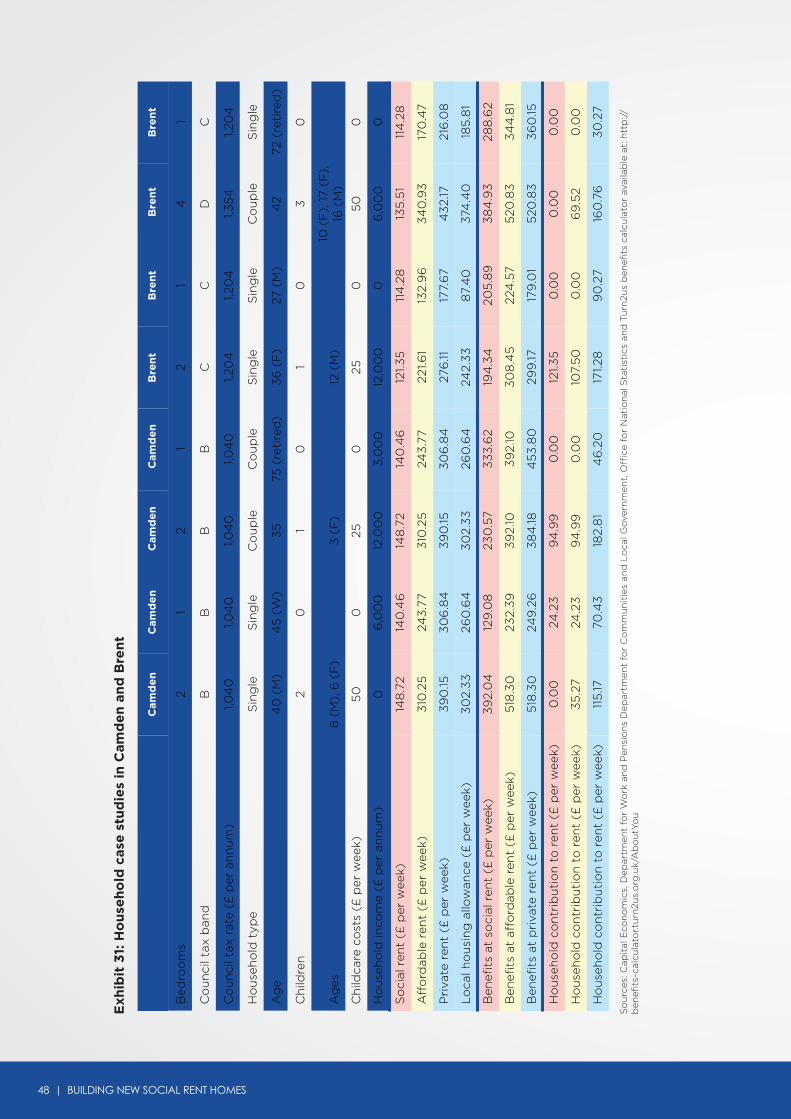
48 | BUILDING NEW SOCIAL RENT HOMES
Exh
ibit
31:
Ho
use
ho
ld c
ase
stu
die
s in
Cam
de
n a
nd
Bre
nt
So
urc
es: C
apit
al E
con
om
ics,
Dep
artm
ent
for
Wo
rk a
nd
Pen
sio
ns
Dep
artm
ent
for
Co
mm
un
itie
s an
d L
oca
l Go
vern
men
t, O
ffice
fo
r N
atio
nal
Sta
tist
ics
and
Tu
rn2u
s b
enefi
ts c
alcu
lato
r av
aila
ble
at:
htt
p://
ben
efits
-cal
cula
tor.t
urn
2us.
org
.uk/
Ab
ou
tYo
u
Bed
roo
ms
2 1
2 1
2 1
4
1
Co
un
cil t
ax b
and
B
B
B
B
C
C
D
C
Co
un
cil t
ax r
ate
(£ p
er a
nn
um
) 1,0
40
1,0
40
1,0
40
1,0
40
1,2
04
1,2
04
1,3
54
1,2
04
Ho
use
ho
ld t
ype
Sin
gle
S
ing
le
Co
up
le
Co
up
le
Sin
gle
S
ing
le
Co
up
le
Sin
gle
Ag
e 4
0 (
M)
45
(W
) 3
5
75 (
reti
red
) 3
6 (
F)
27 (
M)
42
72 (
reti
red
)
Ch
ildre
n
2 0
1
0
1 0
3
0
Ag
es
8 (
M),
6 (
F)
3
(F
)
12 (
M)
10
(F
), 1
7 (F
),
16 (
M)
Ch
ildca
re c
ost
s (£
per
wee
k)
50
0
25
0
25
0
5
0
0
Ho
use
ho
ld in
com
e (£
per
an
nu
m)
0
6,0
00
12
,00
0
3,0
00
12
,00
0
0
6,0
00
0
So
cial
ren
t (£
per
wee
k)
148
.72
140
.46
14
8.7
2 14
0.4
6
121.3
5
114
.28
13
5.5
1 11
4.2
8
Aff
ord
able
ren
t (£
per
wee
k)
310
.25
24
3.7
7 3
10.2
5
243
.77
221.6
1 13
2.9
6
34
0.9
3
170
.47
Pri
vate
ren
t (£
per
wee
k)
39
0.15
3
06
.84
3
90
.15
30
6.8
4
276
.11
177.
67
43
2.17
21
6.0
8
Lo
cal h
ou
sin
g a
llow
ance
(£
per
wee
k)
30
2.3
3
260
.64
3
02.
33
26
0.6
4
242.
33
8
7.4
0
374
.40
18
5.8
1
Ben
efit
s at
so
cial
ren
t (£
per
wee
k)
39
2.0
4
129
.08
23
0.5
7 3
33
.62
194
.34
20
5.8
9
38
4.9
3
288
.62
Ben
efit
s at
aff
ord
able
ren
t (£
per
wee
k)
518
.30
23
2.3
9
39
2.10
3
92.
10
30
8.4
5
224
.57
520
.83
3
44
.81
Ben
efit
s at
pri
vate
ren
t (£
per
wee
k)
518
.30
24
9.2
6
38
4.18
4
53
.80
29
9.17
17
9.0
1 52
0.8
3
36
0.15
Ho
use
ho
ld c
on
trib
uti
on
to
ren
t (£
per
wee
k)
0.0
0
24.2
3
94
.99
0
. 00
12
1.35
0
.00
0
.00
0
.00
Ho
use
ho
ld c
on
trib
uti
on
to
ren
t (£
per
wee
k)
35
.27
24.2
3
94
.99
0
.00
10
7.5
0
0.0
0
69
.52
0.0
0
Ho
use
ho
ld c
on
trib
uti
on
to
ren
t (£
per
wee
k)
115
.17
70.4
3
182.
81
46
.20
17
1.28
9
0.2
7 16
0.7
6
30
.27
Cam
de
nC
amd
en
Cam
de
nC
amd
en
Bre
nt
Bre
nt
Bre
nt
Bre
nt
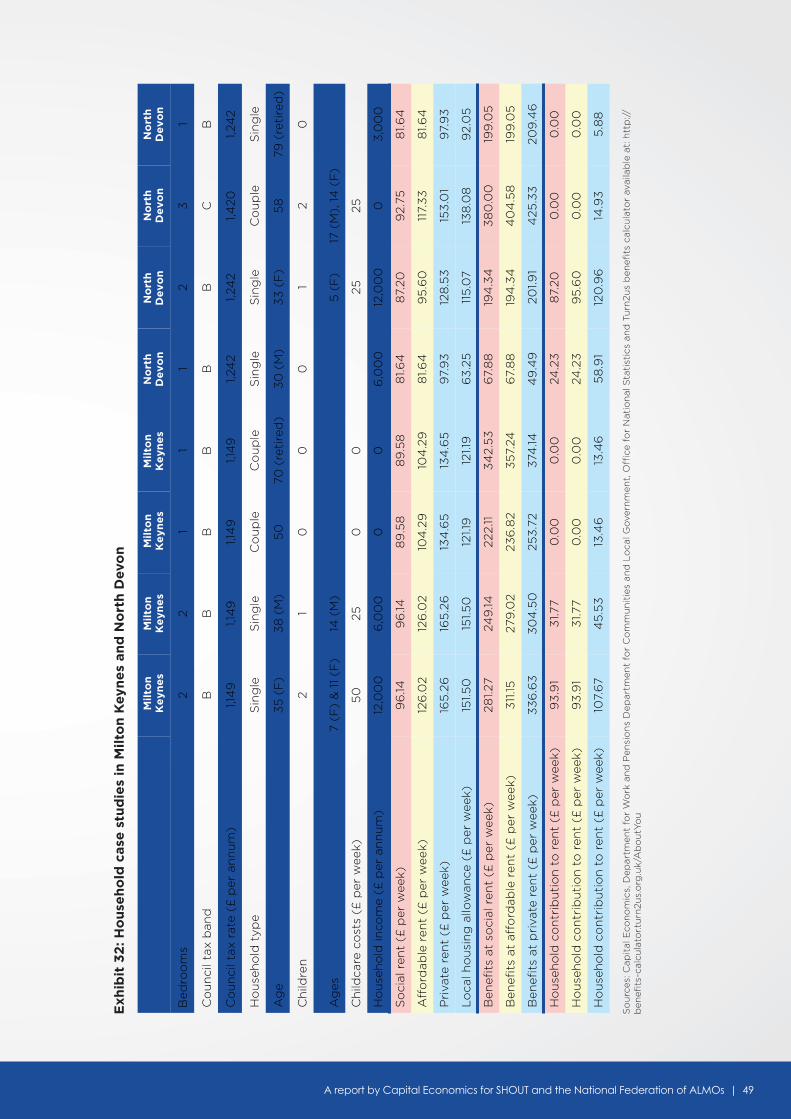
A report by Capital Economics for SHOUT and the National Federation of ALMOs | 49
Exh
ibit
32
: Ho
use
ho
ld c
ase
stu
die
s in
Mil
ton
Key
ne
s an
d N
ort
h D
evo
n
So
urc
es: C
apit
al E
con
om
ics,
Dep
artm
ent
for
Wo
rk a
nd
Pen
sio
ns
Dep
artm
ent
for
Co
mm
un
itie
s an
d L
oca
l Go
vern
men
t, O
ffice
fo
r N
atio
nal
Sta
tist
ics
and
Tu
rn2u
s b
enefi
ts c
alcu
lato
r av
aila
ble
at:
htt
p://
ben
efits
-cal
cula
tor.t
urn
2us.
org
.uk/
Ab
ou
tYo
u
Mil
ton
Ke
yne
s
2 2
1 1
1 2
3
1
Co
un
cil t
ax b
and
B
B
B
B
B
B
C
B
Co
un
cil t
ax r
ate
(£ p
er a
nn
um
) 1,1
49
1,1
49
1,1
49
1,1
49
1,2
42
1,24
2 1,4
20
1,24
2
Ho
use
ho
ld t
ype
Sin
gle
S
ing
le
Co
up
le
Co
up
le
Sin
gle
S
ing
le
Co
up
le
Sin
gle
Ag
e 3
5 (
F)
38
(M
) 5
0
70 (
reti
red
) 3
0 (
M)
33
(F
) 5
8
79 (
reti
red
)
Ch
ildre
n
2 1
0
0
0
1 2
0
Ag
es
7 (F
) &
11
(F)
14 (
M)
5
(F
) 17
(M
), 1
4 (
F)
Ch
ildca
re c
ost
s (£
per
wee
k)
50
25
0
0
25
25
Ho
use
ho
ld in
com
e (£
per
an
nu
m)
12,0
00
6
,00
0
0
0
6,0
00
12
,00
0
0
3,0
00
So
cial
ren
t (£
per
wee
k)
96
.14
96
.14
89
.58
8
9.5
8
81.6
4
87.
20
92.
75
81.6
4
Aff
ord
able
ren
t (£
per
wee
k)
126
.02
126
.02
104
.29
10
4.2
9
81.6
4
95
.60
11
7.3
3
81.6
4
Pri
vate
ren
t (£
per
wee
k)
165
.26
16
5.2
6
134
.65
13
4.6
5
97.
93
12
8.5
3
153
.01
97.
93
Lo
cal h
ou
sin
g a
llow
ance
(£
per
wee
k)
151.5
0
151.5
0
121.1
9
121.1
9
63
.25
11
5.0
7 13
8.0
8
92.
05
Ben
efit
s at
so
cial
ren
t (£
per
wee
k)
281.2
7 24
9.14
22
2.11
3
42.
53
6
7.8
8
194
.34
3
80
.00
19
9.0
5
Ben
efit
s at
aff
ord
able
ren
t (£
per
wee
k)
311
.15
279
.02
236
.82
357
.24
6
7.8
8
194
.34
4
04
.58
19
9.0
5
Ben
efit
s at
pri
vate
ren
t (£
per
wee
k)
33
6.6
3
30
4.5
0
253
.72
374
.14
49
.49
20
1.91
425
.33
20
9.4
6
Ho
use
ho
ld c
on
trib
uti
on
to
ren
t (£
per
wee
k)
93
.91
31.7
7 0
.00
0
.00
24
.23
8
7.20
0
.00
0
.00
Ho
use
ho
ld c
on
trib
uti
on
to
ren
t (£
per
wee
k)
93
.91
31.7
7 0
.00
0
.00
24
.23
9
5.6
0
0.0
0
0.0
0
Ho
use
ho
ld c
on
trib
uti
on
to
ren
t (£
per
wee
k)
107.
67
45
.53
13
.46
13
.46
5
8.9
1 12
0.9
6
14.9
3
5.8
8
Mil
ton
Ke
yne
sM
ilto
nK
eyn
es
Mil
ton
Ke
yne
sN
ort
hD
ev
on
No
rth
De
vo
nN
ort
hD
ev
on
No
rth
De
vo
n
Bed
roo
ms
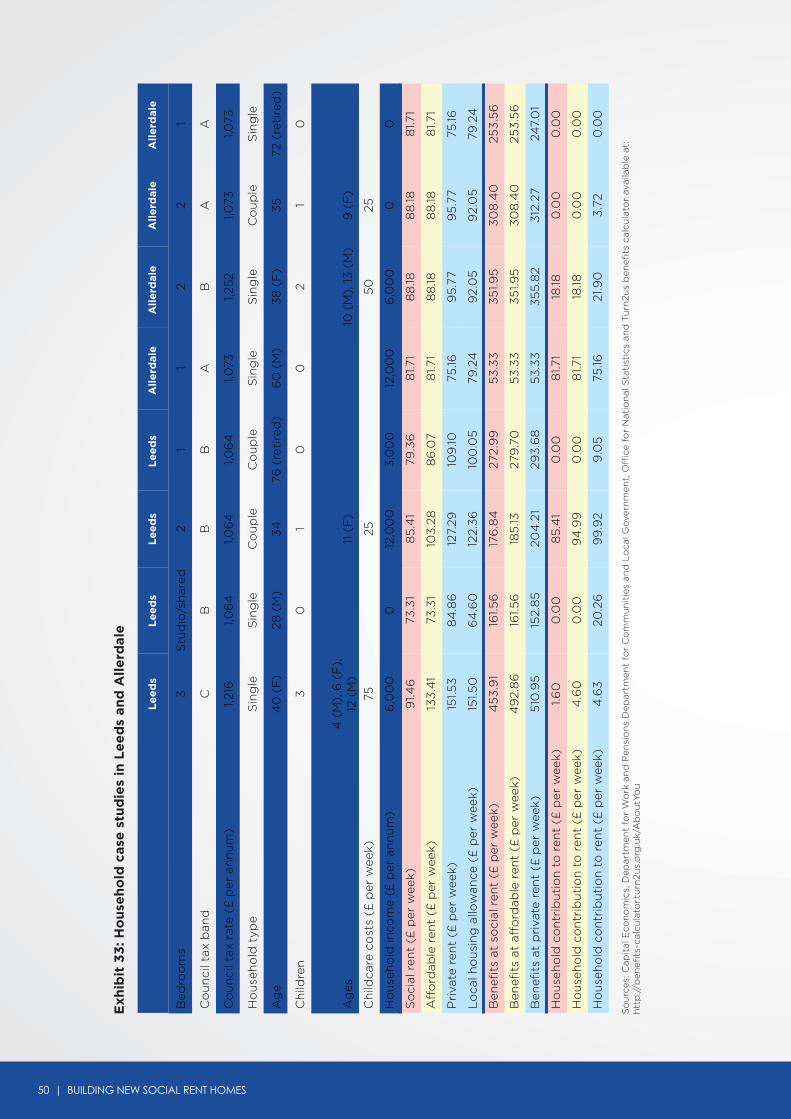
50 | BUILDING NEW SOCIAL RENT HOMES
Exh
ibit
33
: Ho
use
ho
ld c
ase
stu
die
s in
Le
ed
s an
d A
lle
rdal
e
So
urc
es: C
apit
al E
con
om
ics,
Dep
artm
ent
for
Wo
rk a
nd
Pen
sio
ns
Dep
artm
ent
for
Co
mm
un
itie
s an
d L
oca
l Go
vern
men
t, O
ffice
fo
r N
atio
nal
Sta
tist
ics
and
Tu
rn2u
s b
enefi
ts c
alcu
lato
r av
aila
ble
at:
htt
p://
ben
efits
-cal
cula
tor.t
urn
2us.
org
.uk/
Ab
ou
tYo
u
All
erd
ale
Bed
roo
ms
3
Stu
dio
/sh
ared
2
1 1
2 2
1
Co
un
cil t
ax b
and
C
B
B
B
A
B
A
A
Co
un
cil t
ax r
ate
(£ p
er a
nn
um
) 1,2
16
1,06
4
1,06
4
1,06
4
1,073
1,2
52
1,073
1,0
73
Ho
use
ho
ld t
ype
Sin
gle
S
ing
le
Co
up
le
Co
up
le
Sin
gle
S
ing
le
Co
up
le
Sin
gle
Ag
e 4
0 (
F)
28 (
M)
34
76
(re
tire
d)
60
(M
) 3
8 (
F)
35
72
(re
tire
d)
Ch
ildre
n
3
0
1 0
0
2
1 0
Ag
es
4 (
M),
6 (
F),
12
(M
)
11 (
F)
10 (
M),
13
(M
) 9
(F
)
Ch
ildca
re c
ost
s (£
per
wee
k)
75
25
5
0
25
Ho
use
ho
ld in
com
e (£
per
an
nu
m)
6,0
00
0
12
,00
0
3,0
00
12
,00
0
6,0
00
0
0
So
cial
ren
t (£
per
wee
k)
91.4
6
73.3
1 8
5.4
1 79
.36
8
1.71
88
.18
88
.18
81.7
1
Aff
ord
able
ren
t (£
per
wee
k)
133
.41
73.3
1 10
3.2
8
86
.07
81.7
1 8
8.18
8
8.18
8
1.71
Pri
vate
ren
t (£
per
wee
k)
151.5
3
84
.86
12
7.29
10
9.10
75
.16
95
.77
95
.77
75.16
Lo
cal h
ou
sin
g a
llow
ance
(£
per
wee
k)
151.5
0
64
.60
12
2.3
6
100
.05
79
.24
9
2.0
5
92.
05
79
.24
Ben
efit
s at
so
cial
ren
t (£
per
wee
k)
453
.91
161.5
6
176
.84
27
2.9
9
53.3
3
35
1.95
3
08
.40
25
3.5
6
Ben
efit
s at
aff
ord
able
ren
t (£
per
wee
k)
49
2.8
6
161.5
6
185
.13
279
.70
53
.33
3
51.9
5
30
8.4
0
253
.56
Ben
efit
s at
pri
vate
ren
t (£
per
wee
k)
510
.95
15
2.8
5
204
.21
293
.68
53
.33
3
55
.82
312
.27
247.
01
Ho
use
ho
ld c
on
trib
uti
on
to
ren
t (£
per
wee
k)
1.60
0
.00
8
5.4
1 0
.00
8
1.71
18.18
0
.00
0
.00
Ho
use
ho
ld c
on
trib
uti
on
to
ren
t (£
per
wee
k)
4.6
0
0.0
0
94
.99
0
.00
8
1.71
18.18
0
.00
0
.00
Ho
use
ho
ld c
on
trib
uti
on
to
ren
t (£
per
wee
k)
4.6
3
20.2
6
99
.92
9.0
5
75.16
21
.90
3
.72
0.0
0
Le
ed
sL
ee
ds
Le
ed
sL
ee
ds
All
erd
ale
A
lle
rdal
e
All
erd
ale
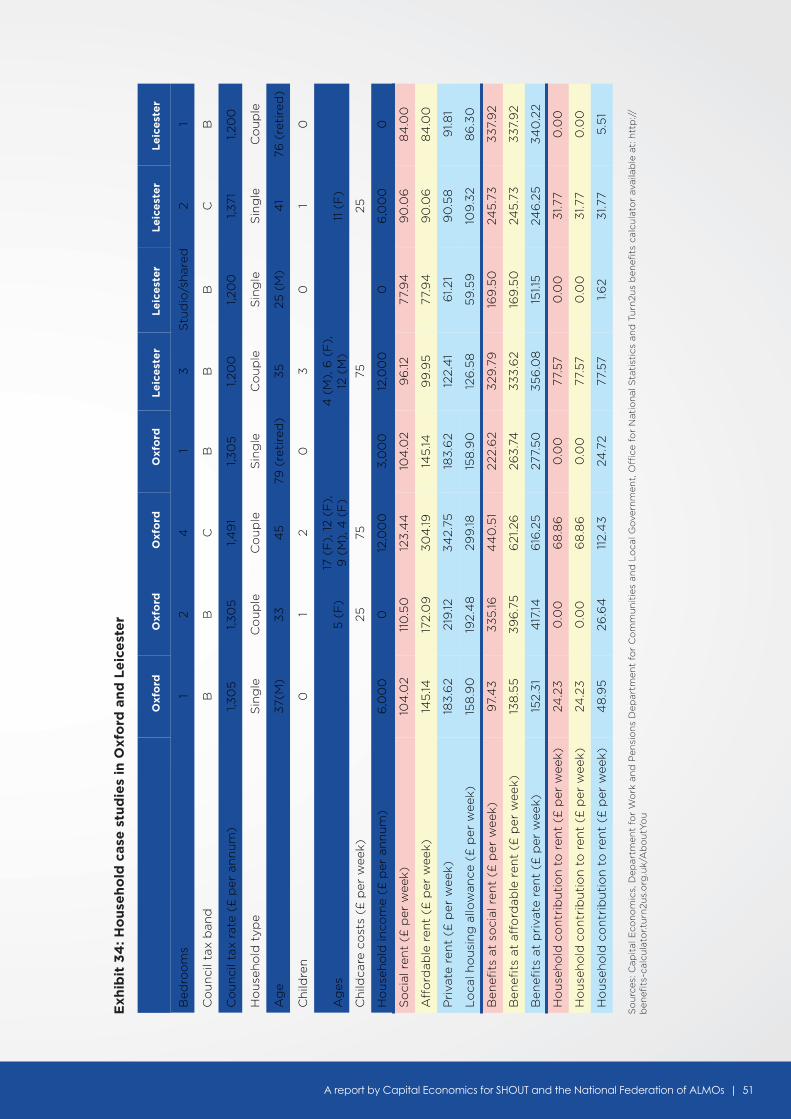
A report by Capital Economics for SHOUT and the National Federation of ALMOs | 51
Exh
ibit
34
: Ho
use
ho
ld c
ase
stu
die
s in
Oxf
ord
an
d L
eic
est
er
So
urc
es: C
apit
al E
con
om
ics,
Dep
artm
ent
for
Wo
rk a
nd
Pen
sio
ns
Dep
artm
ent
for
Co
mm
un
itie
s an
d L
oca
l Go
vern
men
t, O
ffice
fo
r N
atio
nal
Sta
tist
ics
and
Tu
rn2u
s b
enefi
ts c
alcu
lato
r av
aila
ble
at:
htt
p://
ben
efits
-cal
cula
tor.t
urn
2us.
org
.uk/
Ab
ou
tYo
u
Oxf
ord
O
xfo
rd
Oxf
ord
O
xfo
rd
Le
ice
ste
r L
eic
est
er
Le
ice
ste
r L
eic
est
er
Bed
roo
ms
1 2
4
1 3
S
tud
io/s
har
ed
2 1
Co
un
cil t
ax b
and
B
B
C
B
B
B
C
B
Co
un
cil t
ax r
ate
(£ p
er a
nn
um
) 1,3
05
1,3
05
1,4
91
1,30
5
1,20
0
1,20
0
1,371
1,2
00
Ho
use
ho
ld t
ype
Sin
gle
C
ou
ple
C
ou
ple
S
ing
le
Co
up
le
Sin
gle
S
ing
le
Co
up
le
Ag
e 37
(M)
33
4
5
79 (
reti
red
) 3
5
25 (
M)
41
76 (
reti
red
)
Ch
ildre
n
0
1 2
0
3
0
1 0
Ag
es
5
(F
) 17
(F
), 1
2 (F
),
9 (
M),
4 (
F)
4
(M
), 6
(F
),
12 (
M)
11
(F
)
Ch
ildca
re c
ost
s (£
per
wee
k)
25
75
75
25
Ho
use
ho
ld in
com
e (£
per
an
nu
m)
6,0
00
0
12
,00
0
3,0
00
12
,00
0
0
6,0
00
0
So
cial
ren
t (£
per
wee
k)
104
.02
110
.50
12
3.4
4
104
.02
96
.12
77.9
4
90
.06
8
4.0
0
Aff
ord
able
ren
t (£
per
wee
k)
145
.14
172.
09
3
04
.19
145
.14
99
.95
77
.94
9
0.0
6
84
.00
Pri
vate
ren
t (£
per
wee
k)
183
.62
219
.12
34
2.75
18
3.6
2 12
2.4
1 6
1.21
90
.58
9
1.81
Lo
cal h
ou
sin
g a
llow
ance
(£
per
wee
k)
158
.90
19
2.4
8
299
.18
158
.90
12
6.5
8
59.5
9
109
.32
86
.30
Ben
efit
s at
so
cial
ren
t (£
per
wee
k)
97.
43
3
35
.16
44
0.5
1 22
2.6
2 3
29.7
9
169
.50
24
5.7
3
337
.92
Ben
efit
s at
aff
ord
able
ren
t (£
per
wee
k)
138
.55
3
96
.75
6
21.2
6
263
.74
3
33
.62
169
.50
24
5.7
3
337
.92
Ben
efit
s at
pri
vate
ren
t (£
per
wee
k)
152.
31
417
.14
616
.25
27
7.5
0
35
6.0
8
151.1
5
246
.25
3
40
.22
Ho
use
ho
ld c
on
trib
uti
on
to
ren
t (£
per
wee
k)
24.2
3
0.0
0
68
.86
0
.00
77
.57
0.0
0
31.7
7 0
.00
Ho
use
ho
ld c
on
trib
uti
on
to
ren
t (£
per
wee
k)
24.2
3
0.0
0
68
.86
0
.00
77
.57
0.0
0
31.7
7 0
.00
Ho
use
ho
ld c
on
trib
uti
on
to
ren
t (£
per
wee
k)
48
.95
26
.64
11
2.4
3
24.7
2 77
.57
1.62
31.7
7 5
.51
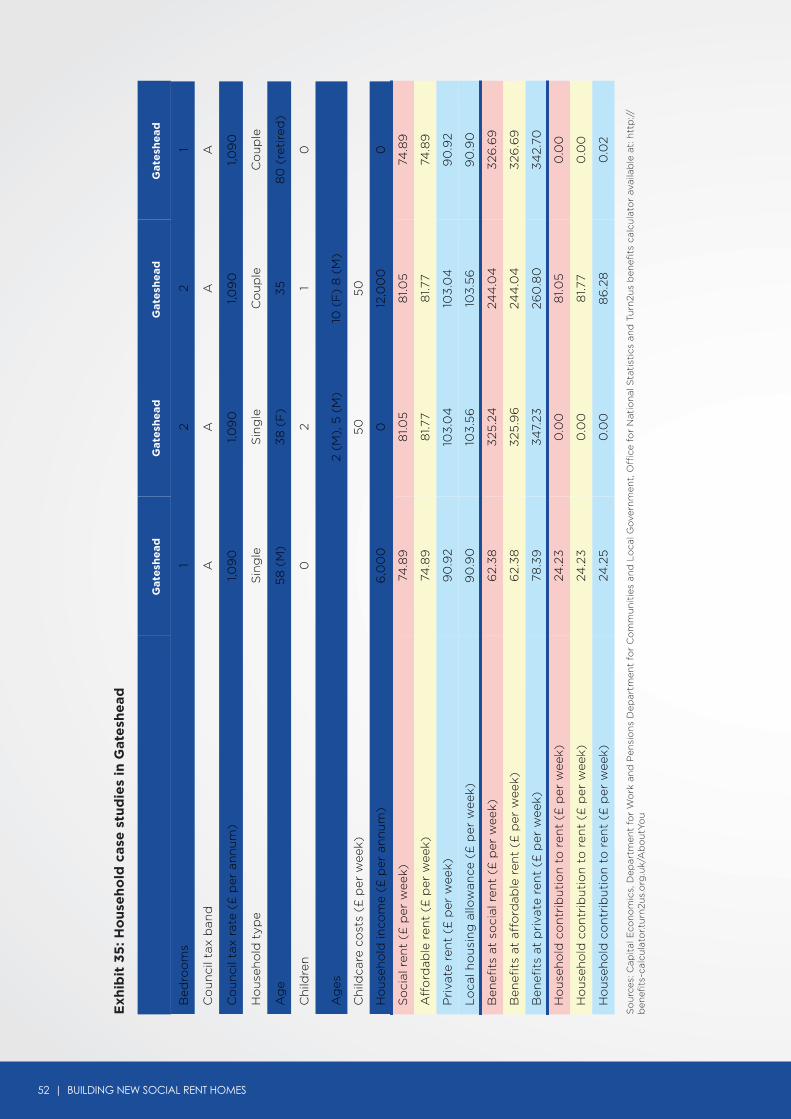
52 | BUILDING NEW SOCIAL RENT HOMES
Exh
ibit
35
: Ho
use
ho
ld c
ase
stu
die
s in
Gat
esh
ead
So
urc
es: C
apit
al E
con
om
ics,
Dep
artm
ent
for
Wo
rk a
nd
Pen
sio
ns
Dep
artm
ent
for
Co
mm
un
itie
s an
d L
oca
l Go
vern
men
t, O
ffice
fo
r N
atio
nal
Sta
tist
ics
and
Tu
rn2u
s b
enefi
ts c
alcu
lato
r av
aila
ble
at:
htt
p://
ben
efits
-cal
cula
tor.t
urn
2us.
org
.uk/
Ab
ou
tYo
u
Gat
esh
ead
G
ate
she
ad
Gat
esh
ead
G
ate
she
ad
Bed
roo
ms
1 2
2 1
Co
un
cil t
ax b
and
A
A
A
A
Co
un
cil t
ax r
ate
(£ p
er a
nn
um
) 1,0
90
1,0
90
1,0
90
1,0
90
Ho
use
ho
ld t
ype
Sin
gle
S
ing
le
Co
up
le
Co
up
le
Ag
e 5
8 (
M)
38
(F
) 3
5
80
(re
tire
d)
Ch
ildre
n
0
2 1
0
Ag
es
2
(M),
5 (
M)
10 (
F)
8 (
M)
Ch
ildca
re c
ost
s (£
per
wee
k)
5
0
50
Ho
use
ho
ld in
com
e (£
per
an
nu
m)
6,0
00
0
12
,00
0
0
So
cial
ren
t (£
per
wee
k)
74.8
9
81.0
5
81.0
5
74.8
9
Aff
ord
able
ren
t (£
per
wee
k)
74.8
9
81.7
7 8
1.77
74.8
9
Pri
vate
ren
t (£
per
wee
k)
90
.92
103
.04
10
3.0
4
90
.92
Lo
cal h
ou
sin
g a
llow
ance
(£
per
wee
k)
90
.90
10
3.5
6
103
.56
9
0.9
0
Ben
efit
s at
so
cial
ren
t (£
per
wee
k)
62.
38
3
25.2
4
244
.04
3
26.6
9
Ben
efit
s at
aff
ord
able
ren
t (£
per
wee
k)
62.
38
3
25.9
6
244
.04
3
26.6
9
Ben
efit
s at
pri
vate
ren
t (£
per
wee
k)
78.3
9
34
7.23
26
0.8
0
34
2.70
Ho
use
ho
ld c
on
trib
uti
on
to
ren
t (£
per
wee
k)
24.2
3
0.0
0
81.0
5
0.0
0
Ho
use
ho
ld c
on
trib
uti
on
to
ren
t (£
per
wee
k)
24.2
3
0.0
0
81.7
7 0
.00
Ho
use
ho
ld c
on
trib
uti
on
to
ren
t (£
per
wee
k)
24.2
5
0.0
0
86
.28
0
.02
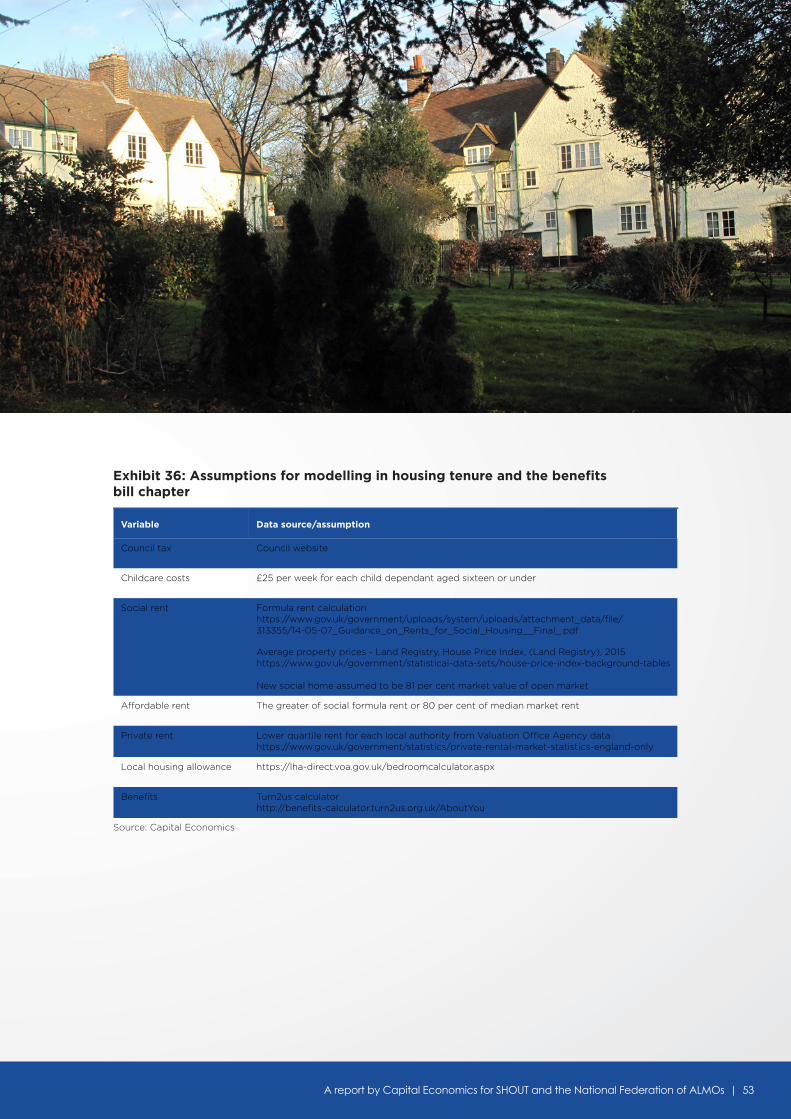
A report by Capital Economics for SHOUT and the National Federation of ALMOs | 53
Exhibit 36: Assumptions for modelling in housing tenure and the benefits bill chapter
Source: Capital Economics
Variable Data source/assumption
Council tax Council website
Childcare costs £25 per week for each child dependant aged sixteen or under
Social rent Formula rent calculation https://www.gov.uk/government/uploads/system/uploads/attachment_data/file/313355/14-05-07_Guidance_on_Rents_for_Social_Housing__Final_.pdf
Average property prices - Land Registry, House Price Index, (Land Registry), 2015 https://www.gov.uk/government/statistical-data-sets/house-price-index-background-tables
New social home assumed to be 81 per cent market value of open market
Affordable rent The greater of social formula rent or 80 per cent of median market rent
Private rent Lower quartile rent for each local authority from Valuation Office Agency data https://www.gov.uk/government/statistics/private-rental-market-statistics-england-only
Local housing allowance https://lha-direct.voa.gov.uk/bedroomcalculator.aspx
Benefits Turn2us calculator http://benefits-calculator.turn2us.org.uk/AboutYou
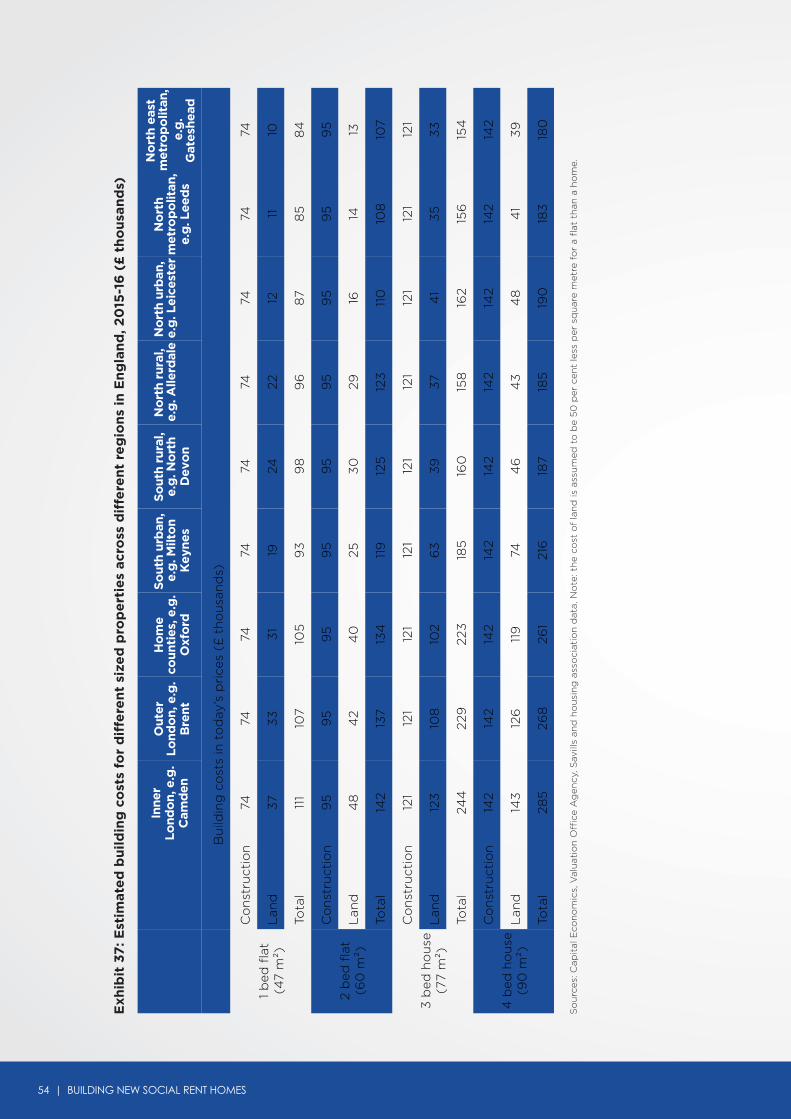
54 | BUILDING NEW SOCIAL RENT HOMES
Exh
ibit
37
: Est
imat
ed
bu
ild
ing
co
sts
for
dif
fere
nt
size
d p
rop
ert
ies
acro
ss d
iffe
ren
t re
gio
ns
in E
ng
lan
d, 2
015
-16
(£
th
ou
san
ds)
So
urc
es: C
apit
al E
con
om
ics,
Val
uat
ion
Offi
ce A
gen
cy, S
avill
s an
d h
ou
sin
g a
sso
ciat
ion
dat
a. N
ote
: th
e co
st o
f la
nd
is a
ssu
med
to
be
50
per
cen
t le
ss p
er s
qu
are
met
re f
or
a fl
at t
han
a h
om
e.
Inne
rLo
ndo
n, e
.g.
Cam
den
Out
er
Lond
on,
e.g
. B
rent
Ho
me
coun
ties
, e.g
. O
xfo
rd
So
uth
urb
an,
e.g
. Milt
on
Key
nes
So
uth
rura
l, e.
g. N
ort
h D
evo
n
No
rth
rura
l, e.
g. A
llerd
ale
No
rth
urb
an,
e.g
. Lei
cest
er
No
rth
met
rop
olit
an,
e.g
. Lee
ds
No
rth
east
m
etro
po
litan
, e.
g.
Gat
eshe
ad
Bu
ildin
g c
ost
s in
to
day
’s p
rice
s (£
th
ou
san
ds)
1 b
ed f
lat
(47
m²)
Co
nst
ruct
ion
74
74
74
74
74
74
74
74
74
Lan
d 37
3
3
31
19
24
22
12
11
10
Tota
l 11
1 10
7 10
5
93
9
8
96
8
7 8
5
84
2 b
ed f
lat
(60
m²)
Co
nst
ruct
ion
95
9
5
95
9
5
95
9
5
95
9
5
95
Lan
d 4
8
42
40
25
3
0
29
16
14
13
Tota
l 14
2 13
7 13
4
119
12
5
123
11
0
108
10
7
3 b
ed h
ou
se
(77
m²)
Co
nst
ruct
ion
121
121
121
121
121
121
121
121
121
Lan
d 12
3
108
10
2 6
3
39
37
4
1 3
5
33
Tota
l 24
4
229
22
3
185
16
0
158
16
2 15
6
154
4 b
ed h
ou
se
(90
m²)
Co
nst
ruct
ion
142
142
142
142
142
142
142
142
142
Lan
d 14
3
126
11
9
74
46
4
3
48
4
1 3
9
Tota
l 28
5
268
26
1 21
6
187
185
19
0
183
18
0
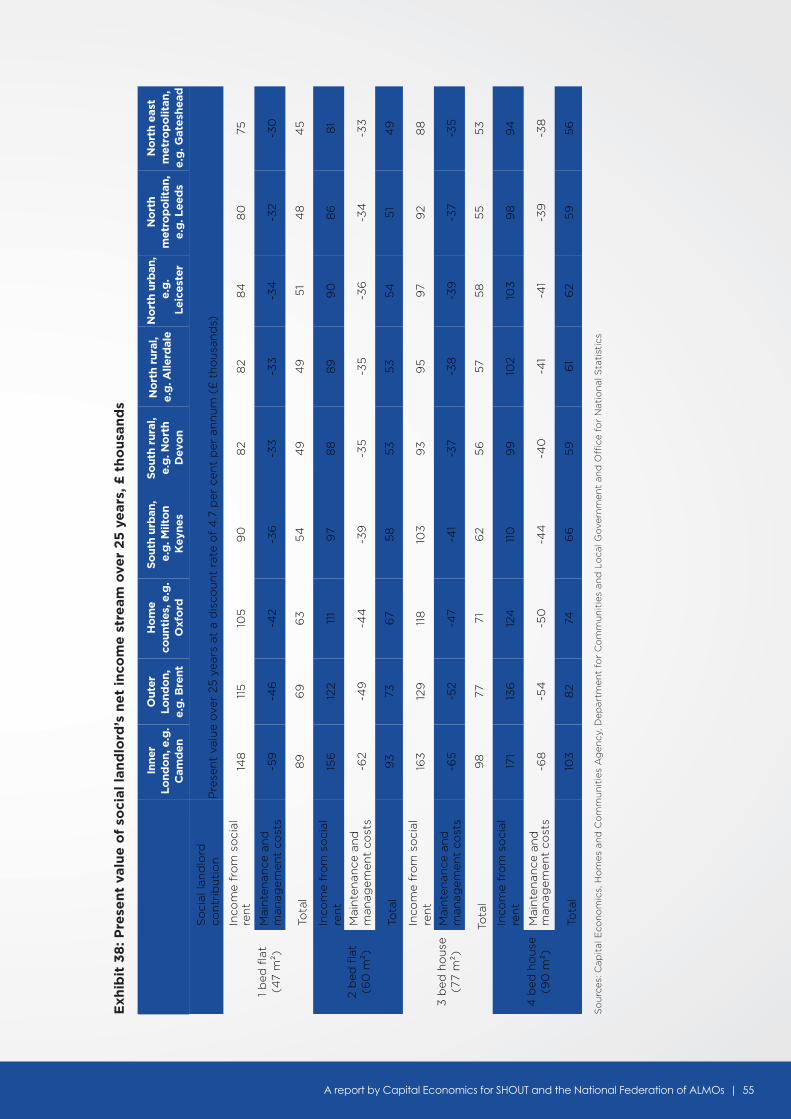
A report by Capital Economics for SHOUT and the National Federation of ALMOs | 55
Exh
ibit
38
: Pre
sen
t va
lue
of
soci
al l
and
lord
’s n
et
inco
me
str
eam
ove
r 2
5 y
ear
s, £
th
ou
san
ds
So
urc
es: C
apit
al E
con
om
ics,
Ho
mes
an
d C
om
mu
nit
ies
Ag
ency
, Dep
artm
ent
for
Co
mm
un
itie
s an
d L
oca
l Go
vern
men
t an
d O
ffice
fo
r N
atio
nal
Sta
tist
ics
Inne
r Lo
ndo
n, e
.g.
Cam
den
Out
er
Lond
on,
e.
g. B
rent
Ho
me
coun
ties
, e.g
. O
xfo
rd
So
uth
urb
an,
e.g
. Milt
on
Key
nes
So
uth
rura
l, e.
g. N
ort
h D
evo
n
No
rth
rura
l, e.
g. A
llerd
ale
No
rth
urb
an,
e.g
. Le
ices
ter
No
rth
met
rop
olit
an,
e.g
. Lee
ds
No
rth
eas
t m
etro
po
litan
, e.
g. G
ates
hea
d
So
cial
lan
dlo
rd
con
trib
uti
on
P
rese
nt
valu
e o
ver
25 y
ears
at
a d
isco
un
t ra
te o
f 4
.7 p
er c
ent
per
an
nu
m (
£ t
ho
usa
nd
s)
1 b
ed f
lat
(47
m²)
Inco
me
fro
m s
oci
al
ren
t 14
8
115
10
5
90
8
2 8
2 8
4
80
75
Mai
nte
nan
ce a
nd
m
anag
emen
t co
sts
-59
-4
6
-42
-36
-3
3
-33
-3
4
-32
-30
Tota
l 8
9
69
6
3
54
4
9
49
5
1 4
8
45
2 b
ed f
lat
(60
m²)
Inco
me
fro
m s
oci
al
ren
t 15
6
122
111
97
88
8
9
90
8
6
81
Mai
nte
nan
ce a
nd
m
anag
emen
t co
sts
-62
-49
-4
4
-39
-3
5
-35
-3
6
-34
-3
3
Tota
l 9
3
73
67
58
53
53
5
4
51
49
3 b
ed h
ou
se
(77
m²)
Inco
me
fro
m s
oci
al
ren
t 16
3
129
11
8
103
9
3
95
9
7 9
2 8
8
Mai
nte
nan
ce a
nd
m
anag
emen
t co
sts
-65
-5
2 -4
7 -4
1 -3
7 -3
8
-39
-3
7 -3
5
Tota
l 9
8
77
71
62
56
57
5
8
55
53
4 b
ed h
ou
se
(90
m²)
Inco
me
fro
m s
oci
al
ren
t 17
1 13
6
124
11
0
99
10
2 10
3
98
9
4
Mai
nte
nan
ce a
nd
m
anag
emen
t co
sts
-68
-5
4
-50
-4
4
-40
-4
1 -4
1 -3
9
-38
Tota
l 10
3
82
74
66
5
9
61
62
59
5
6
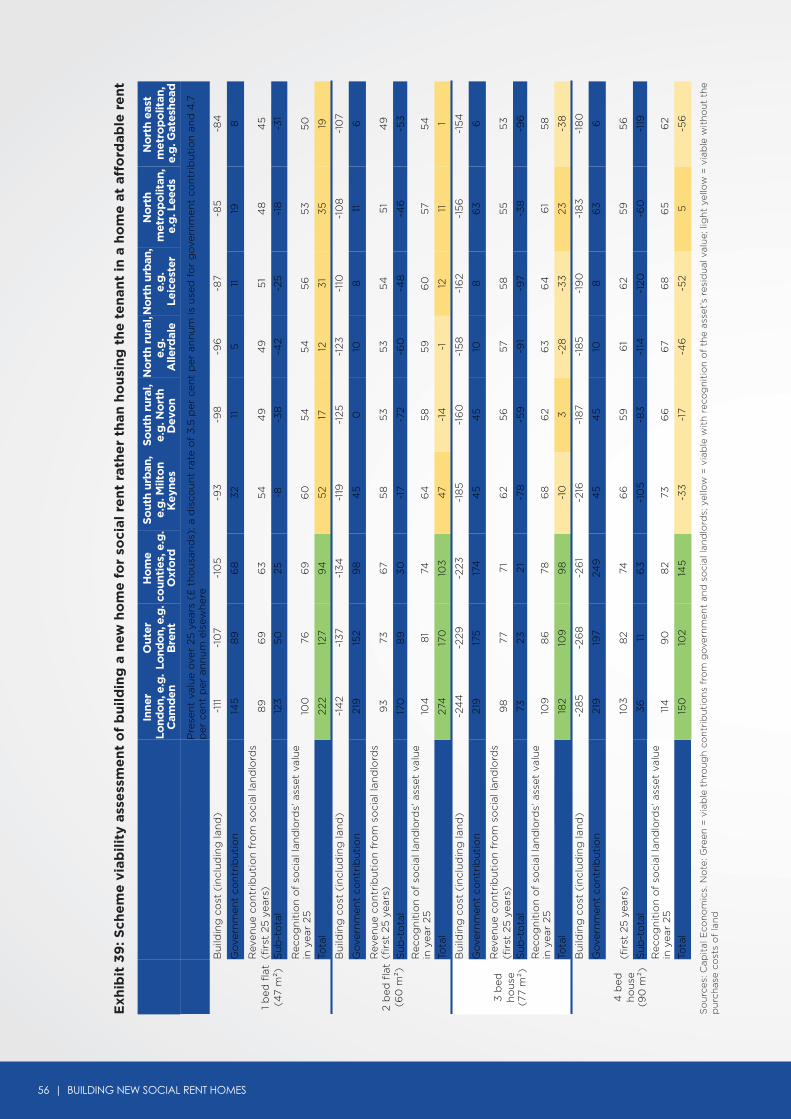
56 | BUILDING NEW SOCIAL RENT HOMES
Exh
ibit
39
: Sch
em
e v
iab
ilit
y as
sess
me
nt
of
bu
ild
ing
a n
ew h
om
e f
or
soci
al r
en
t ra
the
r th
an h
ou
sin
g t
he
te
nan
t in
a h
om
e a
t af
ford
able
re
nt
So
urc
es: C
apit
al E
con
om
ics.
No
te: G
reen
= v
iab
le t
hro
ug
h c
on
trib
uti
on
s fr
om
go
vern
men
t an
d s
oci
al la
nd
lord
s; y
ello
w =
via
ble
wit
h r
eco
gn
itio
n o
f th
e as
set’s
res
idu
al v
alu
e; li
gh
t ye
llow
= v
iab
le w
ith
ou
t th
e p
urc
has
e co
sts
of
lan
d
Inne
r Lo
ndo
n, e
.g.
Cam
den
Out
er
Lond
on,
e.g
. B
rent
Ho
me
coun
ties
, e.g
. O
xfo
rd
So
uth
urb
an,
e.g
. Milt
on
Key
nes
So
uth
rura
l, e.
g. N
ort
h D
evo
n
No
rth
rura
l, e.
g.
Alle
rdal
e
No
rth
urb
an,
e.g
. Le
ices
ter
No
rth
met
rop
olit
an,
e.g
. Lee
ds
No
rth
east
m
etro
po
litan
, e.
g. G
ates
head
Pre
sen
t va
lue
ove
r 25
yea
rs (
£ t
ho
usa
nd
s); a
dis
cou
nt
rate
of
3.5
per
cen
t p
er a
nn
um
is u
sed
fo
r g
ove
rnm
ent
con
trib
uti
on
an
d 4
.7
per
cen
t p
er a
nn
um
els
ewh
ere
1 b
ed f
lat
(47
m²)
Bu
ildin
g c
ost
(in
clu
din
g la
nd
) -1
11
-10
7 -1
05
-9
3
-98
-9
6
-87
-85
-8
4
145
8
9
68
3
2 11
5
11
19
8
Rev
enu
e co
ntr
ibu
tio
n f
rom
so
cial
lan
dlo
rds
(fir
st 2
5 y
ears
) 8
9
69
6
3
54
4
9
49
5
1 4
8
45
Su
b-t
ota
l 12
3
50
25
-8
-3
8
-42
-25
-1
8
-31
Rec
og
nit
ion
of
soci
al la
nd
lord
s’ a
sset
val
ue
in y
ear
25
100
76
6
9
60
5
4
54
5
6
53
5
0
Tota
l 22
2 12
7 9
4
52
17
12
31
35
19
2 b
ed f
lat
(60
m²)
Bu
ildin
g c
ost
(in
clu
din
g la
nd
) -1
42
-137
-1
34
-1
19
-125
-1
23
-110
-1
08
-1
07
Go
vern
men
t co
ntr
ibu
tio
n
Go
vern
men
t co
ntr
ibu
tio
n
219
15
2 9
8
45
0
10
8
11
6
Rev
enu
e co
ntr
ibu
tio
n f
rom
so
cial
lan
dlo
rds
(fir
st 2
5 y
ears
) 9
3
73
67
58
53
5
3
54
5
1 4
9
Su
b-t
ota
l 17
0
89
3
0
-17
-72
-60
-4
8
-46
-5
3
Rec
og
nit
ion
of
soci
al la
nd
lord
s’ a
sset
val
ue
in y
ear
25
104
8
1 74
6
4
58
5
9
60
57
5
4
Tota
l 27
4
170
10
3
47
-14
-1
12
11
1
3 b
ed
ho
use
(7
7 m
²)
Bu
ildin
g c
ost
(in
clu
din
g la
nd
) -2
44
-2
29
-223
-1
85
-1
60
-1
58
-1
62
-15
6
-15
4
Go
vern
men
t co
ntr
ibu
tio
n
219
17
5
174
4
5
45
10
8
6
3
6
Rev
enu
e co
ntr
ibu
tio
n f
rom
so
cial
lan
dlo
rds
(fir
st 2
5 y
ears
) 9
8
77
71
62
56
57
5
8
55
5
3
Su
b-t
ota
l 73
23
21
-7
8
-59
-9
1 -9
7 -3
8
-96
R
eco
gn
itio
n o
f so
cial
lan
dlo
rds’
ass
et v
alu
e in
yea
r 25
10
9
86
78
6
8
62
63
6
4
61
58
Tota
l 18
2 10
9
98
-1
0
3
-28
-3
3
23
-38
4 b
ed
ho
use
(9
0 m
²)
Bu
ildin
g c
ost
(in
clu
din
g la
nd
) -2
85
-2
68
-2
61
-216
-1
87
-18
5
-19
0
-18
3
-18
0
Go
vern
men
t co
ntr
ibu
tio
n
219
19
7 24
9
45
4
5
10
8
63
6
(fir
st 2
5 y
ears
) 10
3
82
74
66
59
6
1 6
2 5
9
56
Su
b-t
ota
l 3
6
11
63
-1
05
-8
3
-114
-1
20
-60
-1
19
Rec
og
nit
ion
of
soci
al la
nd
lord
s’ a
sset
val
ue
in y
ear
25
114
9
0
82
73
66
6
7 6
8
65
6
2
Tota
l 15
0
102
145
-3
3
-17
-46
-5
2 5
-5
6
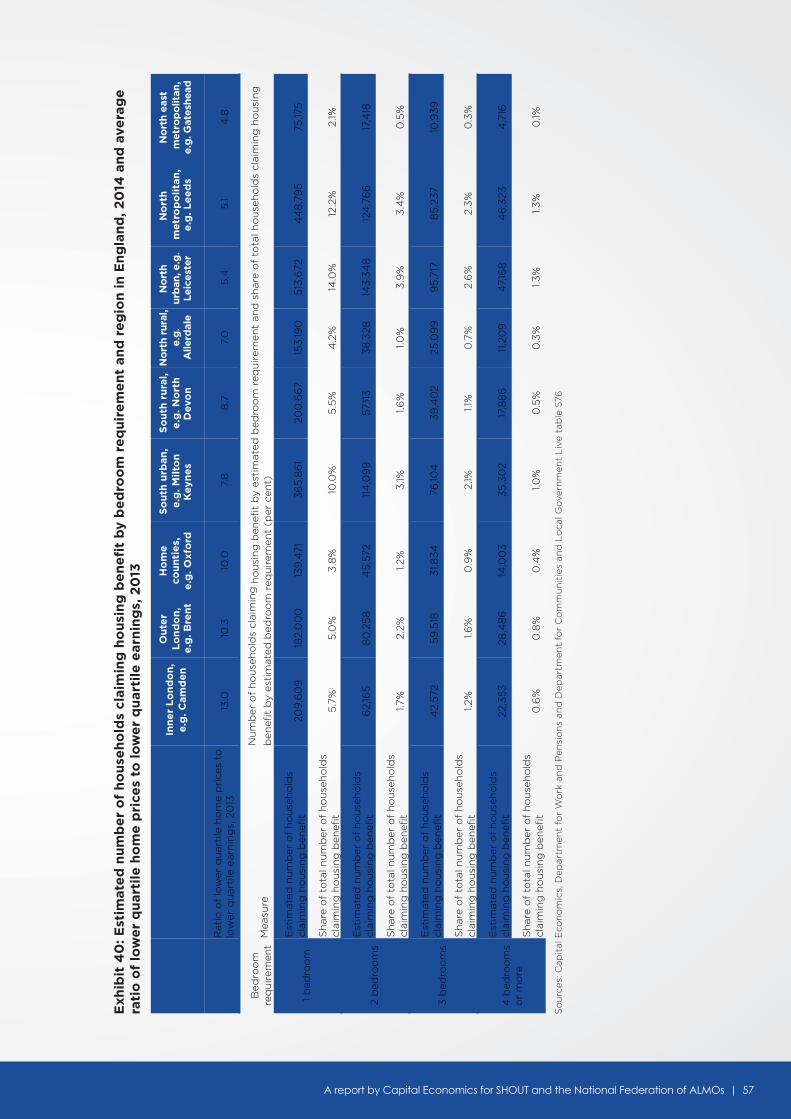
A report by Capital Economics for SHOUT and the National Federation of ALMOs | 57
Exh
ibit
40
: Est
imat
ed
nu
mb
er
of
ho
use
ho
lds
clai
min
g h
ou
sin
g b
en
efi
t b
y b
ed
roo
m r
eq
uir
em
en
t an
d r
eg
ion
in
En
gla
nd
, 20
14 a
nd
ave
rag
e
rati
o o
f lo
we
r q
uar
tile
ho
me
pri
ces
to l
ow
er
qu
arti
le e
arn
ing
s, 2
013
So
urc
es: C
apit
al E
con
om
ics,
Dep
artm
ent
for
Wo
rk a
nd
Pen
sio
ns
and
Dep
artm
ent
for
Co
mm
un
itie
s an
d L
oca
l Go
vern
men
t L
ive
tab
le 5
76
Inn
er
Lo
nd
on
, e
.g. C
amd
en
Ou
ter
Lo
nd
on
, e
.g. B
ren
t
Ho
me
cou
nti
es,
e.g
. Oxf
ord
So
uth
urb
an,
e.g
. Mil
ton
K
eyn
es
So
uth
ru
ral,
e.g
. No
rth
D
evo
n
No
rth
rura
l, e.
g.
Alle
rdal
e
No
rth
urb
an, e
.g.
Leic
este
r
No
rth
m
etr
op
oli
tan
, e
.g. L
ee
ds
No
rth
east
m
etro
po
litan
,e.
g. G
ates
head
Rat
io o
f lo
wer
qu
arti
le h
om
e p
rice
s to
low
er q
uar
tile
ear
nin
gs,
20
13
13.0
10
.3
10.0
7.
8
8.7
7.
0
5.4
5
.1 4
.8
Bed
roo
m
req
uir
emen
t M
easu
re
Nu
mb
er o
f h
ou
seh
old
s cl
aim
ing
ho
usi
ng
ben
efit
by
esti
mat
ed b
edro
om
req
uir
emen
t an
d s
har
e o
f to
tal h
ou
seh
old
s cl
aim
ing
ho
usi
ng
b
enef
it b
y es
tim
ated
bed
roo
m r
equ
irem
ent
(per
cen
t)
1 b
edro
om
Est
imat
ed n
um
ber
of
ho
use
ho
lds
clai
min
g h
ou
sin
g b
enef
it
209
,60
9
182,
00
0
139
,471
3
65
,86
1 20
0,6
67
153
,190
5
13,6
72
44
8,7
95
75
,175
Sh
are
of
t ota
l nu
mb
er o
f h
ou
seh
old
s cl
aim
ing
ho
usi
ng
ben
efit
5
.7%
5
.0%
3
.8%
10
.0%
5
.5%
4
.2%
14
.0%
12
.2%
2.
1%
2 b
edro
om
s
Est
imat
ed n
um
ber
of
ho
use
ho
lds
clai
min
g h
ou
sin
g b
enef
it
62,
165
8
0,2
58
4
5,5
72
114
,09
9
57,11
3
38
,328
14
3,3
48
12
4,7
66
17
,418
Sh
are
of
t ota
l nu
mb
er o
f h
ou
seh
old
s cl
aim
ing
ho
usi
ng
ben
efit
1.7
%
2.2%
1.2
%
3.1%
1.6
%
1.0%
3
.9%
3
.4%
0
.5%
3 b
edro
om
s
Est
imat
ed n
um
ber
of
ho
use
ho
lds
clai
min
g h
ou
sin
g b
enef
it
42,
572
59
,518
3
1,83
4
76,10
4
39
,40
2 25
,09
9
95
,717
8
5,2
37
10,9
39
Sh
are
of
tota
l nu
mb
er o
f h
ou
seh
old
s cl
aim
ing
ho
usi
ng
ben
efit
1.2
%
1.6%
0
.9%
2.
1%
1.1%
0
.7%
2.
6%
2.
3%
0
.3%
4 b
edro
om
so
r m
ore
Est
imat
ed n
um
ber
of
ho
use
ho
lds
clai
min
g h
ou
sin
g b
enef
it
22,3
53
28,4
86
14
,00
3
35
,30
2 17
,88
6
11,2
09
4
7,16
8
46
,323
4
,716
Sh
are
of
t ota
l nu
mb
er o
f h
ou
seh
old
s cl
aim
ing
ho
usi
ng
ben
efit
0
.6%
0
.8%
0
.4%
1.0
%
0.5
%
0.3
%
1.3%
1.3
%
0.1%
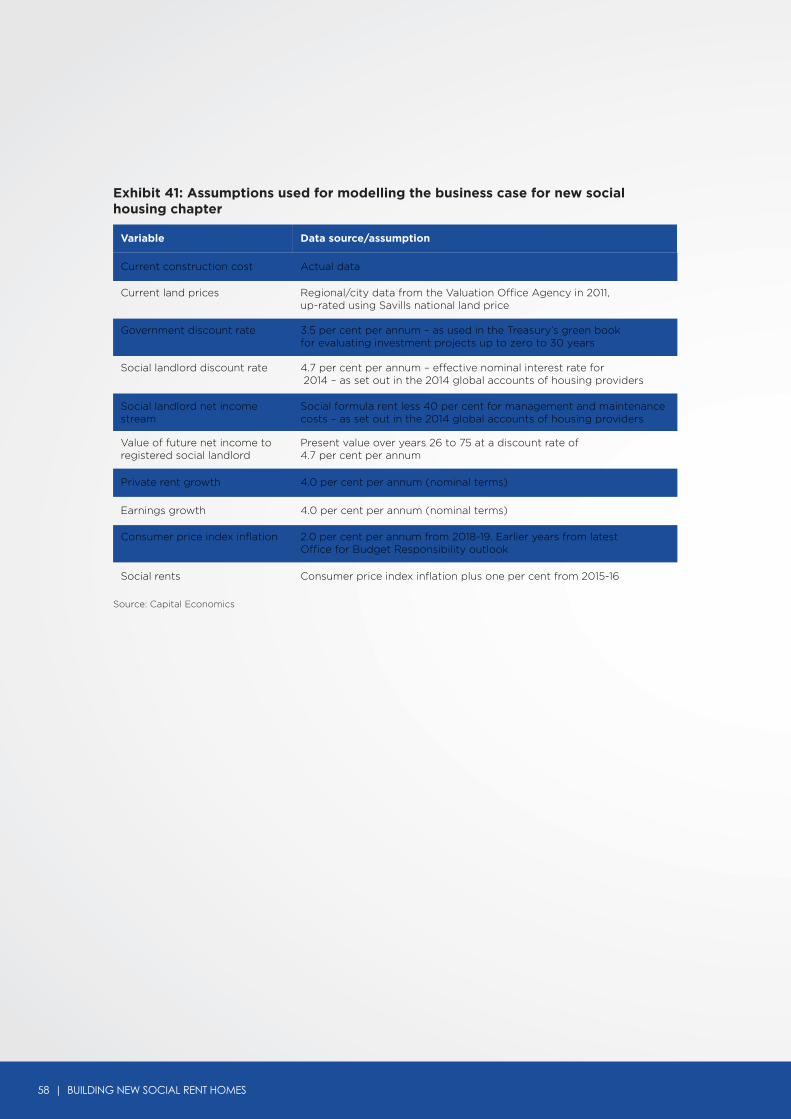
58 | BUILDING NEW SOCIAL RENT HOMES
Exhibit 41: Assumptions used for modelling the business case for new social housing chapter
Source: Capital Economics
Variable Data source/assumption
Current construction cost Actual data
Current land prices Regional/city data from the Valuation Office Agency in 2011,up-rated using Savills national land price
Government discount rate 3.5 per cent per annum – as used in the Treasury’s green book for evaluating investment projects up to zero to 30 years
Social landlord discount rate 4.7 per cent per annum – effective nominal interest rate for 2014 – as set out in the 2014 global accounts of housing providers
Social landlord net income stream
Social formula rent less 40 per cent for management and maintenance costs – as set out in the 2014 global accounts of housing providers
Value of future net income to registered social landlord
Present value over years 26 to 75 at a discount rate of 4.7 per cent per annum
Private rent growth 4.0 per cent per annum (nominal terms)
Earnings growth 4.0 per cent per annum (nominal terms)
Consumer price index inflation
2.0 per cent per annum from 2018-19. Earlier years from latestOffice for Budget Responsibility outlook
Social rents Consumer price index inflation plus one per cent from 2015-16
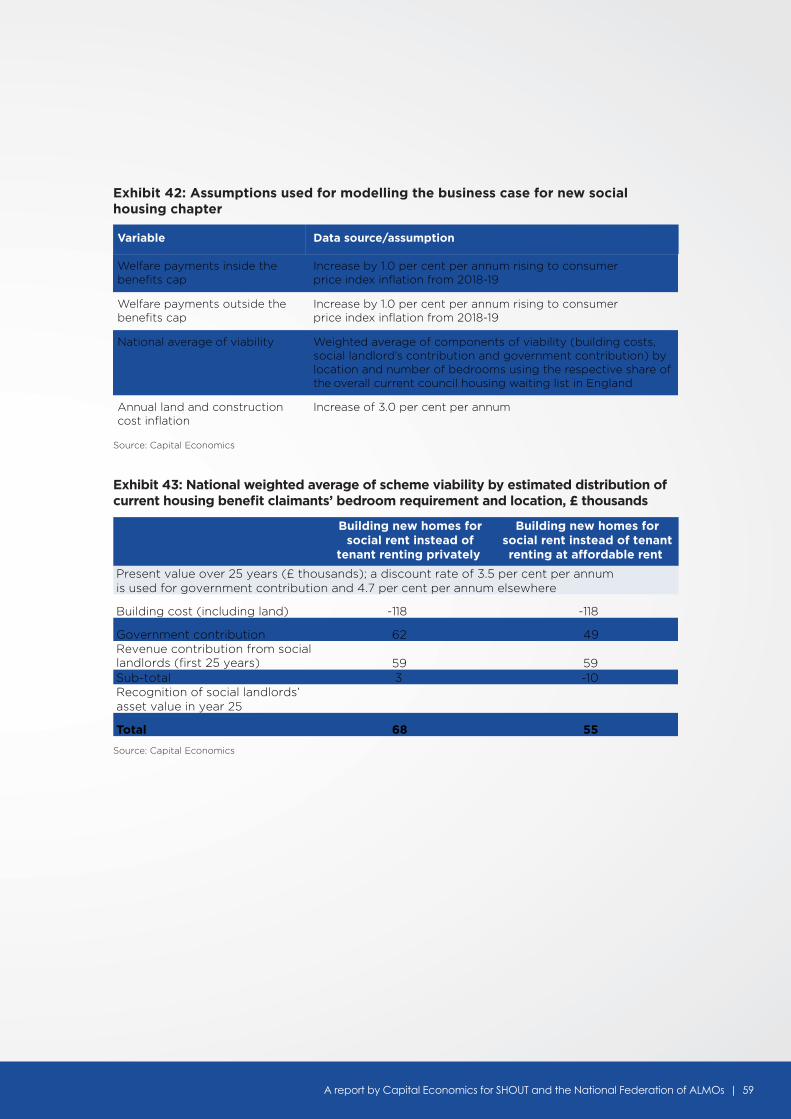
A report by Capital Economics for SHOUT and the National Federation of ALMOs | 59
Exhibit 42: Assumptions used for modelling the business case for new social housing chapter
Exhibit 43: National weighted average of scheme viability by estimated distribution of current housing benefit claimants’ bedroom requirement and location, £ thousands
Source: Capital Economics
Source: Capital Economics
Variable Data source/assumption
Welfare payments inside the benefits cap
Increase by 1.0 per cent per annum rising to consumerprice index inflation from 2018-19
Increase by 1.0 per cent per annum rising to consumerprice index inflation from 2018-19
Welfare payments outside the benefits cap
National average of viability Weighted average of components of viability (building costs, social landlord’s contribution and government contribution) by location and number of bedrooms using the respective share ofthe overall current council housing waiting list in England
Annual land and construction cost inflation
Increase of 3.0 per cent per annum
Building new homes forsocial rent instead of
tenant renting privately
Building new homes forsocial rent instead of tenantrenting at affordable rent
Present value over 25 years (£ thousands); a discount rate of 3.5 per cent per annumis used for government contribution and 4.7 per cent per annum elsewhere
Building cost (including land) -118 -118
Government contribution 62 49 Revenue contribution from social landlords (first 25 years) 59 59 Sub-total 3 -10 Recognition of social landlords’asset value in year 25
Total 68 55
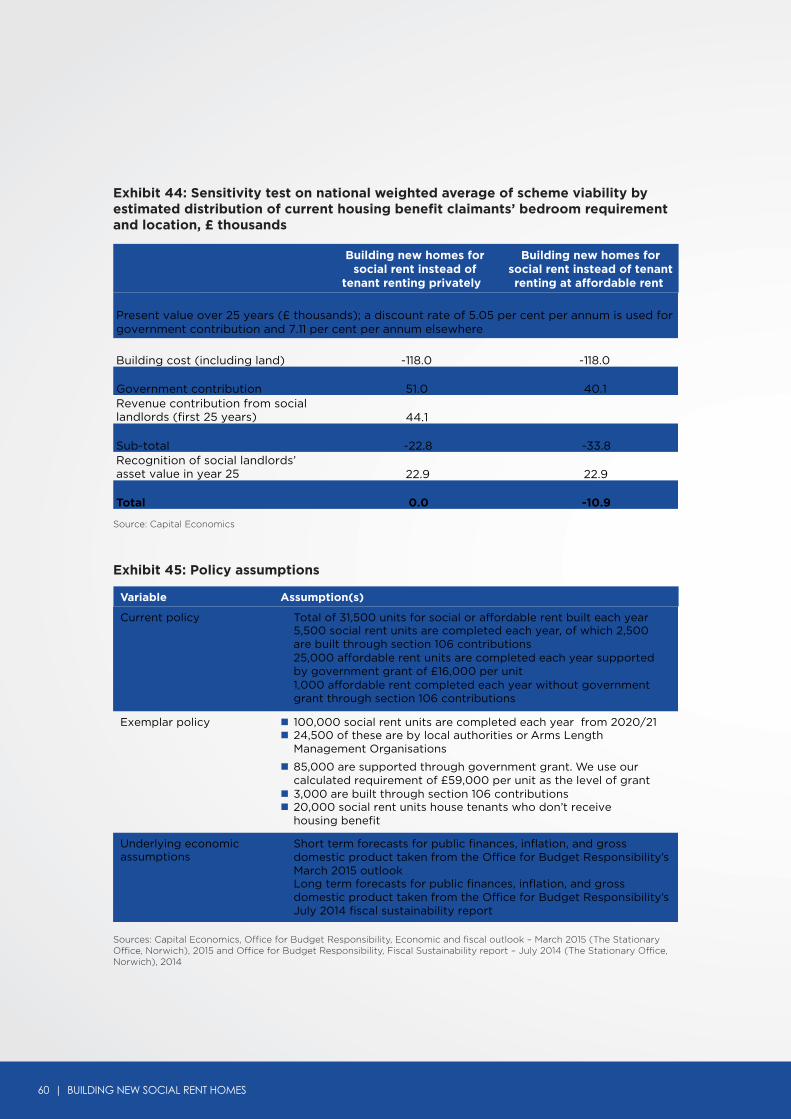
60 | BUILDING NEW SOCIAL RENT HOMES
Exhibit 44: Sensitivity test on national weighted average of scheme viability by estimated distribution of current housing benefit claimants’ bedroom requirement and location, £ thousands
Exhibit 45: Policy assumptions
Source: Capital Economics
Sources: Capital Economics, Office for Budget Responsibility, Economic and fiscal outlook – March 2015 (The Stationary Office, Norwich), 2015 and Office for Budget Responsibility, Fiscal Sustainability report – July 2014 (The Stationary Office, Norwich), 2014
Building new homes forsocial rent instead of
tenant renting privately
Building new homes forsocial rent instead of tenantrenting at affordable rent
Present value over 25 years (£ thousands); a discount rate of 5.05 per cent per annum is used forgovernment contribution and 7.11 per cent per annum elsewhere
Building cost (including land) -118.0 -118.0
Government contribution 51.0 40.1 Revenue contribution from social landlords (first 25 years) 44.1
Sub-total -22.8 -33.8 Recognition of social landlords’asset value in year 25 22.9 22.9
Total 0.0 -10.9
Variable Assumption(s)
Current policy Total of 31,500 units for social or affordable rent built each year 5,500 social rent units are completed each year, of which 2,500
are built through section 106 contributions 25,000 affordable rent units are completed each year supported
by government grant of £16,000 per unit 1,000 affordable rent completed each year without government
grant through section 106 contributions
Exemplar policy 100,000 social rent units are completed each year from 2020/21 24,500 of these are by local authorities or Arms Length
Management Organisations
85,000 are supported through government grant. We use ourcalculated requirement of £59,000 per unit as the level of grant
3,000 are built through section 106 contributions 20,000 social rent units house tenants who don’t receive
housing benefit
Underlying economic assumptions
Short term forecasts for public finances, inflation, and grossdomestic product taken from the Office for Budget Responsibility’s March 2015 outlook
Long term forecasts for public finances, inflation, and gross domestic product taken from the Office for Budget Responsibility’sJuly 2014 fiscal sustainability report

A report by Capital Economics for SHOUT and the National Federation of ALMOs | 61
A P P E N D I X : S E N S I T I V I T Y T E S T S
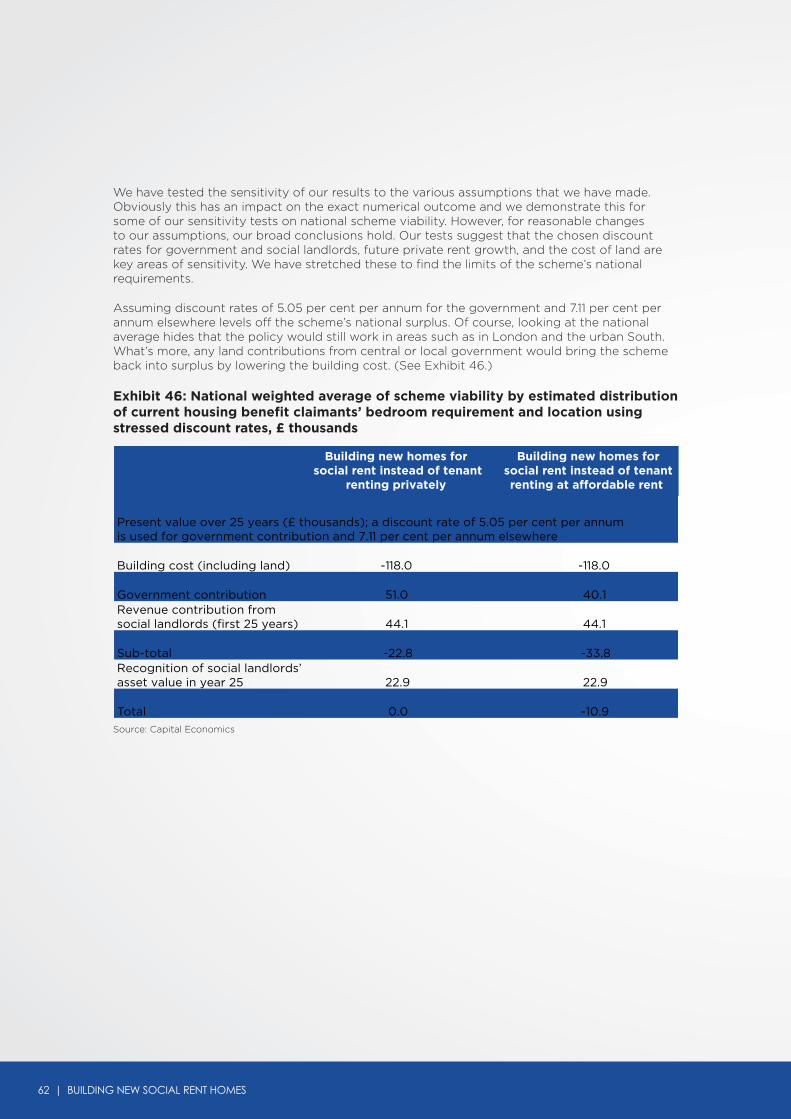
62 | BUILDING NEW SOCIAL RENT HOMES
We have tested the sensitivity of our results to the various assumptions that we have made.Obviously this has an impact on the exact numerical outcome and we demonstrate this for some of our sensitivity tests on national scheme viability. However, for reasonable changes to our assumptions, our broad conclusions hold. Our tests suggest that the chosen discount rates for government and social landlords, future private rent growth, and the cost of land are key areas of sensitivity. We have stretched these to find the limits of the scheme’s national requirements.
Assuming discount rates of 5.05 per cent per annum for the government and 7.11 per cent per annum elsewhere levels off the scheme’s national surplus. Of course, looking at the national average hides that the policy would still work in areas such as in London and the urban South. What’s more, any land contributions from central or local government would bring the scheme back into surplus by lowering the building cost. (See Exhibit 46.)
Exhibit 46: National weighted average of scheme viability by estimated distribution of current housing benefit claimants’ bedroom requirement and location using stressed discount rates, £ thousands
Source: Capital Economics
Building new homes for social rent instead of tenant
renting privately
Building new homes forsocial rent instead of tenantrenting at affordable rent
Present value over 25 years (£ thousands); a discount rate of 5.05 per cent per annumis used for government contribution and 7.11 per cent per annum elsewhere
Building cost (including land) -118.0 -118.0
Government contribution 51.0 40.1 Revenue contribution fromsocial landlords (first 25 years) 44.1 44.1
Sub-total -22.8 -33.8 Recognition of social landlords’asset value in year 25 22.9 22.9
Total 0.0 -10.9
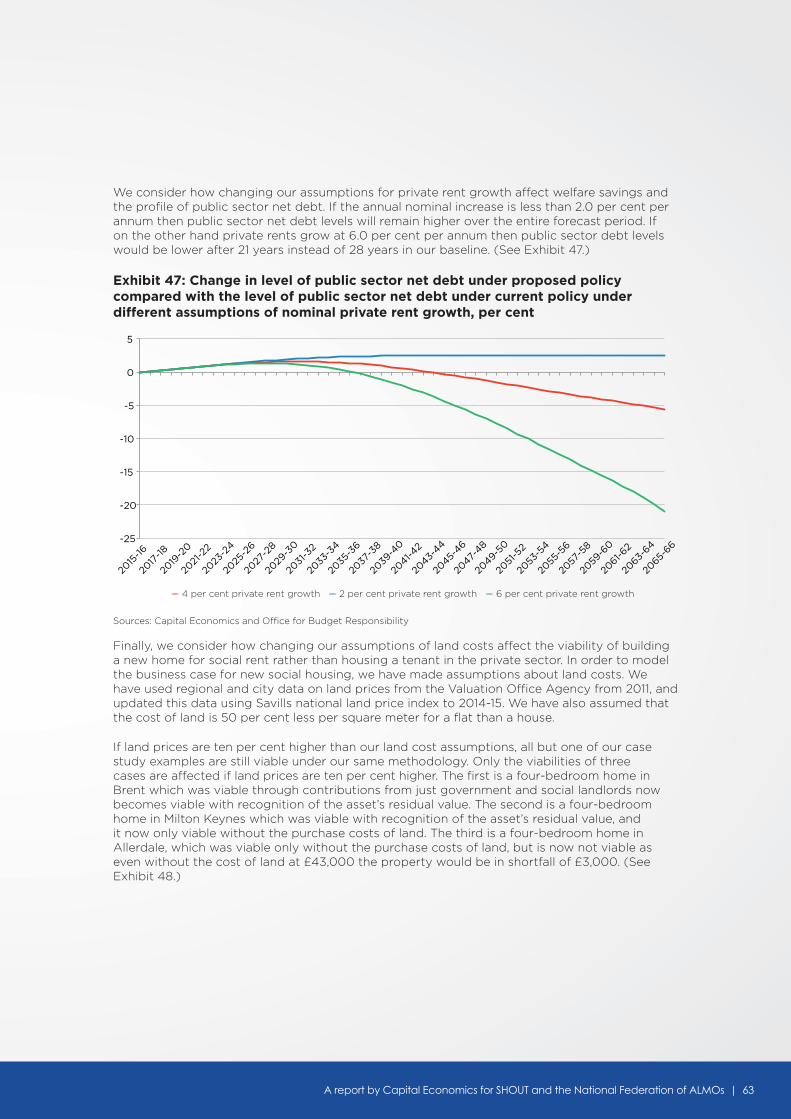
A report by Capital Economics for SHOUT and the National Federation of ALMOs | 63
We consider how changing our assumptions for private rent growth affect welfare savings and the profile of public sector net debt. If the annual nominal increase is less than 2.0 per cent per annum then public sector net debt levels will remain higher over the entire forecast period. If on the other hand private rents grow at 6.0 per cent per annum then public sector debt levels would be lower after 21 years instead of 28 years in our baseline. (See Exhibit 47.)
Exhibit 47: Change in level of public sector net debt under proposed policy compared with the level of public sector net debt under current policy under different assumptions of nominal private rent growth, per cent
Sources: Capital Economics and Office for Budget Responsibility
Finally, we consider how changing our assumptions of land costs affect the viability of building a new home for social rent rather than housing a tenant in the private sector. In order to model the business case for new social housing, we have made assumptions about land costs. We have used regional and city data on land prices from the Valuation Office Agency from 2011, and updated this data using Savills national land price index to 2014-15. We have also assumed that the cost of land is 50 per cent less per square meter for a flat than a house.
If land prices are ten per cent higher than our land cost assumptions, all but one of our case study examples are still viable under our same methodology. Only the viabilities of three cases are affected if land prices are ten per cent higher. The first is a four-bedroom home in Brent which was viable through contributions from just government and social landlords now becomes viable with recognition of the asset’s residual value. The second is a four-bedroom home in Milton Keynes which was viable with recognition of the asset’s residual value, and it now only viable without the purchase costs of land. The third is a four-bedroom home in Allerdale, which was viable only without the purchase costs of land, but is now not viable as even without the cost of land at £43,000 the property would be in shortfall of £3,000. (See Exhibit 48.)
-25
-20
-15
-10
-5
0
5
2015
-16
2017
-18
2019
-20
2021
-22
2023
-24
2025
-26
2027
-28
2029
-30
2031
-32
2033
-34
2035
-36
2037
-38
2039
-40
2041-4
2
2043-
44
2045-
46
2047-
48
2049-5
0
2051
-52
2053
-54
2055
-56
2057
-58
2059
-60
2061-6
2
2063-
64
2065-
66
–– 4 per cent private rent growth –– 2 per cent private rent growth –– 6 per cent private rent growth
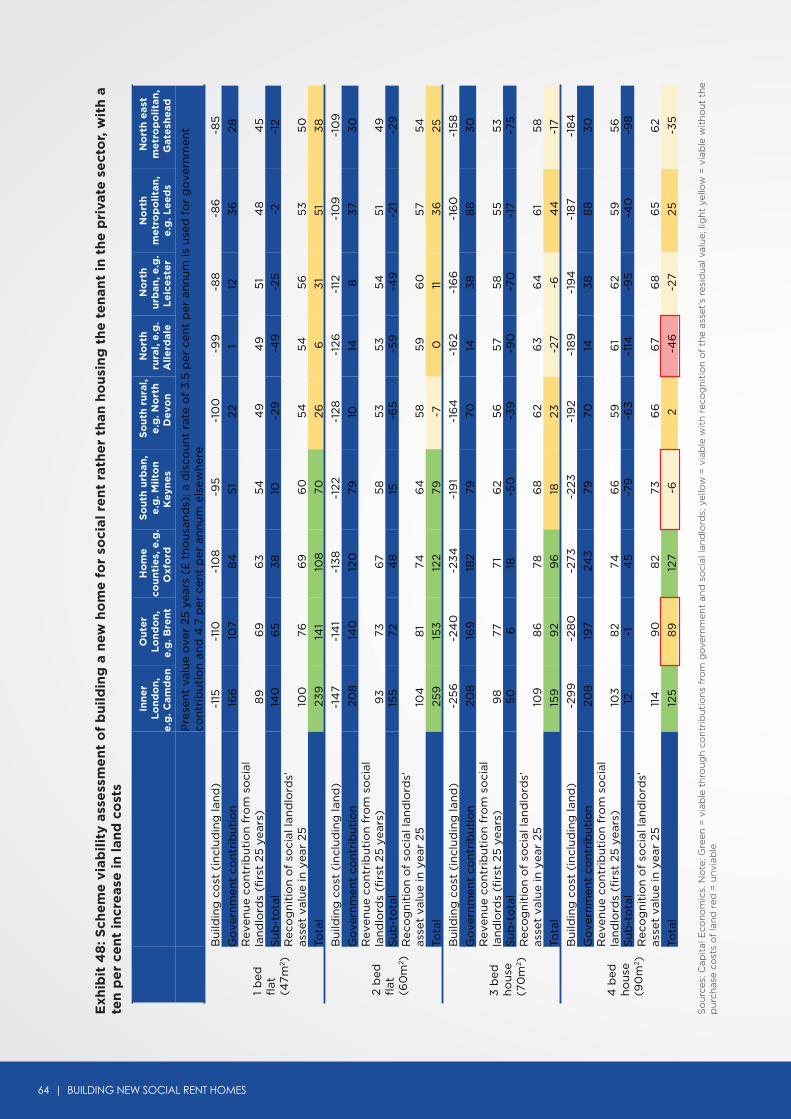
64 | BUILDING NEW SOCIAL RENT HOMES
Exh
ibit
48
: Sch
em
e v
iab
ilit
y as
sess
me
nt
of
bu
ild
ing
a n
ew h
om
e f
or
soci
al r
en
t ra
the
r th
an h
ou
sin
g t
he
te
nan
t in
th
e p
riva
te s
ect
or,
wit
h a
te
n p
er
cen
t in
cre
ase
in
lan
d c
ost
s
So
urc
es: C
apit
al E
con
om
ics.
No
te: G
reen
= v
iab
le t
hro
ug
h c
on
trib
uti
on
s fr
om
go
vern
men
t an
d s
oci
al la
nd
lord
s; y
ello
w =
via
ble
wit
h r
eco
gn
itio
n o
f th
e as
set’s
res
idu
al v
alu
e; li
gh
t ye
llow
= v
iab
le w
ith
ou
t th
e p
urc
has
e co
sts
of
lan
d r
ed =
unv
iab
le
Inn
er
Lo
nd
on
,e
.g. C
amd
en
Ou
ter
Lo
nd
on
,e
.g. B
ren
t
Ho
me
cou
nti
es,
e.g
.O
xfo
rd
So
uth
urb
an,
e.g
. Mil
ton
Ke
yne
s
So
uth
ru
ral,
e.g
. No
rth
De
von
No
rth
rura
l, e
.g.
All
erd
ale
No
rth
urb
an, e
.g.
Le
ice
ste
r
No
rth
me
tro
po
lita
n,
e.g
. Le
ed
s
No
rth
eas
tm
etr
op
oli
tan
,G
ate
she
ad
Pre
sen
t va
lue
ove
r 25
yea
rs (
£ t
ho
usa
nd
s); a
dis
cou
nt
rate
of
3.5
per
cen
t p
er a
nn
um
is u
sed
fo
r g
ove
rnm
ent
con
trib
uti
on
an
d 4
.7 p
er c
ent
per
an
nu
m e
lsew
her
e
1 b
edfl
at(4
7m2 )
Bu
ildin
g c
ost
(in
clu
din
g la
nd
) -1
15
-110
-1
08
-9
5
-10
0
-99
-8
8
-86
-8
5
Go
vern
men
t co
ntr
ibu
tio
n
166
10
7 8
4
51
22
1 12
3
6
28
Rev
enu
e co
ntr
ibu
tio
n f
rom
so
cial
la
nd
lord
s (f
irst
25
yea
rs)
8
9
69
6
3
54
4
9
49
5
1 4
8
45
S
ub
-to
tal
140
6
5
38
10
-2
9
-49
-2
5
-2
-12
Rec
og
nit
ion
of
soci
al la
nd
lord
s’
asse
t va
lue
in y
ear
25
100
76
6
9
60
5
4
54
5
6
53
5
0
Tota
l 23
9
141
108
70
26
6
3
1 5
1 3
8
2 b
edfl
at
(60
m2 )
Bu
ildin
g c
ost
(in
clu
din
g la
nd
) -1
47
-14
1 -1
38
-1
22
-128
-1
26
-112
-1
09
-1
09
Go
vern
men
t co
ntr
ibu
tio
n
208
14
0
120
79
10
14
8
3
7 3
0
Rev
enu
e co
ntr
ibu
tio
n f
rom
so
cial
la
nd
lord
s (f
irst
25
yea
rs)
93
73
6
7 5
8
53
5
3
54
5
1 4
9
Su
b-t
ota
l 15
5
72
48
15
-6
5
-59
-4
9
-21
-29
R
eco
gn
itio
n o
f so
cial
lan
dlo
rds’
as
set
valu
e in
yea
r 25
10
4
81
74
64
5
8
59
6
0
57
54
Tota
l 25
9
153
12
2 79
-7
0
11
3
6
25
3 b
edh
ou
se(7
0m
2 ) B
uild
ing
co
st (
incl
ud
ing
lan
d)
-25
6
-24
0
-23
4
-19
1 -1
64
-1
62
-16
6
-16
0
-15
8
Go
vern
men
t co
ntr
ibu
tio
n
208
16
9
182
79
70
14
38
8
8
30
R
even
ue
con
trib
uti
on
fro
m s
oci
al
lan
dlo
rds
(fir
st 2
5 y
ears
)
98
77
71
6
2 5
6
57
58
5
5
53
S
ub
-to
tal
50
6
18
-5
0
-39
-9
0
-70
-1
7 -7
5
Rec
og
nit
ion
of
soci
al la
nd
lord
s’
asse
t va
lue
in y
ear
25
109
8
6
78
68
6
2 6
3
64
6
1 5
8
Tota
l 15
9
92
96
18
23
-2
7 -6
4
4
-17
4 b
edh
ou
se(9
0m
2 )
Bu
ildin
g c
ost
(in
clu
din
g la
nd
) -2
99
-2
80
-2
73
-223
-1
92
-18
9
-19
4
-18
7 -1
84
Go
vern
men
t co
ntr
ibu
tio
n
208
19
7 24
3
79
70
14
38
8
8
30
R
even
ue
con
trib
uti
on
fro
m s
oci
al
lan
dlo
rds
(fir
st 2
5 y
ears
)
103
8
2 74
6
6
59
6
1 6
2 5
9
56
S
ub
-to
tal
12
-1
45
-7
9
-63
-1
14
-95
-4
0
-98
R
eco
gn
itio
n o
f so
cial
lan
dlo
rds’
as
set
valu
e in
yea
r 25
11
4
90
8
2 73
6
6
67
68
6
5
62
Tota
l 12
5
89
12
7 -6
2
-46
-2
7 25
-3
5

A report by Capital Economics for SHOUT and the National Federation of ALMOs | 65
N O T E S

66 | BUILDING NEW SOCIAL RENT HOMES
N O T E S

A report by Capital Economics for SHOUT and the National Federation of ALMOs | 67

Designed by
t: 01455 883880 @1creativebridge www.creative-bridge.com
EUROPE
Capital Economics Ltd150 Buckingham Palace RoadLondonSW1W 9TR
NORTH AMERICA
Capital Economics (N.A.) Ltd2 Bloor Street West, Suite 1740TorontoM4W 3E2
ASIA
Capital Economics (Asia) Pte. LtdIncome At Raffles#26-03, 16 Collyer QuaySingapore 049318
Recommended