Building a Web Analytics Framework
that works!
Pradeep Chopra CEO, Digital Vidya
Aloke Bajpai CEO, iXiGO

3 Fundamental Questions
• Why? (Objectives)
• What? (Metrics)
• How? (Tools, Techniques, Dashboards…)

Lets Learn from Real Examples!
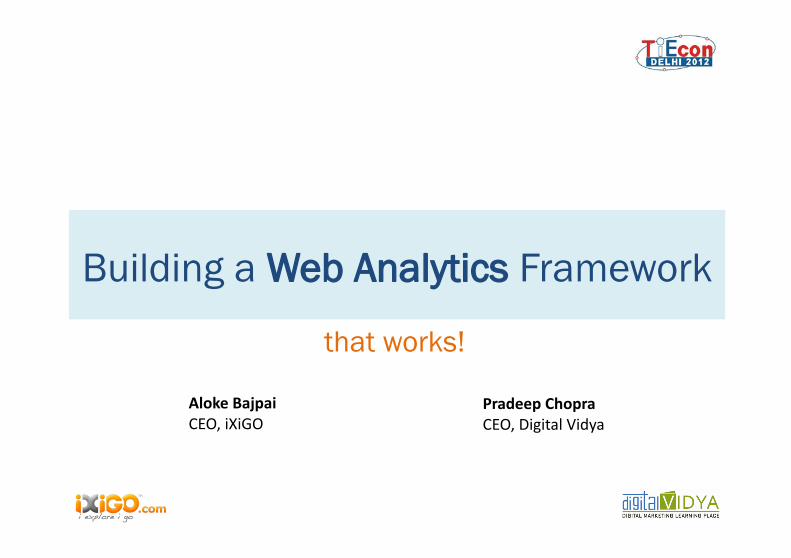
1. E-commerce Tracking
Source Visits Trials Transac9ons
SEO 33413 481 79
Direct 7041 193 82
Google Adwords 1664 204 8
Referral (SiteA) 732 28 6
Referral (SiteB) 384 11 4
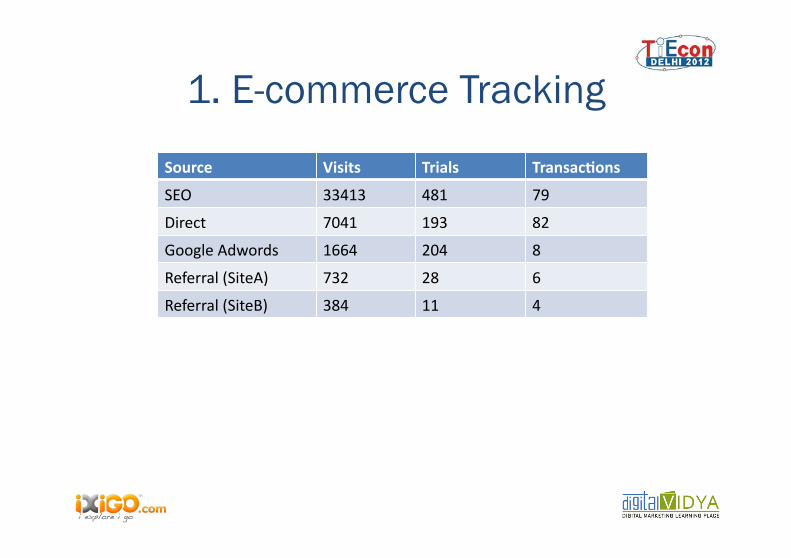
2. UTM Tracking Source Visits Sign-‐Ups (%) Bounce Rate
Source A 150 7 65
Source B 35 9 45
Source C 46 12 48
Source D 95 8 56
Source E 140 5 67
digitalvidya.com?utm_source=tb;utm_medium=email&utm_campaign=jun-‐12
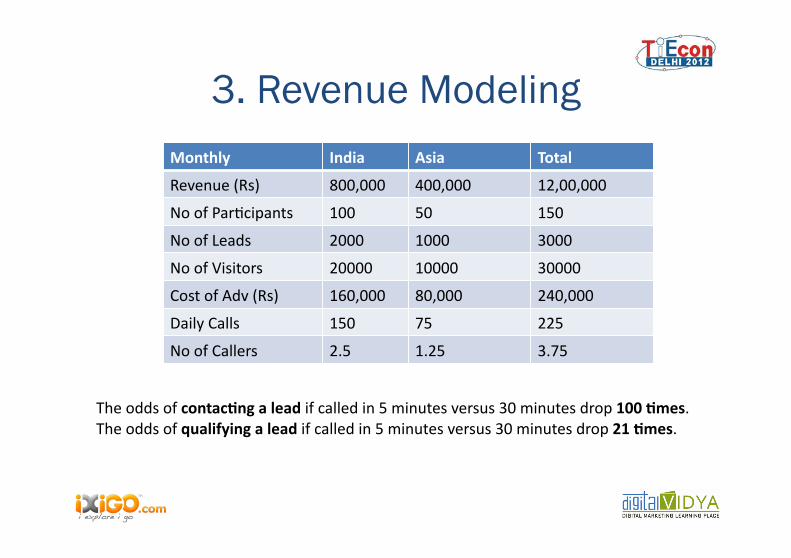
3. Revenue Modeling Monthly India Asia Total
Revenue (Rs) 800,000 400,000 12,00,000
No of ParUcipants 100 50 150
No of Leads 2000 1000 3000
No of Visitors 20000 10000 30000
Cost of Adv (Rs) 160,000 80,000 240,000
Daily Calls 150 75 225
No of Callers 2.5 1.25 3.75
The odds of contac9ng a lead if called in 5 minutes versus 30 minutes drop 100 9mes. The odds of qualifying a lead if called in 5 minutes versus 30 minutes drop 21 9mes.

4. Top 10 Metrics for CEOs 1. Daily Visits 2. Daily Unique Visitors 3. Unique Pageviews for important pages 4. Multi-Channel Conversion Funnel 5. Bounce Rate 6. Direct Visits (including brand keyword visits) 7. SEO Visits + Keywords Base 8. Referring Sites (Deep-Dive) 9. No. of server errors (404s / 500s) 10. Qualitative Feedback/Sentiment Report

5. Using Advanced Segments & Custom Reports
• Advanced Segments – Segment a section of visitors for deep-dives (e.g. only visitors
who viewed 3+ pages, only visitors who visited a particular page, only visitors who landed on a particular page
– Useful for understanding behaviour for various source/campaign segments
• Custom Reporting – Very useful for deep analysis of paid search, SEO, Browsers,
Device type data – Choose metrics (columns) – Choose dimensions (drilldowns) – Choose filters (for any metric)
• Most of the time you want to use both of above • Please mind the sampling gap !

Examples

6. Qualitative Analytics • Measuring Happiness • How do my users behave ? What do they spend
their time looking at ? Why do they do what they do ?
• User Interaction / Behaviour (Clicktale/UserFly) • Net Promoter Score • Surveys (on-site / off-site) • Social actions on the website (Likes/Shares) • Social Media Mentions / Sentiments

NPS Example
NPS = 46
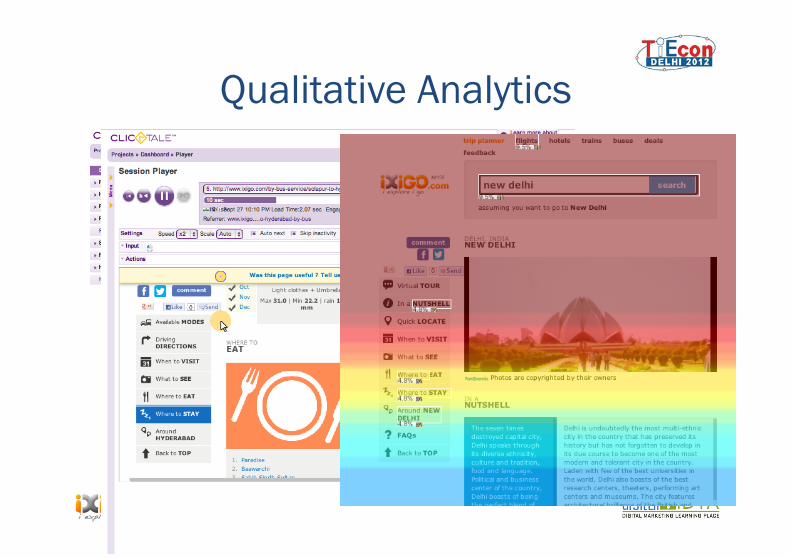
Qualitative Analytics

7. The HEART Framework • Happiness
– User attitude, qualitative metrics, perceptions • Engagement
– Behavioral signals, Depth of Interaction, Frequency, Clicks • Adoption
– % Users who adopt new product / feature, “Get” the product • Retention
– Returning users / Churn • Task-Action
– Efficiency, Error Rates, Time Taken, % who complete a specific goal – Specific metrics / signals critical for your product’s success
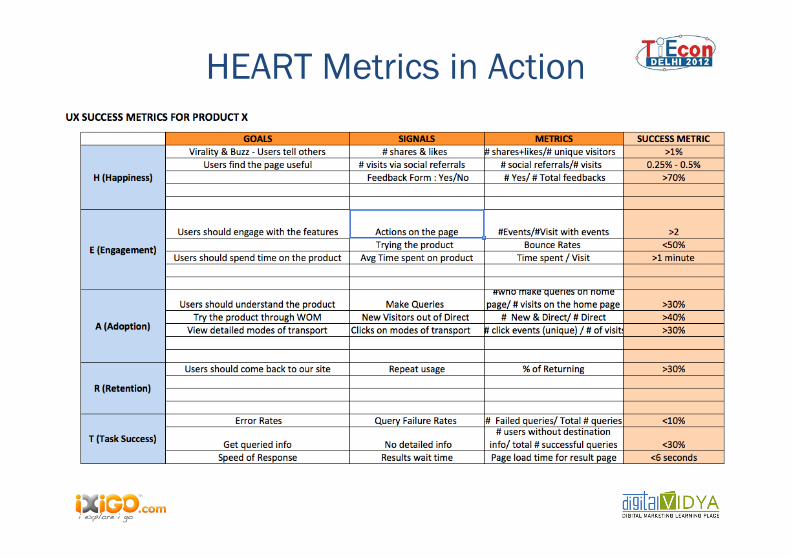
HEART Metrics in Action
Recommended