Building A Habit of
Attendance: Every Day
Counts Denver, July 1 , 2012
2
Unpacking Attendance Terms
3
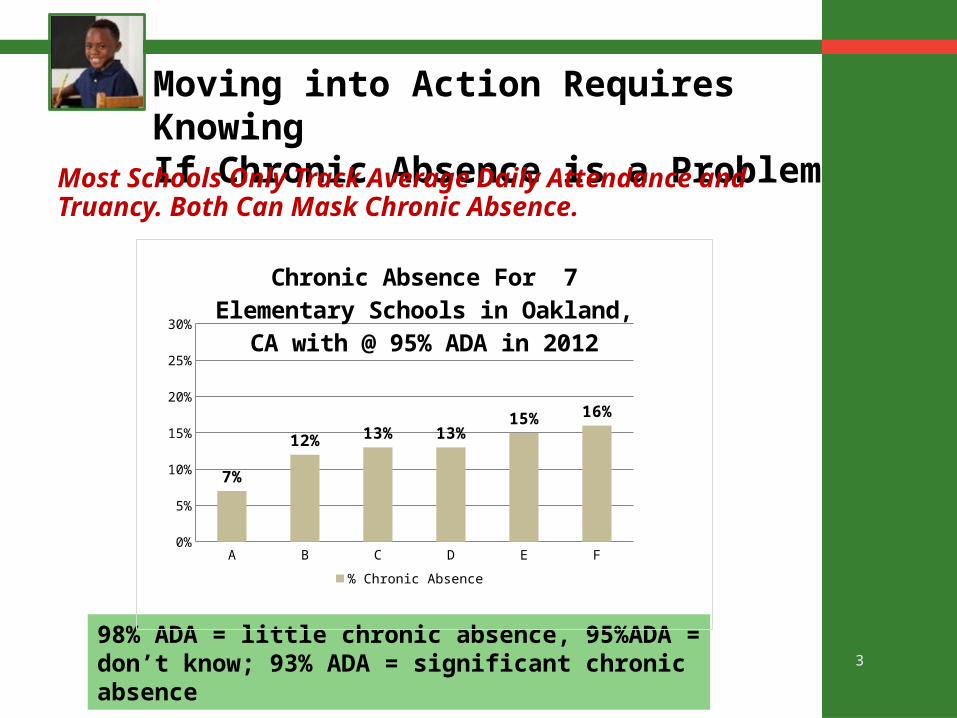
Moving into Action Requires KnowingIf Chronic Absence is a Problem
Most Schools Only Track Average Daily Attendance and Truancy. Both Can Mask Chronic Absence.
98% ADA = little chronic absence, 95%ADA = don’t know; 93% ADA = significant chronic absence
A B C D E F0%
5%
10%
15%
20%
25%
30%
7%
12% 13% 13%15% 16%
Chronic Absence For 7 Elementary Schools in Oakland, CA with @ 95% ADA in 2012
% Chronic Absence
4
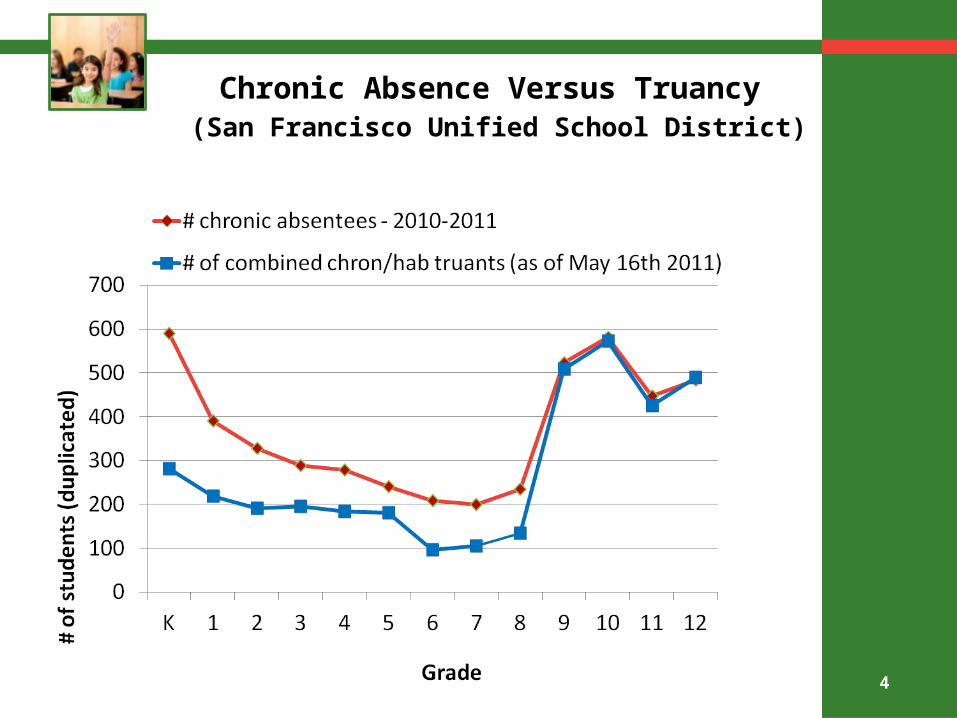
Chronic Absence Versus Truancy (San Francisco Unified School District)
5
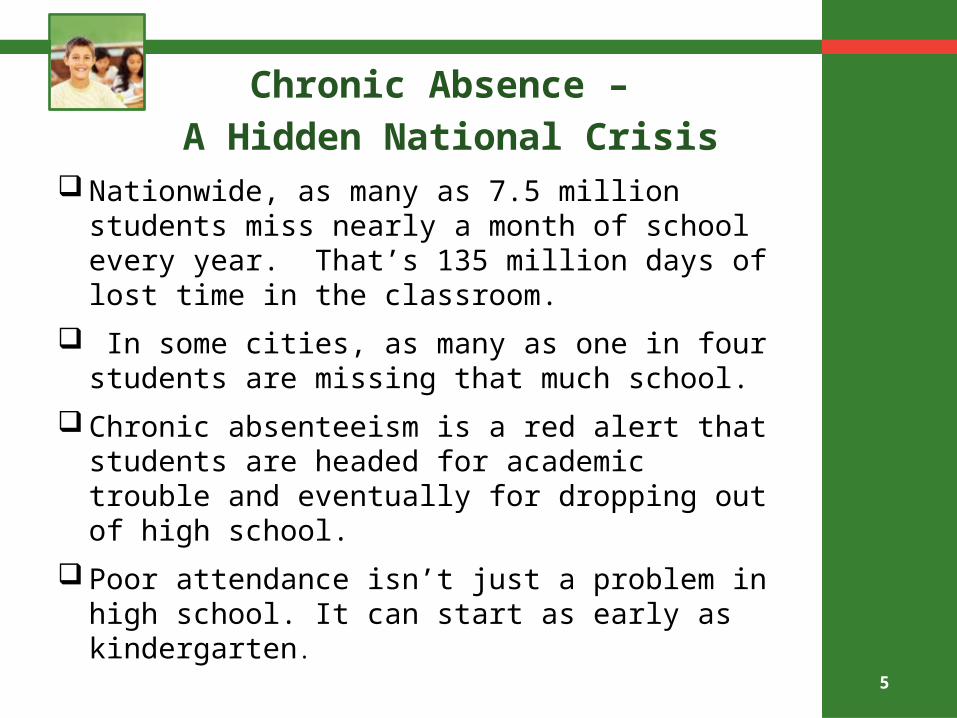
Nationwide, as many as 7.5 million students miss nearly a month of school every year. That’s 135 million days of lost time in the classroom.
In some cities, as many as one in four students are missing that much school.
Chronic absenteeism is a red alert that students are headed for academic trouble and eventually for dropping out of high school.
Poor attendance isn’t just a problem in high school. It can start as early as kindergarten.
Chronic Absence –
A Hidden National Crisis
6
No attendance risks Small attendance risks Moderate attendance risks
High attendance risks0%
20%
40%
60%
80%
100%
64%
43% 41%
17%
Chart Title
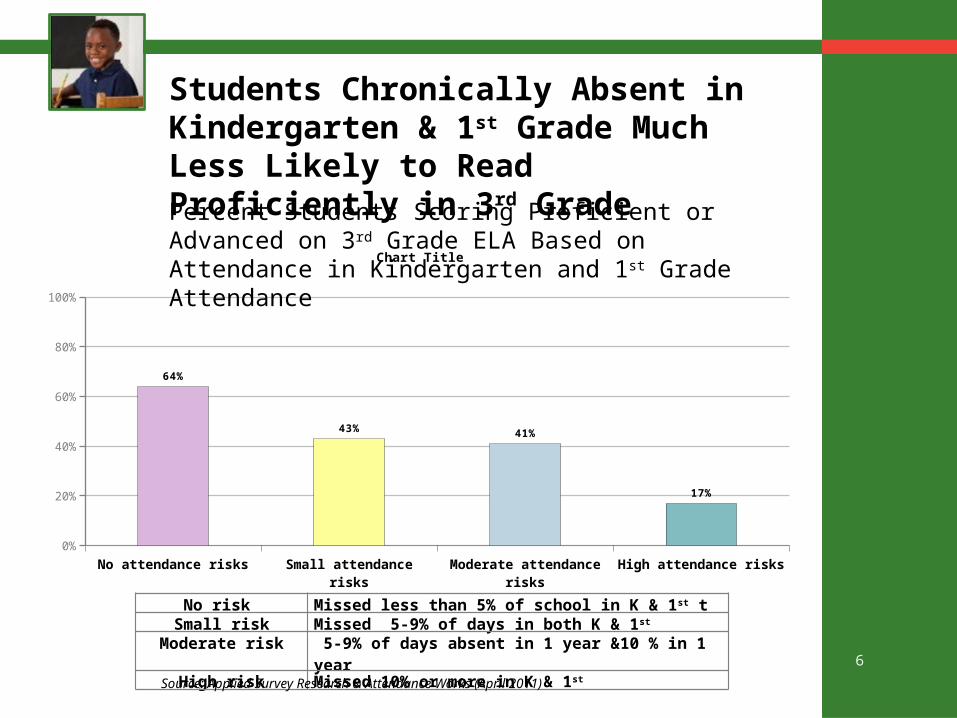
Students Chronically Absent in Kindergarten & 1st Grade Much Less Likely to Read Proficiently in 3rd Grade
No risk Missed less than 5% of school in K & 1st tSmall risk Missed 5-9% of days in both K & 1st
Moderate risk 5-9% of days absent in 1 year &10 % in 1 year
High risk Missed 10% or more in K & 1st Source: Applied Survey Research & Attendance Works (April 2011)
Percent Students Scoring Proficient or Advanced on 3rd Grade ELA Based on Attendance in Kindergarten and 1st Grade Attendance
7
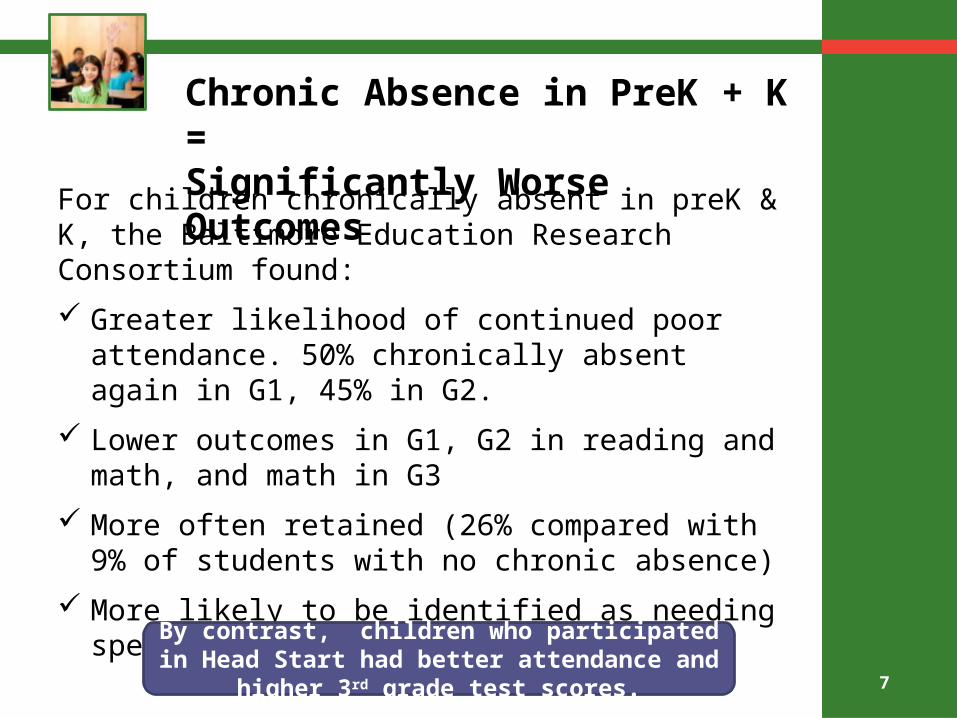
For children chronically absent in preK & K, the Baltimore Education Research Consortium found:
Greater likelihood of continued poor attendance. 50% chronically absent again in G1, 45% in G2.
Lower outcomes in G1, G2 in reading and math, and math in G3
More often retained (26% compared with 9% of students with no chronic absence)
More likely to be identified as needing special education
Chronic Absence in PreK + K = Significantly Worse Outcomes
By contrast, children who participated in Head Start had better attendance and higher 3rd grade test scores.
8
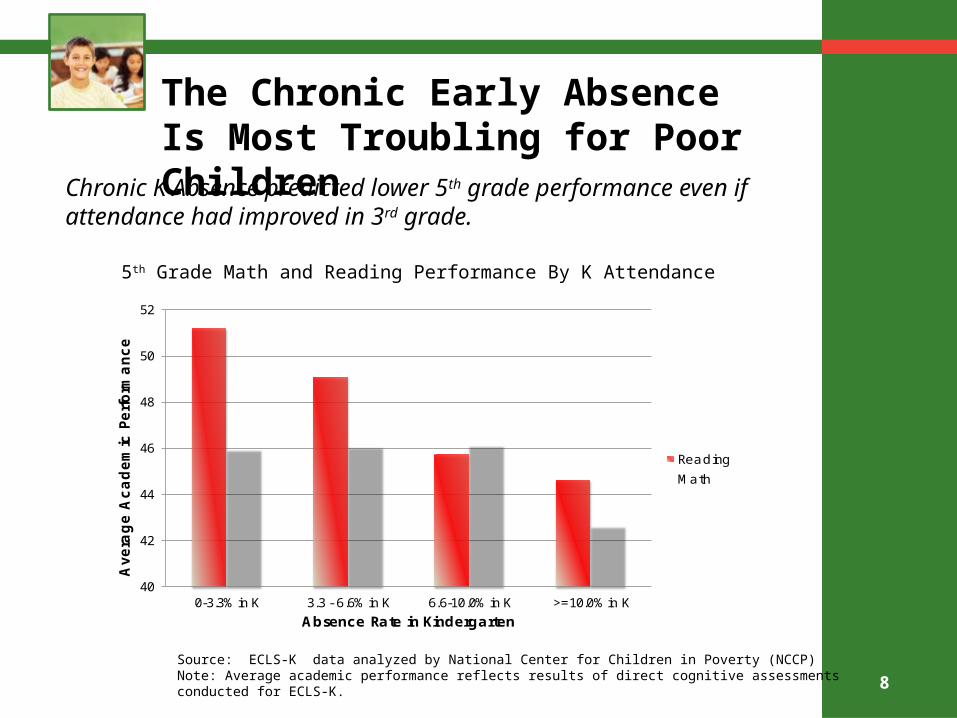
40
42
44
46
48
50
52
0-3.3% in K 3.3 - 6.6% in K 6.6-10.0% in K >=10.0% in K
Avera
ge A
cadem
ic P
erform
ance
Absence Rate in Kindergarten
Reading
Math
The Chronic Early Absence Is Most Troubling for Poor Children
Source: ECLS-K data analyzed by National Center for Children in Poverty (NCCP) Note: Average academic performance reflects results of direct cognitive assessments conducted for ECLS-K.
5th Grade Math and Reading Performance By K Attendance
Chronic K Absence predicted lower 5th grade performance even if attendance had improved in 3rd grade.
9
Chronic Absence is Especially Challenging for Low-Income Children
Poor children are 4 X more likely to be chronically absent in K than their highest income peers.
Children in poverty are more likely to face systemic barriers to school:
Unstable Housing Poor Transportation Inadequate Food and Clothing, Lack of Safe Paths to School Due to Neighborhood Violence Chaotic Schools with Poor Quality Programs, etc.
10
Schools + Communities CAN Make a Difference
Characteristics of Successful Attendance Initiatives Partner with community agencies to help parents carry
out their responsibility to get children to school. Make attendance a priority, set targets and monitor
progress over time. Examine factors contributing to chronic absence,
especially from parent and student perspectives. Clearly communicate expectations to parents. Begin early, ideally in Pre-K. Combine universal strategies that create an engaged
learning environment & build a culture of attendance with targeted interventions.
Offer positive supports before punitive action.
11 11
Solutions Only Work If Grounded in Understanding Of What Leads to Chronic
Absence
Special thanks to Dr. Robert Balfanz, Everyone Graduates Center, Johns Hopkins University, Baltimore, MD for providing this framework.

1212
Proposed Universal Strategies For Influencing Discretion and
Identifying Causes of Absence
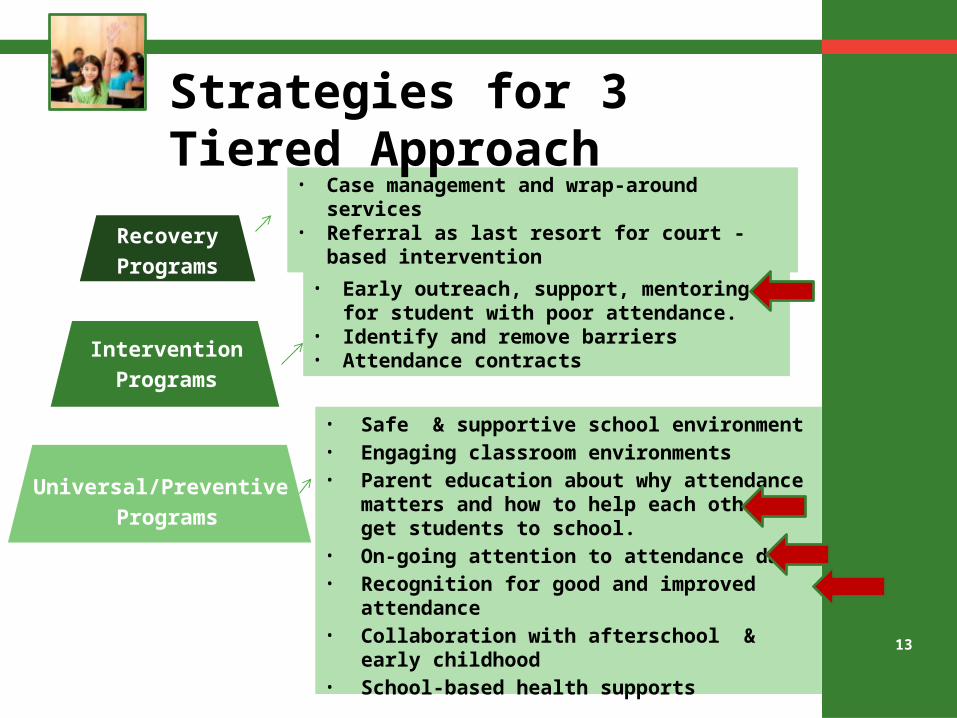
13
RecoveryPrograms
• Case management and wrap-around services• Referral as last resort for court -based
interventionRecoveryPrograms
Strategies for 3 Tiered Approach
• Early outreach, support, mentoring for student with poor attendance.
• Identify and remove barriers• Attendance contracts
• Safe & supportive school environment• Engaging classroom environments• Parent education about why attendance
matters and how to help each other get students to school.
• On-going attention to attendance data • Recognition for good and improved attendance • Collaboration with afterschool & early
childhood • School-based health supports
InterventionPrograms
Universal/Preventive Programs

14
For Making The Case: 10 Steps Communities Can Take To Reduce Chronic
Absence A Summary Of Key Research
For Taking Action Guidance on School Wide Attendance Incentives Parent Flyer (also available in Spanish) Attendance Data Team Tips K-5 SATT/DATT Does Attendance Really Count - Self-Assessment
(Note: Materials will also available by July 2nd on www.attendanceworks.org on the Campaign for Grade Level Reading page under tools and t.a.)
Resource Materials
15
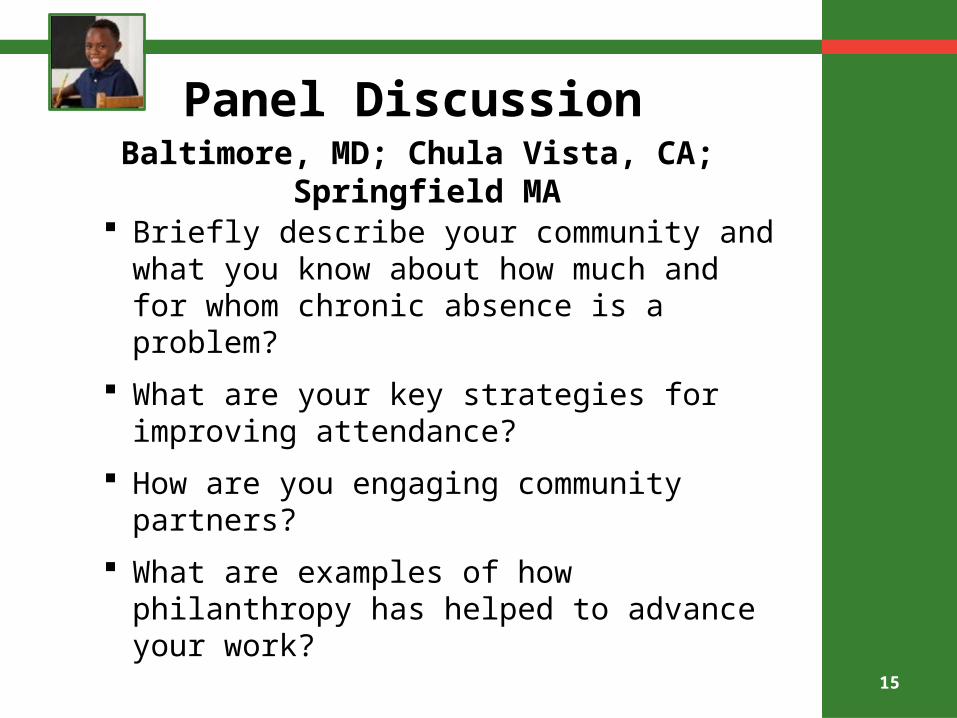
Panel Discussion Baltimore, MD; Chula Vista, CA; Springfield MA
Briefly describe your community and what you know about how much and for whom chronic absence is a problem?
What are your key strategies for improving attendance?
How are you engaging community partners?
What are examples of how philanthropy has helped to advance your work?

BALTIMORE CITY
PUBLIC SCHOOLS
Baltimore: Making Every Day Count
16
Presented by:
Arezo RahmaniBaltimore City Public Schools
Sue FothergillBaltimore Student Attendance
Campaign
With generous support from Open Society Institute: Baltimore and The Annie E. Casey Foundation Data provided by: Baltimore Education Research Consortium, a partnership between Baltimore City Public Schools, Morgan State University and Johns Hopkins University

BALTIMORE CITY
PUBLIC SCHOOLS
17
BALTIMORE CITY
PUBLIC SCHOOLS
18
2006-07 2007-08 2008-09 2009-10 2010-11 10.00%
12.00%
14.00%
16.00%
18.00%
20.00%
22.00%
24.00%
26.00%
28.00%
30.00%
22% 22%
20%
27%
27%
21% 19%
18%
23% 23%
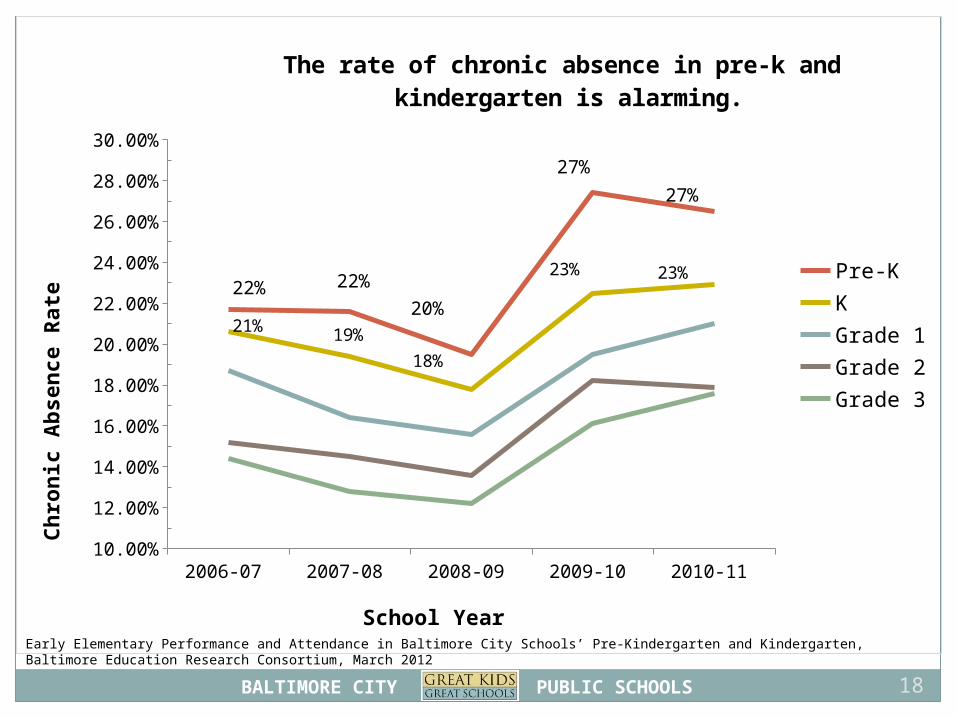
The rate of chronic absence in pre-k and kindergarten is alarming.
Pre-KK Grade 1Grade 2Grade 3
School Year
Ch
ron
ic A
bse
nce R
ate
Early Elementary Performance and Attendance in Baltimore City Schools’ Pre-Kindergarten and Kindergarten, Baltimore Education Research Consortium, March 2012
BALTIMORE CITY
PUBLIC SCHOOLS
19
Home Care Baltimore City Public Schools Pre-K
Baltimore City Head Start
0%
5%
10%
15%
20%
25%
30%
35%
29%
17%16%
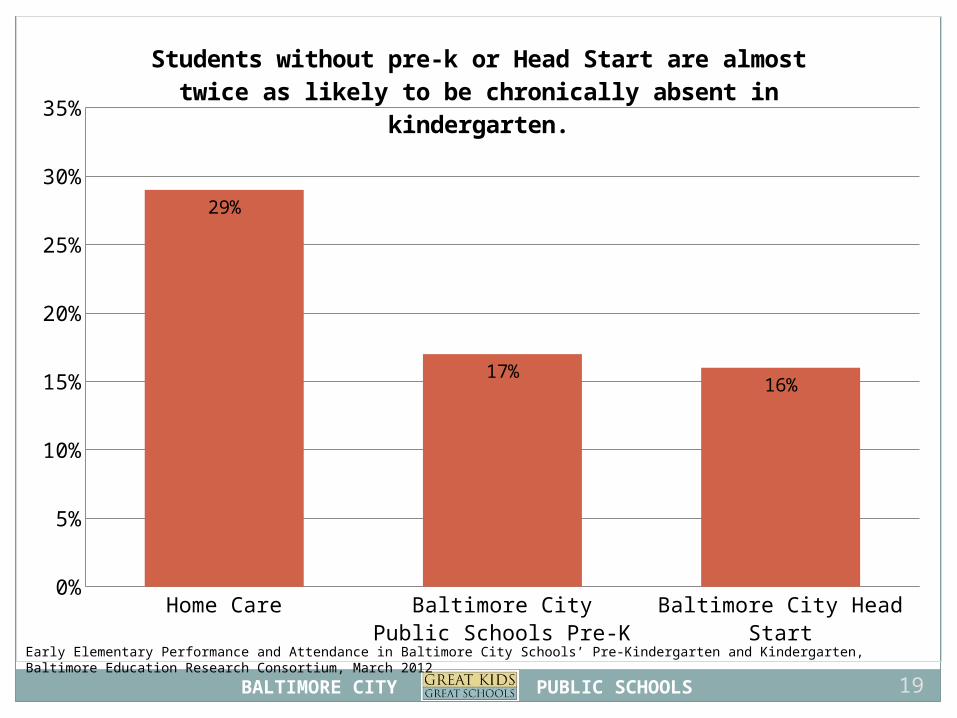
Students without pre-k or Head Start are almost twice as likely to be chronically absent in kindergarten.
Early Elementary Performance and Attendance in Baltimore City Schools’ Pre-Kindergarten and Kindergarten, Baltimore Education Research Consortium, March 2012
BALTIMORE CITY
PUBLIC SCHOOLS
20
Early Elementary Performance and Attendance in Baltimore City Schools’ Pre-Kindergarten and Kindergarten, Baltimore Education Research Consortium, March 2012
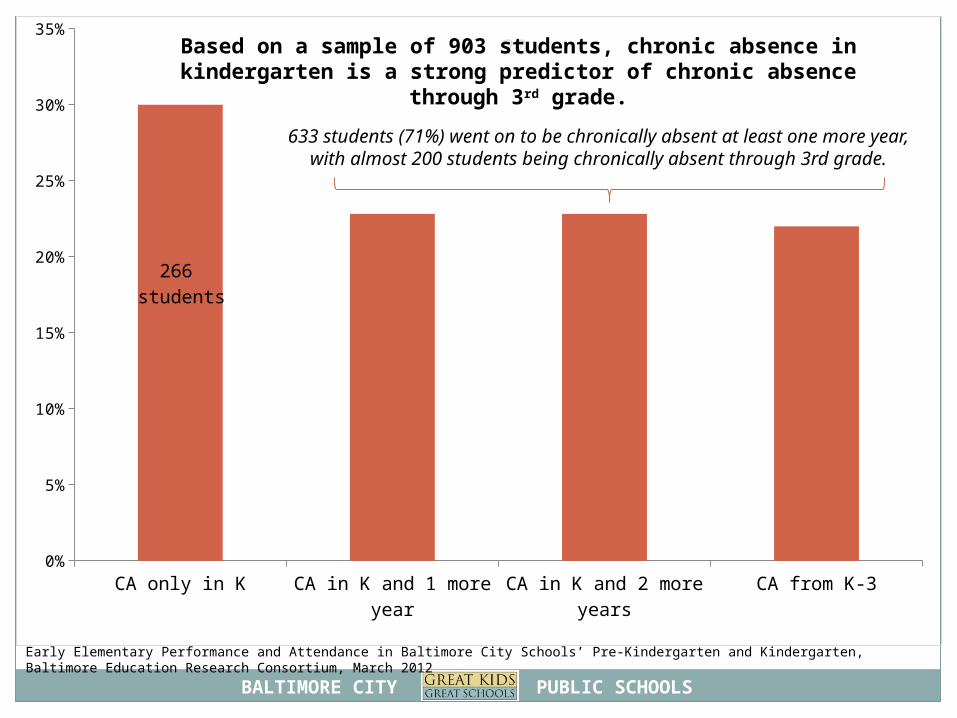
Based on a sample of 903 students, chronic absence in kindergarten is a strong predictor of chronic absence through 3rd grade.
637 students (71%) went on to be chronically absent at least one more year, with almost 200 students being
chronically absent through 3rd grade.
CA only in K CA in K and 1 more year
CA in K and 2 more years
CA from K-30%
5%
10%
15%
20%
25%
30%
35%
266 students
633 students (71%) went on to be chronically absent at least one more year, with almost 200 students being chronically absent
through 3rd grade.
BALTIMORE CITY
PUBLIC SCHOOLS
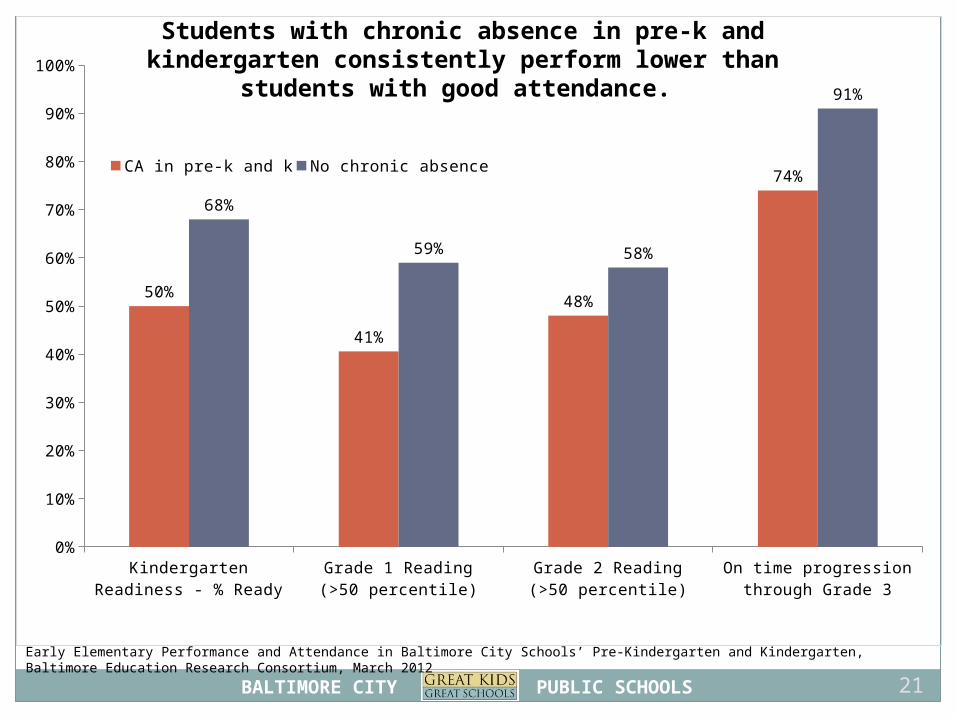
Kindergarten Readiness - % Ready
Grade 1 Reading(>50 percentile)
Grade 2 Reading(>50 percentile)
On time progression through Grade 3
0%
10%
20%
30%
40%
50%
60%
70%
80%
90%
100%
50%
41%
48%
74%
68%
59% 58%
91%
CA in pre-k and k No chronic absence
21
Students with chronic absence in pre-k and kindergarten consistently perform lower than students with good attendance.
Early Elementary Performance and Attendance in Baltimore City Schools’ Pre-Kindergarten and Kindergarten, Baltimore Education Research Consortium, March 2012
BALTIMORE CITY
PUBLIC SCHOOLS
What does this all mean for Baltimore City early learners?
• In elementary grades, students in pre-k have the highest chronic absence, with rates improving through 3rd grade
• Lack of formal care prior to kindergarten is an indicator for chronic absence in later years
• Chronic absence in pre-k and kindergarten means a student is twice as likely to be chronically absent in 1st grade
22
BALTIMORE CITY
PUBLIC SCHOOLS
So what’s Baltimore City doing?Focusing on data:
Monitoring and identifying struggling schools Identifying neighborhoods struggling with attendance
Raising awareness: Advocates and non-profits are elevating the issue of every day
attendance, starting in pre-k, through Baltimore Attendance Collaborative and The Baltimore Campaign for Grade Level Reading
Baltimore City Public Schools launched ‘every day counts…’ campaign
23
BALTIMORE CITY
PUBLIC SCHOOLS
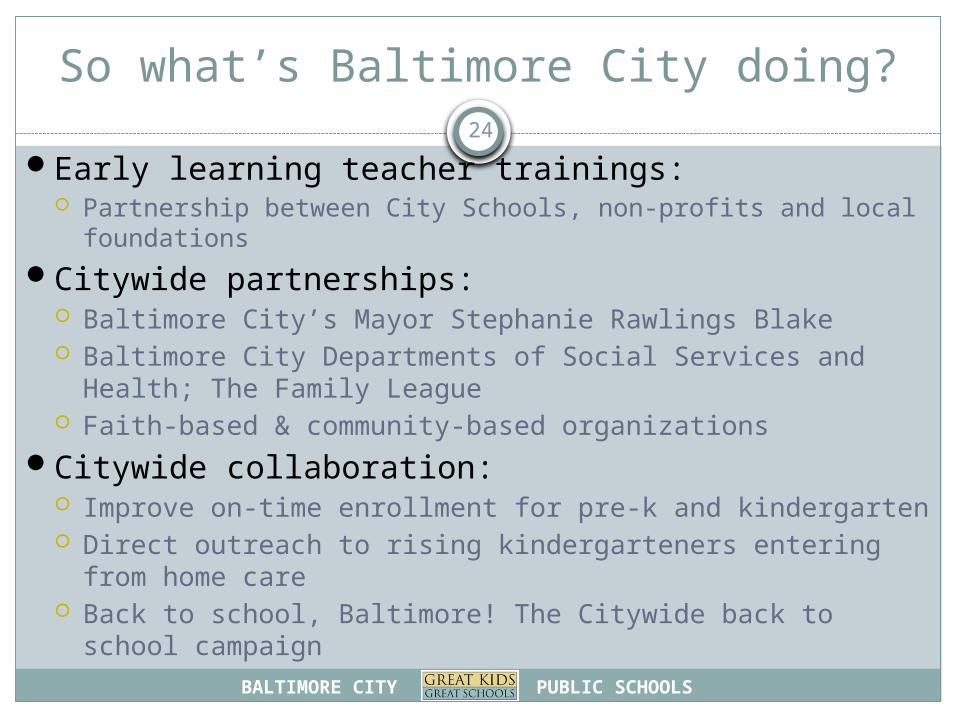
So what’s Baltimore City doing?
Early learning teacher trainings: Partnership between City Schools, non-profits and local
foundations
Citywide partnerships: Baltimore City’s Mayor Stephanie Rawlings Blake Baltimore City Departments of Social Services and Health;
The Family League Faith-based & community-based organizations
Citywide collaboration: Improve on-time enrollment for pre-k and kindergarten Direct outreach to rising kindergarteners entering from home
care Back to school, Baltimore! The Citywide back to school
campaign
24

Chula Vista Elementary School District
Denver, ColoradoJuly 1, 2012
Campaign for Grade Level Reading
Conference

Chula Vista Elementary School District
Characteristics
• 45 Elementary Schools: Site-Based Model
• 28,000 Students
• 9,800 English Learners
• 6 Charter Schools
• 24 Title I Schools
• 3.91% Administrative Cost
• 45% Free/Reduced Lunch Program
Chula Vista Elementary School District
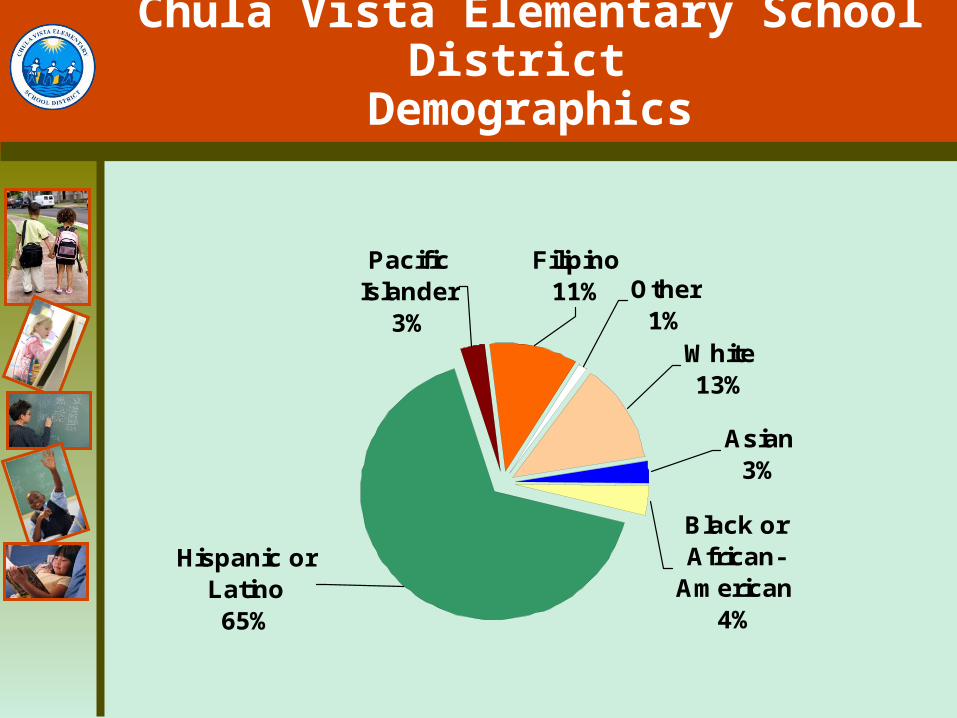
Demographics
White13%
Pacific Islander
3%
Filipino11% Other
1%
Black or African-
American4%
Asian3%
Hispanic or Latino65%
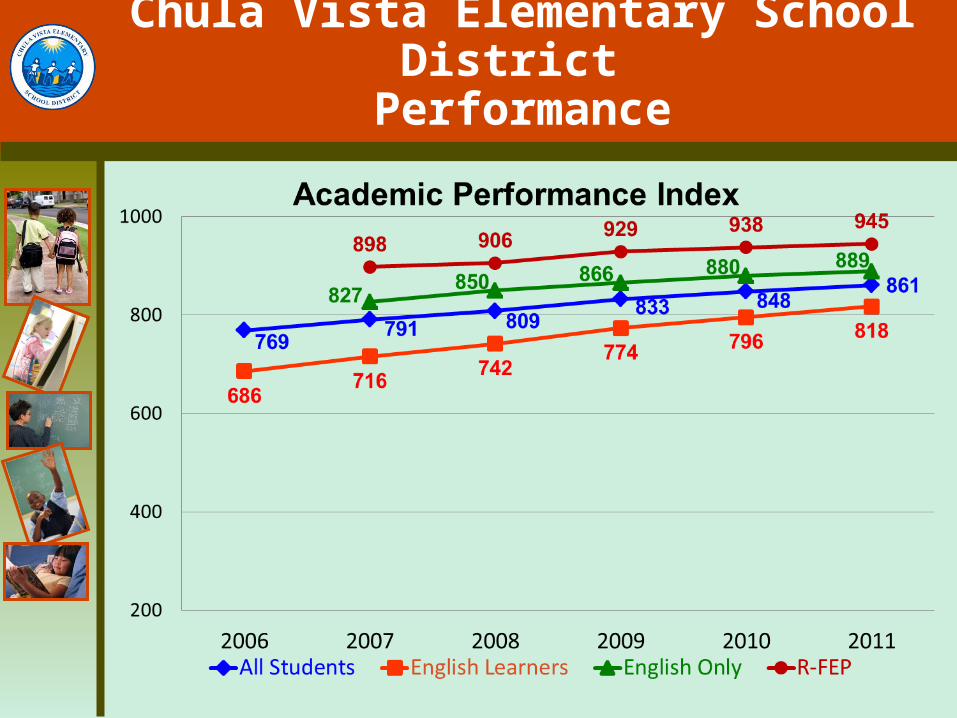
Chula Vista Elementary School District Performance
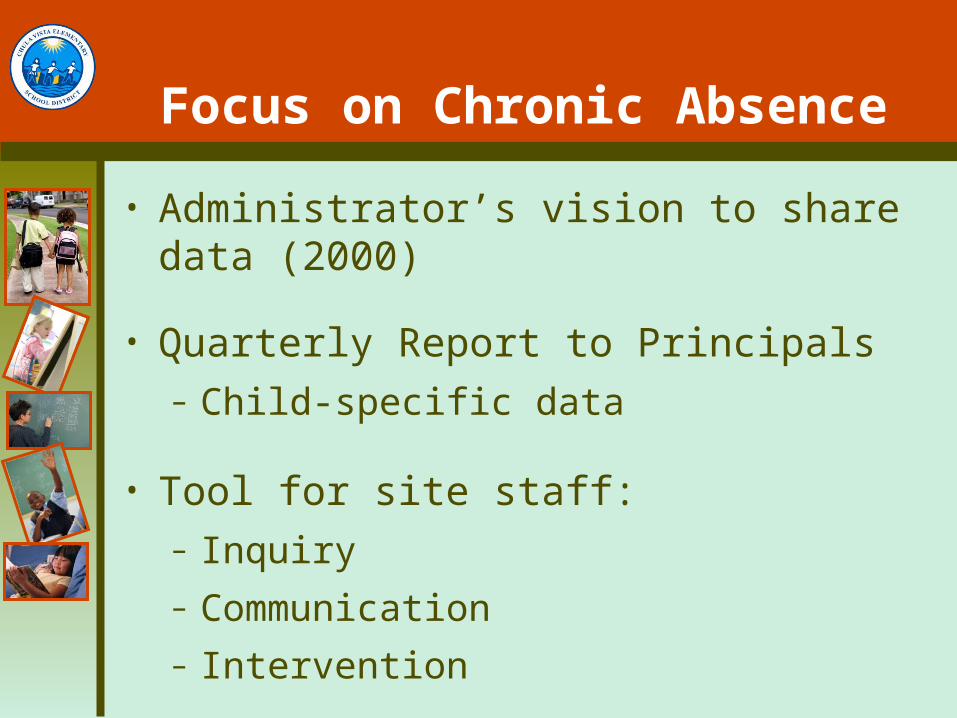
Focus on Chronic Absence
• Administrator’s vision to share data (2000)
• Quarterly Report to Principals– Child-specific data
• Tool for site staff:– Inquiry
– Communication
– Intervention
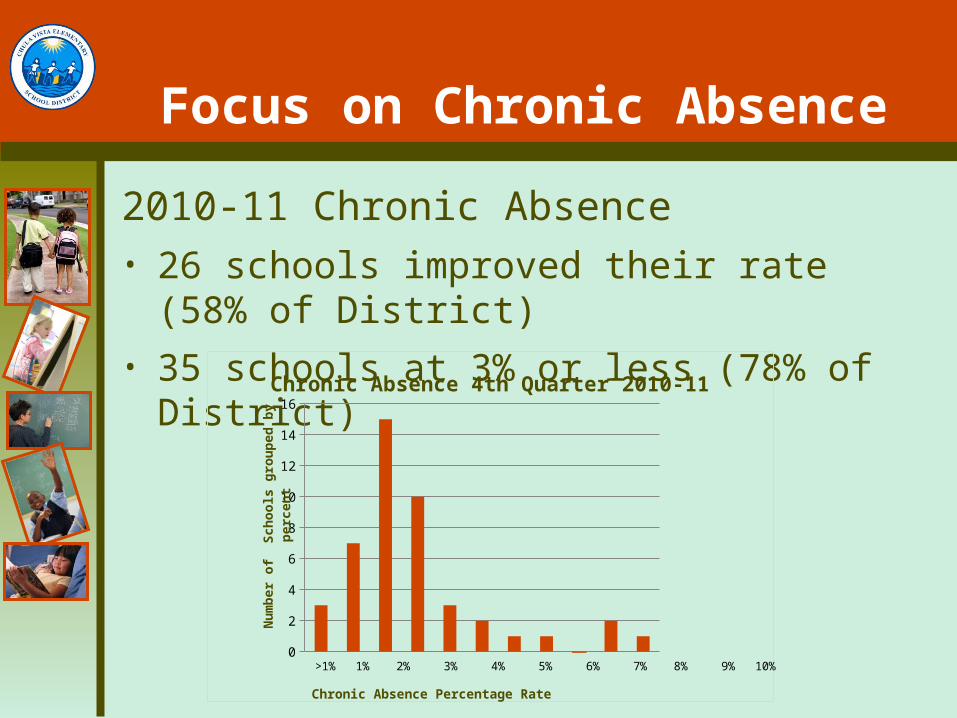
Focus on Chronic Absence
2010-11 Chronic Absence• 26 schools improved their rate (58% of District)
• 35 schools at 3% or less (78% of District)
0
2
4
6
8
10
12
14
16
Chronic Absence 4th Quarter 2010-11
Chronic Absence Percentage Rate
Num
ber
of
Schools
gro
uped b
y
perc
ent
>1% 1% 2% 3% 4% 5% 6% 7% 8% 9% 10%
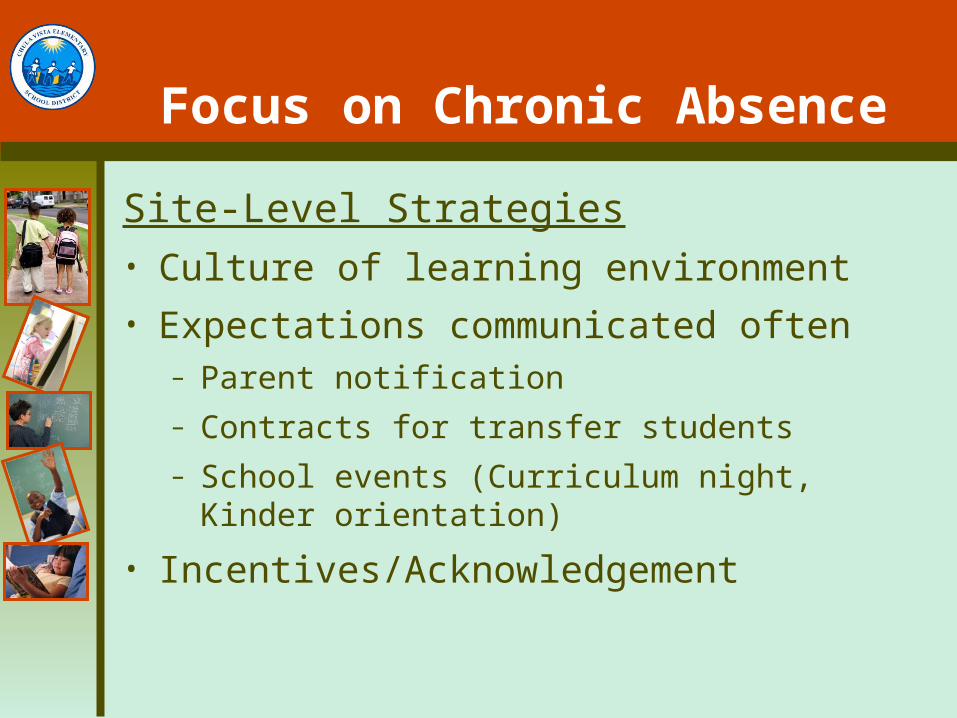
Focus on Chronic Absence
Site-Level Strategies• Culture of learning environment
• Expectations communicated often– Parent notification
– Contracts for transfer students
– School events (Curriculum night, Kinder orientation)
• Incentives/Acknowledgement
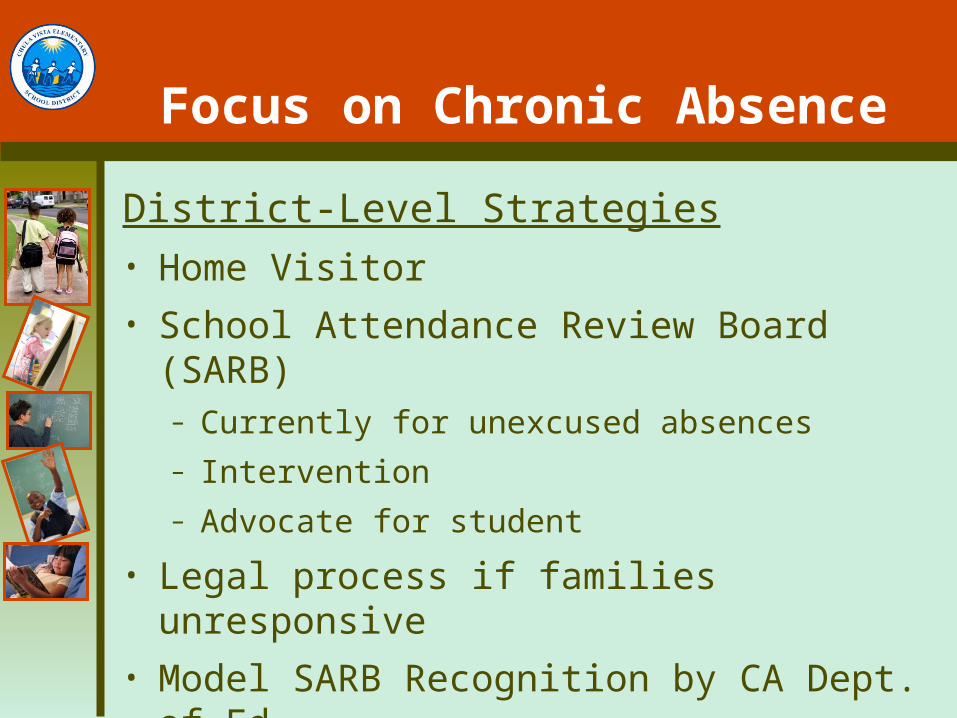
Focus on Chronic Absence
District-Level Strategies• Home Visitor
• School Attendance Review Board (SARB)– Currently for unexcused absences
– Intervention
– Advocate for student
• Legal process if families unresponsive
• Model SARB Recognition by CA Dept. of Ed.
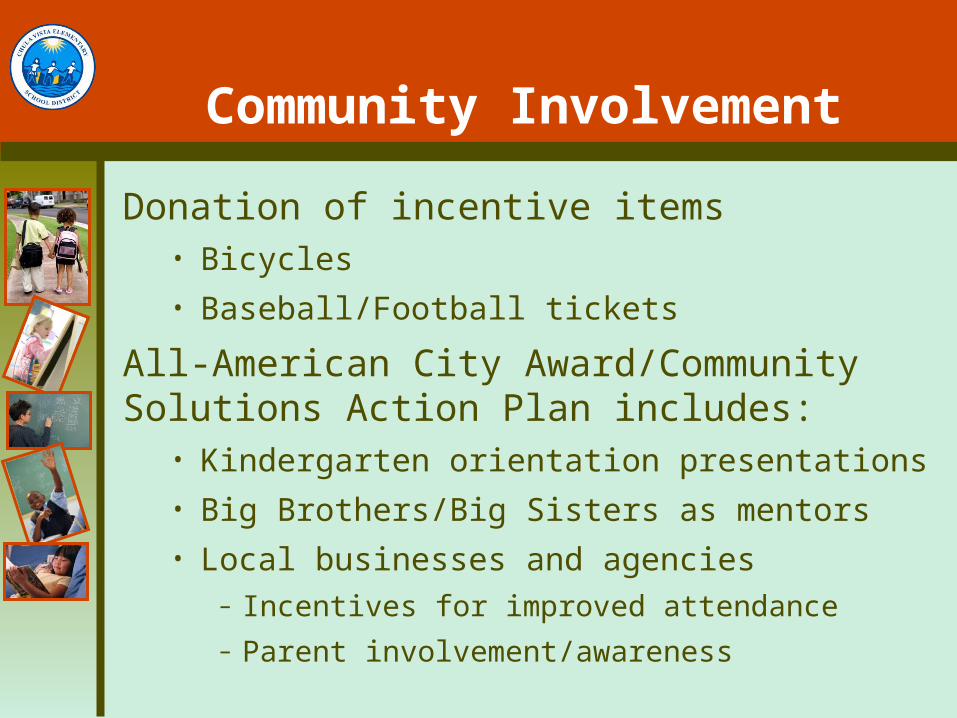
Community Involvement
Donation of incentive items• Bicycles
• Baseball/Football tickets
All-American City Award/Community Solutions Action Plan includes:
• Kindergarten orientation presentations
• Big Brothers/Big Sisters as mentors
• Local businesses and agencies– Incentives for improved attendance
– Parent involvement/awareness

Chula Vista Elementary School District
Lisa ButlerStudent Placement Manager
(619) 425-9600 [email protected]

The Campaign for Grade Level Reading
What’s Working: Promising Approaches to Improving Attendance
Springfield, MassachusettsJuly 1, 2012
Springfield Public Schools - A Culture of Excellence

Springfield Framework: The essential pieces to raising student achievement
Springfield Public Schools - A Culture of Excellence
Effective instruction in every class, every day
Shared, high expectations for all students
Students achieve grade level proficiency
Students graduate ready for college and career
Coach, develop and evaluate educators based on a clear vision of strong instructionSIF #1,2,3,4
Implement a consistent, rigorous curriculum built on common standards with common unit assessmentsSIF #1,3,4,7
Deploy data that is timely, accurate and accessible to make decisions for students, schools and the districtSIF #5,7
Strengthen social, emotional and academic safety nets and supports for all studentsSIF #6
The work
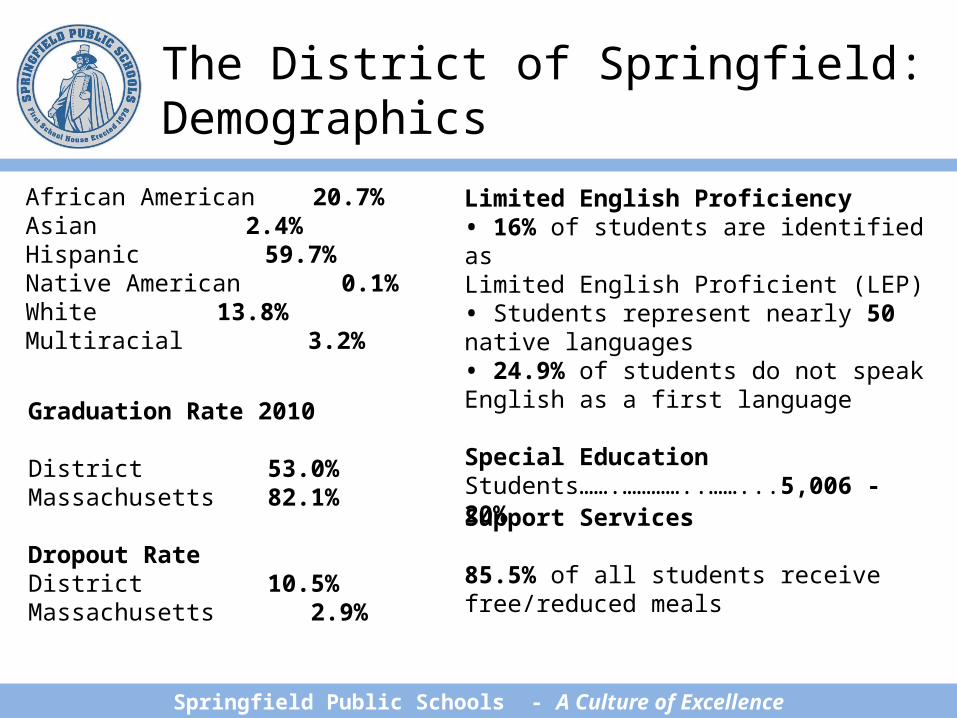
The District of Springfield: Demographics
Springfield Public Schools - A Culture of Excellence
African American 20.7%Asian 2.4%Hispanic 59.7%Native American 0.1%White 13.8%Multiracial 3.2%
Support Services
85.5% of all students receive free/reduced meals
Graduation Rate 2010
District 53.0%Massachusetts 82.1%
Dropout RateDistrict 10.5%Massachusetts 2.9%
Limited English Proficiency• 16% of students are identified asLimited English Proficient (LEP)• Students represent nearly 50 native languages• 24.9% of students do not speak English as a first language
Special EducationStudents…….…………..……...5,006 20%‐
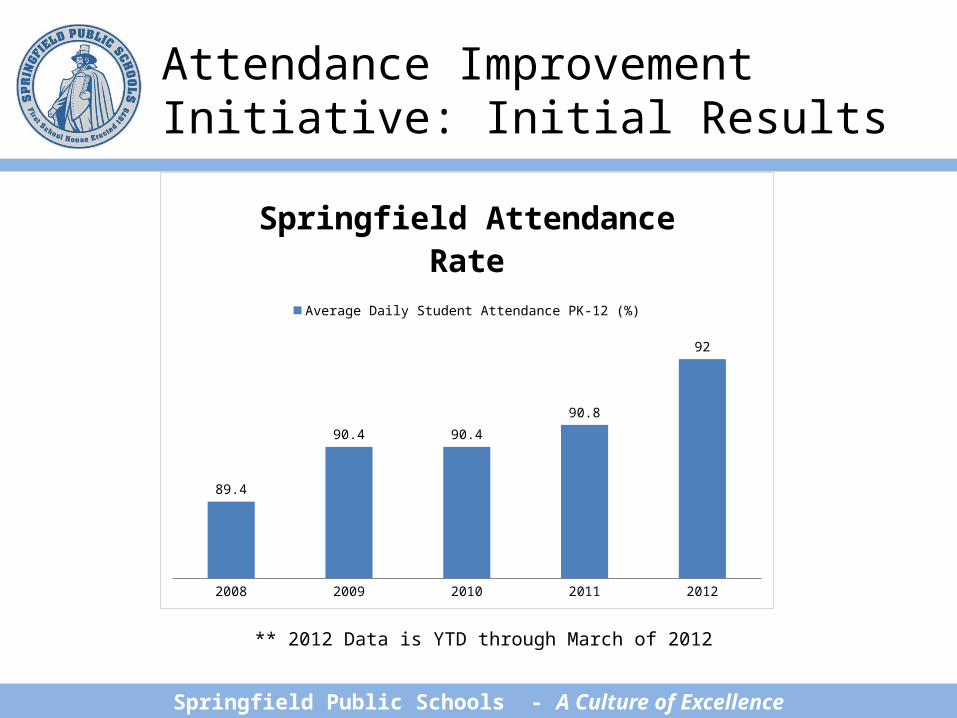
Attendance Improvement Initiative: Initial Results
Springfield Public Schools - A Culture of Excellence
2008 2009 2010 2011 2012
89.4
90.4 90.4
90.8
92
Springfield Attendance RateAverage Daily Student Attendance PK-12 (%)
** 2012 Data is YTD through March of 2012
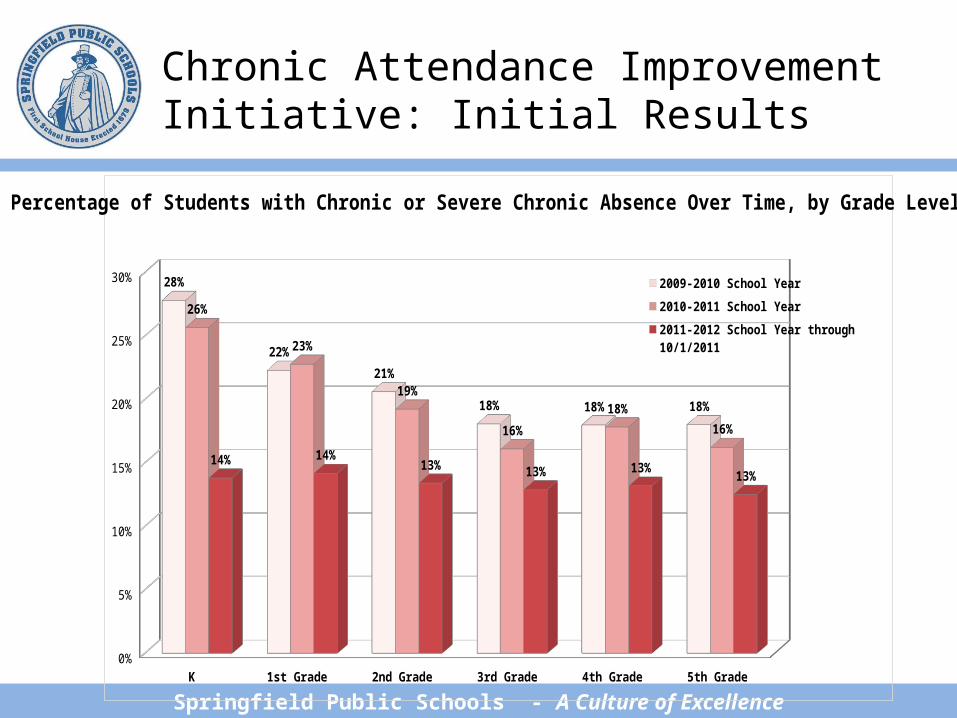
Chronic Attendance Improvement Initiative: Initial Results
Springfield Public Schools - A Culture of Excellence
K 1st Grade 2nd Grade 3rd Grade 4th Grade 5th Grade0%
5%
10%
15%
20%
25%
30% 28%
22%
21%
18% 18% 18%
26%
23%
19%
16%
18%16%
14% 14%13% 13% 13%
13%
2009-2010 School Year
2010-2011 School Year
2011-2012 School Year through 10/1/2011
Percentage of Students with Chronic or Severe Chronic Absence Over Time, by Grade Level
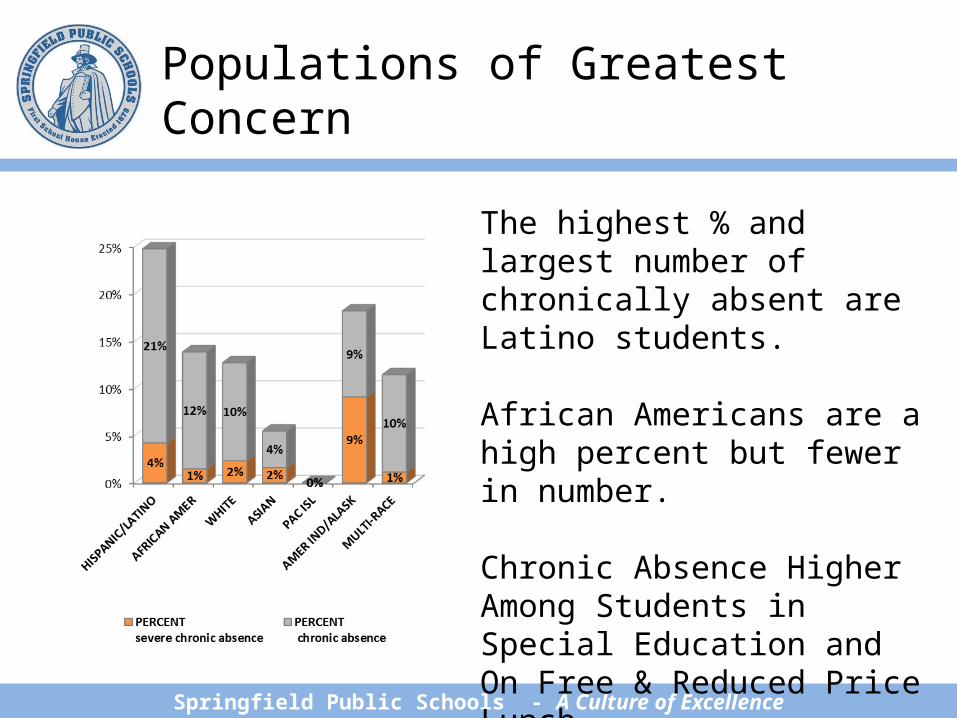
Populations of Greatest Concern
Springfield Public Schools - A Culture of Excellence
The highest % and largest number of chronically absent are Latino students.
African Americans are a high percent but fewer in number.
Chronic Absence Higher Among Students in Special Education and On Free & Reduced Price Lunch
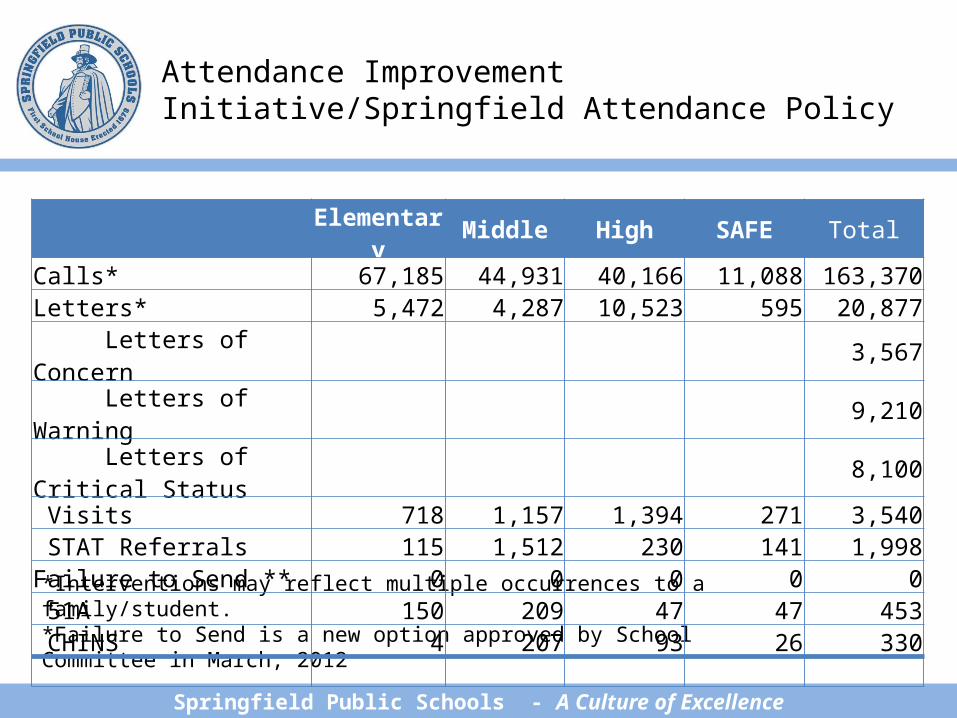
Attendance Improvement Initiative/Springfield Attendance Policy
Springfield Public Schools - A Culture of Excellence
*Interventions may reflect multiple occurrences to a family/student.*Failure to Send is a new option approved by School Committee in March, 2012
Elementary Middle High SAFE TotalCalls* 67,185 44,931 40,166 11,088 163,370Letters* 5,472 4,287 10,523 595 20,877 Letters of Concern 3,567 Letters of Warning 9,210 Letters of Critical Status 8,100 Visits 718 1,157 1,394 271 3,540 STAT Referrals 115 1,512 230 141 1,998Failure to Send ** 0 0 0 0 0 51A 150 209 47 47 453 CHINS 4 207 93 26 330
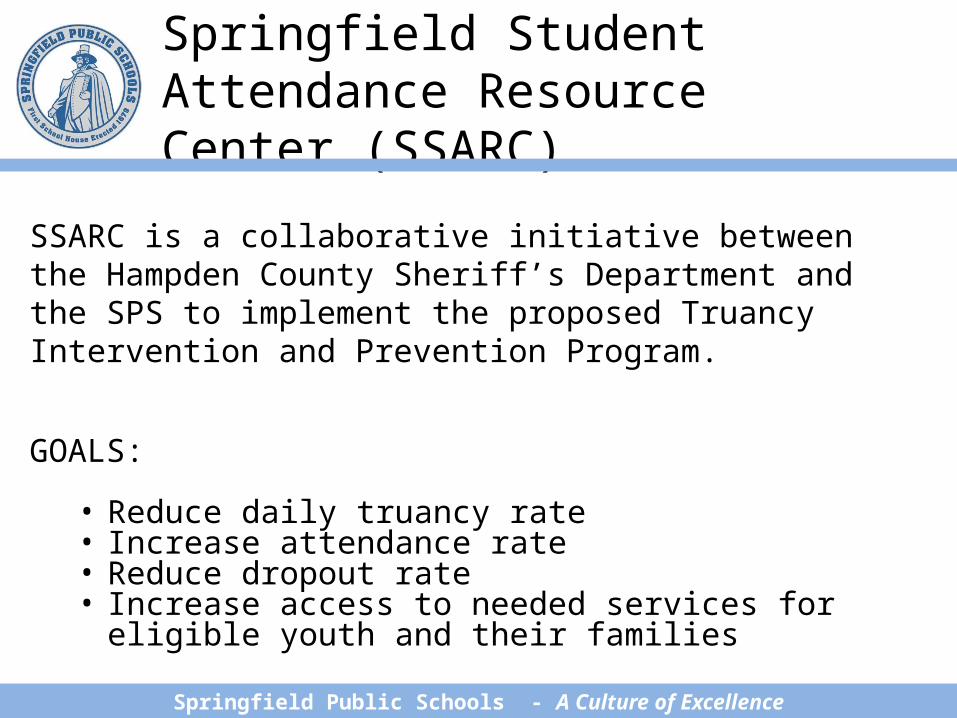
Springfield Student Attendance Resource Center (SSARC)
Springfield Public Schools - A Culture of Excellence
SSARC is a collaborative initiative between the Hampden County Sheriff ’s Department and the SPS to implement the proposed Truancy Intervention and Prevention Program.
GOALS:
• Reduce daily truancy rate • Increase attendance rate • Reduce dropout rate • Increase access to needed services for eligible youth and
their families
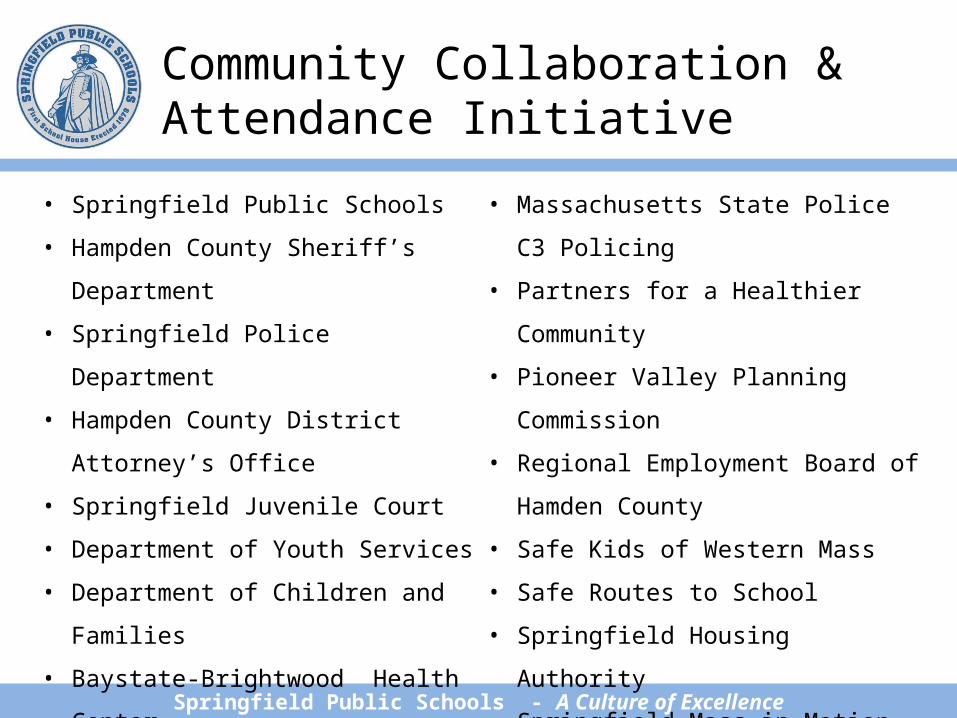
Community Collaboration & Attendance Initiative
Springfield Public Schools - A Culture of Excellence
• Springfield Public Schools
• Hampden County Sheriff ’s Department
• Springfield Police Department
• Hampden County District Attorney’s
Office
• Springfield Juvenile Court
• Department of Youth Services
• Department of Children and Families
• Baystate-Brightwood Health Center
• Massachusetts Department of Public
Health
• Massachusetts State Police C3 Policing
• Partners for a Healthier Community
• Pioneer Valley Planning Commission
• Regional Employment Board of Hamden
County
• Safe Kids of Western Mass
• Safe Routes to School
• Springfield Housing Authority
• Springfield Mass in Motion
• YMCA : ACHEIVE
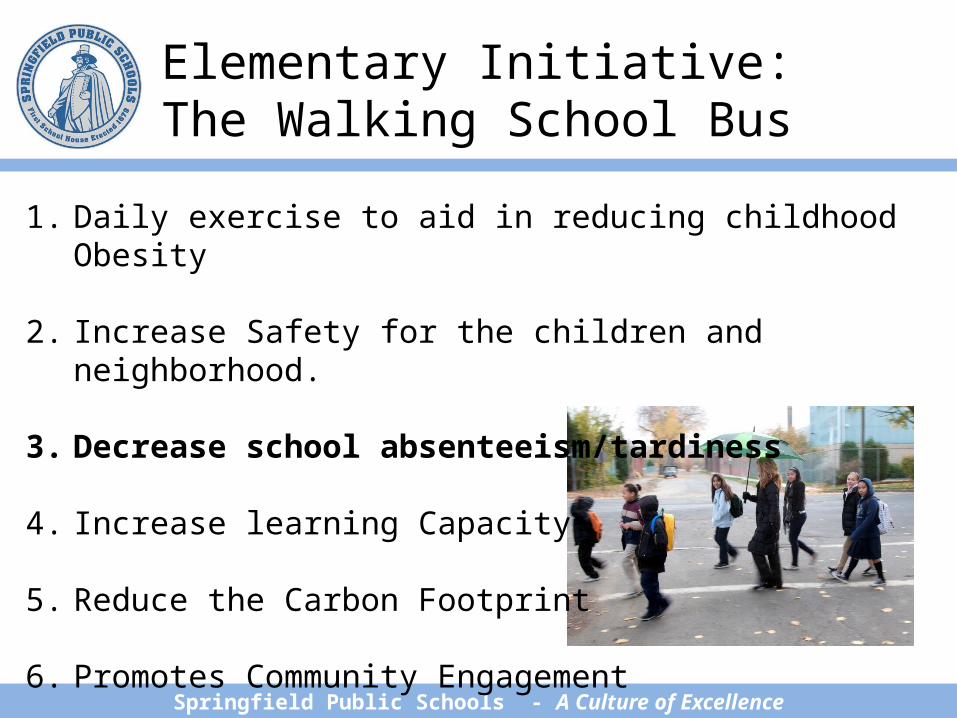
Elementary Initiative: The Walking School Bus
Springfield Public Schools - A Culture of Excellence
1. Daily exercise to aid in reducing childhood Obesity
2. Increase Safety for the children and neighborhood.
3. Decrease school absenteeism/tardiness
4. Increase learning Capacity
5. Reduce the Carbon Footprint
6. Promotes Community Engagement
Elementary Initiative: The Walking School Bus
Springfield Public Schools - A Culture of Excellence
Of students that lived within a 1 mile radius, greater than 90% were driven to school.
Initially began with 6-10 children walking to school every morning with a small but consist group of teachers dedicated to staffing our walking route Monday through Friday . By the end of the first year we had maintained our initial route every morning and had approximately 40-50 consistent students participating.
For the 2011-2012 school year we have expanded the program from one to three separate walking routes. Staff lead each route Monday through Friday. Participation has increased to approximately 134 students consistently walking to school each day.
Early results show that students participating in the Walking School Bus initiative have a better attendance rate (approximately 2% -- almost for additional days of instruction) than there other peers.

For More Information Contact
Springfield Public Schools - A Culture of Excellence
Natalie B. Dunning, Ed.D. - Chief Academic [email protected]
Mary Ann Morris, Ed.D. - Chief of Pupil [email protected]
Karen Pohlman, MSN – Nurse PractionerBaystate-Brightwood Health [email protected]

47
Self Assessment
1. Please fill out Does Attendance Really Count self assessment ?
2. Turn to a partner and discuss any “ahas”
3. Hand in your self assessment with the identified t.a. needs to Attendance Works before leaving the session.
(Note: Please fill in and take a 2nd self-assessment if you’d like a record of your responses. We will email out a collective tally of the results. )
48
“Take Aways” Every day counts for learning especially in the
early years.Intervening starts with finding out how many &
which students and schools are affected by chronic absence.
Use data to identify priorities for action and promising practice sites
Move the needle on discretion and unpack barriers by providing a) incentives for good and improved attendance, b) parent education, c) personalized early outreach and d) attendance data teams.
Find out how everyone can contribute to reducing absences.
Recommended