MS INA CRONJÉ, MPLMEC for Finance
4 March 2010
BUDGET SPEECH2010/11

ISBN No.: 0-86967-413-7
To obtain further copies of this document, please contact:
Provincial Treasury
5th Floor
Treasury House
145 Chief Albert Luthuli Road
3201
P O Box 3613
Pietermaritzburg
3200
Tel: +27 (0) 33 - 8974200
Fax: +27 (0) 33 - 8974617
1
2 0 1 0 / 1 1 B U D G E T S P E E C H
PROVINCE OF KWAZULU-NATAL
Budget address by Ms Ina Cronjé
MEC for Finance,
On tabling of the 2010 MTEF Budget in the Provincial Legislature
4 March 2010
INTRODUCTION
Section 28 (1) of the PFMA requires that the MEC for Finance in a province annually tables, in the
Provincial Legislature, a multi-year budget projection of:
a) the estimated revenue expected to be raised during each financial year of the
multi-year period; and
b) the estimated expenditure expected to be incurred, per vote, during each year of
the multi-year period, differentiating between capital and current expenditure.
In line with this provision, I rise to table in this Legislature the 2010/11 Medium Term
Expenditure Framework (MTEF) budget for the Province of KwaZulu-Natal.
“Don’t tell me where your priorities are. Show me where you spend your money and I’ll tell you
what they are.”1
Today we will show honourable Members where we intend spending our money, and you can tell
us whether they address provincial priorities. But remember, “Money is only a tool. It will take
you wherever you wish, but it will not replace you as the driver.”2
Or, in the words of our beloved Madiba, “Money won't create success, the freedom to make it will.”
OUR VISION AND PRIORITIES
2010 is the year in which we will do things differently. The new approach spells out our vision for
our country and our province and is expressed in 12 measurable outcomes. These outcomes,
with associated activities and defined targets to be reached by 2014, have shaped the 2010
budget allocations:
l Improved quality of Basic Education
l A long and healthy life for all South Africans
l All people in South Africa are safe and feel safe
1 James W Frick
2 Ayn Rand (Russian born American writer and novelist)
2
2 0 1 0 / 1 1 B U D G E T S P E E C H
l Decent employment through inclusive economic growth
l A skilled and capable work force to support an inclusive growth path
l An efficient, competitive and responsive infrastructure network
l Vibrant, equitable and sustainable rural communities contributing to food security for all
l Sustainable human settlements and improved quality of household life
l Responsive, accountable, effective and efficient local government
l Protected and enhanced environmental assets and natural resources
l An efficient, effective and development oriented public service and an empowered, fair and
inclusive citizenship
l A better South Africa and a better World
To achieve our vision embodied in these outcomes, the province has embarked on a detailed
information gathering process led by the Office of the Premier. This is conducted through the
employment of volunteers. They operate in various communities to survey and record the needs
of our communities at a household level. A full set of data for each household will enable us to
determine poverty levels, health status, and education levels at community level. This will
provide the province with sufficient information to react appropriately in devising policies and
plans that will have a meaningful impact on the lives of our people.
The exact cost of employing enough volunteers to conduct household surveys and community
mobilization is still being calculated, and will therefore receive the required funding in the
2010/11 Adjustments Estimate. In the meantime lead departments can utilise their existing
baselines to finance this programme.
Provincial priorities that are imperative in achieving the 12 outcomes continue to be funded and
my colleague MECs will elaborate on this when they table their respective budgets. The priorities
include:
l Food security - under the slogan “ONE HOME ONE GARDEN”
l The protection and empowerment of women and children
l Treatment of disease, especially TB and HIV
l Provision of food parcels as an interim measure
l Improved births registration
l Increased access to Early Childhood Development services and schooling
l Provision of school nutrition and free schooling
l Skills development programmes
l The establishment of policing fora and street committees
l The re-integration of identified offenders back into communities
l Social crime prevention
l Implementation of social cohesion and moral regeneration programmes
l Creating markets for young entrepreneurs
3
2 0 1 0 / 1 1 B U D G E T S P E E C H
ECONOMIC SCENARIO
The current economic crisis has brought forward questions about ethics and values and there is
now a strong feeling that our planet needs a new compass to set us on a path of real progress.
We have to practice what Nobel prize winner Albert Einstein believed, “the world will not evolve
past its current state of crisis by using the same thinking that created the situation.”3
We must learn from the mistakes we have made and from mistakes made globally. The
new growth path to achieving faster growth, higher employment and reduced levels of poverty
entails:
l sound macroeconomic policies
l microeconomic reform
l massive education and skills programmes
l public employment programmes and job creation through economic growth
l support to the poor and vulnerable by providing a social safety net
l support to business to grow the economy and create employment
l a capable, efficient and effective government
We will embark on this road with the credo of DOING MORE WITH LESS. We will not cut on
service delivery but we have to be more focused and work harder and smarter to outwit the
less than favourable economic landscape.
However, we are meeting in an atmosphere of optimism today. Our economy is no longer in the
intensive care unit. In fact we are recuperating beyond expectations due to our sound
macroeconomic and fiscal policies. From a rating of 15th last year the World Economic Forum's
global competitiveness index now rates South Africa sixth out of 133 countries for “soundness of
banks.”
We welcome the good news by Statistics South Africa that the manufacturing sector, which
employs about 1.7 million people, made a dramatic recovery in the fourth quarter of last year.
The 10% quarterly increase (adjusted and annualised) in manufacturing boosted our total
national fourth quarter gross domestic product (GDP), which expanded by 3.2% in the final three
months of the year when compared with the third quarter. Provincial GDP increased by 3.09%
(annualised and quarterly) from the third quarter, with a 9% growth in the manufacturing sector
in the fourth quarter.
New vehicle sales are now on the increase. Business confidence is improving once again and
trade activity is positive. There is an increase in manufacturing and according to the Manpower’s
Quarterly Survey, some companies have recorded a 22% increase in their manufacturing
activities and are now considering hiring more workers in the first quarter of 2010. The Kagiso
Purchasing Managers Index (PMI), a reliable yardstick of factory output, rose sharply to 53.6
points in January 2010 from 52.5 points in December 2009 (Bureau of Economic Research).
3 In 1922, Einstein was awarded the 1921 Nobel Prize in Physics, “for his services to Theoretical Physics, and
especially for his discovery of the law of the photoelectric effect”.
4
2 0 1 0 / 1 1 B U D G E T S P E E C H
The global economy is likewise recovering faster than previously anticipated. As world economic
growth is bouncing back from negative territory in 2009 the International Monetary Fund had to
adjust its economic growth forecast upwards to 3.9% this year and 4.3% in 2011.
For South Africa, the National Treasury projects real GDP growth to rise to 2.3% in 2010 and
3.2% in 2011. Returning to annual growth rates of 5% and higher will require a much greater
effort. We need to broaden economic participation to young people, rural communities and
marginalised groups in particular.
For KwaZulu-Natal, Provincial Treasury is forecasting an increase in the gross domestic product
(GDP-R) of between 2.2% and 2.7% in 2010. The inflation rate is expected to be within the 6.5%
to 7% range. On the whole these indicators are positive signs that give us hope.
But while we are hopeful we need to be reminded that we are still in the recovery ward. Despite
the positive growth during the last quarters of 2009 both the national and provincial economies
shrank on a year on year basis.
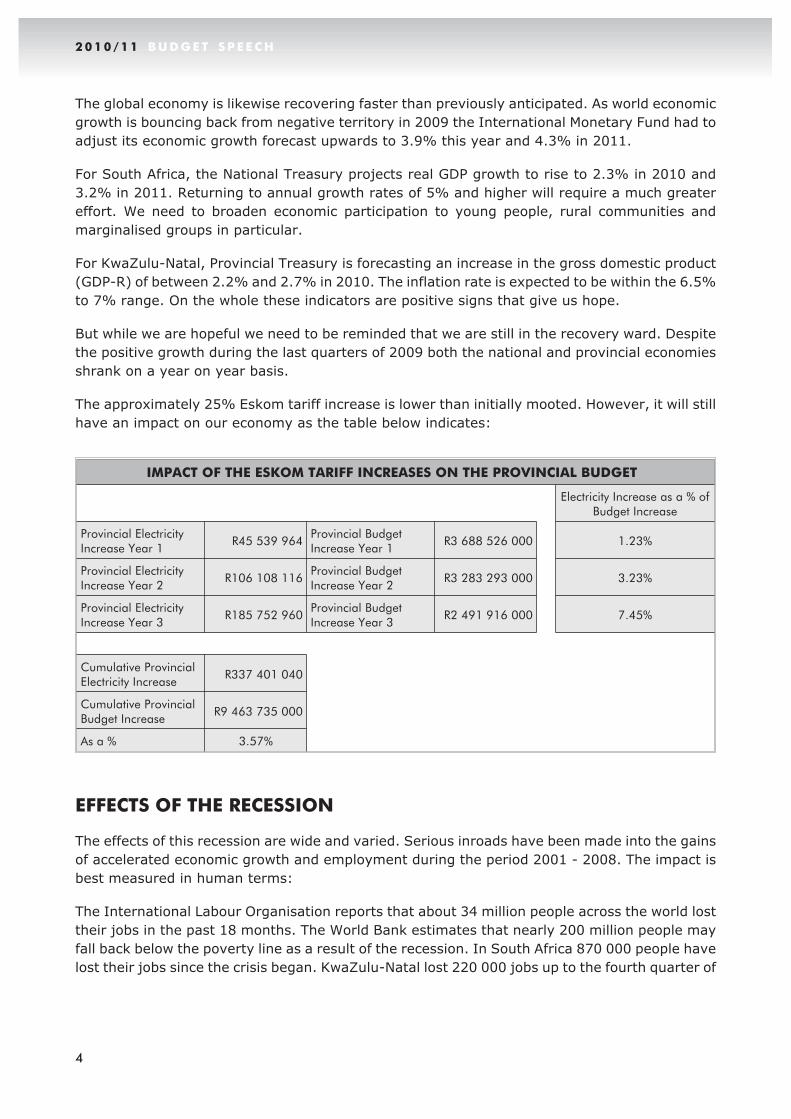
The approximately 25% Eskom tariff increase is lower than initially mooted. However, it will still
have an impact on our economy as the table below indicates:
IMPACT OF THE ESKOM TARIFF INCREASES ON THE PROVINCIAL BUDGET
Electricity Increase as a % ofBudget Increase
Provincial ElectricityIncrease Year 1
R45 539 964Provincial BudgetIncrease Year 1
R3 688 526 000 1.23%
Provincial ElectricityIncrease Year 2
R106 108 116Provincial BudgetIncrease Year 2
R3 283 293 000 3.23%
Provincial ElectricityIncrease Year 3
R185 752 960Provincial BudgetIncrease Year 3
R2 491 916 000 7.45%
Cumulative ProvincialElectricity Increase
R337 401 040
Cumulative ProvincialBudget Increase
R9 463 735 000
As a % 3.57%
EFFECTS OF THE RECESSION
The effects of this recession are wide and varied. Serious inroads have been made into the gains
of accelerated economic growth and employment during the period 2001 - 2008. The impact is
best measured in human terms:
The International Labour Organisation reports that about 34 million people across the world lost
their jobs in the past 18 months. The World Bank estimates that nearly 200 million people may
fall back below the poverty line as a result of the recession. In South Africa 870 000 people have
lost their jobs since the crisis began. KwaZulu-Natal lost 220 000 jobs up to the fourth quarter of
5
2 0 1 0 / 1 1 B U D G E T S P E E C H
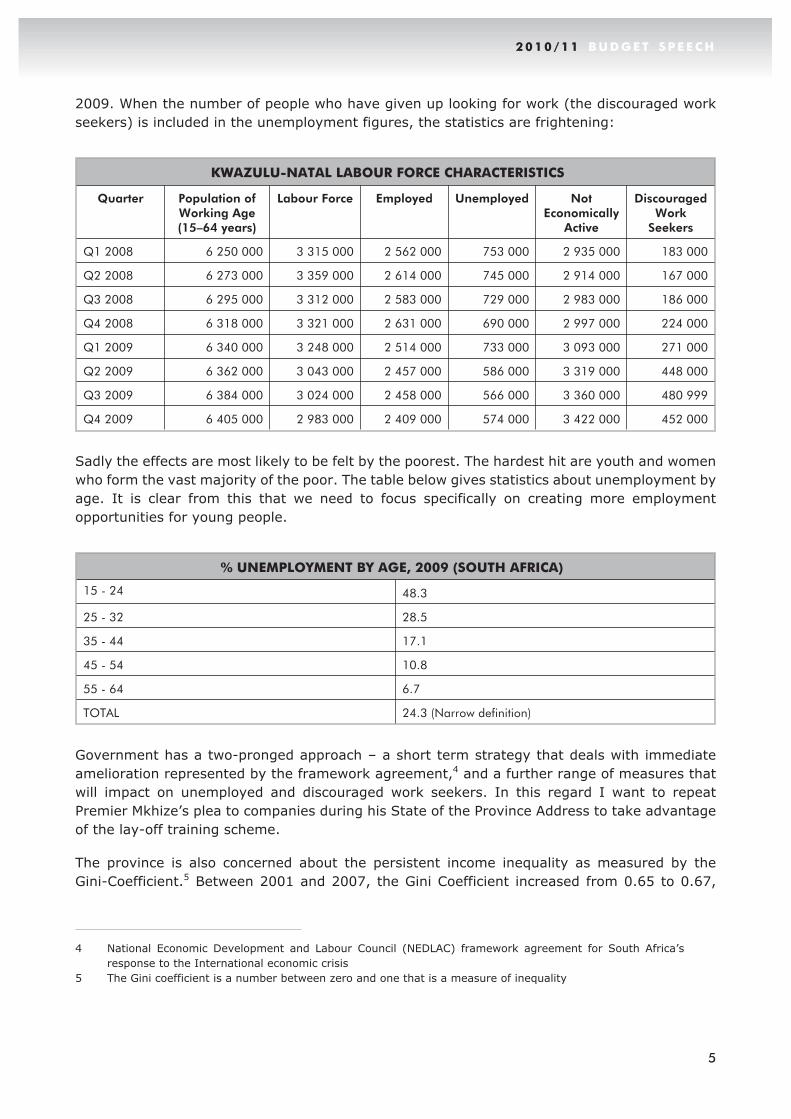
2009. When the number of people who have given up looking for work (the discouraged work
seekers) is included in the unemployment figures, the statistics are frightening:
KWAZULU-NATAL LABOUR FORCE CHARACTERISTICS
Quarter Population ofWorking Age(15–64 years)
Labour Force Employed Unemployed NotEconomically
Active
DiscouragedWork
Seekers
Q1 2008 6 250 000 3 315 000 2 562 000 753 000 2 935 000 183 000
Q2 2008 6 273 000 3 359 000 2 614 000 745 000 2 914 000 167 000
Q3 2008 6 295 000 3 312 000 2 583 000 729 000 2 983 000 186 000
Q4 2008 6 318 000 3 321 000 2 631 000 690 000 2 997 000 224 000
Q1 2009 6 340 000 3 248 000 2 514 000 733 000 3 093 000 271 000
Q2 2009 6 362 000 3 043 000 2 457 000 586 000 3 319 000 448 000
Q3 2009 6 384 000 3 024 000 2 458 000 566 000 3 360 000 480 999
Q4 2009 6 405 000 2 983 000 2 409 000 574 000 3 422 000 452 000
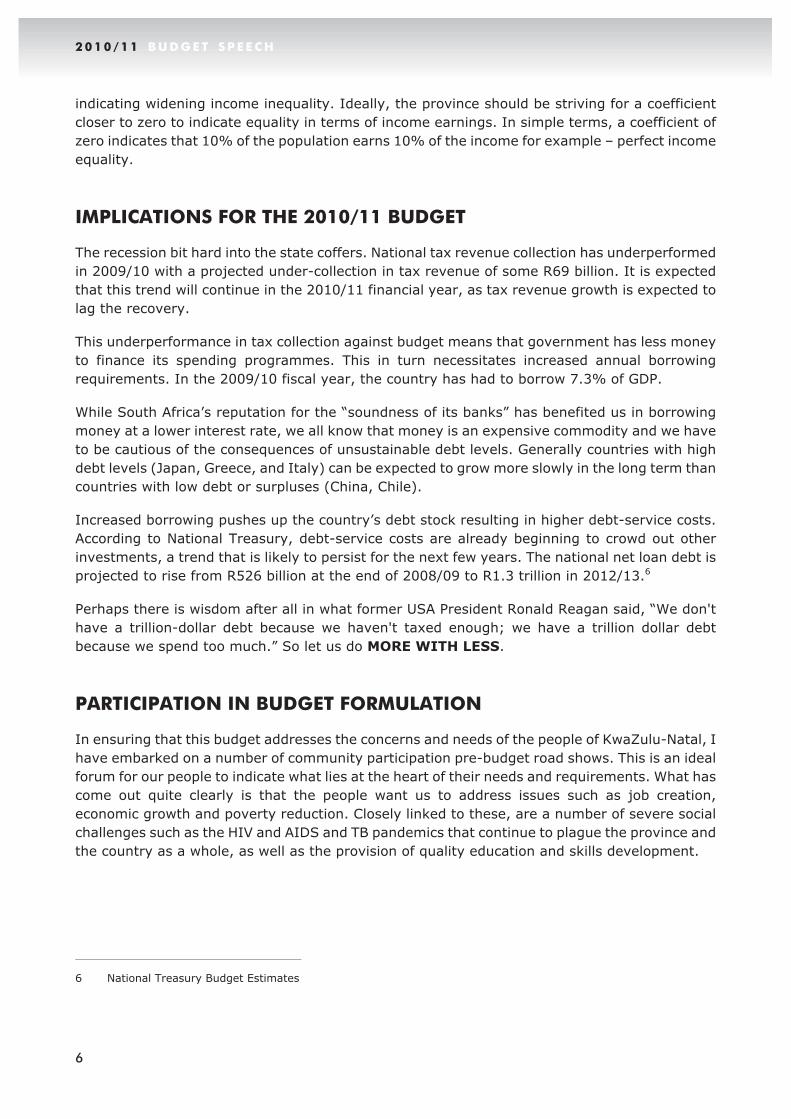
Sadly the effects are most likely to be felt by the poorest. The hardest hit are youth and women
who form the vast majority of the poor. The table below gives statistics about unemployment by
age. It is clear from this that we need to focus specifically on creating more employment
opportunities for young people.
% UNEMPLOYMENT BY AGE, 2009 (SOUTH AFRICA)
15 - 24 48.3
25 - 32 28.5
35 - 44 17.1
45 - 54 10.8
55 - 64 6.7
TOTAL 24.3 (Narrow definition)
Government has a two-pronged approach – a short term strategy that deals with immediate
amelioration represented by the framework agreement,4 and a further range of measures that
will impact on unemployed and discouraged work seekers. In this regard I want to repeat
Premier Mkhize’s plea to companies during his State of the Province Address to take advantage
of the lay-off training scheme.
The province is also concerned about the persistent income inequality as measured by the
Gini-Coefficient.5 Between 2001 and 2007, the Gini Coefficient increased from 0.65 to 0.67,
4 National Economic Development and Labour Council (NEDLAC) framework agreement for South Africa’s
response to the International economic crisis
5 The Gini coefficient is a number between zero and one that is a measure of inequality
6
2 0 1 0 / 1 1 B U D G E T S P E E C H
indicating widening income inequality. Ideally, the province should be striving for a coefficient
closer to zero to indicate equality in terms of income earnings. In simple terms, a coefficient of
zero indicates that 10% of the population earns 10% of the income for example – perfect income
equality.
IMPLICATIONS FOR THE 2010/11 BUDGET
The recession bit hard into the state coffers. National tax revenue collection has underperformed
in 2009/10 with a projected under-collection in tax revenue of some R69 billion. It is expected
that this trend will continue in the 2010/11 financial year, as tax revenue growth is expected to
lag the recovery.
This underperformance in tax collection against budget means that government has less money
to finance its spending programmes. This in turn necessitates increased annual borrowing
requirements. In the 2009/10 fiscal year, the country has had to borrow 7.3% of GDP.
While South Africa’s reputation for the “soundness of its banks” has benefited us in borrowing
money at a lower interest rate, we all know that money is an expensive commodity and we have
to be cautious of the consequences of unsustainable debt levels. Generally countries with high
debt levels (Japan, Greece, and Italy) can be expected to grow more slowly in the long term than
countries with low debt or surpluses (China, Chile).
Increased borrowing pushes up the country’s debt stock resulting in higher debt-service costs.
According to National Treasury, debt-service costs are already beginning to crowd out other
investments, a trend that is likely to persist for the next few years. The national net loan debt is
projected to rise from R526 billion at the end of 2008/09 to R1.3 trillion in 2012/13.6
Perhaps there is wisdom after all in what former USA President Ronald Reagan said, “We don't
have a trillion-dollar debt because we haven't taxed enough; we have a trillion dollar debt
because we spend too much.” So let us do MORE WITH LESS.
PARTICIPATION IN BUDGET FORMULATION
In ensuring that this budget addresses the concerns and needs of the people of KwaZulu-Natal, I
have embarked on a number of community participation pre-budget road shows. This is an ideal
forum for our people to indicate what lies at the heart of their needs and requirements. What has
come out quite clearly is that the people want us to address issues such as job creation,
economic growth and poverty reduction. Closely linked to these, are a number of severe social
challenges such as the HIV and AIDS and TB pandemics that continue to plague the province and
the country as a whole, as well as the provision of quality education and skills development.
6 National Treasury Budget Estimates

7
2 0 1 0 / 1 1 B U D G E T S P E E C H
Our responsibility as the government of KwaZulu-Natal is to ensure that every possible measure
is taken to allocate public spending to the priorities of the people. Equally important is to ensure
that we spend public money wisely, effectively and efficiently.
Given our moderate economic growth and rising public debt interest costs government is
scrutinising departmental performance to improve efficiency, obtain better value for money and
move resources to where they are needed most.
To this end I have met with all my colleagues, the MECs, to discuss their budgets vote by vote.
This has given us the opportunity to gain insight into spending pressures and to seek solutions
together; and I thank them for their enthusiastic participation in these discussions.
THE 2010/11 MTEF
I now turn to the Provincial Fiscal Framework for the 2010/11 MTEF.
Table 1: Summary of provincial payments and estimates by vote
Outcome Main
Appropria-
tion
Adjusted
Appropria-
tion
Revised
Estimate
Medium-term
EstimatesR thousandAudited
2006/07
Audited
2007/08
Audited
2008/092009/10 2010/11 2011/12 2012/13
1. Office of the Premier 303 766 395 396 463 842 454 010 435 718 435 718 419 284 405 145 425 306
2. Provincial Legislature 160 791 209 999 247 649 287 051 306 768 309 356 322 193 353 132 380 684
3. Agriculture, Environmental Affairs and Rural Dev. 1 291 802 1 252 713 1 752 824 1 950 032 1 999 301 1 991 217 2 188 337 2 361 767 2 481 127
4. Economic Development and Tourism 507 910 1 510 954 1 771 422 2 487 690 2 492 401 2 470 752 1 624 798 1 473 278 1 547 147
5. Education 16 218 726 18 406 747 22 991 742 24 609 443 26 058 854 26 271 374 29 034 762 31 600 250 33 292 209
6. Provincial Treasury 506 002 379 645 693 565 624 923 523 449 670 467 640 637 666 077 686 857
7. Health 11 663 951 14 959 441 17 103 101 17 448 526 18 329 163 20 641 179 21 657 681 23 628 833 25 106 593
8. Human Settlements 1 252 921 1 522 181 1 876 146 2 571 813 2 573 713 2 570 713 3 111 613 3 429 147 3 621 603
9. Community Safety and Liaison 59 360 78 797 109 287 127 638 127 638 125 613 140 744 149 207 156 740
10. The Royal Household 38 147 39 114 47 853 40 643 40 643 40 643 43 845 46 214 48 560
11. Co-operative Governance and Traditional Affairs 654 132 744 650 1 020 672 1 092 420 1 093 918 1 053 918 1 061 903 1 129 745 1 186 801
12. Transport 2 539 187 3 121 798 5 025 223 5 147 898 5 231 798 5 204 798 5 631 057 5 930 515 6 267 113
13. Social Development 941 579 1 015 188 1 232 408 1 361 280 1 361 280 1 361 280 1 668 170 1 873 676 1 968 432
14. Public Works 450 267 479 297 731 259 867 440 798 625 793 101 868 214 920 437 967 154
15. Arts and Culture 179 290 206 435 253 289 256 432 267 323 264 323 357 018 328 491 358 124
16. Sport and Recreation 113 566 160 598 213 267 259 187 266 187 261 187 307 107 364 970 383 364
TOTAL 36 881 397 44 482 953 55 533 549 59 586 426 61 906 779 64 465 639 69 077 363 74 660 884 78 877 814
Table 1 gives a summary of provincial allocations by vote.
Education
The lion’s share again goes to Education. The Education budget is set to rise from R26.058
billion in 2009/10 to R33.292 billion in 2012/13. This shows an average annual growth of 8.5%
(nominal) and 3.5% in real terms. This is to give effect to the key priority of government, namely
to improve the quality of education.
A total of 1 465 882 learners at our public schools in KZN are expected to benefit from the NO FEE
policy by 2012/13. There are currently 3 382 no fee schools in the province, including farm
schools. The NO FEE school policy will be extended to cover Quintile 3 schools in 2010/11.
Furthermore, funding has been made available for the re-imbursement of schools in Quintiles 3
to 5 that enroll learners from poor backgrounds.
8
2 0 1 0 / 1 1 B U D G E T S P E E C H
To address the shortage of school infrastructure, 8 schools are currently being constructed and
mobile early childhood development (ECD) classrooms will be delivered to 200 primary schools.
In line with this, the number of Grade R classes in the province have increased to 5 500 over the
past five years.
A hungry child cannot perform to his or her potential. Therefore, the national school nutrition
programme is being extended to cover Quintile 2 secondary schools. This increases the coverage
to 1 845 000 learners in 2010/11, rising to 2 168 821 learners in 2012/13.
Health
In terms of health services, the budget allocated to the Department of Health increases from
R18.329 billion in 2009/10 to R25.107 billion in 2012/13, receiving the second highest share of
the provincial budget. An annual average growth of 11.1% (nominal) and 6.0% in real terms is
reflected.
This budget will continue to be utilised for improving the provision of health care in the province.
This includes the comprehensive management of HIV and AIDS, maternal, neo-natal and
women's health and the comprehensive management of TB.
The budget allocated to the Department of Health will provide for the treatment of 33 918 308
people at Primary Health Care Facilities in 2012/13. This is an increase of 7 727 150 from the
2009/10 financial year. Of these 1 775 407 are children under the age of 5 years.
The new born Nevirapine uptake rate is set to remain at 100% over the entire MTEF. The
newborn baby AZT uptake is planned to be increased from 91% in 2009/10 to 100% in 2012/13.
The total number of registered ART patients on treatment is set to more than double between
2009/10 and 2012/13, increasing from 335 148 patients to 695 557 patients.
Transport
The budget allocated to the Department of Transport increases from R5.232 billion in 2009/10
to R6.267 billion in 2012/13 which shows an average annual growth of 1.3% in real terms (6.2%
nominal). This will enable the department to continue to construct, maintain and repair the
provincial road network; plan, regulate and provide an integrated transportation system; and
manage road traffic. It will also allow the department to rehabilitate 1 400 000 m2 of road per
year and reseal 1 800 000 m2 of tarred road, among others. A number of projects are
implemented using labour intensive methods, and the MTEF sees the continued use of Zibambele
contractors with 40 000 contractors being employed annually. Through the EPWP projects, the
department will be creating 5.240 million person days of work annually.
Human Settlements
The budget of the Department of Human Settlements rises from R2.574 billion in 2009/10 to
R3.622 billion in 2012/13, which is an average annual increase of 6.9% in real terms (12.1%
nominal). This allocation allows the department to continue to accelerate housing delivery in
rural areas throughout the province and to continue with the slums clearance programme aimed
at eradicating all slums in the province by 2014. In terms of the rural housing programme
administered by this department, the department plans to complete 43 702 houses over the
9
2 0 1 0 / 1 1 B U D G E T S P E E C H
MTEF. The department receives a new conditional grant in 2010/11 of R133.800 million to assist
with the rehabilitation of community settlements affected by severe storms and flooding during
2008 and 2009.
Access to social services such as housing and potable water in KwaZulu-Natal has improved
steadily over the years. For example, more than 1.3 million households now have access to
decent housing compared to 910 000 in 2001. The number of households without access to
potable water has declined from 594 000 in 2001 to about 100 000 currently.
Agriculture, Environmental Affairs and Rural Development
The Department of Agriculture, Environmental Affairs and Rural Development will focus
on rural development, agrarian reform, social and economic infrastructure development and
sustainable natural resource management. The budget allocated to the department increases
from R1.999 billion in 2009/10 to R2.481 billion in 2012/13 which is an annual average real
increase of 2.5% (7.5% nominal). This allocation will ensure that 791 956 food insecure
households will benefit from the food security interventions over the MTEF. Furthermore, more
than 800 000 beneficiaries per year will be receiving seed packs.
Social Development
The budget of the Department of Social Development increases from R1.361 billion in 2009/10
to R1.968 billion in 2012/13, which is an annual average increase of 7.9% in real terms (13.1%
nominal). The department will continue to focus on various initiatives, such as the National Youth
service, victim empowerment, substance abuse and HIV and AIDS programmes.
Co-operative Governance and Traditional Affairs
The Department of Co-operative Governance and Traditional Affairs sees an increase in its
budget allocation from R1.094 billion in 2009/10 to R1.187 billion in 2012/13. This is a decrease
of 2.0% in real terms (increase of 2.8% nominal). This budget growth is low due to the Province
recalling all World Cup 2010 funding post 2010, to the Provincial Revenue Fund. The department
will, however, continue to focus on the local government turnaround strategy, infrastructure
investment, capacity building and co-operative governance.
Economic Development and Tourism
The Department of Economic Development and Tourism’s budget allocation in 2009/10 is
R2.492 billion. This decreases to R1.547 billion in 2012/13, mainly due to the completion of the
airport portion of the Dube Trade Port (DTP) project administered by the department. This
reflects negative growth of 18.6% (14.7% nominal). The allocation allows for the continuation of
projects such as the Richards Bay Industrial Development Zone, the Moses Kotane Institute
(which trains teachers and students in mathematics and science) and DTP. The department will
also be initiating new projects, such as the Tourism Buddy programme which trains guides on the
correct protocol and information required to assist foreign tourists during the 2010 World Cup.
Also, the allocation provides for the establishment of the Agri-Business Development Agency
which is a special purpose vehicle focusing on improving the land reform process and providing
support to emerging farmers, including the sourcing of appropriate markets.
10
2 0 1 0 / 1 1 B U D G E T S P E E C H
Public Works
The Department of Public Works’ budget increases from R798.625 million in 2009/10 to
R967.154 million in 2012/13, which is an average annual real increase of 1.7% (6.6% nominal).
This allocation will be used for continued payment of property rates on all provincial properties,
the expansion of the IDIP programme to other departments as well as continuing the mentoring
and training of the construction industry in KwaZulu-Natal.
Provincial Treasury
The budget allocation of the Provincial Treasury increases from R523.449 million in 2009/10
to R686.857 million in 2012/13, which includes a substantial amount of R235 million per year,
being a provision for the interest costs related to the provincial overdraft. This interest on the
overdraft allocation is kept constant over the MTEF, resulting in an average annual real growth of
only 4.5%. The allocation also provides for the Municipal Support Programme which continues to
support and assist municipalities in improving their level of financial management and reporting.
Office of the Premier
The Office of the Premier’s budget allocation decreases from R435.718 million in 2009/10 to
R425.306 million in 2012/13, which is a decrease in real terms of 5.4% (0.8% nominal) due to
the fact that the full Soccer Development allocation is moved to the Department of Sport and
Recreation from 2011/12. Among others, their allocation allows the Office of the Premier to
complete phase 2 of the provincial Nerve Centre; undertake a number of activities in relation to
hosting five soccer teams (Greece, Algeria, Nigeria, Cameroon and Paraguay) during the 2010
World Cup; and to continue focusing on training public servants at the Provincial Public Service
Training academy, with the intention of training 6 000 public servants in 2010/11.
Arts and Culture
The Department of Arts and Culture’s budget allocation increases from R267.323 million in
2009/10 to R358.124 million in 2012/13. This is an increase of 5.2% in real terms (10.2%
nominal). This increase is influenced by the fact that 2010/11 includes a substantial once-off
allocation of R56.943 million for a number of infrastructure projects, such as the renovations of
halls and camp sites and the construction of arts centres. The department is also commencing
the process of provincialising public libraries in 2010/11, which is being done in a phased-in
approach.
Sport and Recreation
The Department of Sport and Recreation sees its budget allocation increasing from R266.187
million in 2009/10 to R383.364 million in 2012/13 which is an average annual increase of 7.8%
in real terms (12.9% nominal). As mentioned earlier, this substantial real growth is influenced by
the movement of Soccer Development funding from the Office of the Premier. A large portion of
the department's allocation relates to the Mass Sports and Recreation Participation Programme
conditional grant which funds the promotion of mass participation within schools and
communities through a number of selected sports and recreation activities.
11
2 0 1 0 / 1 1 B U D G E T S P E E C H
Provincial Legislature
The budget of the Provincial Legislature increases from R306.768 million in 2009/10 to
R380.684 million in 2012/13, which is an average annual real increase of 2.5% (7.5% nominal).
This allocation is inclusive of the remuneration of the Members of this House. The allocation also
provides for public participation events, aimed at improving the interaction between the Legislature
and the citizens of the Province.
Community Safety and Liaison
The Department of Community Safety and Liaison’s budget increases from R127.638 million
in 2009/10 to R156.740 million in 2012/13, which is an average annual real increase of 2.2%
(7.1% nominal). This allocation provides for the Volunteer Social Crime Prevention Programme
which aims to drive social crime prevention through visible policing.
Royal Household
The Royal Household’s budget allocation increases from R40.643 million in 2009/10 to
R48.560 million in 2012/13, which is an average annual real increase of 1.2% (6.1% nominal).
The intention is for this vote to be listed as a public entity during the course of the year, where
after it will be incorporated into Vote 1: Office of the Premier.
“Finance is the art of passing money from hand to hand until it finally disappears.”7
Own-revenue estimates
Due to the continued existence of the provincial overdraft the province is not able to realise any
interest from the provincial revenue fund. As a result, we have had to revise downwards the
provincial own-revenue by R115.226 million in 2010/11, R126.857 million in 2011/12 and
R105.237 million in 2012/13. After factoring in these downward revisions, the province is
estimating to collect R1.804 billion, R1.943 billion and R2.068 billion over the MTEF mainly from
motor vehicle licence fees, gaming and health patient fees. However, the Province needs to
explore more ways in which we can increase our own revenue and Provincial Treasury is working
on proposals in that regard.
Reprioritisation
Preparing this framework required the province to look seriously at reprioritising the existing
provincial baseline. For example, allocations for 2010 Soccer World Cup related expenditure,
which were still in departments’ baselines, had to be recalled to the provincial fiscus for
reallocation to other priority areas, as these allocations would no longer be required for Soccer
World Cup purposes post 2010. Therefore, amounts of R172.513 million, R181.139 million and
R193.196 million over the 2010/11 MTEF are returned to the provincial revenue fund for
reallocation. These amounts are mainly from the Department of Co-operative Governance and
Traditional Affairs, who funded the construction of stadia for the World Cup in five districts.
7 Robert W Sarnoff

12
2 0 1 0 / 1 1 B U D G E T S P E E C H
Additional Allocations from the Equitable Share
The province receives some additional allocations from the equitable share over the 2010/11
MTEF.
However, most of the additional funding is specifically ear-marked for wage related costs, as can
be seen in Table 2 below.
Table 2 Provision for National Priorities
(R thousands) 2010/11 2011/12 2012/13
Policy Priorities funded through the Equitable Share
Inflationary Adjustments 2 118 108 2 262 733 2 408 177
Higher than anticipated wage settlement 1 173 546 1 310 567 1 448 912
Education OSD 651 970 655 283 658 597
Health OSD 292 592 296 883 300 668
Provincial Treasury 5 000 5 000 5 000
To strengthen municipal support units 5 000 5 000 5 000
Total 2 123 108 2 267 733 2 413 177
As indicated in the table above amounts of R2.123 billion, R2.268 billion and R2.413 billion are
added to the provincial equitable share over the MTEF period. These amounts will finance the
following:
l The carry-through costs of the higher than anticipated 2009 wage agreement (11.5%
instead of the budgeted 5.5%)
l The implementation of the OSD for educators
l The implementation of the OSD for health practitioners
l Strengthening of the municipal support unit in Provincial Treasury.
It is important for this House to note that these additional allocations are still not sufficient to
cover the full costs of the wage agreement and the implementation of various OSDs. According
to our estimates there is a R1.1 billion shortfall for those two expenditure areas, and if not
fully funded in future, the shortfall will carry-through the 2010/11 MTEF, with serious budgetary
implications.
Besides the amounts mentioned above the province also receives a fairly small increase in its
equitable share allocation due to various updates of the data that informs the equitable share
formula. The bulk of this is allocated to financing some provincial priorities, which I will discuss
later.
Conditional Grants
Conditional grant funding shows strong growth over the 2010/11 MTEF increasing by R2.158
billion, R2.301 billion and R3.405 billion. It should be noted that the amounts discussed here are
included in the allocations per vote in Table 1.
13
2 0 1 0 / 1 1 B U D G E T S P E E C H
The province receives four new conditional grants in the 2010/11 MTEF, these being:
l the Technical School Recapitalisation grant to improve conditions at technical schools and
modernise them to meet acceptable standards
l the FET College Sector grant (which was previously equitable share funded), to commence
planning for the eventual shift of these colleges to the newly established national Department
of Higher Education and Training
l the Expanded Public Works Programme grant for the Social Sector, to subsidise non-profit
organisations working in home community based care programmes for the Departments of
Health and Social Development
l the Housing Disaster Relief grant, to rehabilitate community settlements that were affected
by severe storms and flooding during November and December 2009.
Most of the existing conditional grants will receive an inflationary increase only in the 2012/13
financial year, with the following exceptions:
l The Infrastructure Grant to Provinces allocated to Education, Health and Transport sees a
decrease of R2.136 million in 2010/11 due to a technical adjustment made by National
Treasury, and increases in 2011/12 and 2012/13 of R17.265 million and R285.696 million in
2012/13, respectively. R52.954 million of the 2012/13 additional funding is earmarked
specifically for the improvement of school infrastructure.
l The Comprehensive HIV and AIDS grant receives substantial additional funding over the
2010/11 MTEF as follows: R485.729 million in 2010/11, R787.325 million in 2011/12 and
R1.151 billion in 2012/13. This is added to support government's commitment to addressing
the HIV and AIDS pandemic. In support of this, the CD4 count threshold for TB sufferers and
pregnant women moves from 200 to 350, and triple therapy is provided to all children born
with HIV and AIDS.
l The Public Transport Operations grant has become a conditional grant from 2009/10. The
allocation in 2009/10 only provided funding for 2009/10 at that stage. The conditional grant
allocation now provides funding for the entire 2010/11 MTEF as follows: R714.587 million in
2010/11, R773.473 million in 2011/12 and R815.611 million in 2012/13.
Provincial Priorities funded
As a result of the provincial overdraft Cabinet agreed to allocate only funding to those provincial
priorities deemed essential and to rather focus any additional funding received on ensuring that
the provincial overdraft is managed downward. Therefore, the additional equitable share allocation
as a result of data updates which I referred to earlier, was used to manage the provincial bank
overdraft downward. In addition the 2010 funding recalled from the departments post 2010 was
also used for this purpose. The following provincial priorities, amounting to R328.169 million,
R330.351 million and R355.984 million over the MTEF received additional funding:
l R235 million being a provision for the payment of interest on the overdraft
l The function shift to all departments for the management of ill health of personnel (Policy on
Incapacity Leave and Ill Health Retirement)
l Carry-through costs of the 2009/10 Adjustments Estimate, i.e. Statutory increases for MPLs
l Implementation of the job evaluation review for the Provincial Legislature
l Municipal support programmes
l The provincialisation of community libraries.
14
2 0 1 0 / 1 1 B U D G E T S P E E C H
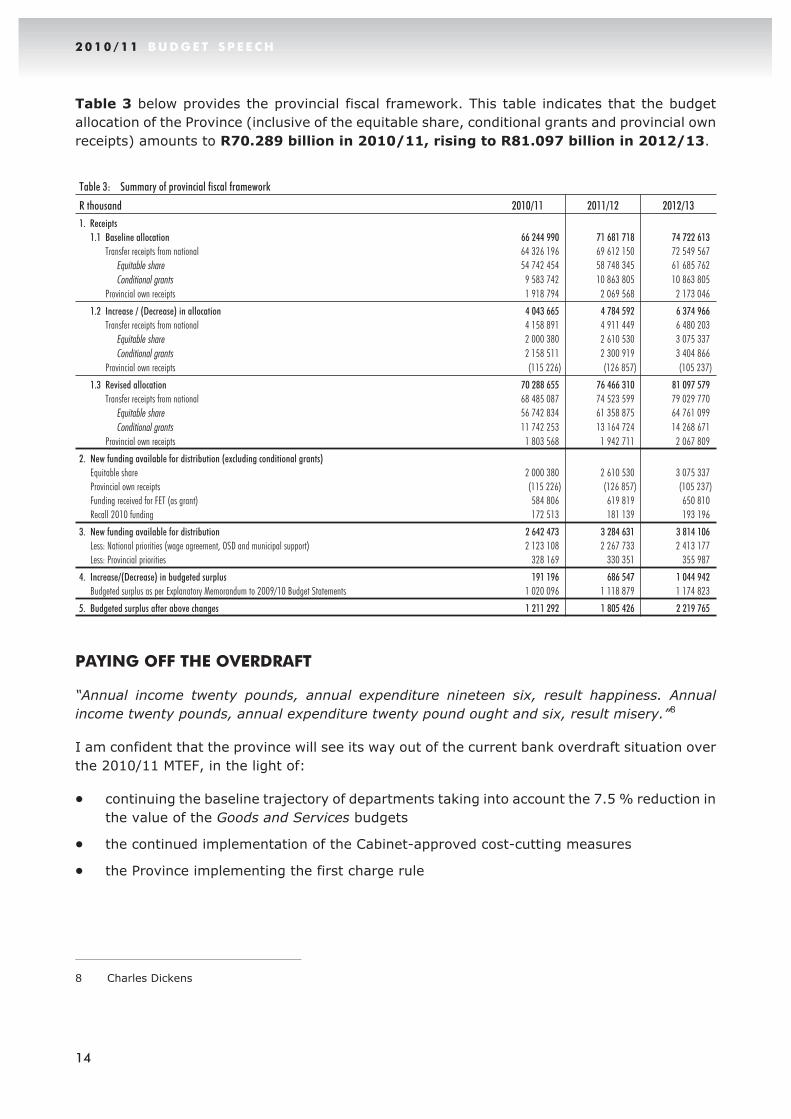
Table 3 below provides the provincial fiscal framework. This table indicates that the budget
allocation of the Province (inclusive of the equitable share, conditional grants and provincial own
receipts) amounts to R70.289 billion in 2010/11, rising to R81.097 billion in 2012/13.
Table 3: Summary of provincial fiscal framework
R thousand 2010/11 2011/12 2012/13
1. Receipts
1.1 Baseline allocation 66 244 990 71 681 718 74 722 613
Transfer receipts from national 64 326 196 69 612 150 72 549 567
Equitable share 54 742 454 58 748 345 61 685 762
Conditional grants 9 583 742 10 863 805 10 863 805
Provincial own receipts 1 918 794 2 069 568 2 173 046
1.2 Increase / (Decrease) in allocation 4 043 665 4 784 592 6 374 966
Transfer receipts from national 4 158 891 4 911 449 6 480 203
Equitable share 2 000 380 2 610 530 3 075 337
Conditional grants 2 158 511 2 300 919 3 404 866
Provincial own receipts (115 226) (126 857) (105 237)
1.3 Revised allocation 70 288 655 76 466 310 81 097 579
Transfer receipts from national 68 485 087 74 523 599 79 029 770
Equitable share 56 742 834 61 358 875 64 761 099
Conditional grants 11 742 253 13 164 724 14 268 671
Provincial own receipts 1 803 568 1 942 711 2 067 809
2. New funding available for distribution (excluding conditional grants)
Equitable share 2 000 380 2 610 530 3 075 337
Provincial own receipts (115 226) (126 857) (105 237)
Funding received for FET (as grant) 584 806 619 819 650 810
Recall 2010 funding 172 513 181 139 193 196
3. New funding available for distribution 2 642 473 3 284 631 3 814 106
Less: National priorities (wage agreement, OSD and municipal support) 2 123 108 2 267 733 2 413 177
Less: Provincial priorities 328 169 330 351 355 987
4. Increase/(Decrease) in budgeted surplus 191 196 686 547 1 044 942
Budgeted surplus as per Explanatory Memorandum to 2009/10 Budget Statements 1 020 096 1 118 879 1 174 823
5. Budgeted surplus after above changes 1 211 292 1 805 426 2 219 765
PAYING OFF THE OVERDRAFT
“Annual income twenty pounds, annual expenditure nineteen six, result happiness. Annual
income twenty pounds, annual expenditure twenty pound ought and six, result misery.”8
I am confident that the province will see its way out of the current bank overdraft situation over
the 2010/11 MTEF, in the light of:
l continuing the baseline trajectory of departments taking into account the 7.5 % reduction in
the value of the Goods and Services budgets
l the continued implementation of the Cabinet-approved cost-cutting measures
l the Province implementing the first charge rule
8 Charles Dickens
15
2 0 1 0 / 1 1 B U D G E T S P E E C H
7.5% Reduction
The House will recall that the Province began budgeting for a surplus from the 2009/10 financial
year; and that the source of this surplus was the implementation of the 7.5% cut in departments'
Goods and Services budgets. The aim was to repay the provincial overdraft over three years. The
implementation of the various OSDs and the higher than anticipated 2009 wage agreement
resulted in the Province projecting to not achieve the desired surplus in 2009/10. This therefore
necessitates that the province continues to budget for a surplus. To ensure that future growth
and service delivery are not continuously hampered by rises in the bank overdraft and the
associated interest costs, the MTEF allows for a reduction in the provincial bank overdraft which
not only costs us money, but we also lose income.
The surplus then consists of keeping the departments' budgets at the reduced amounts (i.e. after
the 7.5% cut in the value of the Goods and Services budgets), as well as only allocating a portion
of the amount that the Province receives due to the data updates of the equitable share formula,
to provincial priorities. In a nutshell: every cent we save will go into paying back our overdraft.
Table 3 above indicates that the surplus budgeted over the 2009/10 MTEF increases by the
amount that the Province receives, but does not allocate for spending to the departments.
Therefore the budgeted surplus of the province increases from R1.211 billion in 2010/11 to
R1.805 billion in 2011/12 and to R2.220 billion in 2012/13. This should be sufficient to pay
off the provincial overdraft over the 2010/11 MTEF, as long as the Province is not
again affected by higher than budgeted wage agreements. The provincial and national
fiscus has been placed under immense pressure as a result of the 2009 wage agreement. As
Minister Ghordan announced in his speech on 17 February 2010, it will be necessary to moderate
salary increases going forward to ensure that funds are also available for growth in public
service employment and so that spending on service delivery is not compromised.
Cost-Cutting Measures
When tabling the 2009/10 Adjustments Budget, I indicated to this House certain cost-cutting
measures to ensure that the Province returns to a healthy financial position. The focus of these
cost cutting measures is for the Province to do more with less. It should be noted that these
measures were not only implemented for the duration of the 2009/10 financial year, but will
remain in place at least until the provincial overdraft has been fully repaid. Please allow
me to repeat these measures:
l Freezing of all posts (in exceptional circumstances, the Executive Authority can approve the
filling of essential/critical posts - with a report being sent to the Office of the Premier and the
Provincial Treasury)
l No furniture or equipment to be bought (excluding those that are funded by conditional
grants)
l Essential training to be done in-house (exceptions to be approved by the HODs)
l Overseas trips to be rationalised
l Business class travel only for MECs and HODs (and the Speaker and MPLs as decided by the
Legislature)
l Car hire bookings - class of vehicle to be lowered
16
2 0 1 0 / 1 1 B U D G E T S P E E C H
l Catering for meetings to be stopped
l Kilometre controls be implemented on travelling (1750 kilometers per month per official
unless there are exceptional circumstances - the exceptions should be approved by the
HODs)
l Officials to travel together unless absolutely unavoidable
l Only essential trips to be undertaken
l Meetings, strategic planning sessions and workshops to be held in departments' offices
instead of private venues
l Air travel to be limited to important meetings with only one official to attend on behalf of the
department, unless otherwise required
l No team building exercises or year-end/Christmas functions (only permitted if paid for by
the staff themselves)
l Cut down on unnecessary overnight accommodation. Staff to sleep over only if the total
distance to and from the destination is more than 500 kilometers
l Where there are one-day meetings in other provinces, officials must travel there and back
on the same day (where possible)
l No performance bonuses to be paid from 2010/11
l No promotional items to be purchased (t-shirts, caps, bags, etc)
l No leave conversion payments to be made (leave to be taken)
l Strict control of overtime
l Re-evaluate the hosting of provincial events (including budget dinners)
l Implement transversal cell phone policy to curtail costs
l Spending on travel to be investigated with a view to reducing costs - including hotel and
flight bookings
l Introduce bulk media buying
l Review policy on subsidised vehicles for officials
l Fraud and corruption in the public service to be eliminated
l Supply Chain Management to be strengthened to eliminate collusion between suppliers and
government officials.
We point out that most of these cost cutting measures are simply elements of good
governance and should stay in place even when the provincial overdraft has been paid
off. “Good government is the outcome of private virtue” – let us remind ourselves of this.9
9 John Jay Chapman
17
2 0 1 0 / 1 1 B U D G E T S P E E C H
I am pleased to report that the vast majority of departments are enthusiastically implementing
our cost cutting measures and some are even going beyond what is required. This is highly
appreciated and with that kind of support we will turn the corner - I have no doubt about that.
Implementation of the First Charge Rule
In addition to the 7.5% reduction mentioned earlier the Province implemented the first charge
rule (in terms of Section 34(2) of the PFMA) for the first time during the 2009/10 Adjustments
Estimate. This was done as some departments’ over-expenditure in prior years was of such a
level that the 7.5% reduction was insufficient for them to repay their over-expenditure amounts.
This meant that the affected departments, namely Education, Health and Transport saw a further
reduction in their budgets available for spending, in order to fully pay back the over-expenditure
they had incurred in 2008/09. Therefore these departments’ budgets available for spending was
reduced in 2009/10 by R111.466 million for Education, R758 million for Health and R185.492
million for Transport. Important to note and understand, though, is that these amounts were not
removed from their budgets but were allocated to Unauthorised Expenditure to allow the
necessary accounting treatment of these amounts by Provincial Treasury. These amounts were
then the first installment of the first charge rule.
In 2010/11, Education and Transport are affected by the second installment of the first charge
rule, with their budgets available for spending reducing by R106.039 million and R185.466
million, respectively. Health is not yet being charged the second installment, to allow the Joint
Task Team, comprising officials from Provincial Treasury and the Department of Health, more
time to implement their turnaround strategy.
Furthermore, the Standing Committee on Public Accounts (SCOPA) approved several amounts to
be authorised and these will be included in the next Authorisation of Unauthorised Expenditure
Bill, to be tabled in the Provincial Legislature. However, several amounts were not approved for
authorisation, and therefore become a first charge against those votes. The votes affected are:
l Education - R27.563 million to be implemented as a first charge in 2010/11
l Human Settlements - R18.606 million to be implemented as a first charge in two equal
installments of R9.303 million in 2010/11 and 2011/12
l The Royal Household - R11.299 million to be implemented as a first charge in three equal
installments of R3.766 million in 2010/11, 2011/12 and 2012/13
l Transport - R200 000 to be implemented as a first charge in 2010/11.
PROCUREMENT REFORMS AND FIGHTING CORRUPTION
It is clear that government does not have any room to manoeuvre. Spending on budget is the
ONLY option.
Besides the cost cutting measures adopted by Cabinet there is still more wasteful expenditure we
need to cut. Our procurement system remains a cause for concern. As Minister Gordhan put it: “A
major site of both wastage and inefficiency is in our procurement system. Through a combination
of corrupt practices, inefficient procurement, poor planning and in some instances, collusion by the
private sector, we are not getting the kind of value from our purchases that our people deserve”.
18
2 0 1 0 / 1 1 B U D G E T S P E E C H
Our provincial cost cutting measures directed all departments to take immediate steps to
eradicate fraud and corruption, which continues to be a drain on the provincial fiscus.
We also appeal to our business people to give government value for money. Inflating prices just
because it is government can never be justified. Do not collude with corrupt officials - it is
stealing from the poorest and robbing others of service delivery. We need to change the mindset
from “making a killing” to “making a living” if we want all our people to benefit.
The days of giving work to companies who cannot deliver a service and only act as intermediaries
are numbered. So are the days of civil servants who use the state to enrich themselves. A
number of arrests have already taken place and more are to come.
The purpose of South Africa’s policy of Black Economic Empowerment (BEE) has never been to
enrich only a few people. It is essentially a growth strategy, targeting the South African
economy's weakest point: inequality. We have to broaden the base that is associated with
growth, development and enterprise development, and not merely redistribute existing wealth.
Empowerment is about building capabilities so that people can contribute to economic
development and improve their lives and livelihoods, not about extracting large economic rents
from government.
Supply Chain Management
The Province is developing a system that will eliminate fraud in our supply chain management
and give us value for money. Treasury, together with the Office of the Premier, are finalising this
system.
The Premier emphasised in his State of the Province Address, “Government is investigating a
shared services model to ensure efficient management of tenders and regular price
comparison to eliminate the possibility of inflated prices.”
Prices are mainly inflated when government departments procure goods and services through a
“request-for-quotations” instead of a competitive tender process.
The new system will provide all departments with the most current prices of all items. The price
list will be updated on a daily basis and officials who procure goods and services above
market-clearing price will have to explain why.
It will work like the Reuters system which publishes going prices of all commodities traded in the
market place and will block the issuing of orders if the price is above the listed price for that item.
It will also allow service providers to bid against one another on the strength of competitive
prices to supply particular goods or services.
Before the system is introduced government will do a spend-analysis province wide. The analysis
will indicate what are the most frequently procured goods and services; what is the annual
expenditure on these items across government; and who the main suppliers are, etc.
It will provide a direct link to existing general period contracts already negotiated by National
Treasury (in general period contract prices are almost always cheaper). An aspect of the system
also entails the re-negotiation of all existing provincial contracts to ensure value for money.
19
2 0 1 0 / 1 1 B U D G E T S P E E C H
We envisage that the system will be finalised during the 2010/11 financial year. It is about time
that government becomes a price maker - not a price taker - given the size of its procurement
expenditure.
CAPITAL EXPENDITURE
The province has set aside R11.093 billion in 2010/11 growing to R12.9 billion in 2012/13 for
infrastructure development within the various departments. This increase in capital expenditure
recognizes the positive effect infrastructure investments have on employment creation and
economic growth.
Since 1994, the Province has embarked on the eradication of infrastructure backlogs to promote
equity for the citizens and improve access to public services throughout the Province. This
manifested itself mainly in the construction of social infrastructure such as schools, clinics and
roads. Most of the structures built since 1994, are now due for major maintenance and
rehabilitation. For the desired life of facilities to be reached, structures must continually be
maintained. The general consensus among experts is that an amount that is equal to 4% of the
replacement value of an asset is adequate to keep the structure in a “new” condition, with a
scheduled maintenance programme.
About 49 per cent of the infrastructure allocation will be spent on maintenance of
infrastructure. Maintaining the provincial assets will prolong the lifespan of the asset base.
Where possible, departments are also urged to utilise the Expanded Public Works Programme
(EPWP) guidelines to increase the labour absorption in their infrastructure maintenance
programmes. This will allow the province to access the EPWP incentive grant.
The EPWP Incentive grant has been increased from R84 million in the current year to
R169.470 million for 2010/11. Again there is no cap on the amount that may be spent and
provinces may apply for more EPWP funding. This is a great initiative that enables departments
to create job opportunities, while delivering services at the same time. Given the high
unemployment rate labour intensive projects must be at the centre of all our initiatives.
In an effort to help departments with infrastructure development, Provincial Treasury co-ordinates
the Infrastructure Delivery Improvement Programme (IDIP), with the departments of
Education, Health on the client side and the Department of Public Works, as an agent. The client
departments have streamlined their infrastructure planning capability considerably, while the
management of their respective projects has also improved. Due to the visible success of the
IDIP programme, it has been agreed to extend IDIP beyond the initial three-year time horizon.
National Treasury will continue to fund the implementation of the programme. However,
provinces have been requested to fund the first two months of the 2010/11 financial year until
National Treasury has finalised the procurement model.
THANK YOU
Several role players have contributed in various ways to ensure that we are able to table the
2010/11 budget today. I take this opportunity to express my gratitude to the Premier, Dr. Z.L.
Mkhize and the entire Cabinet for the leadership and support demonstrated in preparing the
Provincial Recovery Plan, and the 2010/11 MTEF budget. We are also indebted to Minister Pravin
20
2 0 1 0 / 1 1 B U D G E T S P E E C H
Gordhan for his wisdom and guidance in preparing the MTEF budget. The Team Finance has
provided sound technical advice during this process and I thank them sincerely.
The members of the Ministers’ Committee on the Budget (MinComBud) have worked tirelessly
alongside me, in crafting the budget which I am tabling today. We engaged in lively debate on
many complicated issues along the way, which has added to the value of the documents I am
presenting today.
To the Chairperson of the Finance Portfolio Committee, Ms Belinda Scott and the rest of the
Committee, we look forward to continued robust engagements with you.
I would also like to thank the officials in my department, ably led by S’miso Magagula, for
ensuring that the budget documentation is of excellent quality.
CONCLUSION
It is now my honour to table the Appropriation Bill, 2010 for the Province of KwaZulu-Natal for
consideration in this House, together with the Estimates of Provincial Expenditure (previously
known as the Budget Statements). I call upon the Members of the Legislature to robustly debate
this Appropriation Bill.
To my fellow MECs, “Our incomes are like our shoes; if too small, they gall and pinch us; but if too
large, they cause us to stumble and trip.”10 May your incomes in the new financial year be like a
nice pair of shoes, not too small, but large enough to slip into and be comfortable.
10 John Locke (philosopher)

21
2 0 1 0 / 1 1 B U D G E T S P E E C H
NOTES

22
2 0 1 0 / 1 1 B U D G E T S P E E C H
NOTES
Recommended