CEO ConferenceBTG Pactual
March 09, 2010
Disclaimer
This presentation may contain forward-looking statements. Such forward-looking statements are
and will be subject to many risks and uncertainties relating to factors that are beyond the
Direcional’s ability to control or estimate precisely, such as future market conditions,
competitive environment, currency and inflation fluctuations, changes in governmental and
regulatory policies and other factors relating to the operations of Direcional, which may cause
actual future results of Direcional to differ materially from those expressed or implied in such
forward-looking statements
You are cautioned not to place undue reliance on these forward-looking statements, which
speak only as of the date of this presentation. Such forward-looking statements shall not be
construed as guarantee of future performance. Direcional does not undertake to publicly review
or update these forward-looking statements in view of events or circumstances occurring after
the date of this presentation
This presentation does not constitute an offer, or invitation, or solicitation of an offer, to
subscribe for or purchase any securities. Neither this presentation nor anything contained
herein shall form the basis of any contract or commitment whatsoever
This presentation and its contents are proprietary information and may not be reproduced or
otherwise disseminated in whole or in part without Direcional’s prior written consent.
Agenda
Overview
Company Strengths
“Minha Casa, Minha Vida” Housing Program
Operating and Financial Highlights
Appendix

Company Overview
Background
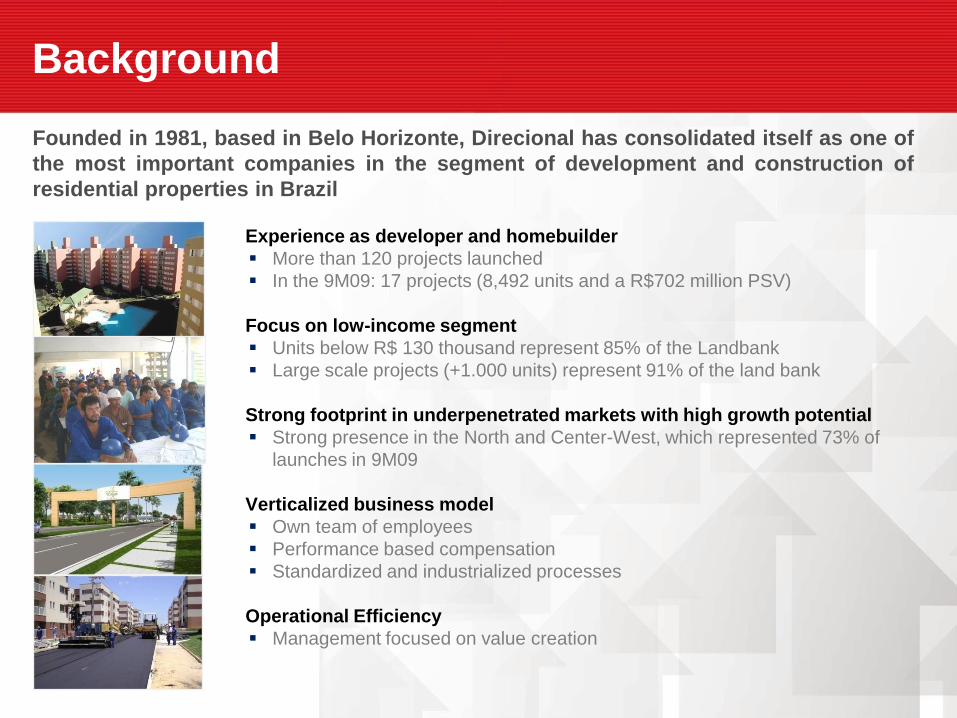
Founded in 1981, based in Belo Horizonte, Direcional has consolidated itself as one of
the most important companies in the segment of development and construction of
residential properties in Brazil
Experience as developer and homebuilder
More than 120 projects launched
In the 9M09: 17 projects (8,492 units and a R$702 million PSV)
Focus on low-income segment
Units below R$ 130 thousand represent 85% of the Landbank
Large scale projects (+1.000 units) represent 91% of the land bank
Strong footprint in underpenetrated markets with high growth potential
Strong presence in the North and Center-West, which represented 73% of
launches in 9M09
Verticalized business model
Own team of employees
Performance based compensation
Standardized and industrialized processes
Operational Efficiency
Management focused on value creation
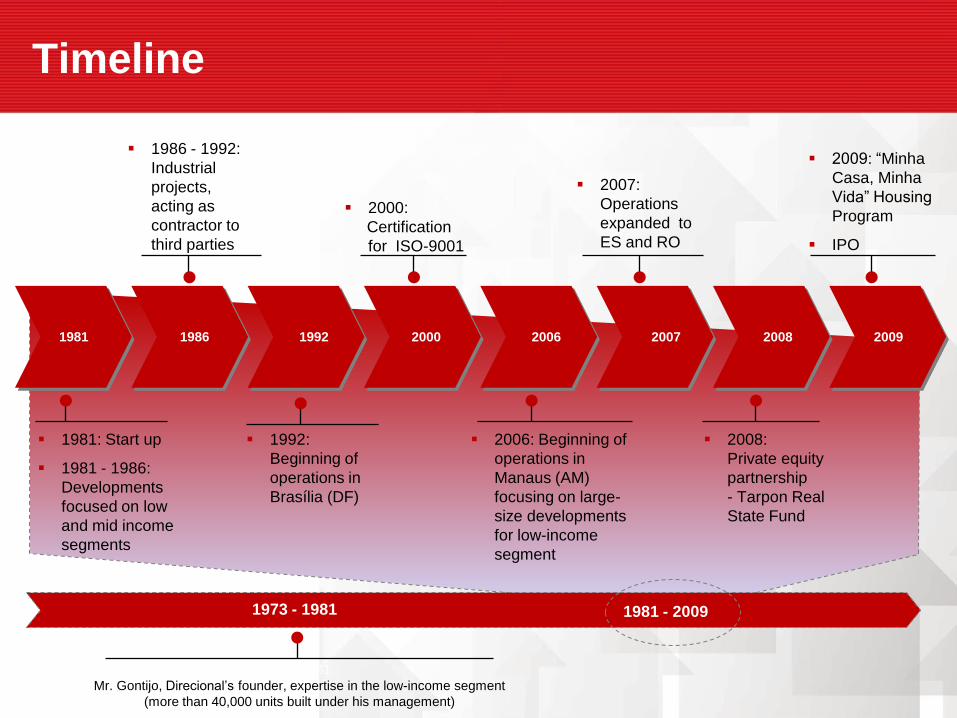
Timeline
1973 - 1981
1973 -1981:
Mr. Gontijo, Direcional’s founder, expertise in the low-income segment
(more than 40,000 units built under his management)
1981 - 2009
2000 2006 2007 200819921981 1986 2009
1986 - 1992:
Industrial
projects,
acting as
contractor to
third parties
2000:
Certification
for ISO-9001
2007:
Operations
expanded to
ES and RO
2009: “Minha
Casa, Minha
Vida” Housing
Program
IPO
1992:
Beginning of
operations in
Brasília (DF)
1981: Start up
1981 - 1986:
Developments
focused on low
and mid income
segments
2006: Beginning of
operations in
Manaus (AM)
focusing on large-
size developments
for low-income
segment
2008:
Private equity
partnership
- Tarpon Real
State Fund
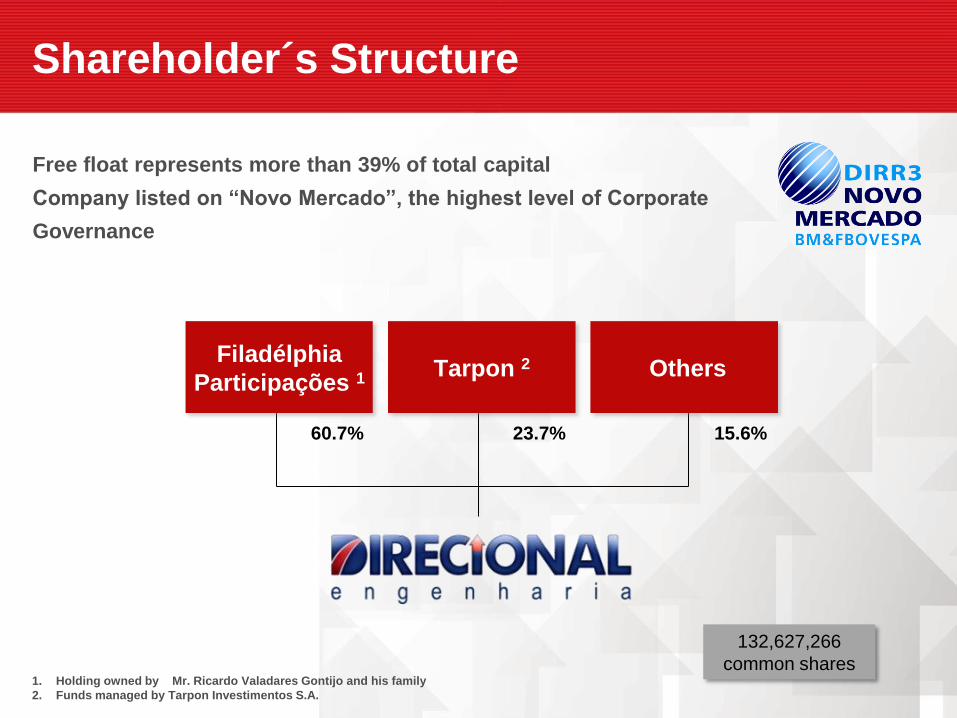
Shareholder´s Structure
60.7% 23.7% 15.6%
Free float represents more than 39% of total capital
Company listed on “Novo Mercado”, the highest level of Corporate
Governance
1. Holding owned by Mr. Ricardo Valadares Gontijo and his family
2. Funds managed by Tarpon Investimentos S.A.
Filadélphia
Participações 1 Tarpon 2 Others
132,627,266
common shares
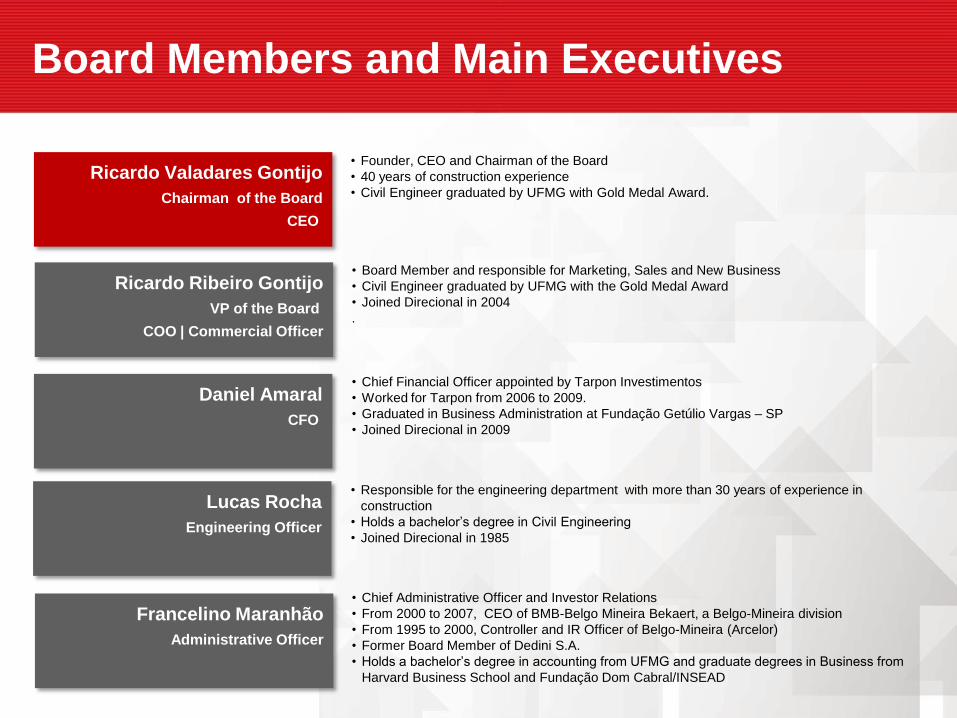
Board Members and Main Executives
Ricardo Valadares Gontijo
Chairman of the Board
CEO
Ricardo Ribeiro Gontijo
VP of the Board
COO | Commercial Officer
Francelino Maranhão
Administrative Officer
Daniel Amaral
CFO
Lucas Rocha
Engineering Officer
• Founder, CEO and Chairman of the Board
• 40 years of construction experience
• Civil Engineer graduated by UFMG with Gold Medal Award.
• Board Member and responsible for Marketing, Sales and New Business
• Civil Engineer graduated by UFMG with the Gold Medal Award
• Joined Direcional in 2004
.
• Chief Administrative Officer and Investor Relations
• From 2000 to 2007, CEO of BMB-Belgo Mineira Bekaert, a Belgo-Mineira division
• From 1995 to 2000, Controller and IR Officer of Belgo-Mineira (Arcelor)
• Former Board Member of Dedini S.A.
• Holds a bachelor’s degree in accounting from UFMG and graduate degrees in Business from
Harvard Business School and Fundação Dom Cabral/INSEAD
• Chief Financial Officer appointed by Tarpon Investimentos
• Worked for Tarpon from 2006 to 2009.
• Graduated in Business Administration at Fundação Getúlio Vargas – SP
• Joined Direcional in 2009
• Responsible for the engineering department with more than 30 years of experience in
construction
• Holds a bachelor’s degree in Civil Engineering
• Joined Direcional in 1985

Company Strengths
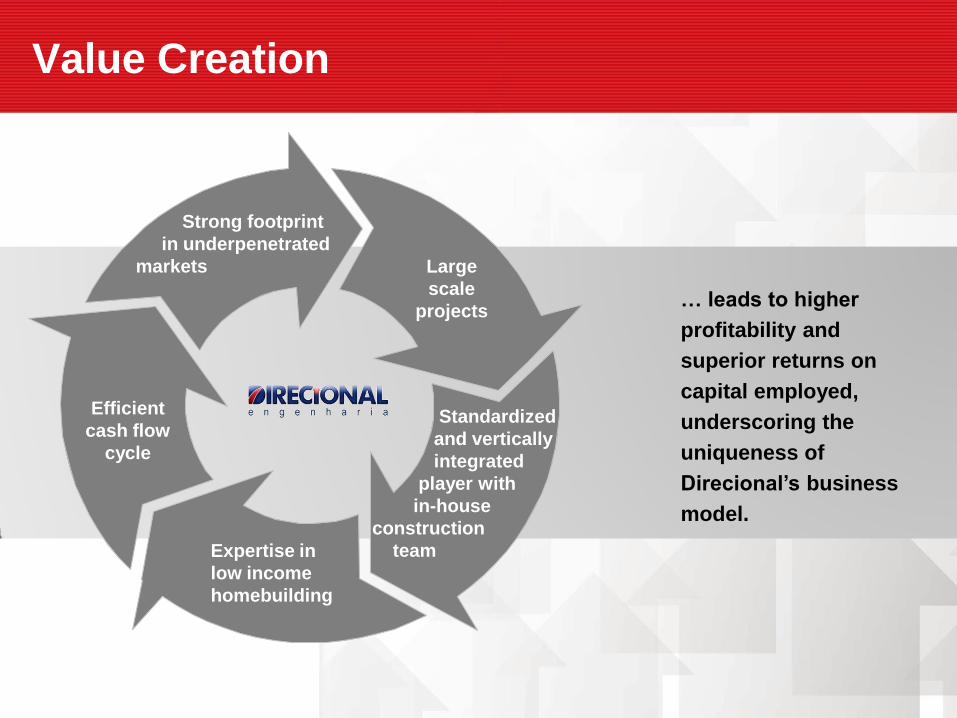
Value Creation
Efficient
cash flow
cycle
Strong footprint
in underpenetrated
markets
Expertise in
low income
homebuilding
Large
scale
projects
Standardized
and vertically
integrated
player with
in-house
construction
team
… leads to higher
profitability and
superior returns on
capital employed,
underscoring the
uniqueness of
Direcional’s business
model.
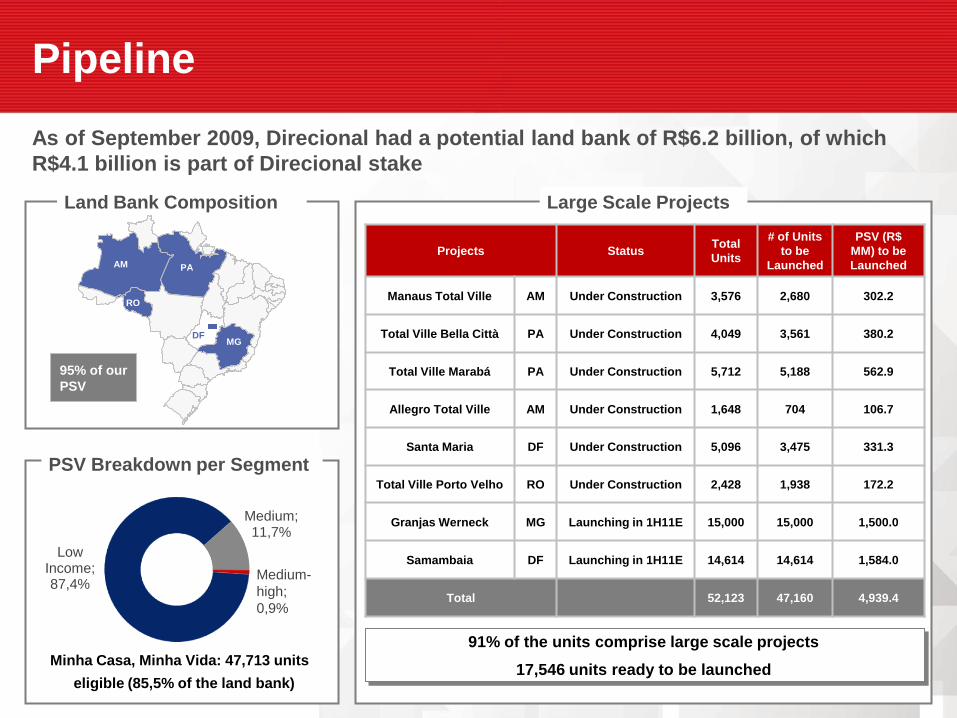
Pipeline
As of September 2009, Direcional had a potential land bank of R$6.2 billion, of which
R$4.1 billion is part of Direcional stake
Land Bank Composition Large Scale Projects
Projects StatusTotal
Units
# of Units
to be
Launched
PSV (R$
MM) to be
Launched
Manaus Total Ville AM Under Construction 3,576 2,680 302.2
Total Ville Bella Città PA Under Construction 4,049 3,561 380.2
Total Ville Marabá PA Under Construction 5,712 5,188 562.9
Allegro Total Ville AM Under Construction 1,648 704 106.7
Santa Maria DF Under Construction 5,096 3,475 331.3
Total Ville Porto Velho RO Under Construction 2,428 1,938 172.2
Granjas Werneck MG Launching in 1H11E 15,000 15,000 1,500.0
Samambaia DF Launching in 1H11E 14,614 14,614 1,584.0
Total 52,123 47,160 4,939.4
MGDF
PAAM
RO
95% of our
PSV
PSV Breakdown per Segment
Low Income; 87,4%
Medium; 11,7%
Medium-
high;
0,9%
Minha Casa, Minha Vida: 47,713 units
eligible (85,5% of the land bank)
91% of the units comprise large scale projects
17,546 units ready to be launched
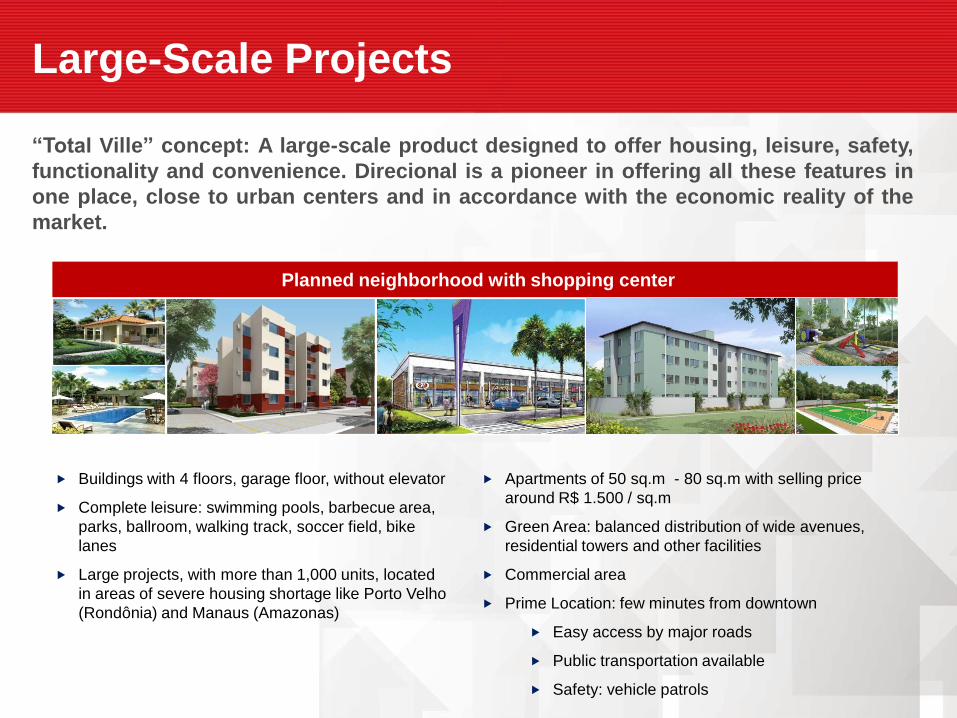
Large-Scale Projects
Buildings with 4 floors, garage floor, without elevator
Complete leisure: swimming pools, barbecue area,
parks, ballroom, walking track, soccer field, bike
lanes
Large projects, with more than 1,000 units, located
in areas of severe housing shortage like Porto Velho
(Rondônia) and Manaus (Amazonas)
Apartments of 50 sq.m - 80 sq.m with selling price
around R$ 1.500 / sq.m
Green Area: balanced distribution of wide avenues,
residential towers and other facilities
Commercial area
Prime Location: few minutes from downtown
Easy access by major roads
Public transportation available
Safety: vehicle patrols
Planned neighborhood with shopping center
“Total Ville” concept: A large-scale product designed to offer housing, leisure, safety,
functionality and convenience. Direcional is a pioneer in offering all these features in
one place, close to urban centers and in accordance with the economic reality of the
market.
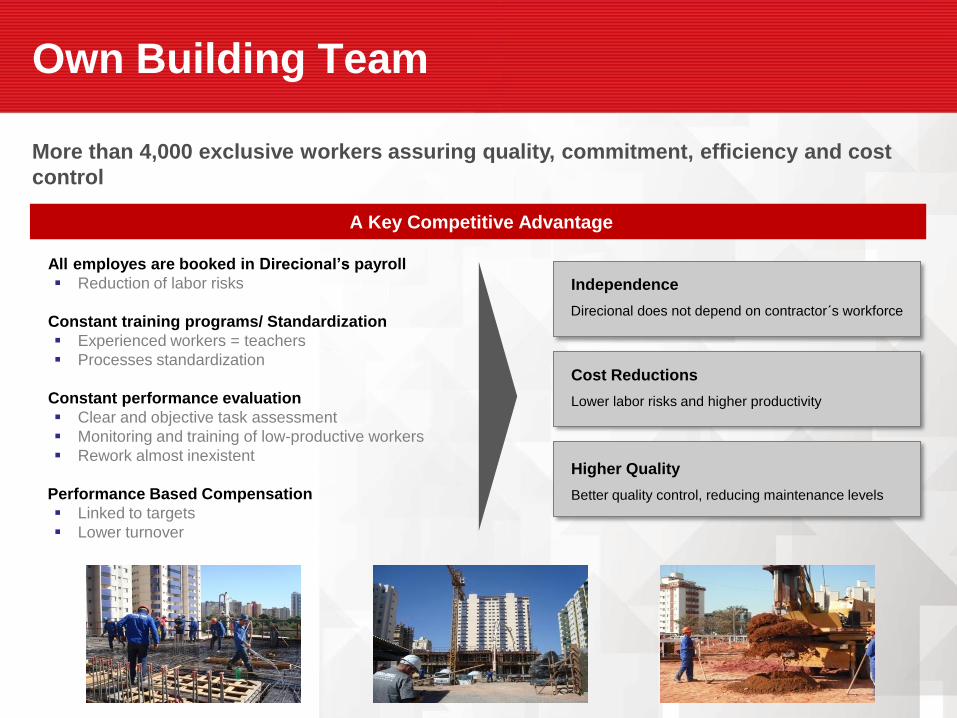
Own Building Team
More than 4,000 exclusive workers assuring quality, commitment, efficiency and cost
control
A Key Competitive Advantage
Independence
Direcional does not depend on contractor´s workforce
Cost Reductions
Lower labor risks and higher productivity
Higher Quality
Better quality control, reducing maintenance levels
All employes are booked in Direcional’s payroll
Reduction of labor risks
Constant training programs/ Standardization
Experienced workers = teachers
Processes standardization
Constant performance evaluation
Clear and objective task assessment
Monitoring and training of low-productive workers
Rework almost inexistent
Performance Based Compensation
Linked to targets
Lower turnover
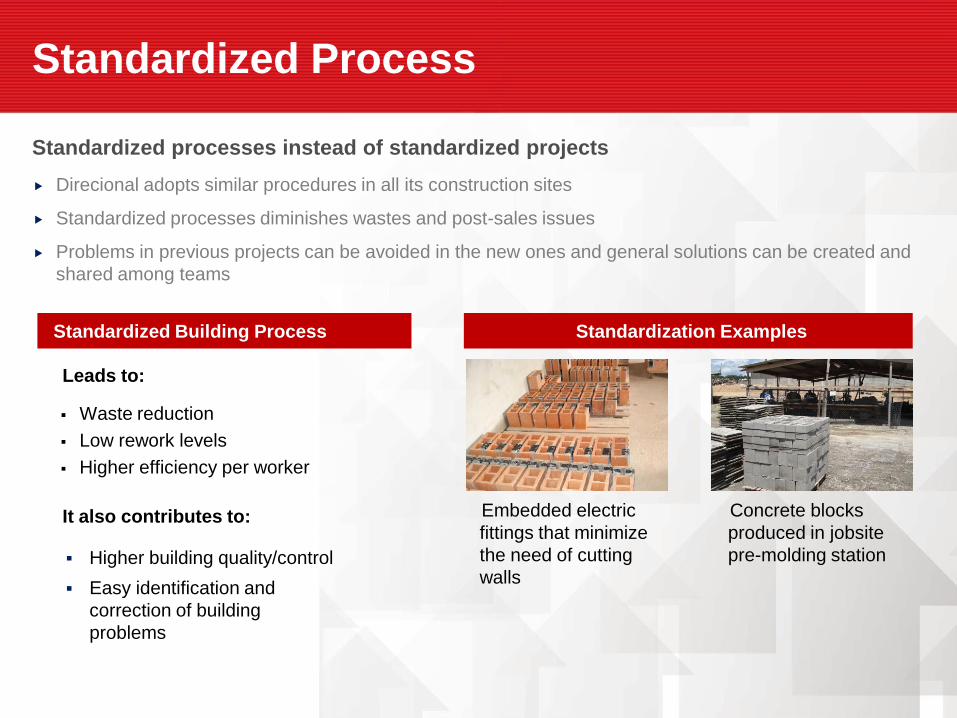
Standardized Process
Standardized Building Process
Leads to:
Waste reduction
Low rework levels
Higher efficiency per worker
It also contributes to:
Higher building quality/control
Easy identification and
correction of building
problems
Embedded electric
fittings that minimize
the need of cutting
walls
Standardization Examples
Concrete blocks
produced in jobsite
pre-molding station
Standardized processes instead of standardized projects
Direcional adopts similar procedures in all its construction sites
Standardized processes diminishes wastes and post-sales issues
Problems in previous projects can be avoided in the new ones and general solutions can be created and
shared among teams
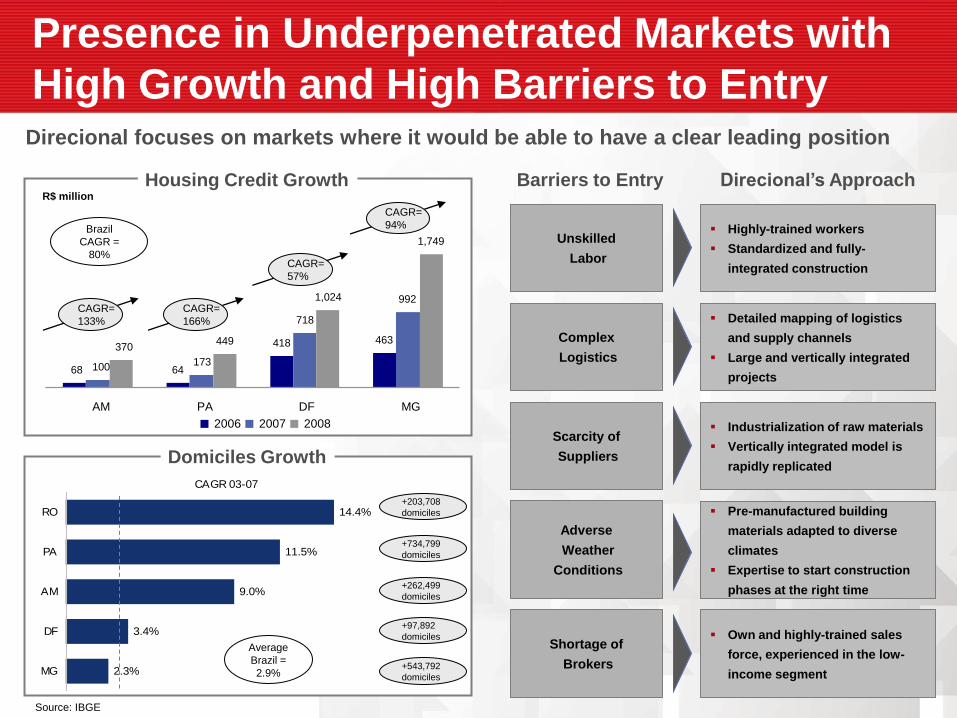
Presence in Underpenetrated Markets with
High Growth and High Barriers to EntryDirecional focuses on markets where it would be able to have a clear leading position
Source: IBGE
Barriers to Entry
Unskilled
Labor
Highly-trained workers
Standardized and fully-
integrated construction
Complex
Logistics
Detailed mapping of logistics
and supply channels
Large and vertically integrated
projects
Scarcity of
Suppliers
Industrialization of raw materials
Vertically integrated model is
rapidly replicated
Adverse
Weather
Conditions
Pre-manufactured building
materials adapted to diverse
climates
Expertise to start construction
phases at the right time
Shortage of
Brokers
Own and highly-trained sales
force, experienced in the low-
income segment
Direcional’s Approach
CAGR=
94%
Housing Credit GrowthR$ million
CAGR=
57%
CAGR=
133%
Brazil
CAGR =
80%
CAGR=
166%
68 64
418 463
100 173
718
992
370449
1,024
1,749
AM PA DF MG
2006 2007 2008
Average
Brazil =
2.9%
+203,708
domiciles
+734,799
domiciles
+262,499
domiciles
+97,892
domiciles
+543,792
domiciles
CAGR 03-07
14.4%
11.5%
9.0%
3.4%
2.3%MG
DF
AM
PA
RO
Domiciles Growth
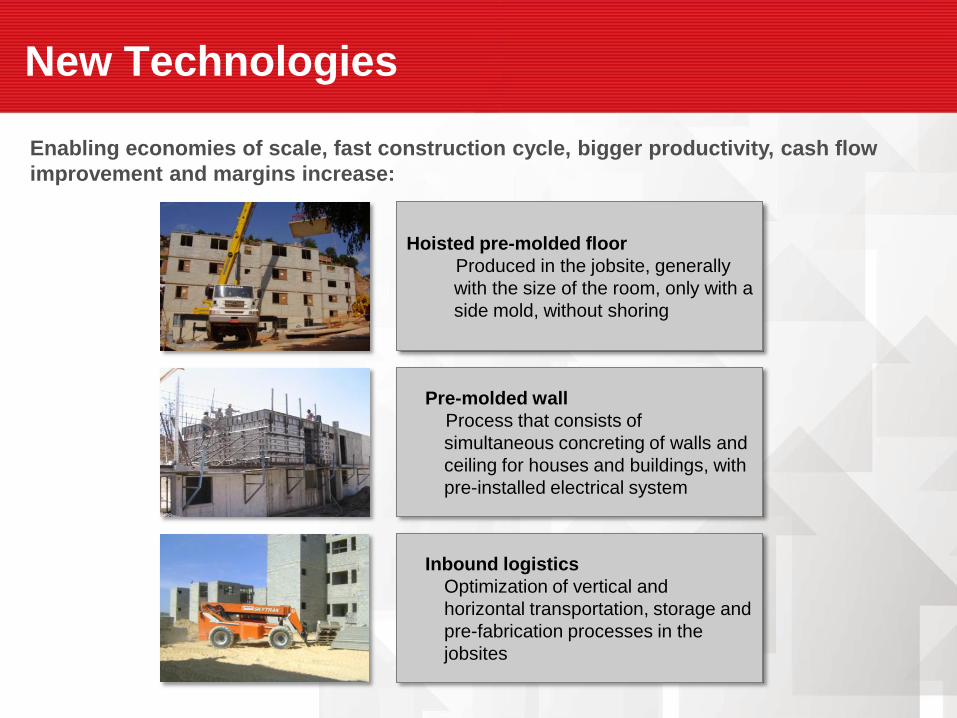
New Technologies
Enabling economies of scale, fast construction cycle, bigger productivity, cash flow
improvement and margins increase:
Hoisted pre-molded floor
Produced in the jobsite, generally
with the size of the room, only with a
side mold, without shoring
Pre-molded wall
Process that consists of
simultaneous concreting of walls and
ceiling for houses and buildings, with
pre-installed electrical system
Inbound logistics
Optimization of vertical and
horizontal transportation, storage and
pre-fabrication processes in the
jobsites
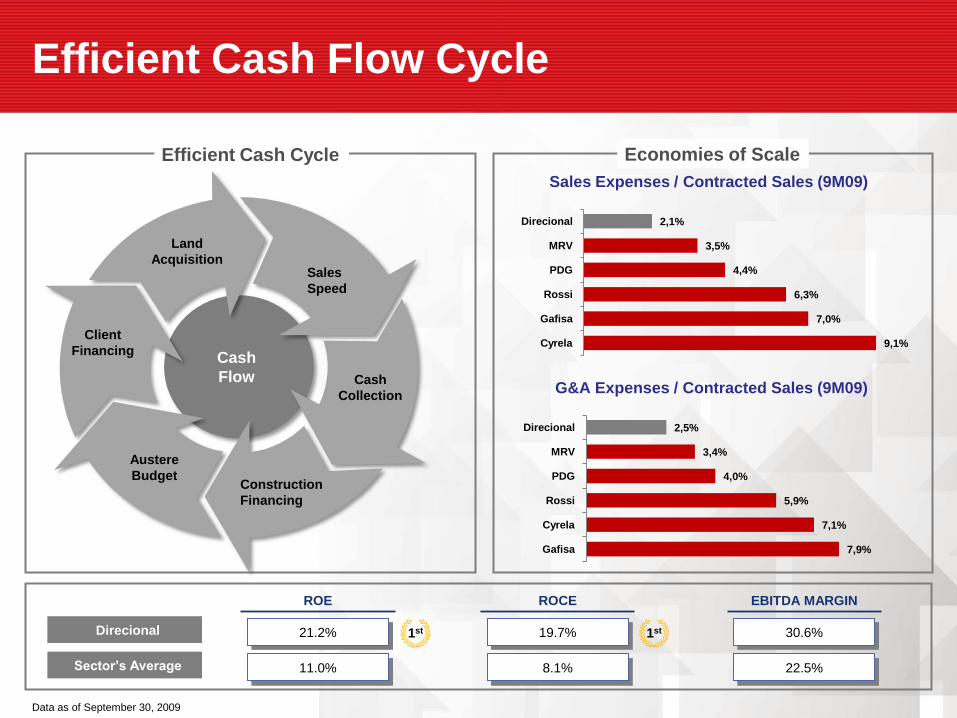
Efficient Cash Flow Cycle
Cash
Flow
Land
AcquisitionSales
Speed
Cash
Collection
Austere
Budget
Client
Financing
Construction
Financing
Efficient Cash Cycle Economies of Scale
Sales Expenses / Contracted Sales (9M09)
G&A Expenses / Contracted Sales (9M09)
Direcional
Sector’s Average
ROE
21.2%
11.0%
1st 19.7%
8.1%
ROCE
1st
Data as of September 30, 2009
2,1%
3,5%
4,4%
6,3%
7,0%
9,1%
Direcional
MRV
PDG
Rossi
Gafisa
Cyrela
2,5%
3,4%
4,0%
5,9%
7,1%
7,9%
Direcional
MRV
PDG
Rossi
Cyrela
Gafisa
30.6%
22.5%
EBITDA MARGIN

Minha Casa, Minha Vida
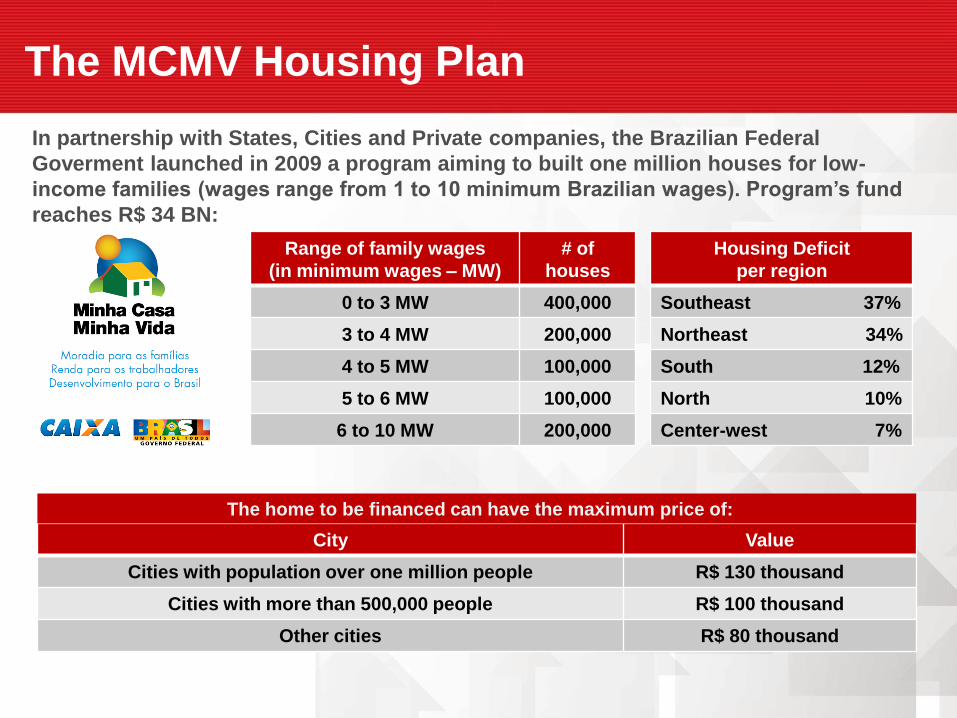
The MCMV Housing Plan
Range of family wages
(in minimum wages – MW)
# of
houses
0 to 3 MW 400,000
3 to 4 MW 200,000
4 to 5 MW 100,000
5 to 6 MW 100,000
6 to 10 MW 200,000
Housing Deficit
per region
Southeast 37%
Northeast 34%
South 12%
North 10%
Center-west 7%
City Value
Cities with population over one million people R$ 130 thousand
Cities with more than 500,000 people R$ 100 thousand
Other cities R$ 80 thousand
The home to be financed can have the maximum price of:
In partnership with States, Cities and Private companies, the Brazilian Federal
Goverment launched in 2009 a program aiming to built one million houses for low-
income families (wages range from 1 to 10 minimum Brazilian wages). Program’s fund
reaches R$ 34 BN:
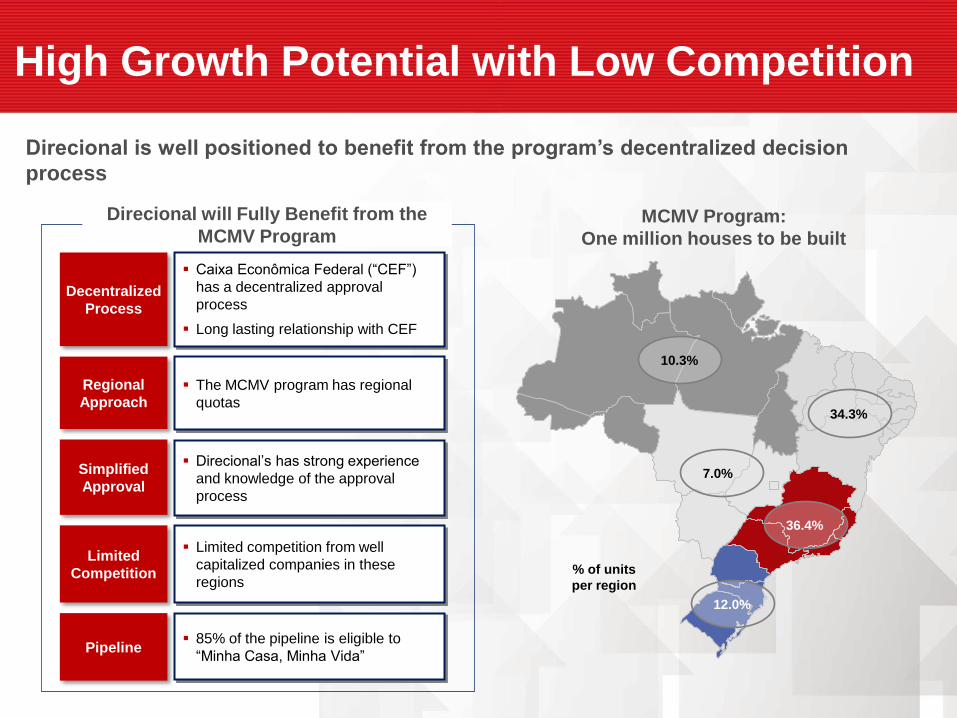
High Growth Potential with Low Competition
Direcional will Fully Benefit from the
MCMV Program
Direcional is well positioned to benefit from the program’s decentralized decision
process
10.3%
34.3%
36.4%
7.0%
12.0%
MCMV Program:
One million houses to be built
% of units
per region
Decentralized
Process
Regional
Approach
Simplified
Approval
Limited
Competition
Pipeline
Caixa Econômica Federal (“CEF”)
has a decentralized approval
process
Long lasting relationship with CEF
The MCMV program has regional
quotas
Direcional’s has strong experience
and knowledge of the approval
process
Limited competition from well
capitalized companies in these
regions
85% of the pipeline is eligible to
“Minha Casa, Minha Vida”
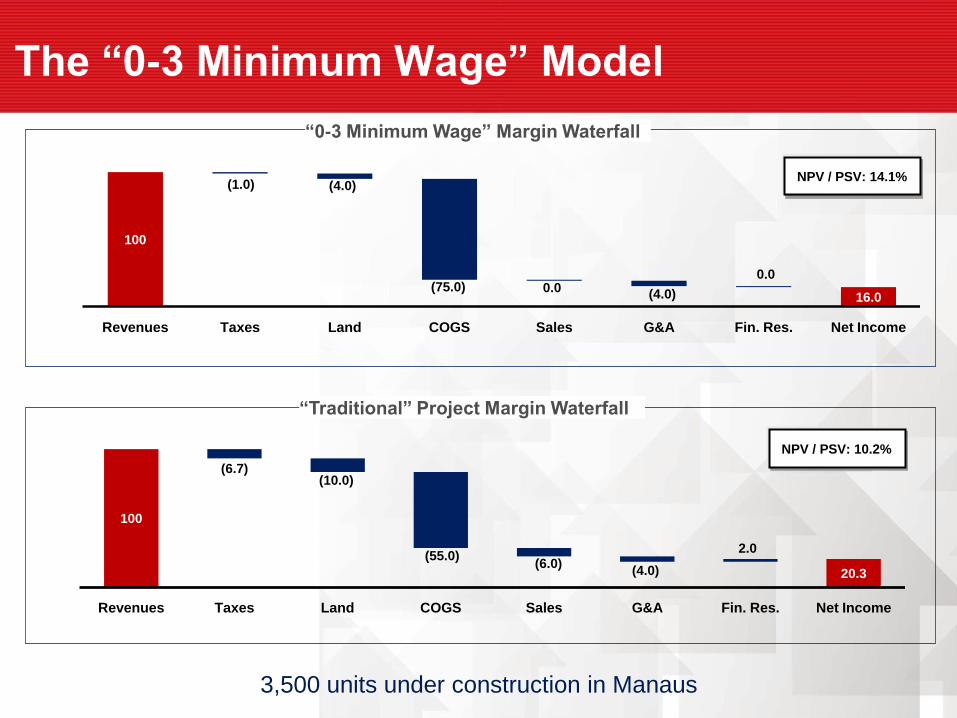
100
16.0
(1.0) (4.0)
(75.0) 0.0(4.0)
0.0
Revenues Taxes Land COGS Sales G&A Fin. Res. Net Income
The “0-3 Minimum Wage” Model
100
20.3
(6.7)(10.0)
(55.0)(6.0)
(4.0)
2.0
Revenues Taxes Land COGS Sales G&A Fin. Res. Net Income
“0-3 Minimum Wage” Margin Waterfall
“Traditional” Project Margin Waterfall
NPV / PSV: 14.1%
NPV / PSV: 10.2%
3,500 units under construction in Manaus
Operating and
Financial Highlights
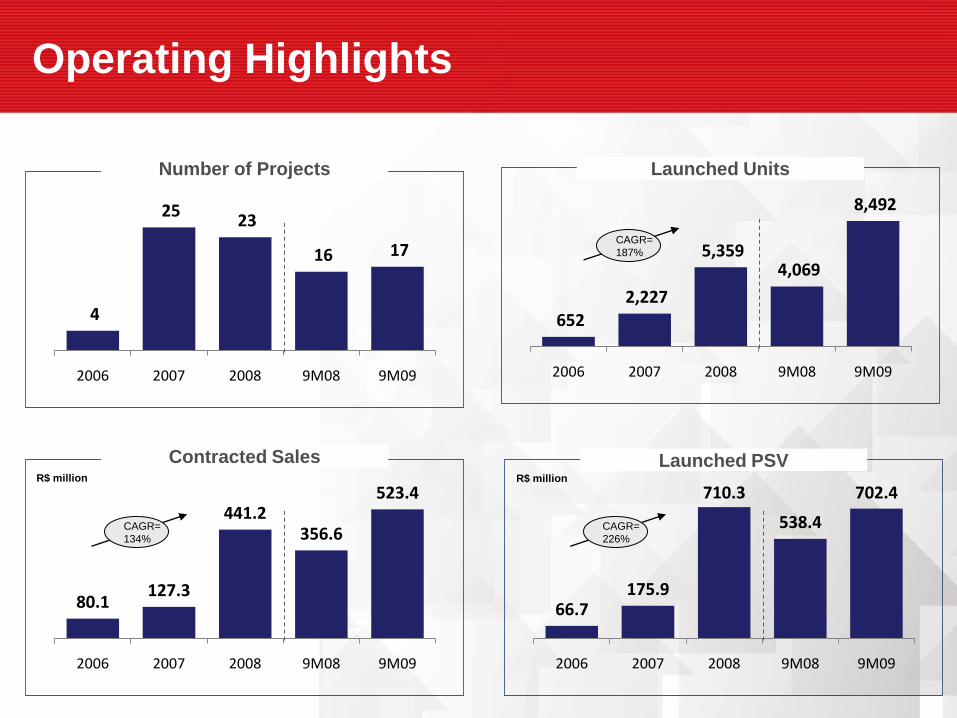
Operating Highlights
4
25 23
16 17
2006 2007 2008 9M08 9M09
Number of Projects
652 2,227
5,359 4,069
8,492
2006 2007 2008 9M08 9M09
Launched Units
80.1 127.3
441.2 356.6
523.4
2006 2007 2008 9M08 9M09
Contracted Sales
66.7 175.9
710.3
538.4
702.4
2006 2007 2008 9M08 9M09
Launched PSV
CAGR=
187%
CAGR=
226%
CAGR=
134%
R$ million R$ million
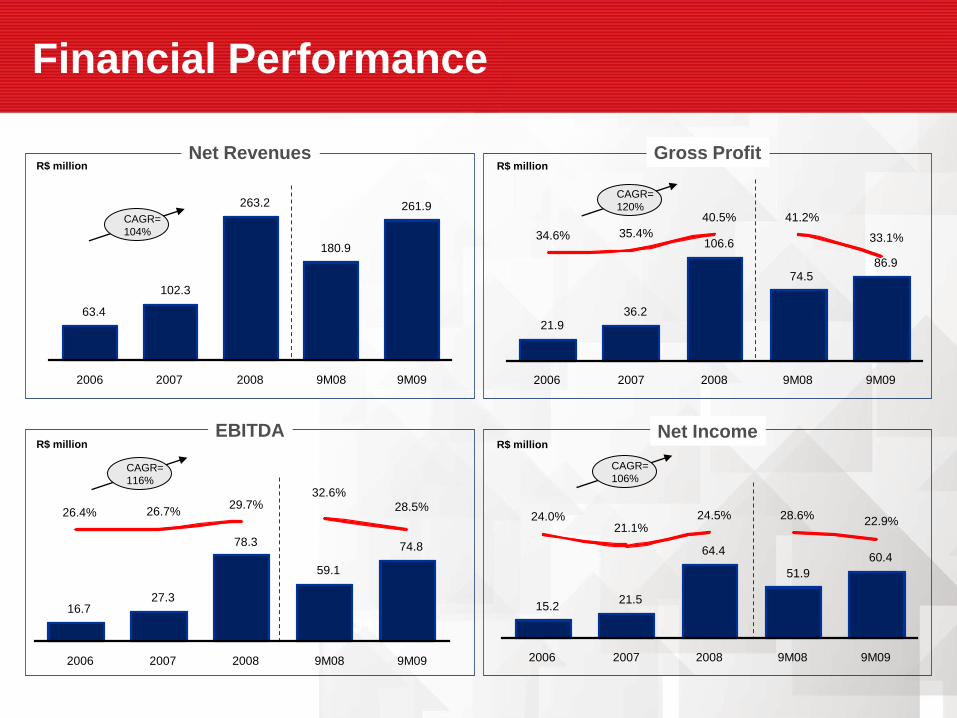
Financial Performance
R$ million R$ million
R$ million R$ million
Net Revenues Gross Profit
Net IncomeEBITDA
CAGR=
120%CAGR=
104%
CAGR=
106%CAGR=
116%
21.936.2
106.6
74.586.9
34.6% 35.4%
40.5% 41.2%
33.1%
2006 2007 2008 9M08 9M09
15.2 21.5
64.4
51.9
60.4
24.0%21.1%
24.5% 28.6%22.9%
2006 2007 2008 9M08 9M09
16.7 27.3
78.3
59.1
74.8
26.4% 26.7%29.7%
32.6%
28.5%
2006 2007 2008 9M08 9M09
63.4
102.3
263.2
180.9
261.9
2006 2007 2008 9M08 9M09
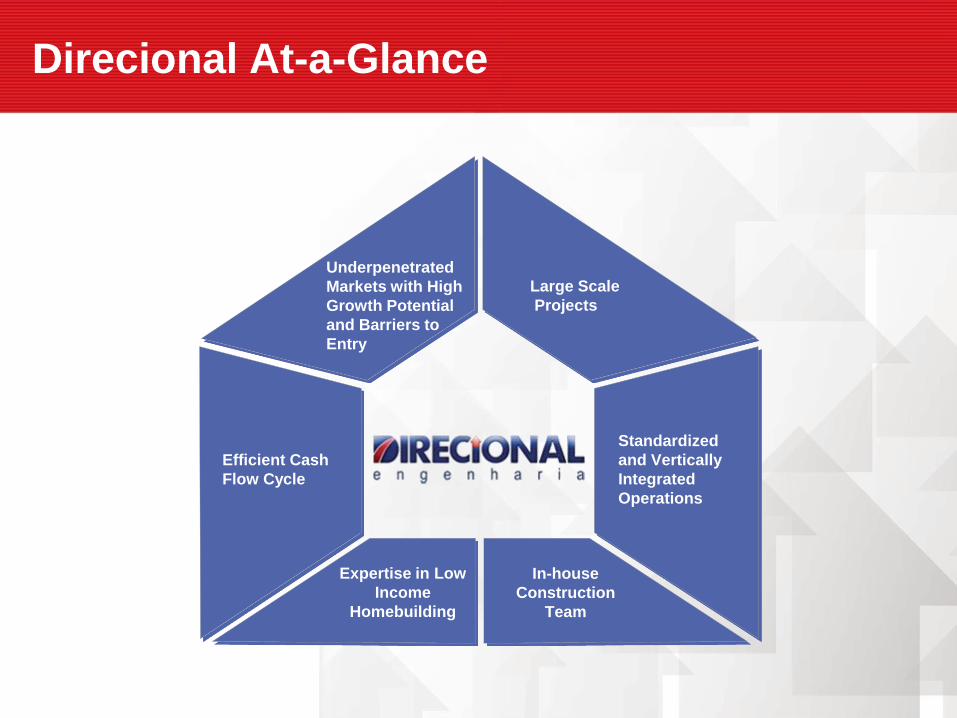
Direcional At-a-Glance
Standardized
and Vertically
Integrated
Operations
Large Scale
Projects
Underpenetrated
Markets with High
Growth Potential
and Barriers to
Entry
In-house
Construction
Team
Expertise in Low
Income
Homebuilding
Efficient Cash
Flow Cycle

Appendix
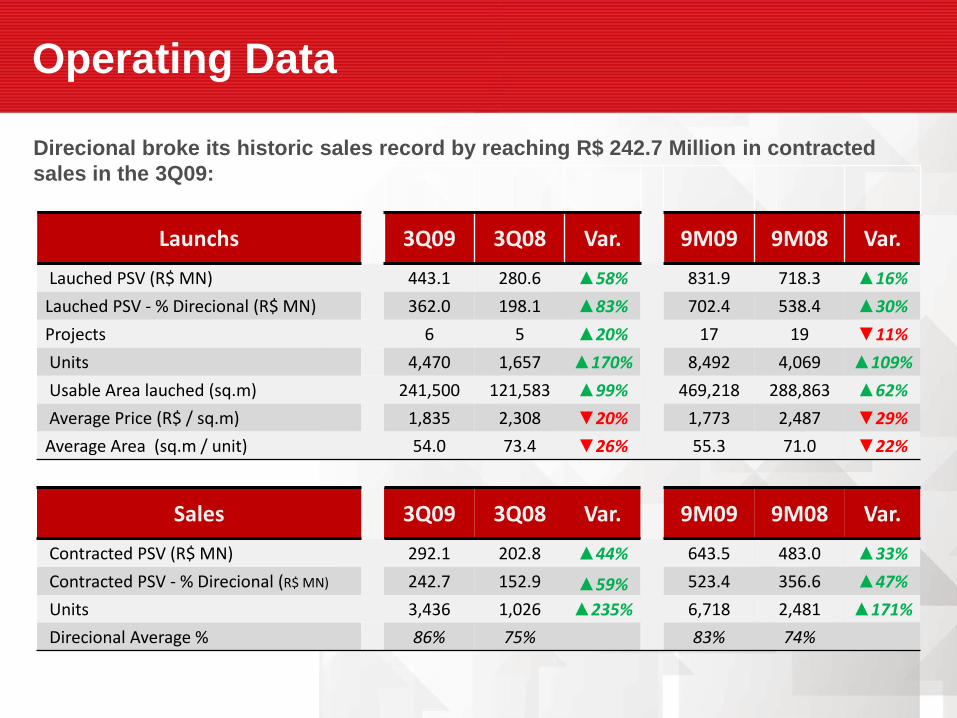
Launchs 3Q09 3Q08 Var. 9M09 9M08 Var.
Lauched PSV (R$ MN) 443.1 280.6 ▲58% 831.9 718.3 ▲16%
Lauched PSV - % Direcional (R$ MN) 362.0 198.1 ▲83% 702.4 538.4 ▲30%
Projects 6 5 ▲20% 17 19 ▼11%
Units 4,470 1,657 ▲170% 8,492 4,069 ▲109%
Usable Area lauched (sq.m) 241,500 121,583 ▲99% 469,218 288,863 ▲62%
Average Price (R$ / sq.m) 1,835 2,308 ▼20% 1,773 2,487 ▼29%
Average Area (sq.m / unit) 54.0 73.4 ▼26% 55.3 71.0 ▼22%
Sales 3Q09 3Q08 Var. 9M09 9M08 Var.
Contracted PSV (R$ MN) 292.1 202.8 ▲44% 643.5 483.0 ▲33%
Contracted PSV - % Direcional (R$ MN) 242.7 152.9 ▲59% 523.4 356.6 ▲47%
Units 3,436 1,026 ▲235% 6,718 2,481 ▲171%
Direcional Average % 86% 75% 83% 74%
Operating Data
Direcional broke its historic sales record by reaching R$ 242.7 Million in contracted
sales in the 3Q09:
Sales Speed
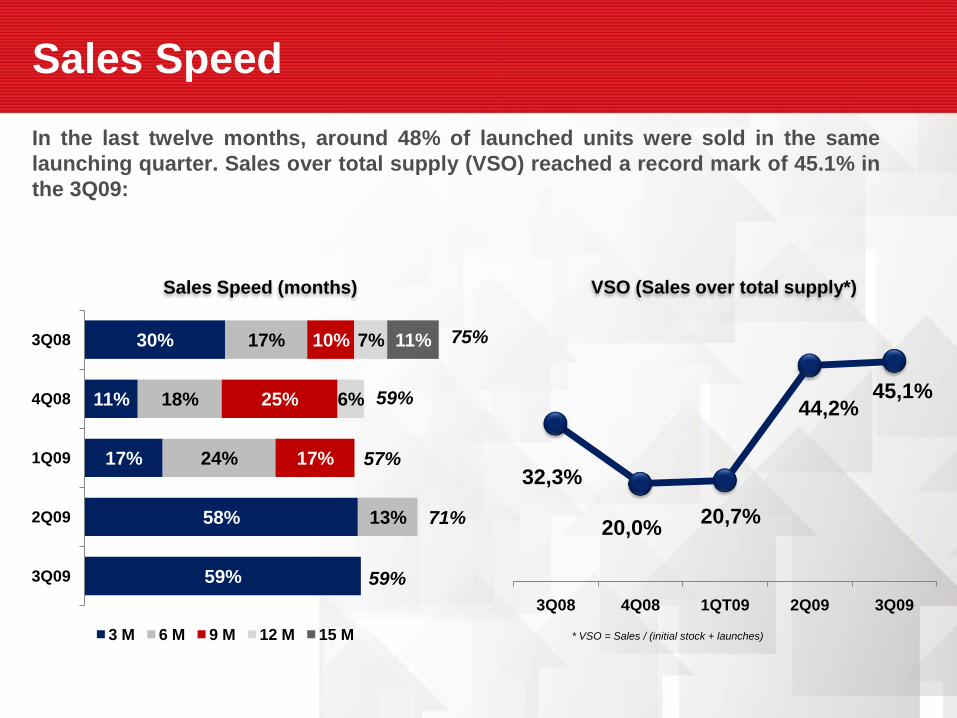
In the last twelve months, around 48% of launched units were sold in the same
launching quarter. Sales over total supply (VSO) reached a record mark of 45.1% in
the 3Q09:
59%
58%
17%
11%
30%
13%
24%
18%
17%
17%
25%
10%
6%
7% 11%
3Q09
2Q09
1Q09
4Q08
3Q08
3 M 6 M 9 M 12 M 15 M
32,3%
20,0%20,7%
44,2%45,1%
3Q08 4Q08 1QT09 2Q09 3Q09
VSO (Sales over total supply*)
* VSO = Sales / (initial stock + launches)
Sales Speed (months)
75%
59%
57%
71%
59%
Inventories
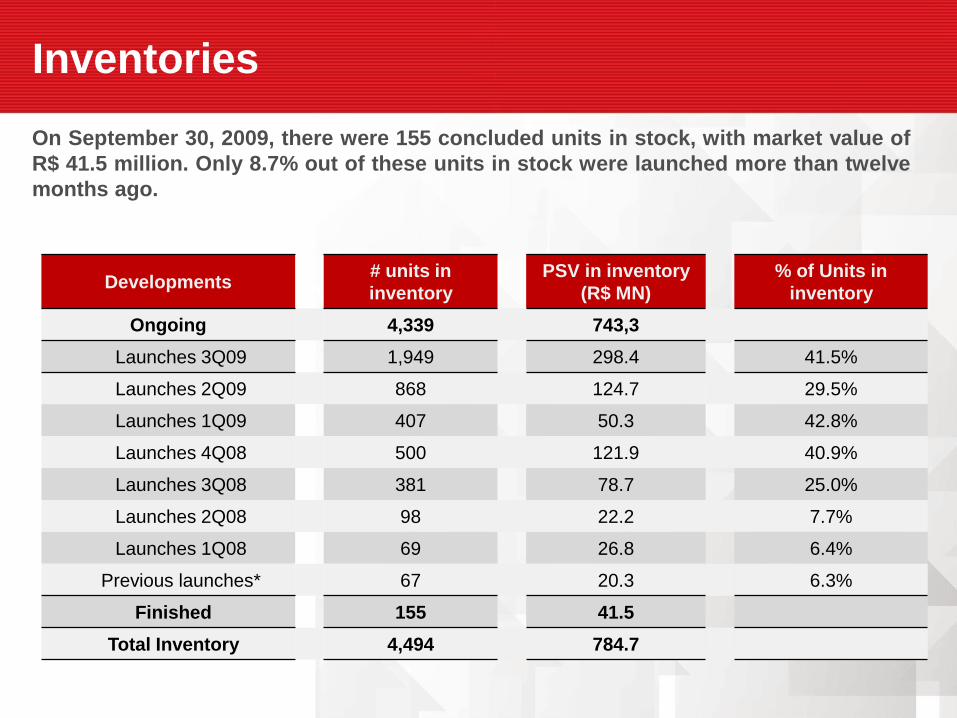
On September 30, 2009, there were 155 concluded units in stock, with market value of
R$ 41.5 million. Only 8.7% out of these units in stock were launched more than twelve
months ago.
Developments# units in
inventory
PSV in inventory
(R$ MN)
% of Units in
inventory
Ongoing 4,339 743,3
Launches 3Q09 1,949 298.4 41.5%
Launches 2Q09 868 124.7 29.5%
Launches 1Q09 407 50.3 42.8%
Launches 4Q08 500 121.9 40.9%
Launches 3Q08 381 78.7 25.0%
Launches 2Q08 98 22.2 7.7%
Launches 1Q08 69 26.8 6.4%
Previous launches* 67 20.3 6.3%
Finished 155 41.5
Total Inventory 4,494 784.7
Financial Performance – Highlights
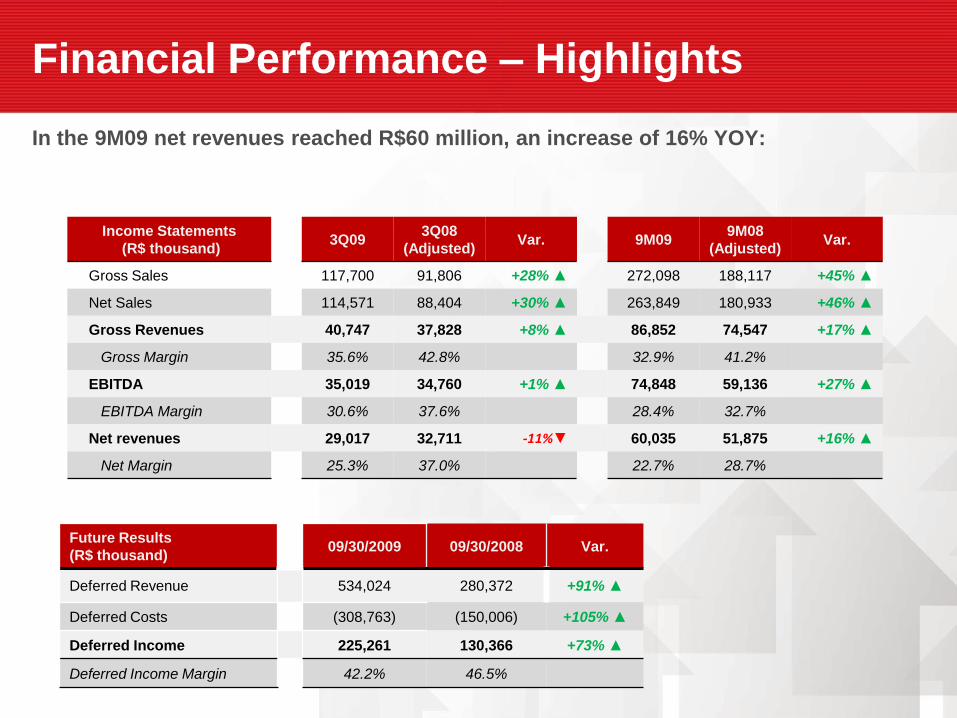
In the 9M09 net revenues reached R$60 million, an increase of 16% YOY:
Income Statements
(R$ thousand)3Q09
3Q08
(Adjusted)Var. 9M09
9M08
(Adjusted)Var.
Gross Sales 117,700 91,806 +28% ▲ 272,098 188,117 +45% ▲
Net Sales 114,571 88,404 +30% ▲ 263,849 180,933 +46% ▲
Gross Revenues 40,747 37,828 +8% ▲ 86,852 74,547 +17% ▲
Gross Margin 35.6% 42.8% 32.9% 41.2%
EBITDA 35,019 34,760 +1% ▲ 74,848 59,136 +27% ▲
EBITDA Margin 30.6% 37.6% 28.4% 32.7%
Net revenues 29,017 32,711 -11%▼ 60,035 51,875 +16% ▲
Net Margin 25.3% 37.0% 22.7% 28.7%
Future Results
(R$ thousand)09/30/2009 09/30/2008 Var.
Deferred Revenue 534,024 280,372 +91% ▲
Deferred Costs (308,763) (150,006) +105% ▲
Deferred Income 225,261 130,366 +73% ▲
Deferred Income Margin 42.2% 46.5%
Balance Sheet
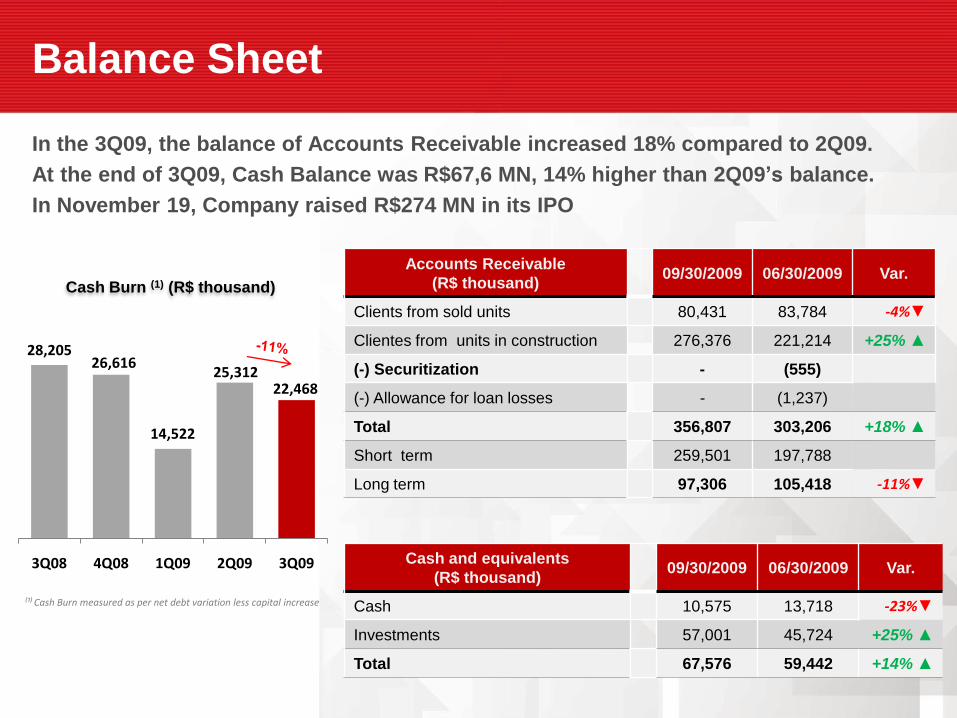
In the 3Q09, the balance of Accounts Receivable increased 18% compared to 2Q09.
At the end of 3Q09, Cash Balance was R$67,6 MN, 14% higher than 2Q09’s balance.
In November 19, Company raised R$274 MN in its IPO
Accounts Receivable
(R$ thousand)09/30/2009 06/30/2009 Var.
Clients from sold units 80,431 83,784 -4%▼
Clientes from units in construction 276,376 221,214 +25% ▲
(-) Securitization - (555)
(-) Allowance for loan losses - (1,237)
Total 356,807 303,206 +18% ▲
Short term 259,501 197,788
Long term 97,306 105,418 -11%▼
Cash and equivalents
(R$ thousand)09/30/2009 06/30/2009 Var.
Cash 10,575 13,718 -23%▼
Investments 57,001 45,724 +25% ▲
Total 67,576 59,442 +14% ▲
28,205 26,616
14,522
25,312 22,468
3Q08 4Q08 1Q09 2Q09 3Q09
Cash Burn (1) (R$ thousand)
⁽¹⁾ Cash Burn measured as per net debt variation less capital increase
Balance Sheet - Indebtedness
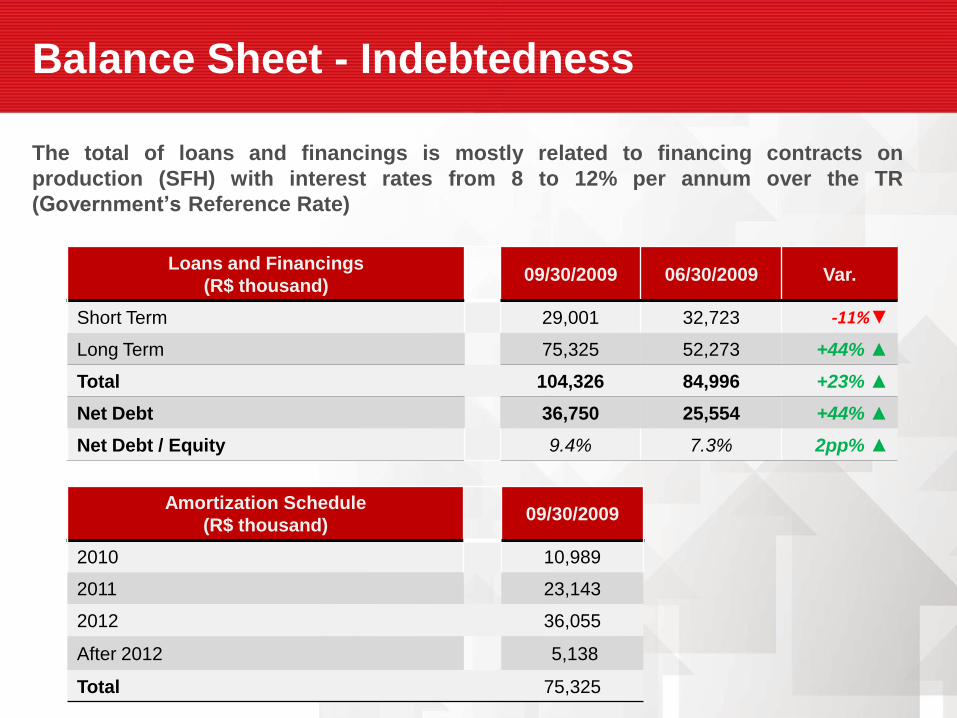
The total of loans and financings is mostly related to financing contracts on
production (SFH) with interest rates from 8 to 12% per annum over the TR
(Government’s Reference Rate)
Loans and Financings
(R$ thousand)09/30/2009 06/30/2009 Var.
Short Term 29,001 32,723 -11%▼
Long Term 75,325 52,273 +44% ▲
Total 104,326 84,996 +23% ▲
Net Debt 36,750 25,554 +44% ▲
Net Debt / Equity 9.4% 7.3% 2pp% ▲
Amortization Schedule
(R$ thousand)09/30/2009
2010 10,989
2011 23,143
2012 36,055
After 2012 5,138
Total 75,325
Recommended