Brussels
June 24 - 25, 2008
Bianka Halmágyi
Statistics.Cylos, Cylos 990, Philos II, Talos.

2
Statistics. Cylos, Cylos 990, Philos II, Talos.
General
Statistics will be restarted at every reprogramming of the device
Long-term trends are 180 days long and rolling (if the trend is longer than 180 days the oldest data will be overwritten)
Histograms collect all data as long as the statistics are restarted again
Short-term trends collect data for 33.33 hours
during interrogation and magnet application the counters/ histograms are not active
Programming the rate forecast feature will empty all rate counters/histograms
3
Statistics. Cylos, Cylos 990, Philos II, Talos.
Overview
Timing Timing eventsSpecial eventsAtrial rate histogramVentricular rate histogramA/V rate trend Intrinsic AV conductionFar-field histogram
TachyarrhythmiasTachy episode trendAT histogramPAC trendPAC versus atrial ratePAC coupling intervalPVC classificationPVC versus ventricular ratePVC coupling interval
SensorRate/sensor trendSensor gain trendSensor histogramActivity chart
Sensing StatisticsP-wave trend short + longR-wave trend short + long
PacingA/V impedance trend (short +long)Vent. pacing amplitude trendVentricular threshold trendVentricular pacing amplitude histogramACC status

4
Statistics. Cylos, Cylos 990, Philos II, Talos.
Agenda
Timing
Atrial arrhythmia
Ventricular arrhythmia
Sensor
Sensing
Pacing
5
Statistics. Cylos, Cylos 990, Philos II, Talos.
Timing
Timing events
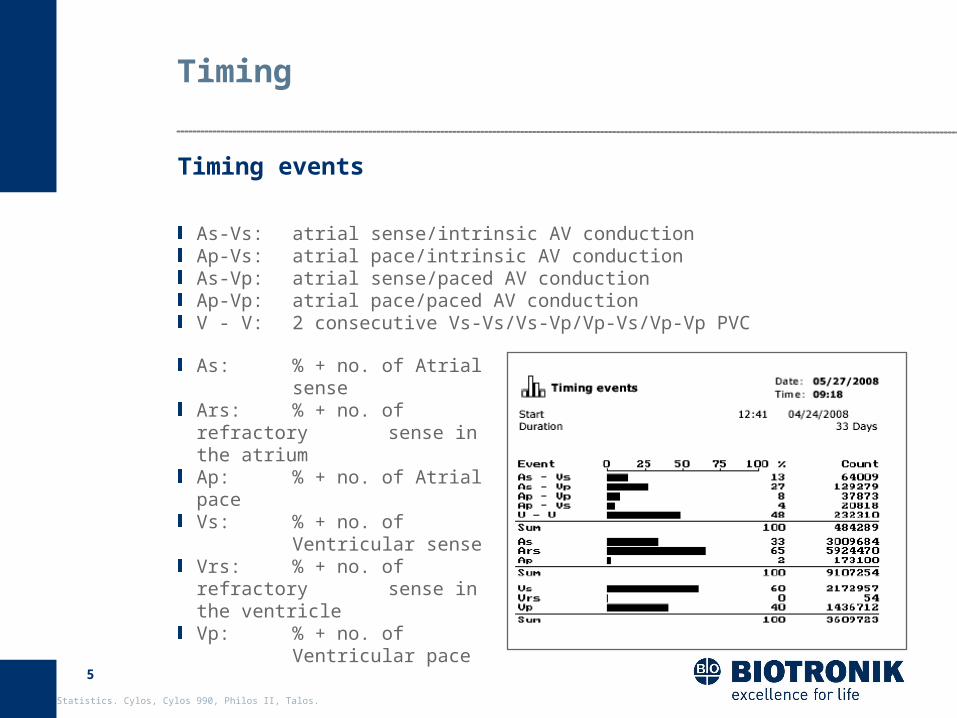
As-Vs: atrial sense/intrinsic AV conductionAp-Vs: atrial pace/intrinsic AV conduction As-Vp: atrial sense/paced AV conductionAp-Vp: atrial pace/paced AV conduction V - V: 2 consecutive Vs-Vs/Vs-Vp/Vp-Vs/Vp-Vp PVC
As: % + no. of Atrial sense
Ars: % + no. of refractory sense in the atriumAp: % + no. of Atrial pace Vs: % + no. of
Ventricular senseVrs: % + no. of refractory sense in the ventricleVp: % + no. of
Ventricular pace
6
Statistics. Cylos, Cylos 990, Philos II, Talos.
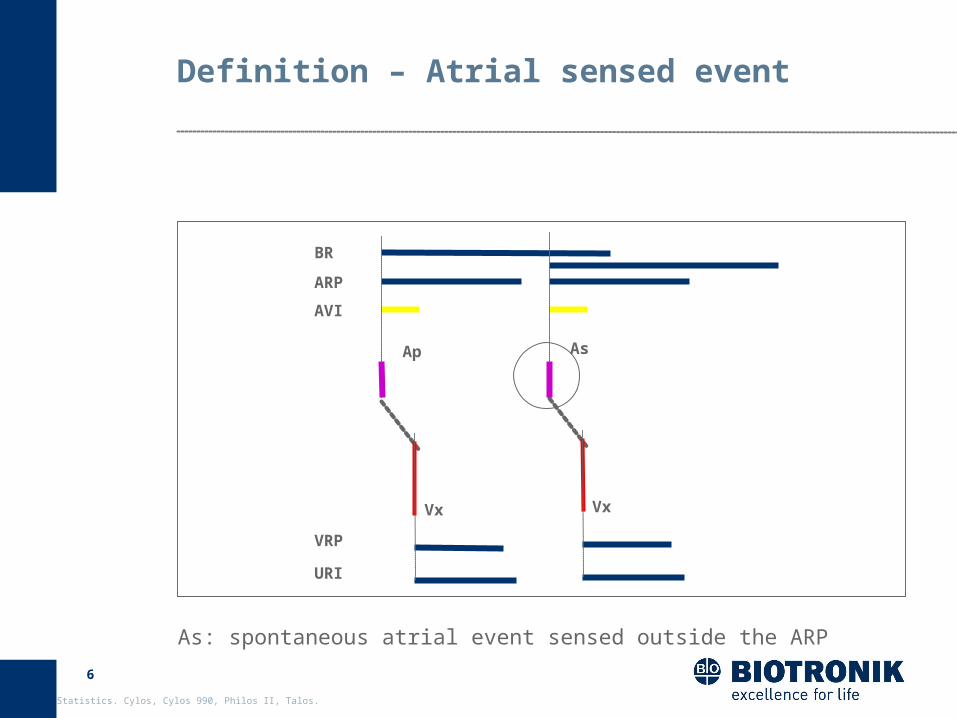
Definition – Atrial sensed event
Ap
BR
ARP
AVI
VRP
URI
As
Vx Vx
As: spontaneous atrial event sensed outside the ARP

7
Statistics. Cylos, Cylos 990, Philos II, Talos.
Definition – Atrial paced event
Ap
Vx
BR
ARP
AVI
VRP
URI
As
Vx
Ap: atrial stimulus at the end of the programmed Basic Rate/ Hysteresis Rate or during Sensor driven atrial stimulation

8
Statistics. Cylos, Cylos 990, Philos II, Talos.
Definition – Ventricular sensed event
As Ap
Vp Vs
ARP
AVI
VRP
BR
URI
Ap
Vp
As
Vs
Vs = spontaneous ventricular event sensed after As or Ap during AVI and Vs after Vx

9
Statistics. Cylos, Cylos 990, Philos II, Talos.
Definition – Ventricular refractory sense
Ap ApAs As
Vp Vp Vp Vp
PVC
ARP
AVI
VRPURI
Ventricular sense during the programmed ventricular refractory period is classified as a Vrs however, not classified as a PVC
BR

10
Statistics. Cylos, Cylos 990, Philos II, Talos.
Definition – Ventricular Extra Systole event
Ap Ap Ap
Vp Vp Vs
PVC
ARP
AVI
VRP
BR
URI
A spontaneous ventricular event sensed outside the programmed VRP without a previous atrial sense or pace is classified as PVC
Ventricular event after Ars is classified as PVC

11
Statistics. Cylos, Cylos 990, Philos II, Talos.
Definition – Ventricular paced event
As Ap
Vp Vs
ARP
AVI
VRP
BR
URI
Ap
Vp
As
Vs
Vp = ventricular stimulus at the end of the AV delay
12
Statistics. Cylos, Cylos 990, Philos II, Talos.
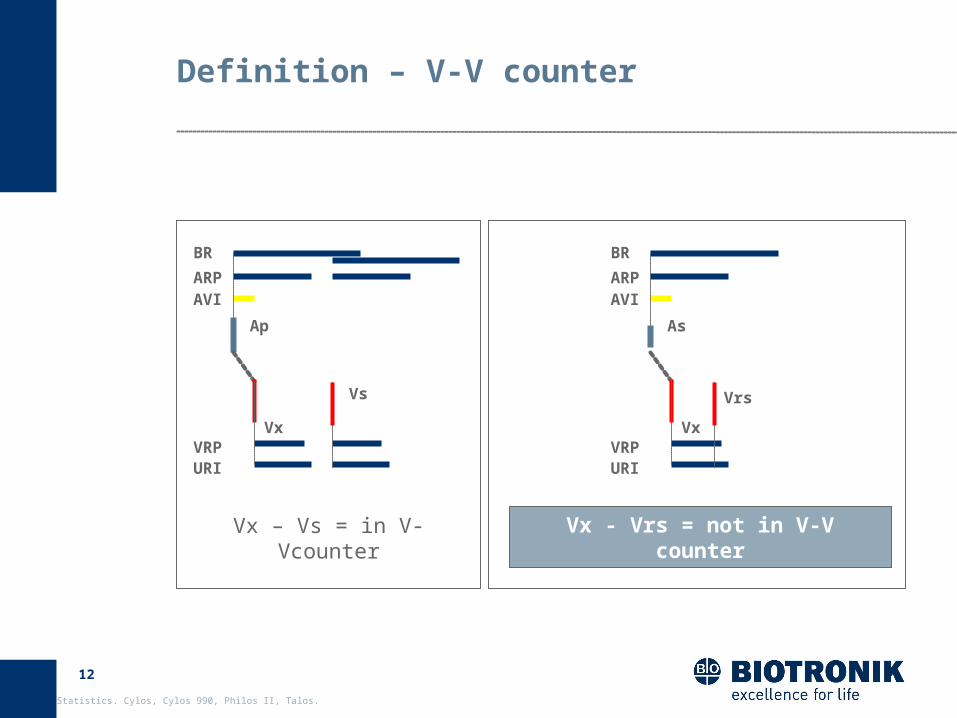
Definition – V-V counter
Ap
Vs
Vx
BR
ARPAVI
VRPURI
Vx – Vs = in V-Vcounter
As
Vrs
Vx
BR
ARPAVI
VRPURI
Vx - Vrs = not in V-V counter
13
Statistics. Cylos, Cylos 990, Philos II, Talos.
Timing
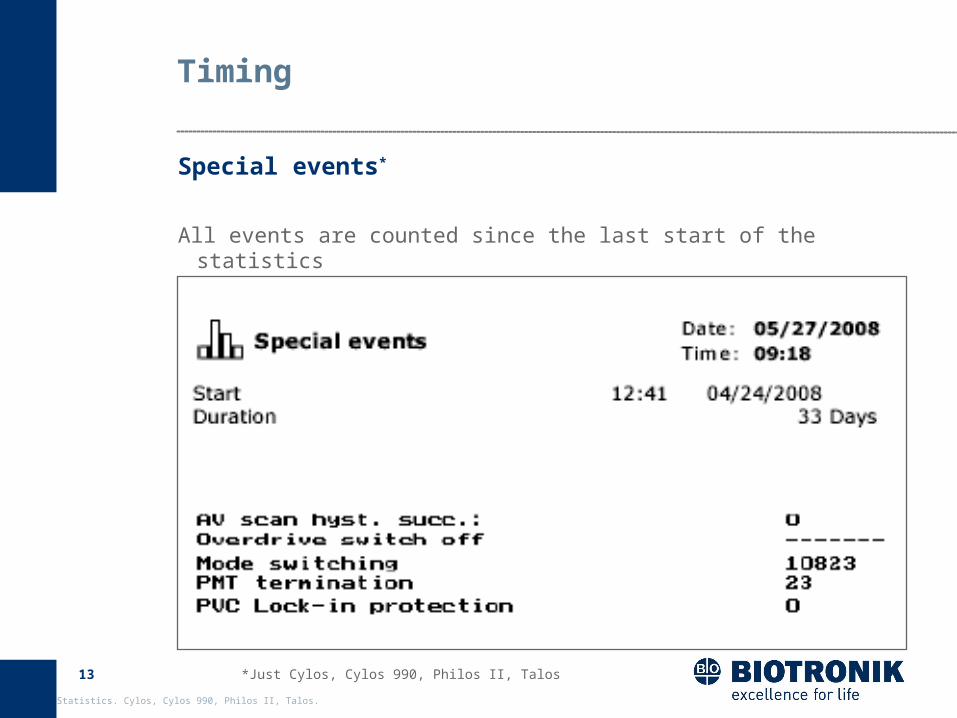
Special events*
*Just Cylos, Cylos 990, Philos II, Talos
All events are counted since the last start of the statistics
14
Statistics. Cylos, Cylos 990, Philos II, Talos.
Timing
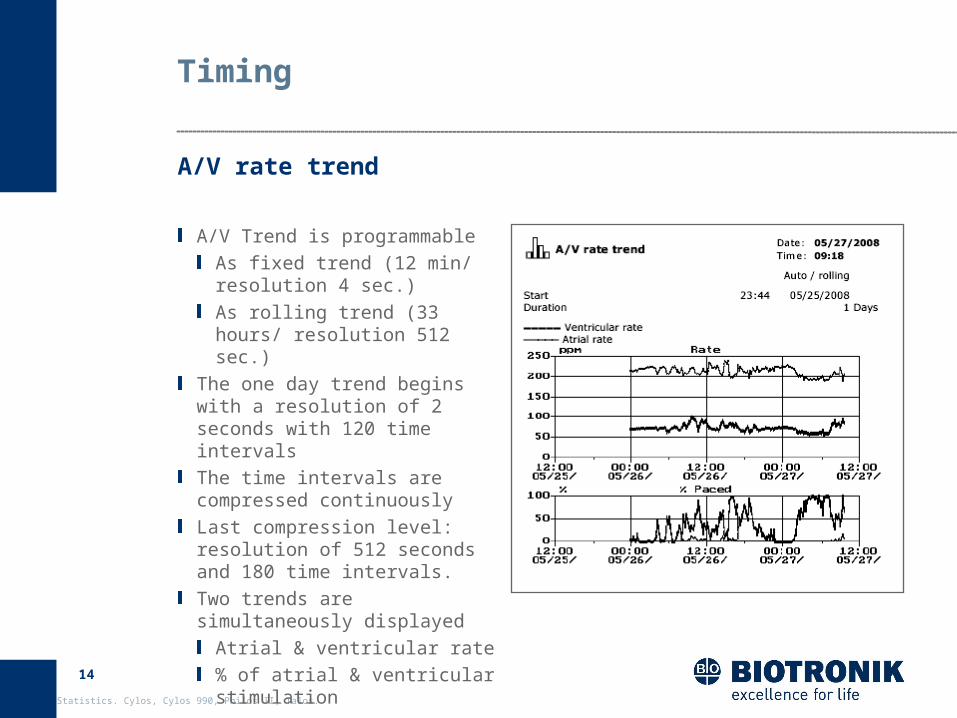
A/V rate trend
A/V Trend is programmableAs fixed trend (12 min/resolution 4 sec.)As rolling trend (33 hours/ resolution 512 sec.)
The one day trend begins with a resolution of 2 seconds with 120 time intervalsThe time intervals are compressed continuouslyLast compression level: resolution of 512 seconds and 180 time intervals.Two trends are simultaneously displayed
Atrial & ventricular rate% of atrial & ventricular stimulation
15
Statistics. Cylos, Cylos 990, Philos II, Talos.
Timing
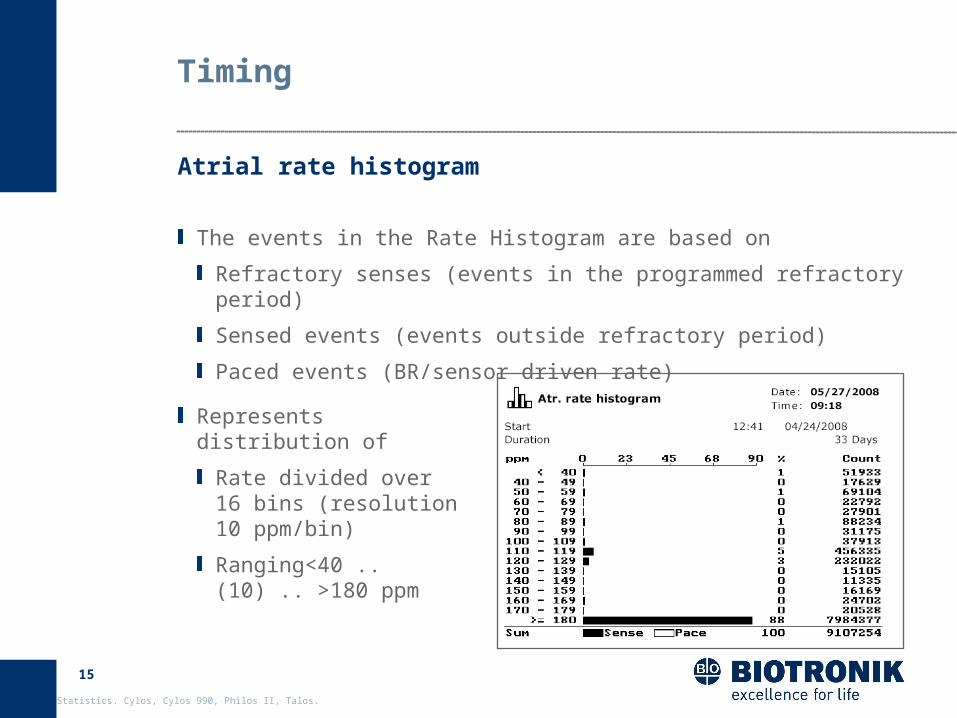
Atrial rate histogram
The events in the Rate Histogram are based on
Refractory senses (events in the programmed refractory period)
Sensed events (events outside refractory period)
Paced events (BR/sensor driven rate)
Represents distribution of
Rate divided over 16 bins (resolution 10 ppm/bin)
Ranging<40 .. (10) .. >180 ppm

16
Statistics. Cylos, Cylos 990, Philos II, Talos.
Atrial rate histogram 1/2
P-P
1,000 ms
P-P
1,500 ms
Ap Ap Ap Ap
Vp Vp Vp Vp
PVC
ARPAVI
VRP
BI
URI
< 40
40-49
Ap < BR
17
Statistics. Cylos, Cylos 990, Philos II, Talos.
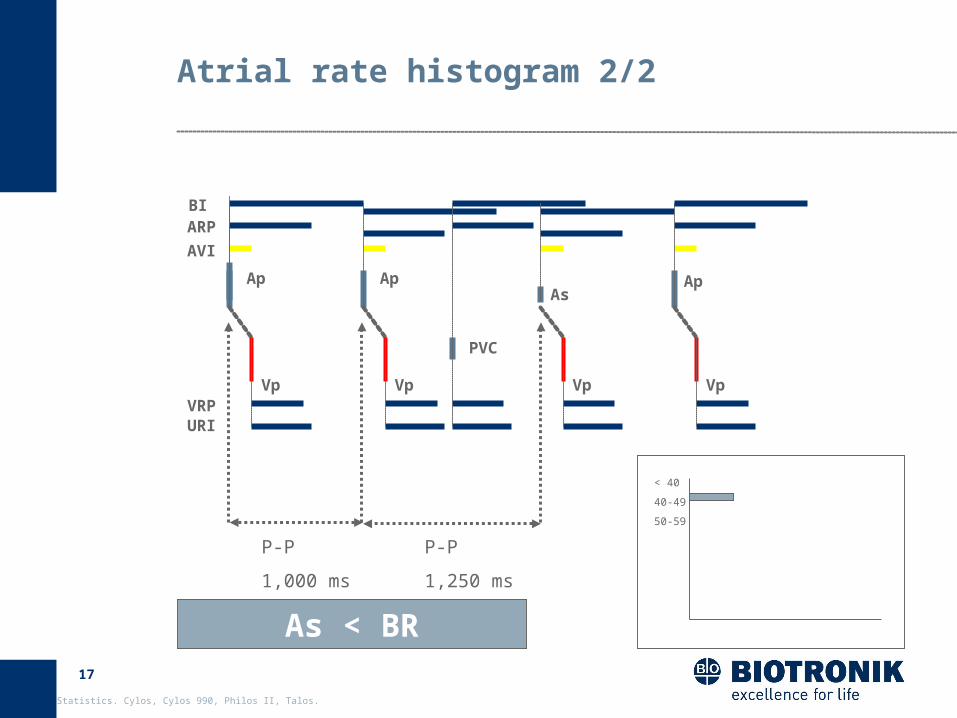
Atrial rate histogram 2/2
P-P
1,000 ms
P-P
1,250 ms
Ap ApAs
Ap
Vp Vp Vp Vp
PVC
ARP
AVI
VRP
BI
URI
< 40
40-49
50-59
As < BR
18
Statistics. Cylos, Cylos 990, Philos II, Talos.
Timing
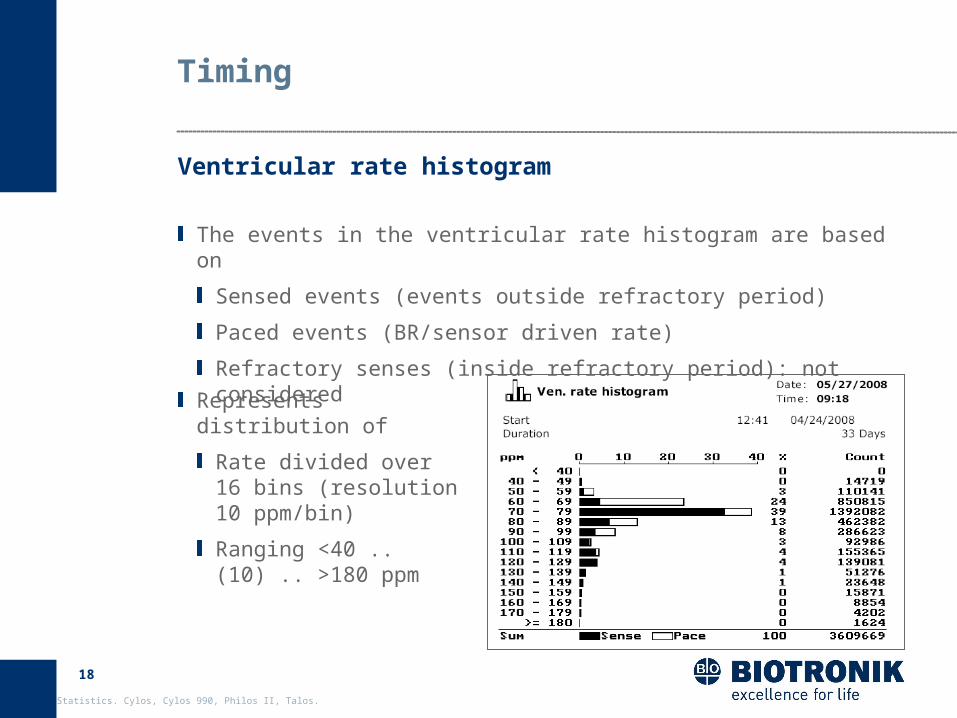
Ventricular rate histogram
The events in the ventricular rate histogram are based on
Sensed events (events outside refractory period)
Paced events (BR/sensor driven rate)
Refractory senses (inside refractory period): not considered
Represents distribution of
Rate divided over 16 bins (resolution 10 ppm/bin)
Ranging <40 .. (10) .. >180 ppm

19
Statistics. Cylos, Cylos 990, Philos II, Talos.
Ventricular rate histogram 1/2
V-V
1,000 ms
V-V
1,090 ms
Ap Ap As Ap
Vp Vp Vp Vp
PVC
VRPURI
< 40
40-49
50-59
Vs < BR
BIARPAVI
20
Statistics. Cylos, Cylos 990, Philos II, Talos.
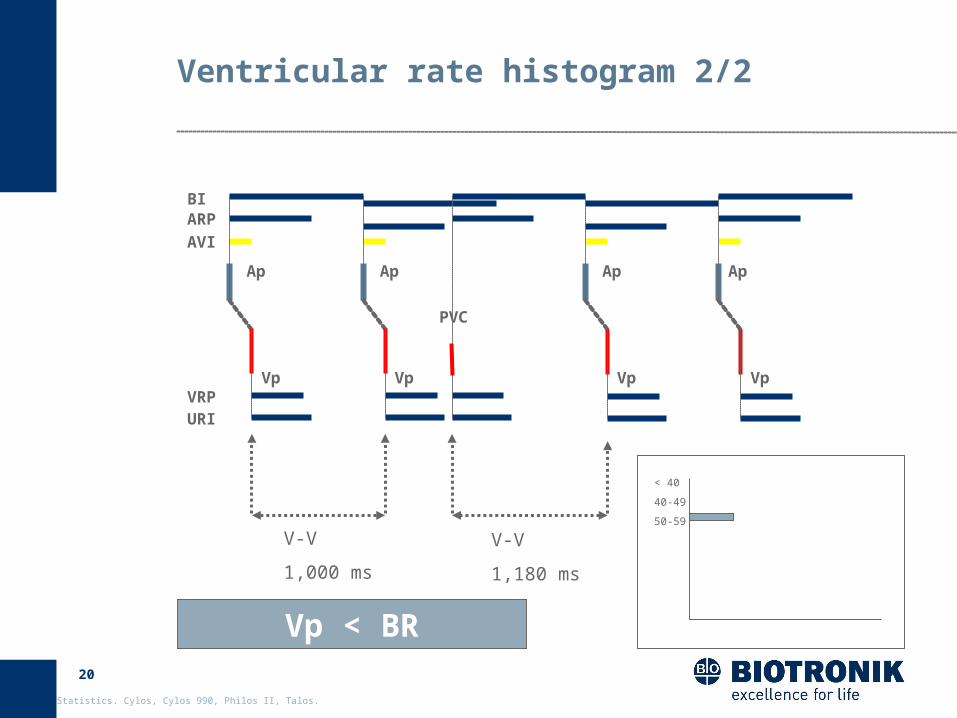
Ventricular rate histogram 2/2
V-V
1,000 ms
V-V
1,180 ms
Ap Ap Ap Ap
Vp Vp Vp Vp
PVC
BIARPAVI
VRPURI
< 40
40-49
50-59
Vp < BR

21
Statistics. Cylos, Cylos 990, Philos II, Talos.
Timing
Intrinsic AV conduction*
*Just Cylos and Cylos990
Provides data pertaining to how close intrinsic AV conduction is to the programmed AV interval
The histogram (it actually consists of 10 histograms in one figure) shows the following
Frequency range (5 vertical "trees": 50 - 70ppm, 70 - 90pmm, 90 - 110ppm, 110 - 130ppm, >130ppm)
Conduction sorted by Ap (branches to the left of the tree) and As (branches to the right of the tree)
How many milliseconds after the atrial event, a Vs is registered

22
Statistics. Cylos, Cylos 990, Philos II, Talos.
Timing
Intrinsic AV conduction* EXAMPLE: FREQUENCY RANGE
50 - 70PPM
AV Hysteresis interval after Ap
AV Hysteresis interval after As
Intrinsic AV conduction was registered 210 ms (approx. 60%) and 220 ms (approx. 35%) after Ap and very little (approx. 5%) also after 200 ms
AV Delay after Ap
AV Delay after As
Intrinsic AV conduction registered 200 ms after As (approx. 95%) and very little also after 190 ms (approx. 5%)
*Just Cylos and Cylos990
23
Statistics. Cylos, Cylos 990, Philos II, Talos.
Timing
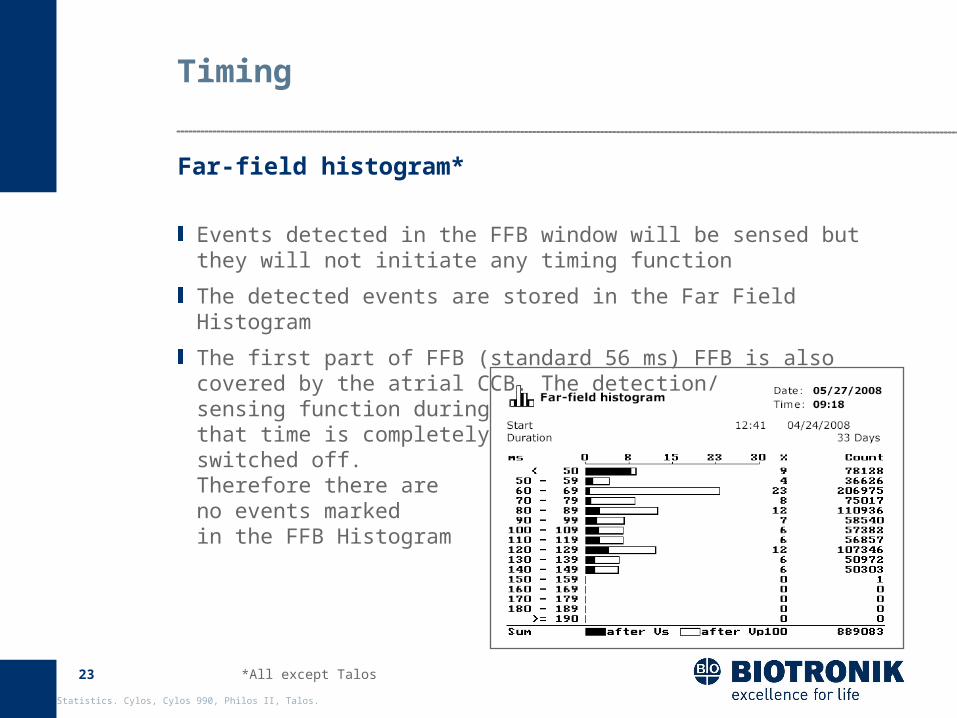
Far-field histogram*
*All except Talos
Events detected in the FFB window will be sensed but they will not initiate any timing function
The detected events are stored in the Far Field Histogram
The first part of FFB (standard 56 ms) FFB is also covered by the atrial CCB. The detection/ sensing function during that time is completely switched off. Therefore there are no events marked in the FFB Histogram
24
Statistics. Cylos, Cylos 990, Philos II, Talos.
Far Field Blanking (FFB)
Prevents detection of R-waves in the atrial channelFFB is a digital blanking to assure a correct function of the Mode Switching functionality Programmability: 32* ,40*, 48*, 56*, 72*, 100, 125, 150, 175, 200. The FFB values in Philos II (see *) are dependent on the programmed value of the Atrial Cross Channel Blanking. Only this related value will be seen on the programmerCylos does not have this type of dependencyFFB values for Axios/Philos/Protos are programmable in the Mode Switching screenFFB values for Philos II and Cylos are programmable in the Parameter screenSenses in the FFB and outside the CCB are visible in the marker channel
25
Statistics. Cylos, Cylos 990, Philos II, Talos.
Far Field Blanking (FFB)
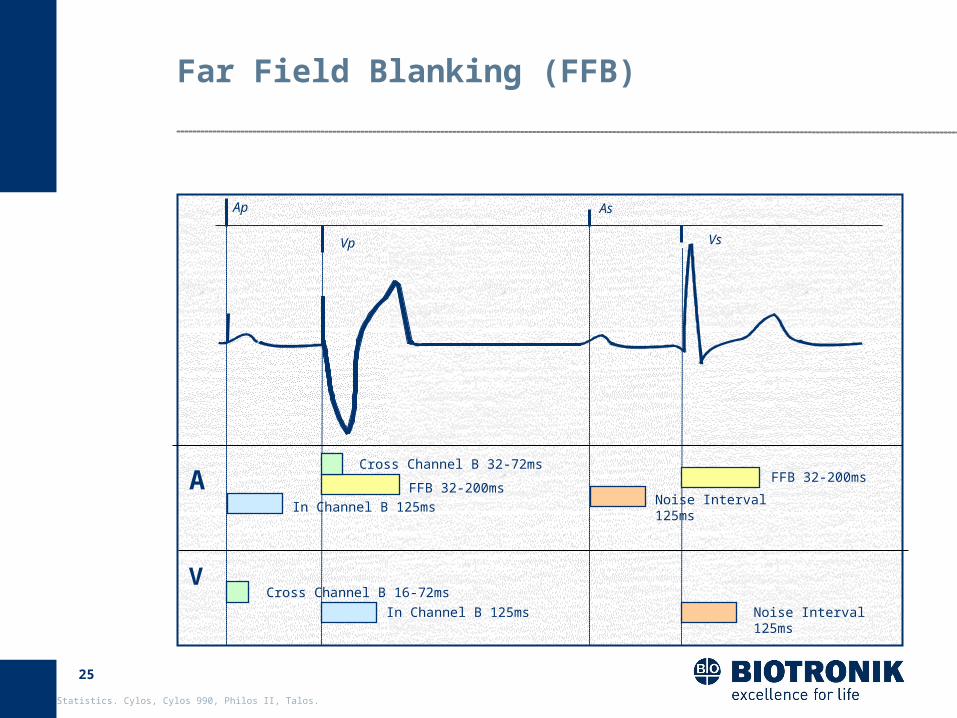
As
VsVp
Ap
In Channel B 125ms
In Channel B 125ms
A
V
Noise Interval 125ms
Noise Interval 125ms
FFB 32-200msFFB 32-200ms
Cross Channel B 32-72ms
Cross Channel B 16-72ms

26
Statistics. Cylos, Cylos 990, Philos II, Talos.
Agenda
Timing
Atrial arrhythmia
Ventricular arrhythmia
Sensor
Sensing
Pacing
27
Statistics. Cylos, Cylos 990, Philos II, Talos.
Atrial arrhythmia
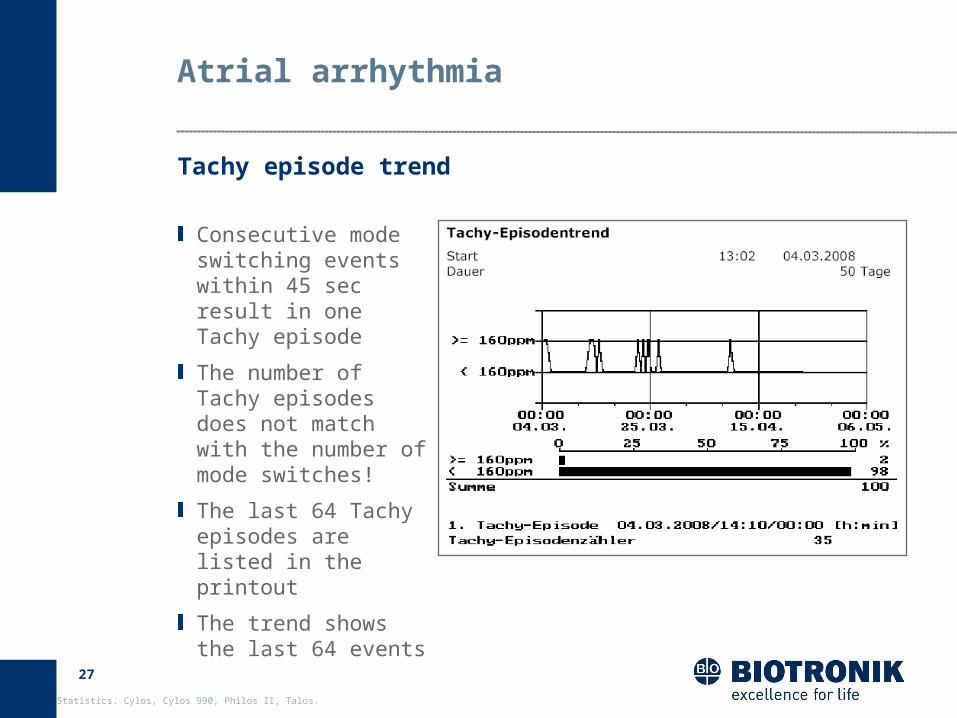
Tachy episode trend
Consecutive mode switching events within 45 sec result in one Tachy episode
The number of Tachy episodes does not match with the number of mode switches!
The last 64 Tachy episodes are listed in the printout
The trend shows the last 64 events
28
Statistics. Cylos, Cylos 990, Philos II, Talos.
Atrial arrhythmia
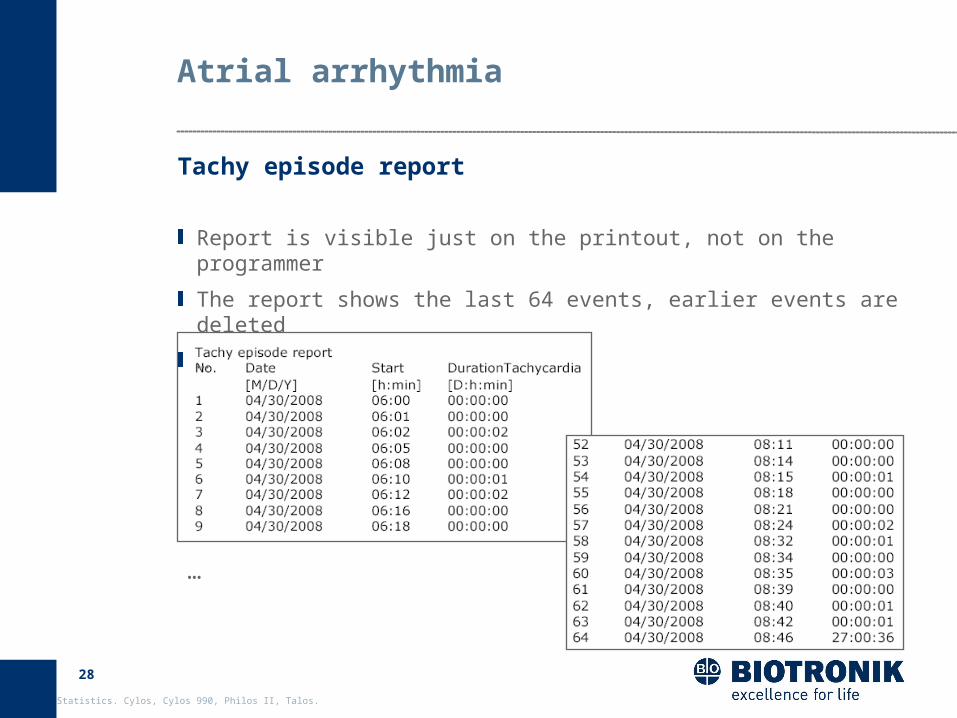
Tachy episode report
…
Report is visible just on the printout, not on the programmer
The report shows the last 64 events, earlier events are deleted
…
29
Statistics. Cylos, Cylos 990, Philos II, Talos.
Atrial arrhythmia
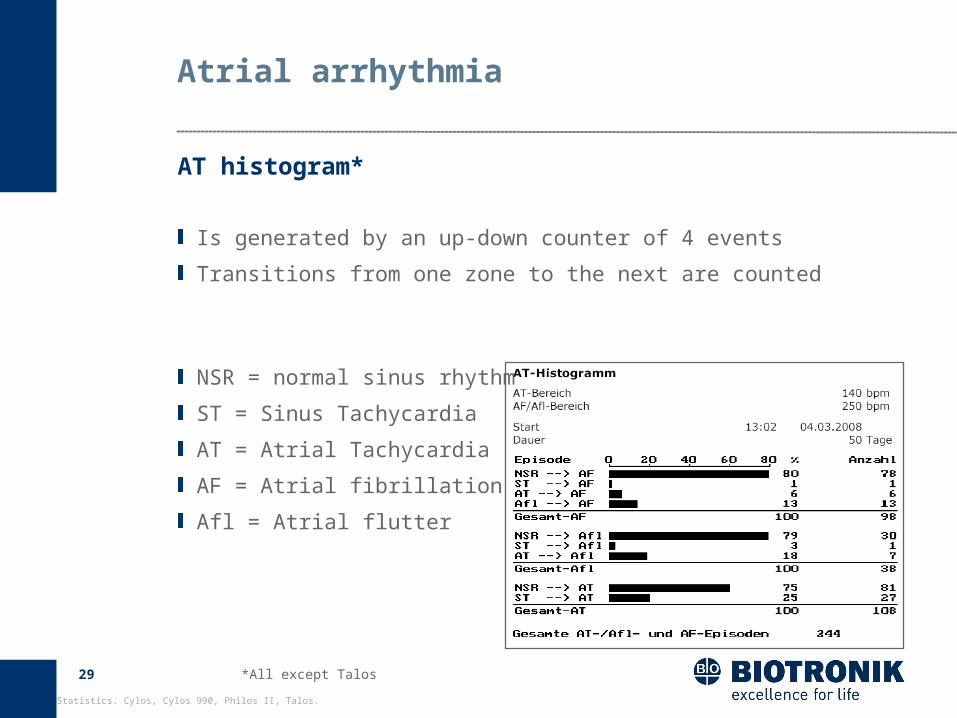
AT histogram*
NSR = normal sinus rhythm
ST = Sinus Tachycardia
AT = Atrial Tachycardia
AF = Atrial fibrillation
Afl = Atrial flutter
*All except Talos
Is generated by an up-down counter of 4 events
Transitions from one zone to the next are counted
30
Statistics. Cylos, Cylos 990, Philos II, Talos.
AT definition
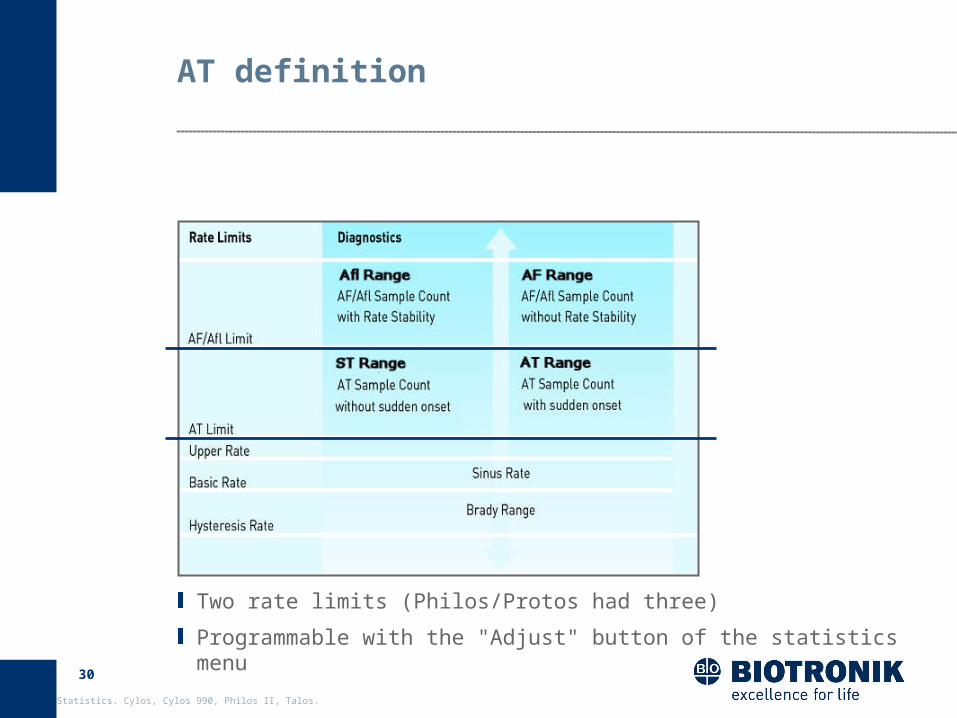
Two rate limits (Philos/Protos had three)
Programmable with the "Adjust" button of the statistics menu
31
Statistics. Cylos, Cylos 990, Philos II, Talos.
AT definition
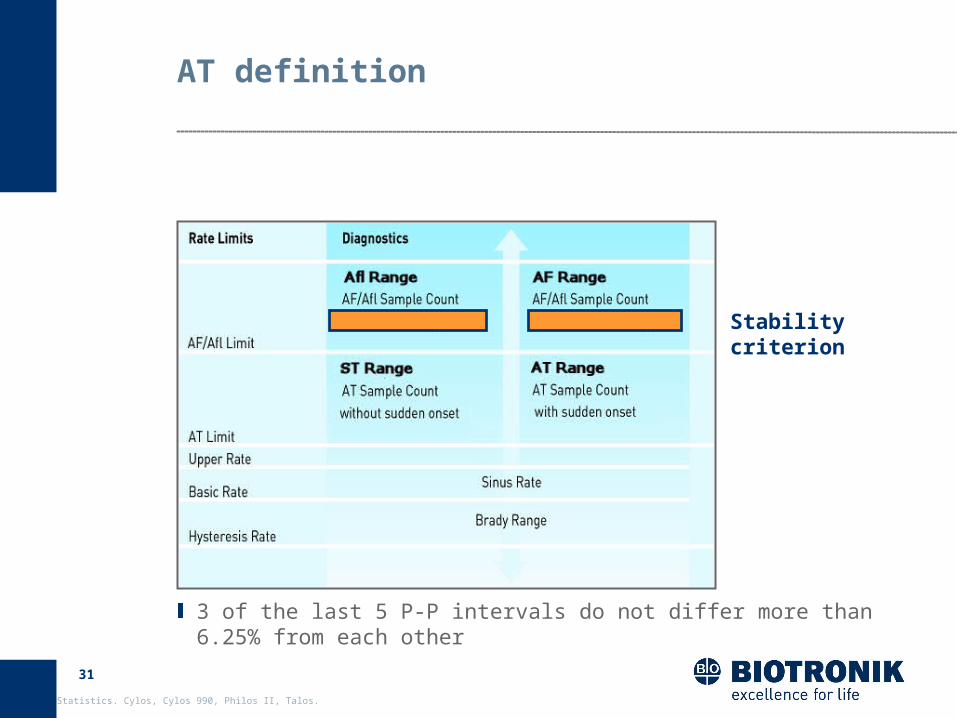
Stability criterion
3 of the last 5 P-P intervals do not differ more than 6.25% from each other
32
Statistics. Cylos, Cylos 990, Philos II, Talos.
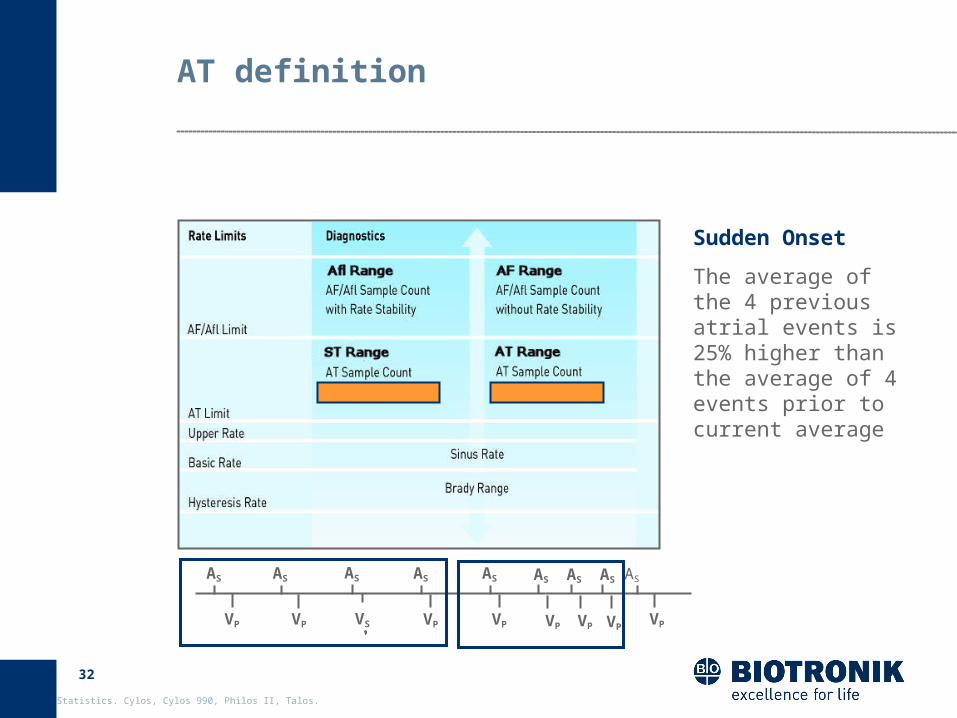
AT definition
Sudden Onset
The average of the 4 previous atrial events is 25% higher than the average of 4 events prior to current average
AS AS
VP VP
AS
VS VP
AS
VP
AS
VP
AS
VP
AS AS AS
VPVP

33
Statistics. Cylos, Cylos 990, Philos II, Talos.
Atrial arrhythmia
AV
AVIAARP PACW
Prematurity (e.g., 25%)
P-P Interval
Atrial senses are registered, but do not change timing
Dynamic shorteningwith rate change
Premature Atrial Contraction WindowAtrial senses in this window are classified as Atrial Premature beats
Prematurityprogrammable
between 5 .. (5) .. 50%
PAC definition
Definition Prematurity: PAC is X% shorter than the average of the last 4 P- P intervals
The length of the PAC Window (PACW)is limited to 800 ms after the atrial event
An atrial event later than 800ms following an atrial event is not considered as PAC
34
Statistics. Cylos, Cylos 990, Philos II, Talos.
Atrial arrhythmia
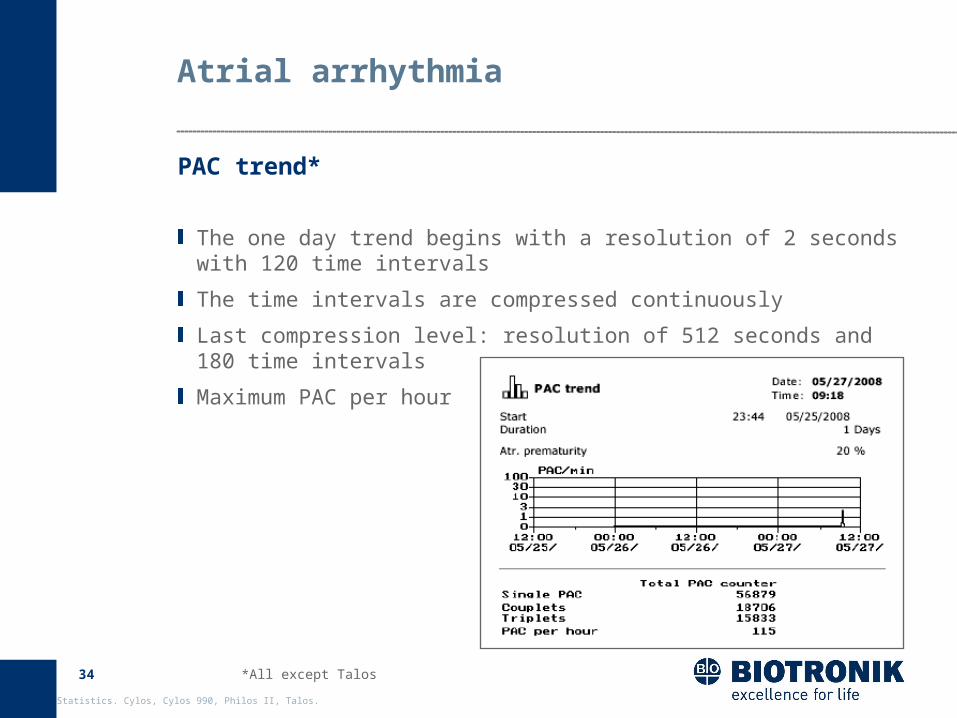
PAC trend*
*All except Talos
The one day trend begins with a resolution of 2 seconds with 120 time intervals
The time intervals are compressed continuously
Last compression level: resolution of 512 seconds and 180 time intervals
Maximum PAC per hour

35
Statistics. Cylos, Cylos 990, Philos II, Talos.
Atrial arrhythmia
PAC vs. atrial rate*
*All except Talos
Number and percentage of PAC versus atrial rate shows at which rate the highest percentage of PAC occur
Atrial rate divided over 16 bins (resolution 10 ppm) ranging between 40 .. (10) .. >180 ppm
36
Statistics. Cylos, Cylos 990, Philos II, Talos.
Atrial arrhythmia
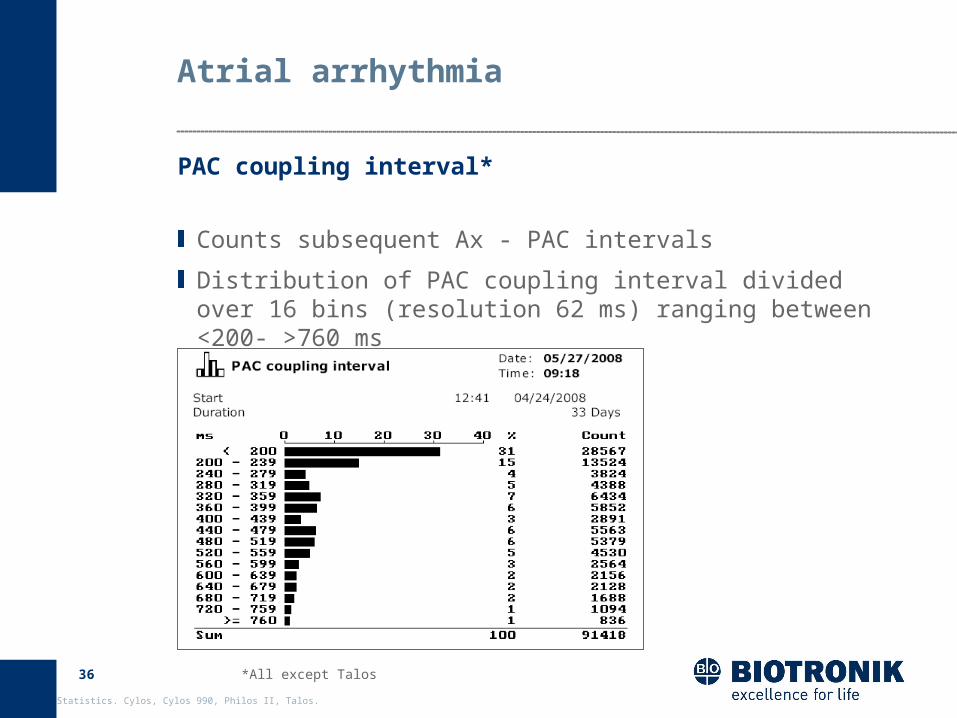
PAC coupling interval*
*All except Talos
Counts subsequent Ax - PAC intervals
Distribution of PAC coupling interval divided over 16 bins (resolution 62 ms) ranging between <200- >760 ms
37
Statistics. Cylos, Cylos 990, Philos II, Talos.
Agenda
Timing
Atrial arrhythmia
Ventricular arrhythmia
Sensor
Sensing
Pacing
38
Statistics. Cylos, Cylos 990, Philos II, Talos.
Ventricular arrhythmia
PVC definition
The PVC definition of Philos II/Talos/Cylos is made more specific than in Philos/Axios/Protos
Smallest Vx - Vs interval: 500 ms no PVC at rates below 120 bpm!(But will be counted as V-V Interval in the event counters)
At Vx – Ars – Vs sequences Vs will be classified as PVC only if: Ars – Vs > 300 ms no PVC at transion of atrial Tachycardias to the ventricle
39
Statistics. Cylos, Cylos 990, Philos II, Talos.
Ventricular arrhythmia
PVC prematurity
P-P1,000 ms
Ap Ap
Vp
Vs
PVC
ARP
AVI
VRP
BI
URI
V-V490 ms
As
Vp
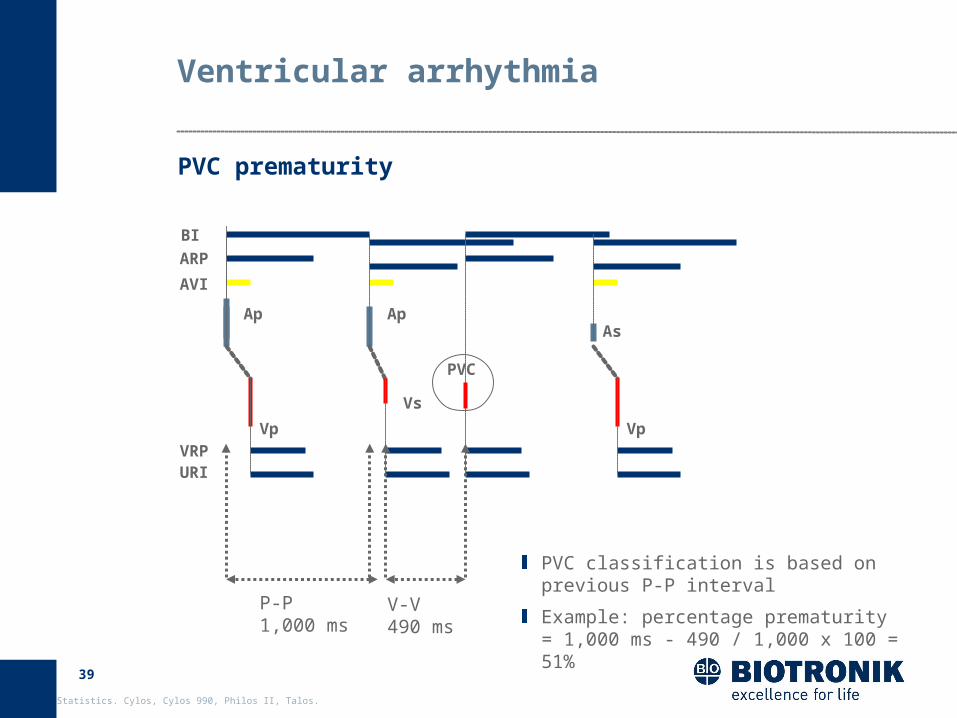
PVC classification is based on previous P-P interval
Example: percentage prematurity = 1,000 ms - 490 / 1,000 x 100 = 51%
40
Statistics. Cylos, Cylos 990, Philos II, Talos.
Ventricular arrhythmia
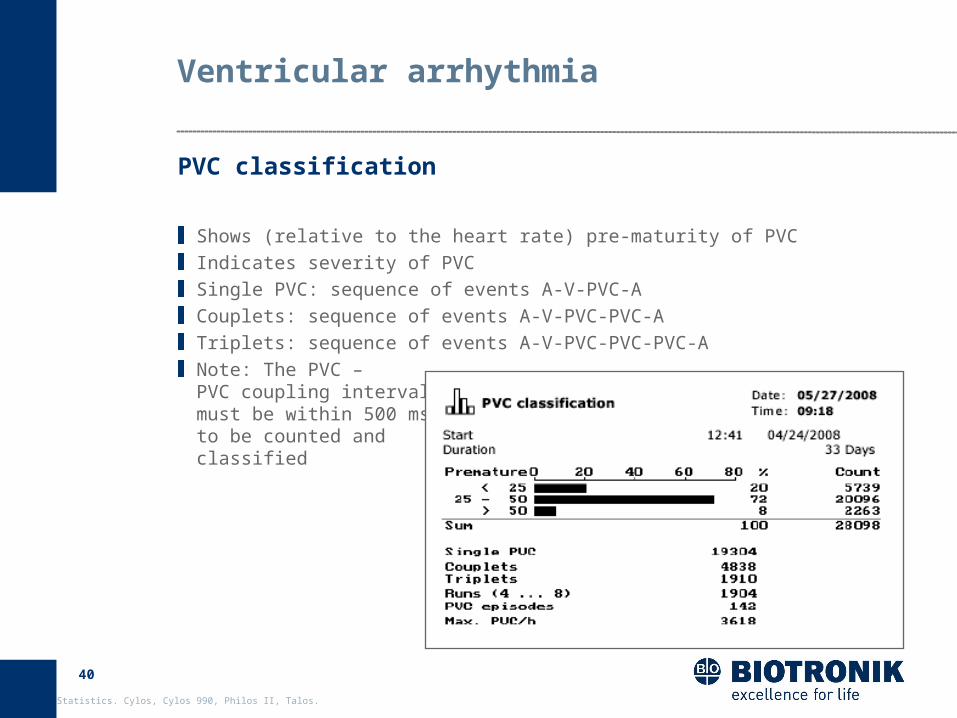
Shows (relative to the heart rate) pre-maturity of PVC Indicates severity of PVCSingle PVC: sequence of events A-V-PVC-ACouplets: sequence of events A-V-PVC-PVC-ATriplets: sequence of events A-V-PVC-PVC-PVC-ANote: The PVC – PVC coupling interval must be within 500 ms to be counted and classified
PVC classification

41
Statistics. Cylos, Cylos 990, Philos II, Talos.
Ventricular arrhythmia
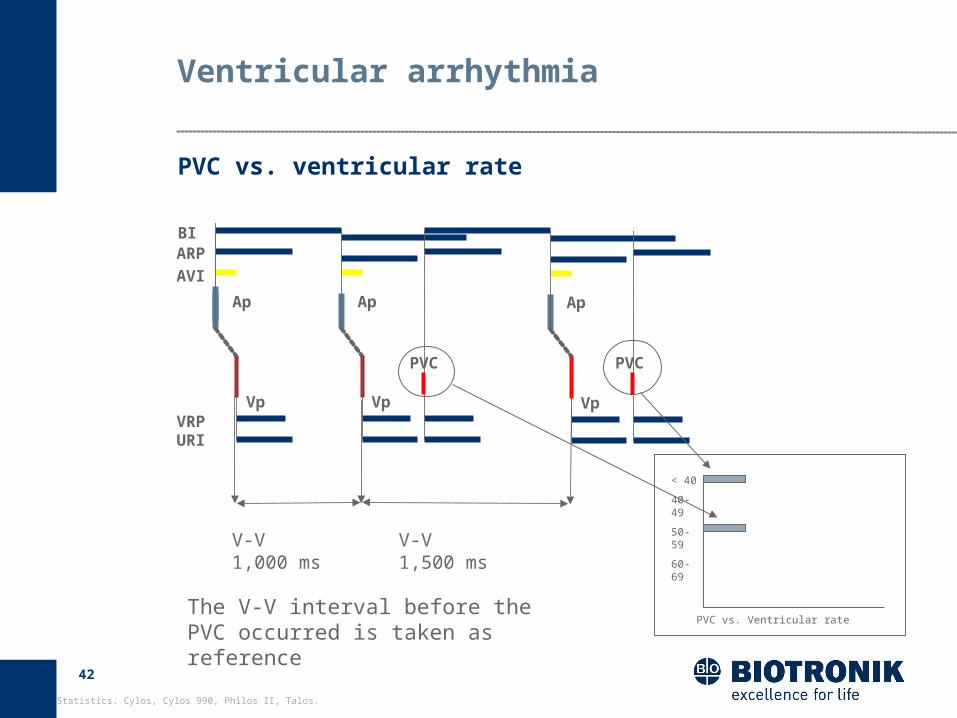
Number and percentage of PVC versus ventricular rate shows at which rate the highest percentage of PVC occur
Atrial rate divided over 16 bins (resolution 10 ppm) ranging between <40 .. (10) .. >180 ppm
PVC vs. ventricular rate
42
Statistics. Cylos, Cylos 990, Philos II, Talos.
Ventricular arrhythmia
PVC vs. ventricular rate
Ap Ap
Vp Vp
PVC
ARPAVI
VRP
BI
URI
Ap
Vp
PVC
< 40
40-49
50-59
60-69
PVC vs. Ventricular rate
V-V 1,000 ms
V-V1,500 ms
The V-V interval before the PVC occurred is taken as reference
43
Statistics. Cylos, Cylos 990, Philos II, Talos.
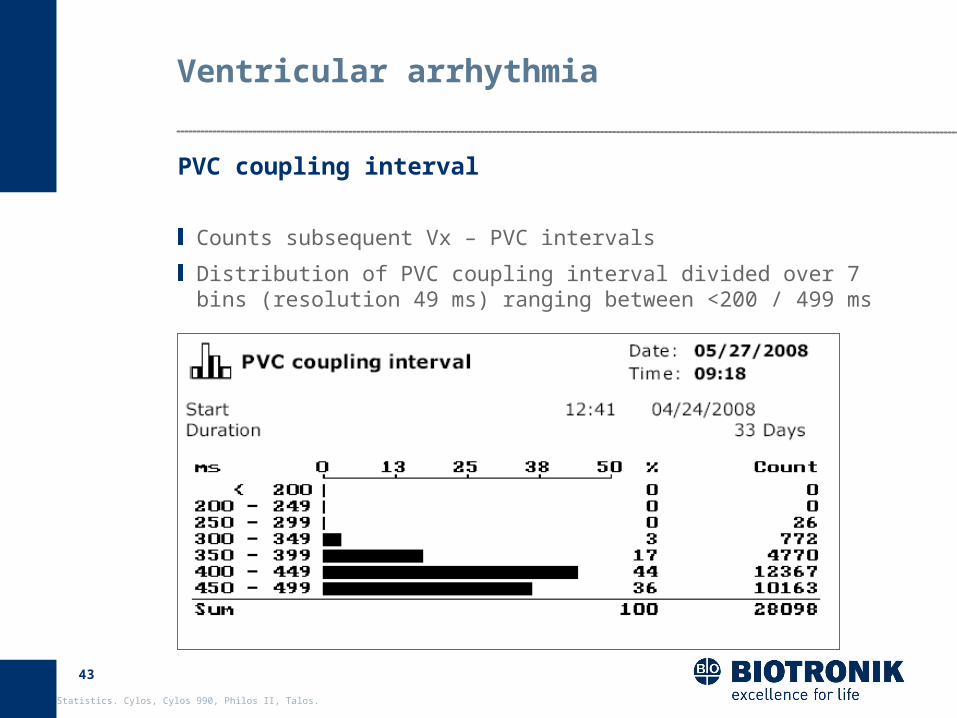
Ventricular arrhythmia
Counts subsequent Vx – PVC intervals
Distribution of PVC coupling interval divided over 7 bins (resolution 49 ms) ranging between <200 / 499 ms
PVC coupling interval

44
Statistics. Cylos, Cylos 990, Philos II, Talos.
Ventricular arrhythmia
PVC coupling interval
Ap Ap
Vp
Vs
PVC
ARP
AVI
VRP
BI
URI
Vx- PVC
450 ms
As
Vp
Coupling time between Vx and subsequent PVC

45
Statistics. Cylos, Cylos 990, Philos II, Talos.
Agenda
Timing
Atrial arrhythmia
Ventricular arrhythmia
Sensor
Sensing
Pacing

46
Statistics. Cylos, Cylos 990, Philos II, Talos.
Sensor
Records how often the sensor rate lies in a certain range.
The rate recorded depends on the pacing mode:
Atrial heart rate : VDD, DDD, AAI … + (RR equiv.)
Ventr. heart rate: DDI, DVI, VVI … + (RR equiv.)
Sensor histogram
Recording in all non-rateresponsive modes too
The sensor indicated rate is also recorded even if inhibition occurs at a faster rate
Distribution of Sensor Rate divided over 16 bins (resolution 10 ppm/bin) ranging between < 40 .. (10) .. >180 ppm

47
Statistics. Cylos, Cylos 990, Philos II, Talos.
Sensor
Maximum activity rate: Sensor indicates activity at max. sensor rate
Activity: Sensor indicates activity (not at the max. sensor rate)
No activity: Sensor does not indicate any activity
Values are expressed as percentage since last start of statistics
Activity chart

48
Statistics. Cylos, Cylos 990, Philos II, Talos.
Sensor
Continuously checks whether the rate response optimally meets the patient's needs and makes adjustments to the sensor gain when necessary
The automatic sensor gain checks daily whether 90% of the adjusted maximum activity rate (MAR) have been reached for a total of 90 seconds. If this occurs, it decreases the sensor gain by one increment
Sensor gain
If the "maximum activity rate" is not reached, the current setting will initially remain unchanged
If the MAR is not reached within a period of 7 days, sensor gain will be increased by one increment
49
Statistics. Cylos, Cylos 990, Philos II, Talos.
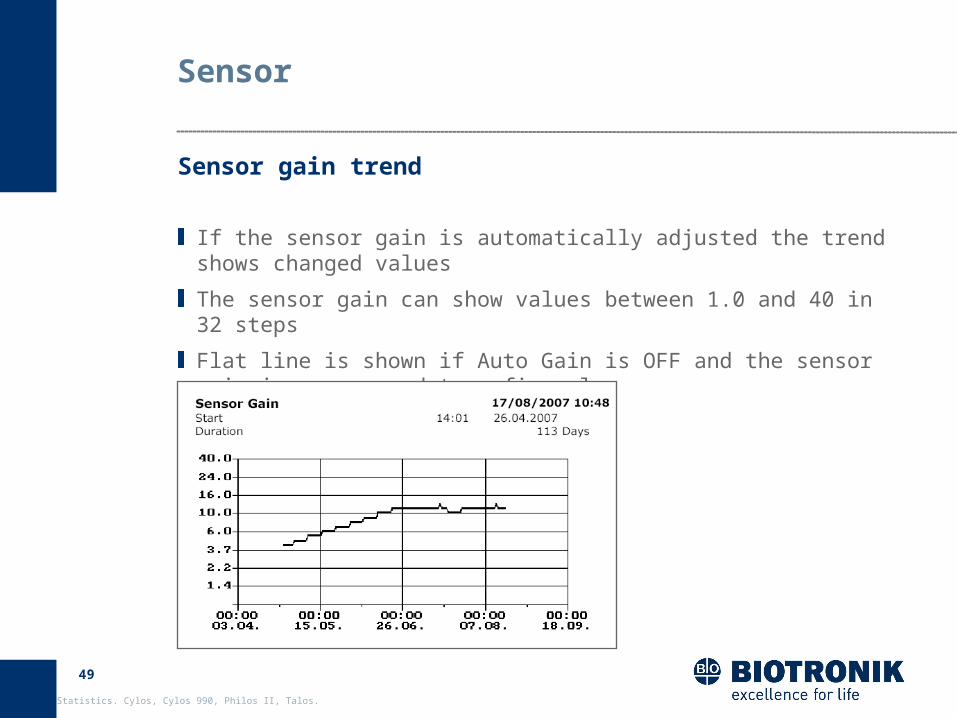
Sensor
If the sensor gain is automatically adjusted the trend shows changed values
The sensor gain can show values between 1.0 and 40 in 32 steps
Flat line is shown if Auto Gain is OFF and the sensor gain is programmed to a fix value
Sensor gain trend

50
Statistics. Cylos, Cylos 990, Philos II, Talos.
Agenda
Timing
Atrial arrhythmia
Ventricular arrhythmia
Sensor
Sensing
Pacing
51
Statistics. Cylos, Cylos 990, Philos II, Talos.
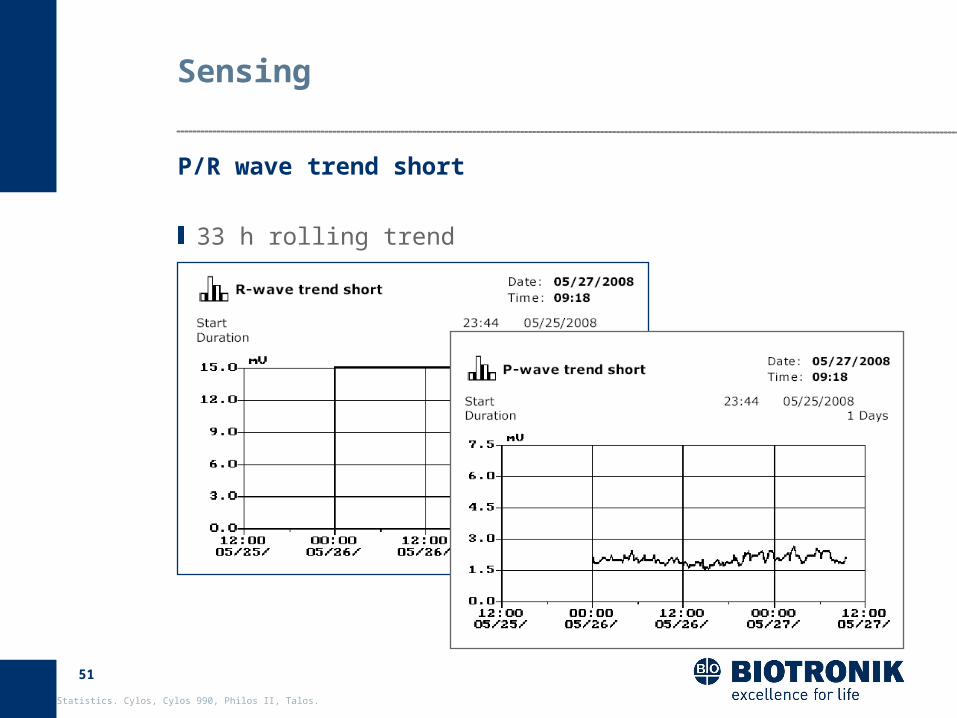
Sensing
33 h rolling trend
P/R wave trend short
52
Statistics. Cylos, Cylos 990, Philos II, Talos.
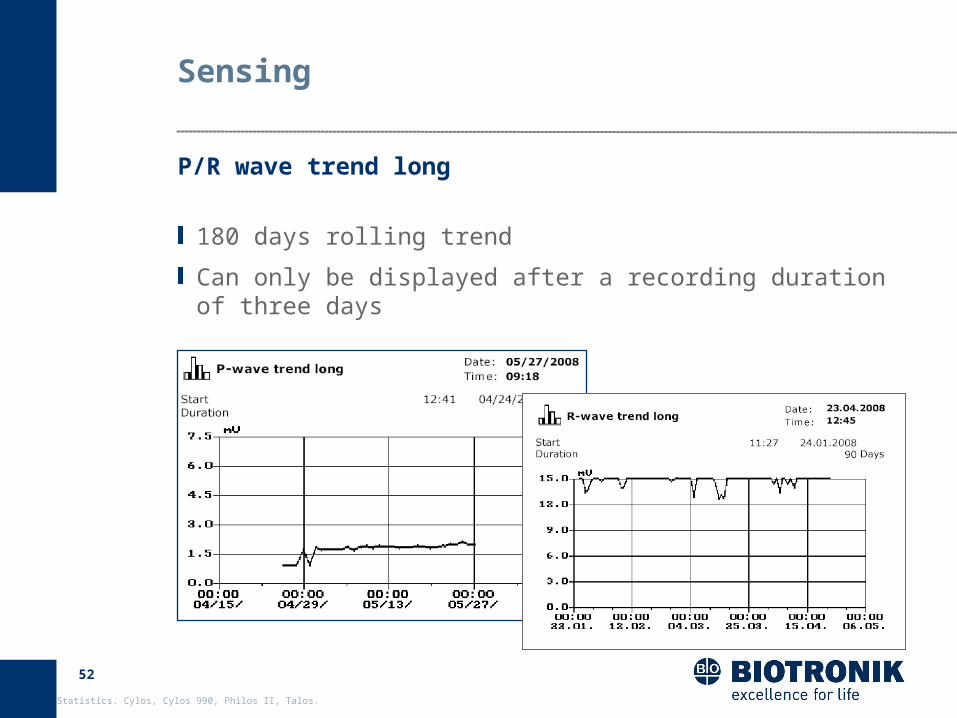
Sensing
180 days rolling trend
Can only be displayed after a recording duration of three days
P/R wave trend long
53
Statistics. Cylos, Cylos 990, Philos II, Talos.
Agenda
Timing
Atrial arrhythmia
Ventricular arrhythmia
Sensor
Sensing
Pacing
54
Statistics. Cylos, Cylos 990, Philos II, Talos.
Pacing
To make the trend independent from amplitude and pacing every 1.5 hours a measurement occurs by delivering max. 4 triggered pulses at 4.8 V or higher, depending on the program
The lead check works beat to beat in a range of 1.4 V - 5.8 V (Philos/ Protos: 2.4 V - 8.4 V). At lower amplitudes (ACC!) the lead check can not work beat-to beat, just during impedance measurement
Range of a valid impedance: 200 Ω (Philos/Protos: 300 Ω) to 3,000 Ω
The Impedance Trend is independent from the lead check and is always active (deactivation by code possible)
Impedance measurement/lead check
55
Statistics. Cylos, Cylos 990, Philos II, Talos.
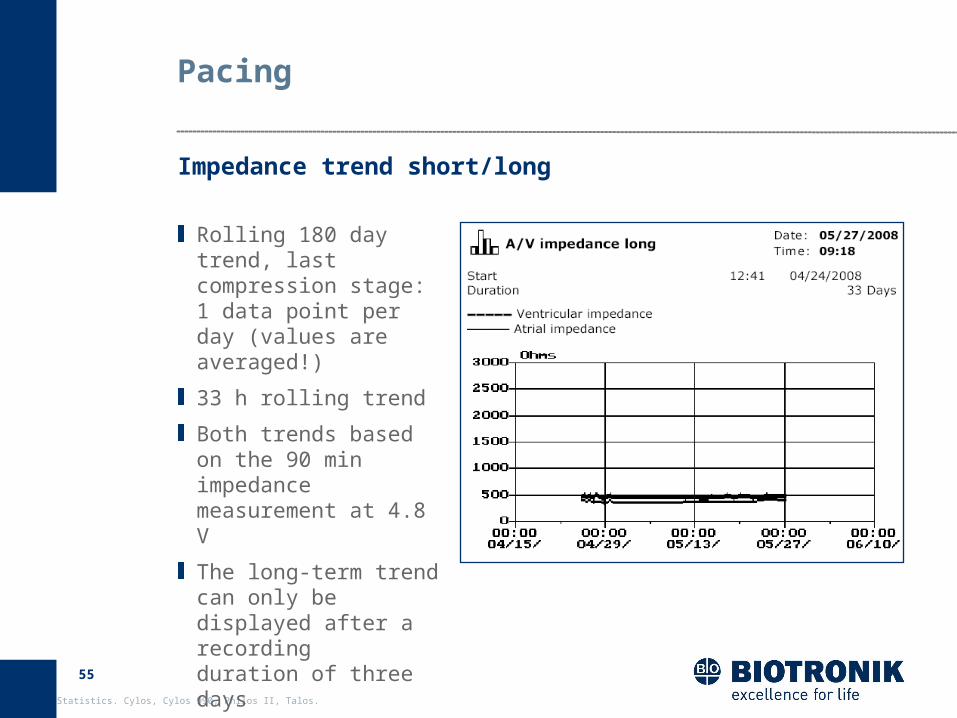
Pacing
Rolling 180 day trend, last compression stage: 1 data point per day (values are averaged!)
33 h rolling trend
Both trends based on the 90 min impedance measurement at 4.8 V
The long-term trend can only be displayed after a recording duration of three days
Impedance trend short/long
56
Statistics. Cylos, Cylos 990, Philos II, Talos.
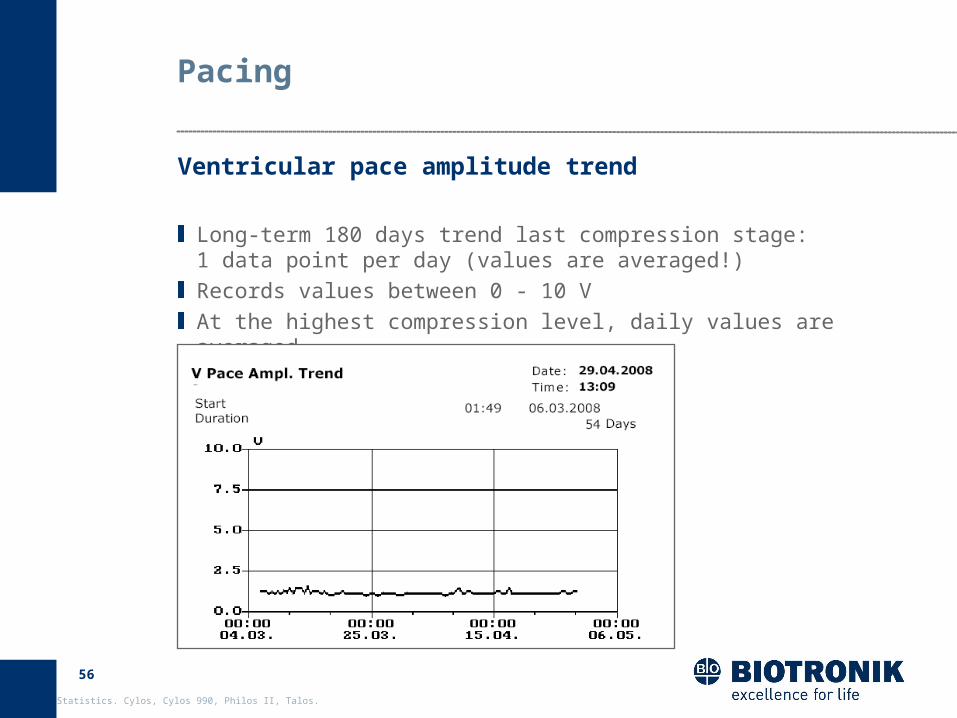
Pacing
Long-term 180 days trend last compression stage: 1 data point per day (values are averaged!) Records values between 0 - 10 VAt the highest compression level, daily values are averaged
Ventricular pace amplitude trend
57
Statistics. Cylos, Cylos 990, Philos II, Talos.
Pacing
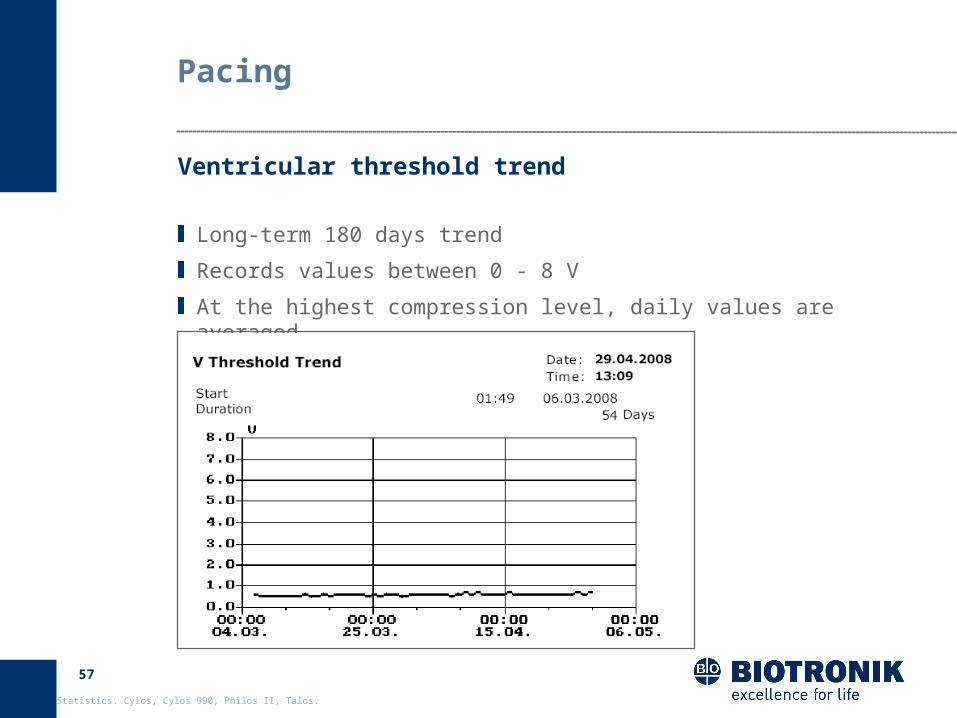
Long-term 180 days trend
Records values between 0 - 8 V
At the highest compression level, daily values are averaged
Ventricular threshold trend
58
Statistics. Cylos, Cylos 990, Philos II, Talos.
Pacing
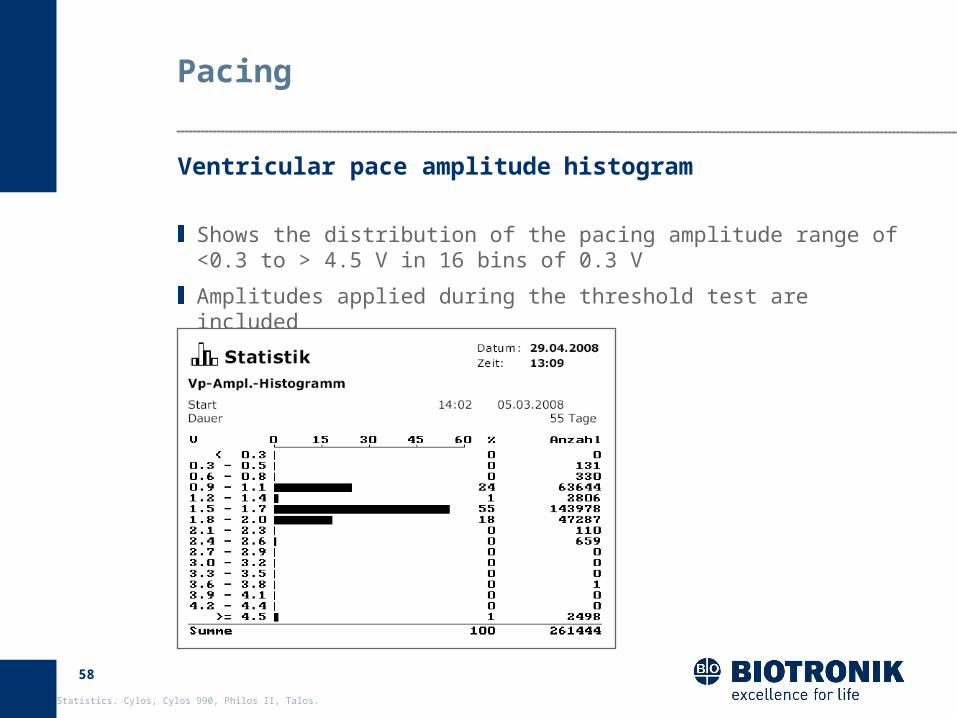
Shows the distribution of the pacing amplitude range of <0.3 to > 4.5 V in 16 bins of 0.3 V
Amplitudes applied during the threshold test are included
Ventricular pace amplitude histogram
59
Statistics. Cylos, Cylos 990, Philos II, Talos.
Pacing
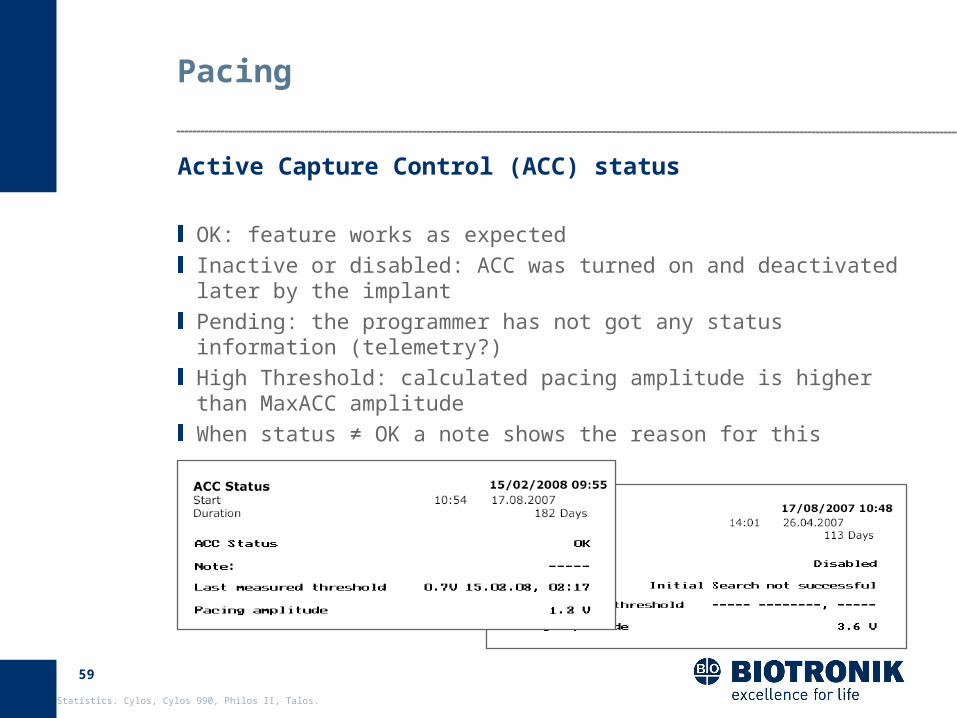
OK: feature works as expected Inactive or disabled: ACC was turned on and deactivated later by the implant Pending: the programmer has not got any status information (telemetry?)High Threshold: calculated pacing amplitude is higher than MaxACC amplitudeWhen status ≠ OK a note shows the reason for this
Active Capture Control (ACC) status
Recommended


![[David H. Lund] Persons, Souls and Death a Philos(BookFi.org)](https://img.pdfslide.us/doc/110x75/577cd0261a28ab9e7891870a/david-h-lund-persons-souls-and-death-a-philosbookfiorg.jpg)