The University of Maine The University of Maine
DigitalCommons@UMaine DigitalCommons@UMaine
Honors College
Spring 5-2021
Brand Equity in the Maine Craft Beer Industry Brand Equity in the Maine Craft Beer Industry
Gustav Anderson
Follow this and additional works at: https://digitalcommons.library.umaine.edu/honors
Part of the Marketing Commons
This Honors Thesis is brought to you for free and open access by DigitalCommons@UMaine. It has been accepted for inclusion in Honors College by an authorized administrator of DigitalCommons@UMaine. For more information, please contact [email protected].
BRAND EQUITY IN THE MAINE CRAFT BEER INDUSTRY
by
Gustav Anderson
A Thesis Submitted in Partial Fulfillment
of the Requirements for a Degree with Honors
(Marketing)
The Honors College
University of Maine
May 2021
Advisory Committee:
Dmitri Markovitch, Associate Professor of Marketing, Advisor
Jason Bolton, Academic Director of Innovation Engineering
Aaron Boothroyd, Lecturer of New Media
Margaret Killinger, Associate Professor of Honors
Rusty Stough, Assistant Professor of Marketing

2021 Gustav P. Anderson
All Rights Reserved
ABSTRACT
The state of Maine ranks third for most breweries per capita in the United States.
With the industry booming and new breweries entering the market consistently, branding
presents itself as an opportunity for differentiation and competitive advantage. The
intangible value that results from effective branding is what is commonly referred to as
brand equity. Presently, there is limited research on how brand equity applies to the craft
beer industry. In this study, David Aaker’s 1996 model for brand equity is used as a guide
to learn how breweries and consumers understand and influence brand equity. Further,
brewery and consumer perspectives are compared to discover whether or not
misalignment exists. Six Maine breweries participated in this research over three months
via semi-structured interviews, and a population of Maine craft beer consumers (N=100;
21-74 years of age) participated in an online survey. Preliminary results show that
perceived quality and brand awareness are the most important components of brand
equity and that brewery and consumer perspectives are only significantly misaligned
regarding the issue of market saturation.

iv
TABLE OF CONTENTS
CHAPTER 1: BACKGROUND 1
Problem Statement 1
Purpose Statement 2
Thesis Question 3
History of Craft Beer 3
Industry Analysis 5
Discussion of Brand Equity 7
Aaker’s Five Components of Brand Equity 11
Awareness 11
Perceived Quality 11
Loyalty 11
Associations 12
Proprietary Assets 12
Topics of Discovery 13
Branding Methods 13
Influencing Trends 16
CHAPTER 2: CRAFT BREWERY INTERVIEWS 18
Methodology 18
Sampling 18
Interview Design 19
Ethical Research 20
Analysis 21
Participants 22
Results 23
Awareness 24
Loyalty 26
Perceived Quality 27
Associations 39
Proprietary Assets 30
Saturation 31
Marketing 32
CHAPTER 3: CONSUMER SURVEY 34
Rationale 34
Methodology 35
Sampling 35
Design 36
Analysis 38
Results 41
Research Question #1 44
Research Question #2 45
Research Question #3 47
Additional Findings 51

v
CHAPTER 4: DISCUSSION & CONCLUSION 57
Discussion 57
Limitations 59
Conclusion 60
REFERENCES 62
APPENDICIES 67
APPENDIX A: IRB LETTER OF APPROVAL 68
APPENDIX B: RATIONALIZED CODES 69
APPENDIX C: INTERVIEW GUIDE 76
APPENDIX D: CONSUMER SURVEY 79
AUTHOR’S BIOGRAPHY 81

vi
LIST OF TABLES & FIGURES
Table 1: Annual growth categories in the U.S. craft beer industry 6
Table 2: Participating Breweries 22
Table 3: Facebook and Reddit survey genders 41
Table 4: Facebook and Reddit survey ages 41
Table 5: Independent sample t-test results for Reddit and Facebook SDS
responses
42
Table 6: Ranked SDS question means for impact on purchasing decisions 43
Table 7: Positive quality perceptions regarding brewery size 44
Table 8: Frequencies for price difference 45
Figure 1: Influence of style, price, and brand on consumer purchasing decisions 46
Table 9: Correlation between brewery lifestyle interest alignment and personal
values alignment
48
Table 10: Correlation between brewery personal values alignment and
sustainability efforts
49
Table 11: Difference in lifestyle interest alignment effect on heavy and light
social media followers
50
Table 12: Difference in SoP’s effect on heavy and light on-site purchasers 51
Table 13: Consumer rating of available brands in Maine 52
Table 14: Pearson correlations between recognition, community engagement,
and product collaboration
54
Table 15: Pearson correlation between age and label design 55
Table 16: Pearson correlation between age and the effect of word of mouth on
perceived quality
55

1
CHAPTER 1
BACKGROUND
Problem Statement
With the new decade comes new challenges for craft brewers; these challenges
are an increasingly maturing market and changing consumer taste. With a growing
economic impact on Maine, it is vital to understand how each brewery maintains its
brand image. Branding is an essential dimension of marketing in that it provides
additional intangible value to tangible products and services. The added value from
branding efforts creates what is known as brand equity, or the value of a brand itself. This
is a general definition based on aggregated definitions from many different outlooks and
studies. Because of the discrepancy in defining brand equity, there is an overall lack of
common terminology and agreement between business disciplines resulting in the poor
communication of ideas (Wood, 2000). Confusion on the subject has led to little research
conducted on brand equity in specific markets; this is concerning because the
establishment of brand name is a critical success factor in industries such as the craft beer
market (Lombardo, 2020). Moreover, brand equity is one of six significant sources for
competitive advantage (Ariyawardana, 2003).
With this lack of understanding of brand equity in the craft beer industry comes
the problem of consumer and company branding misalignment. While it is important for
companies to understand and curate brand equity internally, it is just as if not more
important for consumers' perspectives to be analyzed. Substantial misalignment between
2
a company’s intended brand identity and the actual perception of a brand in consumers'
minds is a common problem across industries (Ross & Harradine, 2011). As such, it is
concerning that little research has been done regarding direct consumer perception of
brand in the overall context of brand equity in Maine’s craft beer industry.
The general business problem is that with such a highly regarded and competitive
market as the Maine craft beer industry, there has been little research done into how
breweries understand and curate brand equity as well as the actual consumer reception of
branding attempts.
Purpose Statement
The purpose of this thesis is to discover how important breweries see the curation
of brand equity in providing a competitive advantage. Both consumer and producer
perspectives will be taken into account through anonymous surveys and confidential
interviews. The research will discover what kind of understanding breweries and
consumers in the Maine craft beer industry have of brand equity and what methods
breweries use to increase and measure it. Further, the emerging themes from the research
conducted will inform how important, if at all, brand equity is to brewery success as well
as how to utilize brand equity effectively. Consumer preferences for what is desired in a
brand will also be studied in order to discover whether or not misalignment exists
between company brand identity and consumer perception of that brand identity through
brand image. For this specific research, Aaker’s brand equity model will be used as a
guide and will be applied to how interviews and surveys are conducted. Aaker defines
brand equity as “a set of assets (and liabilities) linked to a brand's name and symbol that
3
adds to (or subtracts from) the value provided by a product or service to a firm and/or that
firm's customers” (Aaker, 1991, pp. 7-8). Aaker’s model fits into the customer-based
brand equity theory, which is defined as “the differential effect of brand knowledge on
consumer response to the marketing of a brand” (Keller, 1993, p. 2). As such, a brand’s
influence on customer perceptions during purchasing decisions will be the primary way
in which the effect of brand equity is studied in this research. After all, it is up to the end-
consumer to make or break a brand.
Thesis Question
What are the ways in which Maine craft breweries attempt to build and track
brand equity in the context of Aaker’s model, and which parts of Aaker’s model do craft
beer consumers identify with the most?
History of Craft Beer
The modern-day craft beer that consumers are familiar with today is a relatively
new product. Due to the ratification of the 18th Amendment in January of 1919, brewery
development of any kind was severely stunted for thirteen years during a time known as
the Prohibition era (Brewers Association, 2020). The ratification of the 21st Amendment
repealed the 18th Amendment, opening the alcohol selling industry once again. However,
by this point, the damage had already been done; many breweries and distilleries had shut
down forever. For years, large players such as Anheuser-Busch and Miller Brewing
Company dominated the beer industry in the United States, producing strictly mass-
produced lager style brews. It would be a very long time until a small craft brewery

4
opened its doors to the public. Anchor Brewing Company in San Francisco became the
first post-prohibition craft brewery, opening in 1966 (Murray & Kline, 2015). The growth
of craft breweries was slow for a period until the 1980s, after which 1,450 breweries
opened over the next two decades (Brewers Association, 2020). During this time,
Maine’s first craft brewery, Geary Brewing Company, opened in 1986. The industry
continued to see tremendous success in the years following, with the national brewery
count leaping from 1,511 to 8,386 between 2007 and 2019 (Brewers Association, 2020).
After years of growth strictly in terms of the number of breweries, the overall share of the
market craft beer holds in Maine is still relatively low. According to the Maine Brewers
Guild, only about 13.7% of the beer sold in Maine is considered craft, with the remaining
86.3% share of the market belonging to large domestic craft breweries.
The subject of what makes a craft beer truly "craft" may lead to confusion for
some consumers in today’s continually maturing and competitive brewing landscape.
With so many options on liquor store shelves and in taprooms, the question arises if all
these beers are truly defined as craft anymore. Are some beers more craft than others?
The Brewer’s Association provides some clarity on quandary with a definition of what
technically classifies a brewery as craft in nature. The three components to their
definition are that breweries must be: (1) small, with an annual production of 6 million
barrels or less, (2) independent, with less than 25% being owned or controlled by a
beverage firm that is not itself a craft brewery, and (3) a brewer, having an Alcohol and
Tobacco Tax and Trade Bureau Brewer’s Notice (Brewers Association, 2020). This
definition has been widely accepted up until recent years, as what is deemed “small” is up
for debate. Now, the industry uses Boston Beer Company’s annual production number as

5
a benchmark. Annual production less than Boston Beer Company’s is now generally
considered small and craft.
Industry Analysis
The craft beer market is heavily regulated at the federal and state level. Many
permits are required to run a brewery, including a brewer’s notice from the Tobacco Tax
and Trade Bureau, an occupancy or victualer’s license, a brewery or small brewery
license, and many more (Maine Bureau of Alcoholic Beverages and Lottery Operations,
2019). Beyond permits, the beer industry faces both federal and state taxation. Under the
Craft Beverage Modernization and Tax Reform Act, the federal excise tax rate on malt
liquor is $3.50/barrel on the first 60,000 barrels produced by breweries producing less
than 2 million barrels annually (Brewers Association, 2020). In Maine, the excise tax is
$0.35/gallon sold within the state (Maine Legislature, 2020). The Bureau of Alcohol,
Tobacco, Firearms, and Explosives also regulates the industry in terms of how alcohol is
labeled, advertised, branded, and packaged (Lombardo, 2020). One of the significant
ways the craft beer industry is controversially regulated is through the three-tier
distribution system. Under this system, the craft beer market is separated into three
distinct tiers: producers, wholesalers, and retailers (Codog, 2019). Breweries are simply
the producers in this system, and because of this, they must sign a contract with a
wholesaler to distribute their beer to retailers once they reach a certain production
number. Maine follows the three-tier system to an extent. A regular brewery that
produces more than 30,000 barrels per year must name a licensed distributor to work
with. A small brewery producing less than 30,000 barrels per year does not need to do so

6
and can distribute independently if desired (Maine Bureau of Alcoholic Beverages and
Lottery Operations, 2019, p. 2).
Last year at the national level, the craft beer industry had $7.6 billion in revenue,
$303 million in profit, and employed 16,559 people (Lombardo, 2020). The industry is
also in the midst of a growth stage in its life cycle. The industry value added is predicted
to increase at a rate of 5.0% through the coming decade while the US GDP is predicted to
only increase at a rate of 2.1%; however, industry profit has also steadily declined from
6.0% in 2015 to 4.0% as the market has become more saturated (Lombardo, 2020). This
overall slow in industry wide growth is further indicated in table 1 below.
(Lombardo, 2020)
In 2019, Colorado, Vermont, Oregon, Maine, and Alaska ranked as the top five
states for craft beer economic output per capita, respectively (Brewers Association). The
barriers to entry in the market are classified as moderate, with competition rising quickly,
start-up costs high, and regulation very high (Lombardo, 2020). Often, new entrants will
take out large loans to cover the costs of the equipment and materials needed. While this
makes for a debt heavy immediate future, it often results in long term success in that
brewing ingredients are cheaper to purchase per unit in large quantities (Lombardo,
2020).
Table 1. Annual growth categories in the U.S. craft
beer industry
Years Business Employment Wages
2015-2020 15.20% 18.80% 13.00%
2020-2025 9.40% 6.10% 5.30%

7
Marketing investment as a share of revenue in the craft beer industry has
decreased from 4.8% to nearly 4.5% since 2015 (Lombardo, 2020). With internal
competition in the industry rising, it is curious that marketing investment has not seen an
increase. Moreover, it was found recently in an IBISWorld industry report that
establishment of brand name and effective marketing techniques are critical success
factors in the craft beer industry (2020). Nevertheless, marketing expenditure still does
not show significant signs of growth even in light of recent trends.
At the state level, Maine boasts an impressive standing in the craft beer industry.
Ranked third in breweries per capita according to the Brewers Association in 2019, and
with an annual brewery growth rate that is 18% higher than the national average (Valigra,
2019), craft beer is undoubtedly a staple of Maine culture. According to a study done in
2017, the 133 breweries part of the Maine Brewers’ Guild at the time contributed $168M
to Maine’s economy, employed 1,910 people, and generated $1.5M in excise taxes
(Crawley, 2017). 87% of Maine’s craft beer industry players are considered small,
producing less than 50,000 gallons, and 45% of breweries reported that they are almost at
full capacity in terms of staff, hinting at the slowing of employment growth in the future
(Crawley). After many years of development, the overall market share craft beer holds in
Maine remains relatively low. According to information provided by the Maine Brewers
Guild during a January 2021 interview, only about 13.7% of the beer sold in the state is
considered craft, with the remaining 86.3% share of the market belonging to large
domestic craft breweries producing over 6 million barrels a year.

8
Discussion of Brand Equity
The value given to branding is a somewhat recent development. For a long time,
before the large amount of product competition and innovation we see today, good
products would simply sell themselves based mostly on performance alone. In the 1950s,
however, this changed as greater competition entered the market and companies like
General Foods and Proctor and Gamble began to allocate more significant funds toward
marketing efforts to differentiate themselves (Wasserman, 2015). Today it is estimated
that the average American consumer is exposed to between 4,000 to 10,000 branding and
advertising messages per day (Forbes, 2017). On top of this, loyalty to brands has taken
hold, as evident in ravenous consumer reaction to product releases from large companies
like Apple. Companies are now developing effective storytelling techniques to
differentiate themselves in the minds of consumers. This kind of weight put into the
importance of brand value was predicted in the 1980s and 90s. for example, Philip Morris
purchased Kraft for $12.9 billion in 1988, which was four times its book value. The CEO
of Philip Morris stated in regard to this price paid, "The future of consumer marketing
belongs to the companies with the strongest brands" (Biggar & Selame, 1992, p. 36).
Clearly, there is a value in brand; this value is expressed as brand equity.
With the many definitions and interpretations of brand equity existing in the
world today, it is hard to pinpoint exactly what accounts for it and how much of a role it
plays in marketing success. Beyond the many definitions, there have also been numerous
studies done on brand equity in all kinds of different markets, each producing varying
results. Moreover, individual companies often form their own understandings and
working definitions of brand equity, hinting that the definition of brand equity may be

9
unique to specific companies and their environments. There have yet to be any significant
brand equity studies conducted within the craft beer industry. As such, this research
hopes to provide some insight into how brand equity impacts the industry, specifically in
Maine.
For this research, David Aaker's brand equity model from his 1996 book Building
Strong Brands will be used as the primary definition for what makes up brand equity.
Widely regarded as the most prominent model for brand equity, alongside Keller's 2001
pyramid CBBE model, Aaker's research offers extensive insight into how brand equity
works. According to Aaker, brand equity is "a set of assets (and liabilities) linked to a
brand's name and symbol that adds to (or subtracts from) the value provided by a product
or service to a firm and/or that firm's customers" (Aaker, 1996, pp. 7-8). Essentially,
brand equity is a set of intangible assets that result in tangible outcomes for a company. If
a brand has positive equity, consumers are more likely to pay for that brand's product
over a similar unbranded product. The key to Aaker's theory is that brand equity is
primarily based on simple recognition and recall during split-second purchasing decisions
(Qualtrics, 2019). It is because of this reasoning that Aaker's model is the guide for this
research. As craft beer is a fast-moving consumer good, it aligns well with Aaker's theory
that brand equity stems from split-second recognition, as fast-moving goods like beer are
bought and sold quickly at low prices. The other central model for brand equity, Keller's
pyramid, focuses more on emotions and long-term relationship building with consumers.
While this kind of relationship-building may be relevant to brewery equity with
distributors, it is not entirely relevant to the individual craft beer consumer. The
individual consumer is the focus of this research in that they are the building blocks for

10
the initial stages of brand development. A company may do everything it can to develop a
brand and build relationships with distributors, but at the heart of it all, end-consumers
truly have the power to give brands value (Leone et al., 2006).
There are two major perspectives on how to interpret and analyze brand equity.
The first is referred to as the financial-based perspective. It is defined as the "financial
value that the brand generates for the firm" (Sinah et al., 2008) or "the price it (the brand)
brings or could bring in the financial market and thus reflects expectations about the
discounted value of future cash flows to an equivalent unbranded product" (Keller &
Lehmann, 2006, p. 742). It is a difficult process to quantifiably measure brand equity in
general, even for large firms that are publicly traded. In the context of the craft beer
industry, quantifying brand equity is even more difficult as breweries are privately held
companies with their financial statements not directly available to the public. As such,
this research will not focus on the financial-based perspective. Instead, this research will
deal more with the customer-based perspective, which is defined by Keller as "the
differential effect of brand knowledge on consumer response to the marketing of a brand"
(1993, p. 2). This perspective avoids financially quantifying brand equity within a
company; instead, it shifts the focus and value of equity to consumer perception. Aaker's
model falls into the customer-based perspective family as well, and as previously
discussed, applies more logically to the craft beer industry than Keller's CBBE pyramid
model.

11
Aaker’s Five Components of Brand Equity
#1 – Awareness
According to Aaker, “Awareness refers to the strength of a brand’s presence in
the consumer’s mind” (Aaker, 1996, p. 10). Awareness is measured mainly through the
two concepts of recall and recognition. Recognition refers to the ability of a consumer to
know if they have been exposed to a brand before, while recall refers to a consumer’s
ability to name the brand "off the top of their head” (Aaker, 1996).
#2 – Perceived Quality
Perceived quality is essentially the quality of a brand in the mind of the consumer,
not necessarily the actual quality of the brand or product. It is seen as “subjective
consumer judgment regarding overall product superiority, different from objective
quality” (Zeithaml, 1988). Aaker in Building Strong Brands sees perceived quality as the
driving force behind financial performance as interpreted through ROI metrics. He also
deems perceived quality important to strategic thrust, as many companies include quality
promises in their mission statements. Finally, Aaker says that perceived quality affects all
other perceptions of a firm’s brand, being the general key to the measure of “brand
goodness.” It is also important to note that perceptions of quality cannot be created
without a basis in substantive reality (Aaker, 1996).
#3 – Loyalty
In Building Strong Brands, Aaker identifies two significant reasons why loyalty is
vital to the brand equity model. First, he claims that “a brand’s value to a firm is largely

12
created by the customer loyalty it commands” (Aaker, 1996, p. 21). Second, he says that
loyalty, considered as an asset, encourages loyalty-building programs, which in turn serve
to build brand equity in the long run (Aaker, 1996). He identifies frequent buyer
programs, customer clubs, and database marketing as ways to enhance loyalty. These
three techniques utilize basic principles of customer relationship management (CRM),
which is a topic of discovery in this research.
#4 – Associations
Aaker does not go into tremendous detail about brand associations in Building
Strong Brands. He states that “brand associations are driven by the brand identity – what
the organization wants the brand to stand for in the customer’s mind” (Aaker, 1996, p.
25). According to Aaker, these associations can include product attributes, celebrity
spokespersons, or particular symbols. Keller sees brand associations relating to the
perceived benefits of a product or service, as well as the feelings, thoughts, and attitudes
that consumers have towards a brand (Camiciottoli, et al., 2014). Overall, Aaker believes
associations are key elements for a firm’s brand identity. In chapter 3 of Building Strong
Brands, Aaker defines brand identity as “a unique set of brand associations that the brand
strategist aspires to create or maintain. These associations represent what the brand stands
for” (p. 68). As such, brand identity is an attempt to position associations within the
minds of consumers. Ideally, this creates brand equity; however, misalignment can occur
between the consumer and the company – this is yet another topic of discovery in this
study.

13
#5 –Proprietary Assets
While the previous four components are identified by Aaker as the major assets of
brand equity, this fifth component is simply a minor element of the model. Aaker does
not define it, nor does he even go into detail about it in Building Strong Brands. Still, it is
a part of his model, and as such, it is included in this research. Proprietary assets, in this
case, include patents, trademarks, copyrighted material, and trade secrets.
Topics of Discovery
Branding Methods
To help guide this research, specific methods and trends that influence branding
are explored. Each of the following marketing theories might have some relevance to
how craft breweries develop their brands and relevance to Aaker’s brand equity model. It
is partially the goal of this research to discover if these methods do in fact, play any role
in craft brewery brand equity.
Sense of place branding, shortened to SoP, is a marketing technique used to
humanize a brand in the eyes of the consumer. It considers the atmosphere, shared sense
of spirit, literature, community ties, and ancestral connections of a geographical place
(Campelo, et al., 2014). Hede and Watne suggest that “SoP can create and reinforce
emotional attachments between brands and consumers” (2013, p. 2). Further, they explain
that SoP utilizes local history, stories, and folklore within product design to deepen brand
value associated with the product. Hede and Watne included thousands of breweries
across the world in their research, and they found that many craft breweries included
aspects of SoP in their branding. In the context of this particular research, SoP branding

14
is attached to the brand associations component of Aaker’s model due to its ability to
help cement a brewery’s brand image to the cultural characteristics of a region.
The concept of user imagery is another interesting topic of discovery this research
seeks to explore. Defined as “the tendency of humans to look for brands that in a way
reflect their personality” (Trez, et al., 2016, p. 37), user imagery is one of three tools
identified by Aaker (1999) to humanize a brand more. The other two tools are
anthropomorphism and personification. However, as user imagery is a more broadly
encompassing tool, it is the only one of the three that is a topic of discovery in this
research. User imagery is an important part of many industries, perhaps most notably in
the clothing industry. Parker (2005) determines that user imagery along with brand
personality need to be accounted for when assessing the importance of a brand’s overall
identity. In the case of some clothing companies more than others, consumer projection
of ideal personality types drives consumption (Parker, 2005). User imagery consumption
habits will relate to Aaker’s brand associations component in this study.
Terroir is yet another area of discovery potentially pertinent to the craft beer
industry in Maine. While difficult to fully define, terroir in strictly viticultural terms is
defined as “a region which is related to a particular area with a distinct quality of grapes
and their wines (Vaudour, 2002, p. 118). Many other factors beyond regional climate and
soil influence terroir, however. Human factors, such as cultural history, socio-economics,
traditions, and enological techniques, also play a part in terroir (Van Leewan & Seguin,
2006). More recently, terroir is starting to impact the craft beer industry. Harvey and
Jones (2018) define terroir beyond the exclusivity of the wine industry as “ecological and
cultural conditions that create a sense of group identity by engaging with and consuming

15
particular products (para. 4). This understanding of terroir applies to the explosion of the
craft beer scene in New England and Maine in particular. Harvey and Jones surveyed
eighteen New England breweries and found that they are all developing a sense of terroir
in the region by “fostering social, economic and historic connections” (para. 4). While
Maine’s climate is not necessarily conducive to agricultural terroir, there is a growing
understanding and appreciation for the cultural terroir permeating its beer. Moreover,
according to Sean Sullivan of the Maine Brewers Guild, beer tourism is actively being
promoted in Maine. This study links terroir to Aaker’s perceived quality and brand
associations components.
Another topic of discovery is customer relationship management or CRM. Chen
& Popovich (2003) define CRM as “an integration of processes, human capital and
technology seeking, for the best possible understanding of a company’s customers” (qtd.
in Gil-Gomez, 2020, p. 2). With all the online tools and metrics for CRM available to
breweries today, the question of if and to what extent they use these tools naturally arises.
In terms of this specific study, CRM relates most closely to Aaker’s brand loyalty
component. It has been found that CRM, in terms of partnerships, empowerment, and
personalization, has a positive and direct impact on customer loyalty (Lawson-Body &
Limayem, 2004). As such, this study will seek to discover what kind of use Maine
breweries have for CRM in terms of building brand loyalty.
Developing local partnerships with small businesses is another topic of discovery
as it is a growing trend in the craft beer industry. According to a 2016 study, developing
local relationships with small businesses and charities is a theme amongst successful
Maine craft breweries, where 60% collaborate with local businesses for product
16
development, and 80% donate to local charitable organizations (Leland, 2016). Local
partnerships will be explored in the context of brand associations and brand awareness in
this research. Connecting with communities through local partnerships has also been
noted as one of the most important factors in breweries building brand loyalty (Murray &
Kline, 2014), so local partnerships could be related to Aaker’s brand loyalty component
in this research.
Finally, the price-quality correlation is another topic of discovery in this research.
A positive correlation between the price of a good and its perceived quality leads
consumers to infer the quality of a product from the price of a product alone, simplifying
the purchasing decision (Pechmann & Ratneshwar, 1992). In some markets, but not all,
people expect to pay higher prices for higher quality brands (Ordonez, 1998). According
to a 2008 study, higher prices on wine increased consumer perception of the wine quality
(Plassman et al.). This price-quality correlation finding lends itself to this research in that
if it is true, premium pricing strategies in the Maine craft beer market may be utilized to
benefit Aaker’s component of perceived quality.
Influencing Trends
Beyond tactics to develop distinct components of brand equity, two exterior
industry trends have the potential to affect individual brewery brand equity. As such, they
will be topics of discovery in this research. The first trend is the spirit of coopetition
found in the craft beer industry. Since its earliest beginnings, craft beer has always
competed with macro beer for market share. While these large brewing corporations rule
the beer industry in the U.S., craft breweries are slowly chipping away at their market

17
share. Because of the “us vs. them” mentality held by craft breweries regarding macro
beer, a spirit of cooperation and coopetition exists in the industry. In a 2018 study on
craft breweries in the U.S., findings suggest that “oppositional collective identity, shared
belief that a rising tide lifts all boats, and shared belief that advice and assistance should
be paid forward, can lead to the persistence of coopetition beyond market category
emergence.” (Mathias et al., p. 3086). With these findings in mind, this research seeks to
explore whether coopetition and collaboration are prevalent sentiments in Maine’s craft
beer industry. Any coopetition themes found in this research will relate to several brand
equity components, including brand associations, brand loyalty, and proprietary assets.
The second exterior trend is market saturation. It is not clear whether the market
is yet saturated, but it is indeed maturing. Competitor growth has outpaced sales growth
in the craft beer industry nationally; this has led many to believe that the market in the
U.S. is approaching a saturation point (Morris, 2015). Details on this point specific to
Maine are evident in the industry analysis section of this study.

18
CHAPTER 2
CRAFT BREWERY INTERVIEWS
Methodology
The first half of this research focuses on the producer perspective of brand equity.
In order to discover how Aaker’s model applies to the craft beer industry in Maine,
breweries from across the state were invited to participate in remote, in-depth interviews
via zoom. Each interview lasted between 45 to 90 minutes. All interviews occurred over
the course of a three-month period. In these interviews, qualified members of each
brewery discussed their understanding and use of brand equity strategies as well as
various other topics of discovery. The goal of the interview process is to understand the
relevance of Aaker’s model to the industry and to find out which component of Aaker’s
model is the most important to brand equity.
Sampling
There are 155 breweries in Maine with over 100 brands represented as several
breweries have multiple locations and licenses (Maine Brewers Guild). In this study, six
breweries were interviewed, making up approximately 3.87% of the total population
when not accounting for breweries with multiple locations and licenses. Besides being
over the age of twenty-one, no specific demographic attributes such as mental health,
race, or gender were required of the interviewees. This study seeks to collect a diverse
and indiscriminate range of perspectives that accurately reflect brewery ownership in
Maine.

19
Brewery recruitment was based on convenience, judgment, and snowball
sampling. In the early stages, convenience sampling was used based on brewery
proximity to the University of Maine. Judgment sampling was also used in order to select
a diverse range of breweries representative of the industry as a whole. Snowball sampling
played a role in that participating breweries would sometimes assist the primary
researcher in networking with other potential participant breweries. Recruitment took
place primarily over email.
Interview Design
This research is exploratory and does not aim to provide any conclusive solutions
to the research problem. Instead, the aim is to better understand brand equity in Maine's
craft beer industry. While unstructured interviews are the most popular form of data
collection for exploratory research (Dudovskiy, 2018), this study employs a semi-
structured interview process guided by Aaker’s brand equity model. Interviews allow for
proper exploration of participant perceptions and experiences and are favorable for
qualitative research (Cachia & Millward, 2011). The data resulting from the interview
design is qualitative in nature as the questions are nearly all open-ended and geared
towards intangible branding techniques. Qualitative data is vital to the outcome of these
interviews in that it properly fulfills their exploratory nature. Quantitative methods are
less capable than qualitative methods in considering participants’ feelings, observations,
and experiences (Benard, 2013). As this research requires rich data regarding these
considerations, quantitative data is not the focus.

20
With this research yielding qualitative results, reaching data saturation is essential
to achieving satisfactory findings. As such, the interview process aims to continue until a
saturation point is reached (Saunders et al., 2018). Saturation is often described as “the
point in data collection and analysis when new incoming data produces little or no new
information to address the research question” (Guest et al., 2020, p. 2).
The interviews followed a guide (Appendix C) consisting of six major sections.
The first section is introductory and seeks to gain necessary background information on
the participant brewery. It includes basic information such as brewery age, production
numbers, employee count, and understanding of brand equity. The second and third
sections of the interview guide deal with a step-by-step exploration of Aaker’s brand
equity model as well as with topics of discovery, such as branding methods and
influencing trends. Section four asked about the financial-based perspective, while
section five asks participants to reflect on all the topics covered so far in relation to
market saturation and competitive advantage. The sixth and final section asks about
potential consumer and producer trends in the craft beer industry.
Ethical Research
This study complies with the University of Maine Policy and Procedures for the
Protection of Human Subjects of Research. The primary researcher underwent necessary
training and certification through the Collaborative Institutional Training Initiative (CITI)
to conduct research involving human subjects. Upon review, this study was officially
approved (Appendix A) by the Institutional Review Board for the Protection of Human

21
Subjects (IRB) on 9/28/2020 following several modifications. The study was judged
exempt from further review under category 2 of IRB regulations.
Analysis
This study explores qualitative themes through a semi-structured interview
process. As such, the data is coded to make sense of the emergent themes. Coding is a
process in which specific codes, or tags, are assigned to themes found in the interview
responses; these codes allow for the rapid identification of various qualitative
informational groups (Miles & Huberman, 1994).
This analysis applies deductive reasoning. Deductive reasoning is when “the
researcher looks for predetermined, existing subjects by testing hypotheses or principles”
(Bengtsson, 2016, p. 10). As such, a directed content analysis approach was chosen for
data analysis. Directed content analysis is a deductive approach to qualitative analysis,
which begins with an existing framework and uses emergent themes to support the
framework (Hsieh & Shannon, 2005). As Aaker’s framework for brand equity acts as a
guide for the interview process, it is also used here as the deductive framework. Coding
processes with deductive reasoning design require the researcher to create a list of initial
codes before beginning the official coding procedure (Bengtsson, 2016). The initial codes
in this study are the five components of Aaker’s brand equity model: Awareness (BE-
AW), Loyalty (BE-LY), Perceived Quality (BE-PQ), Associations (BE-AS), and
Proprietary Assets (BE-PA). Two extra initial codes exist based on the structure of the
interviews, these being Saturation (EX-ST) and Marketing (EX-MK).

22
Atkinson’s four-step guide to the analysis of case studies is loosely used as an aid
for this research's coding process. After the initial codes were determined, more detailed
expanded codes were formulated. These expanded codes represent smaller codes or
patterns falling within the different initial code families. After this process, Atkinson
suggests rationalizing the expanded codes. This process involves tailoring and
condensing all the expanded codes via the removal of duplications and anomalies that
may happen during their creation (Atkinson, 2002). The expanded codes were analyzed
and either deleted, merged with similar codes, or left alone. They were then all
transferred into the finalized tables of rationalized codes (Appendix B). Following the
rationalization step, it is necessary to tell the story of the data collected and either form
conclusions or propositions. Atkinson says that this process involves “linking each of the
rationalized codes to one or more of the propositions. At the end of this process, all the
rationalized codes will be associated with one or more propositions” (p. 10). To conclude
the analysis, the key findings for each initial code are discussed, with multiple
rationalized codes attached to every conclusion.
Participants
Table 2. Participating Breweries
Brewery Barrels per
year
Barrel
System
# of
Employees
Opening
Year
A 2500 20 55 2015
B 400 3.5 7 2018
C 620 10 18 2016
D 4000 20 11 2014
E 100000 60 145 1995
F 20000 30 24 2010

23
Brewery identities are confidential in this research in order to avoid the possibility
of leaking marketing secrets or sensitive industry opinions. Six breweries were
interviewed in total, with one representative from each brewery participating in the
interviews. Out of all the interviewees, only one held the position of “head brewer” while
the rest were owners or co-owners. The primary researcher was the sole person
conducting the interviews. The interview sessions lasted an average of 66 minutes, with
the longest lasting 85 minutes and the shortest lasting 35 minutes. A diverse range of
brewery size is represented in the participant pool, with the smallest brewery only
producing 400 barrels per year and the largest producing 100,000 barrels per year. The
diversity in size allows for a larger picture of what brand equity looks like at multiple
production levels. Diversity in the participant pool extends to location as well; four
Maine counties are represented. Brewery age is also diverse, with a 25-year difference
existing between the youngest and oldest participants.
Results
In this section, the results of the six brewery interviews are compiled and
discussed. Beyond the simple answers and discussion points outlined by the rationalized
codes, this study seeks to look deeper into the meaning behind the responses to draw
tentative conclusions. There was one main question asked of every interviewee that tied
all the results together. The question posed to every brewery at the end of each interview
was as follows:

24
“Out of the five components of brand equity we have discussed today, which do
you see as the most important to your business model?”
Perceived Quality (PQ) had the most selections, with breweries A, B, and F all
choosing it as the most important. Awareness (AW) came in second with two selections
coming from breweries C and D. In third, Proprietary Assets (PA) received a single vote
from brewery E. Associations (AS) and Loyalty (LY) came in last with zero breweries
selecting them as the most important. This simple poll surmises that perceived quality is
the most important component of Aaker’s brand equity model for Maine craft breweries.
The question was not asked of the participants until the end of the interviews because the
objective was to walk through each component of Aaker’s model, getting participants to
think critically about how each component applies to their specific business models. The
assumption going into the interviews was that the participants might not fully understand
the characterizations of each component, but after lengthy discussion, they would be able
to reflect on each component and make educated points.
Awareness (BE-AW)
The full results of this category are coded in Appendix B within table B1. With
awareness coming in second, receiving two votes from breweries C and D, it is generally
seen as an essential component, and it prompted lots of discussion. Perhaps the most
unique characterization for awareness is that it is seen by three breweries as the
foundational component from which the other four components of brand equity stem
(BE-AW-FN). Brewery D believes that the more awareness increases, the more potential

25
exists for the other four components to be utilized; therefore, they chose awareness as the
most important component. If this is indeed the case, it stands that building awareness in
the early stages of brewery development is a necessary first step in establishing a solid
brand. To do this, five breweries cited developing canning lines as very helpful for
building brand awareness regionally (BE-AW-CN).
Developing strong relationships with distributors and retailers is one of the most
prominent ways to increase brand awareness, with four breweries all bringing the topic
up in conversation (BE-AW-RL). A goal for brewery D early on was to develop strong
relationships with bars and retailers that sold high volumes of beer to spread positive
awareness. Brewery E measures awareness through the number of good things bar
managers have to say about them to other bar managers.
The subcategory of community engagement (AW-CE) is something many
participants hold as crucial for awareness. Four breweries all believe in authenticity when
engaging with the community (AW-CE-AU), while two believe that they hold an
obligation for leadership (AW-CE-LE). Five breweries all cite philanthropy events as key
to their community engagement efforts (AW-CE-PH).
The other subcategory under awareness is product collaboration (AW-PC). Three
breweries mention that product collaborations with other breweries do not necessarily
help large craft breweries very much; instead, the benefit is felt by smaller breweries
(AW-PC-SM). Overall, product collaborations do not seem to present a large opportunity
for growth in awareness, as three breweries said that collaborations like these have a
limited impact on awareness.

26
Based on the interview results, awareness appears to be the first step for Maine
craft breweries in building brand equity. For established breweries, awareness may be
increased through continual involvement and leadership in their local communities.
Beyond this, maintaining positive and personal relationships with tap lines and
distributors is critical. For smaller breweries, beginning a canning line and partnering
with well-known breweries and local businesses are most likely the best techniques to
build awareness.
Loyalty (BE-LY)
The complete list of codes for this category are in table B2 under Appendix B.
With loyalty receiving zero selections as the most important factor of brand equity, there
seems to be agreement among all participants that loyalty does not play a significant role
in the craft beer industry. Four participants say that end consumer loyalty is not their goal
(BE-LY-CL), while five state that loyalty is more of a factor with retailers and
distributors (BE-LY-RD). Brewery D encapsulates the root of the loyalty problem well,
saying, “inherently craft beer drinkers are experimental and not 100% loyal.” Further,
brewery C says that consumers are also simply loyal to styles instead of options. The
overall impression is that individual consumers will drink five to six other brands, as
noted by brewery D, and continually hunt for new and exciting brands when breweries
become ubiquitous.
Instead of consumer loyalty, breweries strive for loyalty from restaurants and
retailers. Breweries B and D say that loyalty plays a huge role with placement on retail
shelves and in tap lines. While end consumers cannot necessarily be relied on to

27
consistently purchase the same beer brands, it appears that retailers and restaurants stay
loyal to a brewery’s product offerings; this, however, is contingent on proper
interpersonal relationship building and consistent delivery of quality. Three breweries
noted that consistency of quality is critical to success with building retailer and
distributor loyalty (BE-LY-CQ). Brewery D mentions that being true to self and having a
consistent product creates as much loyalty as you can get in the industry.
Under the subcategory of customer relationship management (LY-CM), several
significant findings presented themselves. It appears that breweries do not place very
much value in maintaining CRM systems. Moreover, four of the participants note using
social media metrics as inconsequential to building brand loyalty (LY-CM-SM). Most
breweries have limited access to purchase data on end consumers (LY-CM-EC). Brewery
E notes that it does not know what percentage of sales in certain regions are repurchases,
making it hard to estimate loyalty. It is interesting to note that two participants say that
online ordering platforms created due to pandemic restrictions have provided better
ability to track consumer purchasing habits (LY-CM-ON).
Overall, loyalty is a very small factor in craft brewery brand equity. Since
individual consumers of craft beer are by nature experimental and averse to loyalty, an
expectation of loyalty is unrealistic. However, breweries do strive for loyalty from
retailers and restaurants.
Perceived Quality (BE-PQ)
Three breweries chose perceived quality as the most important component of
Aaker’s brand equity model, giving it the highest score in this research. All the codes for
28
this category are documented in table B3 under Appendix B. A clear-cut theme emerged
when discussing this component with participants: delivery of consistent actual quality is
the best way to build perceived quality (BE-PQ-AQ). Brewery F says they made
investments early on in consistency of quality for their flagship beer – these investments
have indeed paid off as brewery F now has one of the best-selling IPAs in Maine.
Breweries A and B say that restaurants, distributors, and consumers expect consistent
high quality; breweries build positive perceptions of quality when they fulfill these
expectations.
The primary way consistency of quality can lead to positive quality perceptions is
most likely through word of mouth. Three breweries point out that word of mouth
quickly creates perceptions of brand quality - for better or for worse (BE-PQ-WM).
Specifically, review platforms like Untapped as well as social media spread consumer
opinion quickly. Beyond the end consumer, word of mouth spreads via bars and retailers
through the discussion of experiences they have dealing with breweries.
Four breweries say that the cultural terroir of Maine helps with perceptions of
quality (BE-PQ-TR). Brewery D says natural factors like water play a significant role in
terroir, among other unique cultural aspects that are less tangible. However, brewery E
points out that while Maine's cultural terroir is helpful in theory, they cannot
quantitatively prove with confidence that it influences their perceived quality in a
monetarily beneficial way.
There is one subcategory under perceived quality, and it deals with the price-
quality correlation (PQ-CO). The overall implication from participants is that there is a
low correlation between price and perceived quality in Maine's craft beer industry (PQ-

29
CO-WC). Four breweries state that price is primarily cost-based or dictated by the
distributor (PQ-CO-CB). However, it is interesting to note that four breweries show signs
of attempting to create perceptions through pricing (PQ-CO-CP).
With three breweries selecting perceived quality as the most important
component, the question stands as to why it is valued more than awareness which came in
second with two selections. Earlier, it is suggested that awareness may be most important
for new breweries. However, upon establishment within the market, perceived quality
may take over as the most essential aspect of brand equity because it justifies all the
awareness built in the early stages of a brewery’s development.
Associations (BE-AS)
The codes for associations are documented in table B4 under Appendix B.
Associations received zero selections as the most important brand equity component.
Generally, participants do not see associating their brands with specific actions,
aesthetics, or mindsets as very important to their overall brand equity. Once again,
authenticity presents itself as a common theme, with three breweries saying that any
associations they create are not intentional; they simply strive to be authentic to
themselves (BE-AS-AU).
While participants suggest that associations are not essential to brand equity, their
use of sense of place branding (SoP) indicates that associations are not entirely neglected.
Four breweries integrate Maine imagery into their branding, believing that the terroir
associated with Maine brewing increases positive brand associations (BE-AS-ME).
Brewery E went so far as to say that they “absolutely embrace a sense of place,” while
30
brewery A believes that embracing Maine themes in branding efforts will become a
major trend moving forward. Brewery F says that while on-premises selling is a small
percentage of its business model, the associations that come with it massively impact
band value.
There is near complete agreement amongst participants regarding user imagery
(BE-AS-UI). Five breweries express that they are doubtful how important user imagery is
to brand associations and that they hardly curate user imagery at all. Brewery F makes the
point that they do not try and target specific segments or demographics through special
imagery; they simply brand in ways that are true to themselves. On the other hand,
brewery D promotes active lifestyles on social media to attract young people and create
positive associations (BE-AS-LS).
Overall, it seems that associations do not play a significant role in brand equity
within the Maine craft beer industry. While efforts are indeed made to create
associations, most notably through SoP, there is no direct or tangible benefit from doing
so. Brand associations may serve as a complimentary background to more important
components such as awareness or perceived quality.
Proprietary Assets (BE-PA)
This component of Aaker’s brand equity model received only one vote as the
most important. The fully coded results are seen in table B5 under Appendix B. The
single vote comes from brewery E, which happens to be the largest brewery in the
participant pool at 100,000 barrels produced a year. As craft beer is a reasonably open

31
industry in terms of copyrights and patented technology, participants had very little to say
about this category.
Of all the different kinds of proprietary assets, trademarks are the only somewhat
significant player in the craft beer industry. Breweries trademark their company names
and logos, but these are usually the extent of their proprietary assets. Two breweries say
that they have been involved in trademark disputes with both breweries and non-
breweries (BE-PA-TD). While protecting trademarks seems to be somewhat important,
three breweries make it clear that they want to avoid the appearance of being bullies (BE-
PA-BU). Brewery B believes fighting every potential trademark infringement hurts their
brand more than it helps.
The names of these flagship beers are identified by three participants as important
proprietary assets even though they are usually not trademarked (BE-PA-FB). The three
largest participant breweries are the ones who claim that their flagship beer names are
valuable for brand equity.
While patented processes are not necessarily a significant part of the brewing
industry, trade secrets do somewhat play a role. Breweries C and E both mention that
they have secret production methods that they do not share with competitors (BE-PA-
TS). Brewery E states that they have developed secret methods for maintaining
outstanding consistency and quality.
Overall, proprietary assets play a minor role in brand equity within the Maine
craft beer industry. Brewery E’s decision to choose proprietary assets stems from its
unique positioning in terms of history and size. Younger breweries with smaller
production numbers simply do not have the positioning advantage to effectively make use

32
of proprietary assets in the same way. However, protecting brand and beer names in a
respectable and friendly manner still plays a role in brand equity at any stage of a
brewery’s lifecycle.
Saturation (EX-ST)
The first of the extra categories outside of brand equity, market saturation is a
selected topic of discovery in this research because it provides valuable context. The full
coded results are in table B6 under Appendix B. While still a very young industry, craft
beer has seen lots of growth over recent years.
Participants in this research were each asked if they believed the current market
was saturated or simply maturing. Five of the six participating breweries say the market
is not saturated yet (ST-SR-MT). Only 18-20% of beer sold in Maine is craft, according
to brewery B. With such a small market share compared to macro beer, there is still
potential for Maine craft beer to grow (EX-ST-MS). As explained by brewery D, since
the yearly percentage of craft beer sales in Maine continues to increase, just a simple 1%
increase in market share makes room for ten more craft breweries to open.
Three breweries believe that there is a sort of stratification of saturation in the
market (EX-ST-SS). However, these breweries still believe that overall market saturation
does not exist yet. Brewery B says boutique beer retailers and restaurant tap lines are
saturated, but grocery store chains still present a viable retail opportunity. Brewery E
thinks that even though the space for large breweries is limited, plenty of room still exists
for small breweries to open as well as for current breweries to grow.

33
Four breweries claim that there is still a strong sense of friendly coopetition in the
industry (EX-ST-CP). Large breweries help small ones get started in the industry, and
neighboring breweries help increase beer tourism traffic for each other. However, four
breweries indicate that there has been a recent increase in competition (EX-ST-CM).
Marketing (EX-MK)
This is the second and last extra category of interview data. The full results are
recorded in table B7 of Appendix B. Participants were asked about the trajectory of
marketing efforts in the craft beer industry going forward. Based on this section's
responses, it appears that marketing efforts are a minor parts of brewery business models.
Most craft breweries simply do not have the employee numbers or the financial means to
make marketing a priority.
The majority of the participants say that they do not have plans to increase
marketing budgets in the future (EX-MK-NI). Breweries B and D, however, do see
themselves increasing marketing investment in the future (EX-MK-II). Moreover, both
these breweries claim that developing brand equity is a critical aspect of their businesses
(EX-MK-BC). Brewery B states, “all you have is your brand,” pointing to the product
uniformity present in the craft beer industry.
The only emergent theme regarding marketing trends going forward is that social
media might be utilized much more (EX-MK-SM). Two breweries state that they brought
on employees recently for social media development, while brewery C says that social
media will become more important as the market becomes more saturated.

34
CHAPTER 3
CONSUMER SURVEY
Rationale
Brands are only successful if consumers embrace them. As such, brand equity
clearly is not a one-sided equation – consumer perspective is as necessary to building
positive brand equity as proper producer curation is. Ultimately this research would not
fully be complete without the perceptions of craft beer consumers taken into account.
While the participant breweries do provide significant insight into how Aaker’s model
applies to the Maine craft beer industry, the opinions of craft beer consumers in Maine
are still required to paint the full picture. With the brewery interview results serving as a
basis for comparison, the results of an anonymous consumer survey with questions
relating to Aaker’s model can be used to discover whether or not there is perceptual
misalignment between consumers and producers in the industry. This kind of
misalignment between company defined brand image and consumer perception of brand
is documented in multiple industries (Ross & Harradine, 2011). More importantly, the
alignment of producer and consumer brand perspectives is sometimes a valuable source
of customer satisfaction (Anisimova, 2010). The goal of this chapter is to pose a survey
to consumers in the Maine craft beer industry to see if their opinions on various
components of brand equity are in alignment with the opinions of the six breweries
interviewed in chapter 2.
35
Methodology
Sampling
Maine craft beer consumers over the age of 21 are the target audience for the
survey. The goal is to simply capture the perceptions of Maine consumers on Maine beer.
This study does not take into account perceptions in the craft beer industry outside of
Maine. Non-probability self-selection sampling was used to acquire survey responses. As
an anonymous link to the survey was posted publicly online, it was up to every individual
whether or not they wanted to take part in the survey. As such, the survey only captures
responses of people who have a desire to share their perceptions, while excluding
responses from people much less inclined to click the survey link and spend time
responding to questions.
The social media sites Facebook and Reddit were used as distribution channels.
The Maine Brewers Guild assisted in the distribution of the survey over Facebook by
posting the survey with a brief description to their official page. From there, followers of
the Guild could decide to take the survey, and in some cases, people would even share the
survey to their own pages. The primary researcher himself posted the survey link to a
public forum on Reddit titled “r/mainebeer” along with a brief explanation of the research
and the goal of the survey. The assumption here is that the majority of Reddit users on
this forum are from Maine and actively consume and engage with Maine craft beer. As
such, they fit within the target audience for this research.
Design
The consumer survey questions are based on concepts from Aaker’s brand equity
model as well as emergent themes from the brewery interviews. While the survey

36
questions (Appendix D) do not directly ask participants about brand equity or the specific
components of brand equity, the questions do each relate to subjects that influence the
five brand equity components identified by Aaker. In most cases, the questions directly
relate to topics discussed during the brewery interviews. This approach was decided
under the assumption that the average consumer would not fully understand direct
questions relating to Aaker’s brand equity model without some kind of extensive
explanation. As a result, it is necessary to simplify the survey questions in a way that best
fits average consumer knowledge.
Several research questions have been generated going into the consumer survey
segment of this research. These questions are based on key findings from the brewery
interview process. It is the goal of this survey to not only better understand the
perceptions craft beer consumers in Maine have regarding brewery branding methods, but
also to discover if breweries are correct in some of their assumptions about consumer
behavior and preference. The following are the generated research questions:
1. Do breweries and consumers share the same perspectives regarding the price-
quality correlation?
2. Do consumers demonstrate the disloyal behavior assumed of them by breweries?
3. Do breweries and consumers share the same perspectives regarding the low
importance of brand associations?
Of the twenty-seven total questions, eighteen relate to the components of Aaker’s
model, five are categorical segmentation questions, two are demographic related, one is

37
an age verification, and one is a consent agreement. Only four components of Aaker’s
brand equity model are used in the consumer survey. The brand assets component is
excluded as it does not significantly relate to consumer perceptions in a meaningful way
and does not directly impact the purchasing decision. Six questions relate to associations,
five relate to loyalty, four relate to awareness, and three relate to perceived quality. While
the questions do not cover all areas and topics discussed during the interview process, as
to do so would result in a survey far too long, the selected questions are the most
applicable to the consumer experience and will provide insight into how craft beer
consumer purchasing habits impact Asker’s five components of brand equity.
Most of the questions directly relating to brand equity are semantic differential
scales (SDS). The semantic differential scale rates attitudes based on positions between
two bipolar extremes (Osgood et al., 1957). According to Osgood, there are three
different dimensions which the scale can measure; these dimensions are evaluation,
potency, and activity. In this research, the potency dimension is observed. Survey
respondents are asked on a 1 to 5 scale the degree to which a particular variable
influences their purchasing decision. These variables were brought up during the
interview process and each relate to one of the five components of brand equity.
The end consumer’s purchasing decision is the dependent variable for the
semantic differential scale questions. As final purchase decisions result in concrete sales
velocity feedback for breweries, it is fitting that it should be used as the variable to
describe the impact of various components of brand equity. Measuring purchasing intent
in regard to brand equity has been used several times in the past. MacKenzie et al. (1986)
first used this method in a seven-point differential scale, where they found adequate

38
reliability of results via Cronbach’s alpha. Years later, Faircloth et al. (2001) again used a
similar purchasing intent measure on a semantic differential scale to study the effects
brand attitude and brand image have on overall brand equity.
Analysis
First, determining a statistically significant difference between the two survey
populations was required. While both surveys contained the exact same questions, the
two were distributed online via two different channels. Because of this variability, it is
necessary to check the population and response differences. To check the populations,
frequency analysis was used. To test for significant difference between the means of the
SDS responses, independent t-tests were run on each question with the survey type
serving as the grouping variable. Further, a chi-square test was conducted to determine if
there was a difference between categorical responses between the two populations.
The top 2 box method was also utilized for data analysis in this research. Several
categorical and ordinal questions that previously had non-dichotomous responses were
recoded in order to assist in interpretation and to provide dichotomous categorical
grouping variables. The newly converted dichotomous grouping variables allow for
several independent sample t-tests to be run.
There is some debate on whether semantic differential data is ordinal or scale in
nature. It has been generally accepted for a while that Likert style questions are ordinal in
nature (Marateb, 2014), however, there are times when interpreting as scale is
appropriate. Harpe (2015) recommends that “individual rating items with numerical
response formats at least five categories in length may generally be treated as continuous

39
data” (pp. 842). He sees the insistence on ordinal interpretation of Likert style items as
far too strict. It is becoming more widely accepted at this point that SDS and Likert
questions can be analyzed as both ordinal and scale. For this research, all five-point SDS
questions are treated as scale, and as such, parametric tests are utilized for interpretation.
Means for the semantic differential (SDS) questions were generated and compiled
into a table in order to determine which ones were the most important to consumers. As
the SDS questions in this research are determined as scale in nature, calculating the
means is an appropriate measure for description. The SDS questions are interpreted
solely as scale throughout the entirety of the analysis. With the means in mind, further
descriptive and inferential statistics were run to help test the three research questions.
Each question is tested in its own section, with two extra sections analyzing significant
findings regarding awareness and saturation. All data analyses both, descriptive and
inferential, were conducted using the statistical software JASP. Some results were further
compiled in Excel.
For the price-quality research question, simple descriptive statistics as well as a
multinomial test were run to check if the question results regarding the price-quality
correlation are significant. The multinomial test decides whether or not the actual
proportion of responses significantly differs from the expected proportion of responses.
For the multinomial tests, a p-value of less than .05 is determined as significant in this
research. Further, contingency tables were used to show how the price-quality question
relates to quality perceptions for different size breweries.
Regarding research question #2, frequency analysis was conducted in order to
determine the general loyalty habits of the sample population. Again, both multinomial
40
tests and contingency tables were utilized in this section of analysis due to the categorical
nature of the questions regarding loyalty.
For the analysis of research question #3, the SDS questions were utilized. Most of
them related to associations in some way, and as such, were informative to the overall
importance of brand associations to end-consumer purchasing decisions. Pearson
correlations were run to determine if the SDS factors relating to brand associations were
correlated with one another. Determining these correlations is important as it ensures that
the factors relating to brand associations truly do relate to one another, thus improving
the accuracy of brewery assumptions made during the interview process. For all the
correlations, a p-value below .05 was determined as significant. A correlation coefficient
of .3 to .5 was classified as medium in strength, while anything above .5 was classified as
strong. Independent sample t-tests were also utilized in this section in order to determine
how the means of two SDS variables differ between two independent groups.
Finally, responses relating to brand awareness were analyzed to determine the
significance of its importance to the end consumer. Paired sample t-test were used to
determine if significant differences exist between the mean scores of the SDS questions.
Pearson correlations were also run to discover if any variables in the survey related to the
SDS question regarding brand recognition. Similar to the brand associations tests,
running correlations between factors supposedly pertaining to awareness aids in the
determining of whether or not actions like community engagement are truly related to
brand recognition as breweries seem to think.
41
Results
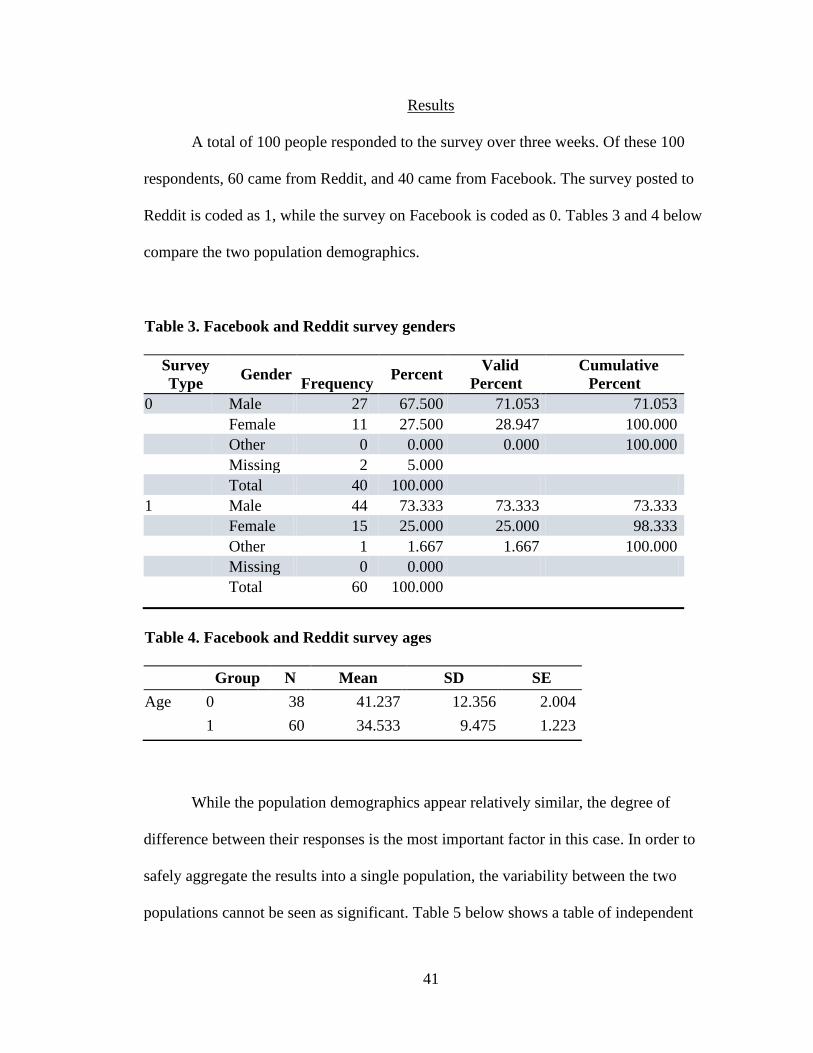
A total of 100 people responded to the survey over three weeks. Of these 100
respondents, 60 came from Reddit, and 40 came from Facebook. The survey posted to
Reddit is coded as 1, while the survey on Facebook is coded as 0. Tables 3 and 4 below
compare the two population demographics.
Table 3. Facebook and Reddit survey genders
Survey
Type Gender
Frequency Percent
Valid
Percent
Cumulative
Percent
0 Male 27 67.500 71.053 71.053
Female 11 27.500 28.947 100.000
Other 0 0.000 0.000 100.000
Missing 2 5.000
Total 40 100.000
1 Male 44 73.333 73.333 73.333
Female 15 25.000 25.000 98.333
Other 1 1.667 1.667 100.000
Missing 0 0.000
Total 60 100.000
While the population demographics appear relatively similar, the degree of
difference between their responses is the most important factor in this case. In order to
safely aggregate the results into a single population, the variability between the two
populations cannot be seen as significant. Table 5 below shows a table of independent
Table 4. Facebook and Reddit survey ages
Group N Mean SD SE
Age 0 38 41.237 12.356 2.004
1 60 34.533 9.475 1.223

42
sample t-tests testing whether there is a difference in the means of the semantic
differential scale responses between the Facebook and Reddit populations. The null
hypotheses in all tests are that there are no differences between the two sets of population
means.
The null hypotheses for ten out of the twelve tests are not rejected, as the p-values
are greater than .05. Based on these t-tests, there is overall no significant difference
between Facebook and Reddit responses. Of the twelve t-tests, only two resulted in p-
values of under .05, indicating significant differences between the two population means
regarding two SDS questions. As only two out of twelve SDS questions have significant
differences in means, it is reasonable to treat both populations as similar. Thus, the two
populations are merged into a single population for the rest of the analysis.
Table 5. Independent sample t-test results between Reddit and
Facebook SDS responses
Variables t df p
Effect of sustainability on purchasing decision 0.074 98 0.941
Effect of lifestyle interest alignment on purchasing
decision 1.109 98 0.270
Effect of brand recognition on purchasing decision 0.508 98 0.613
Effect of word of mouth on perceived quality -0.043 96 0.966
Familiarity with craft beer industry 2.763 96 0.007
Effect of personal values alignment on purchasing
decision 0.270 98 0.788
Choice of brands -2.132 96 0.036
Effect of experimental ingredients on purchasing
decision -1.194 95 0.235
Effect of SoP on purchasing decision 0.520 98 0.604
Effect of product collaboration on purchasing decision 1.920 97 0.058
Effect of label design on purchasing decision -0.554 98 0.581
Effect of community engagement on purchasing decision 1.911 98 0.059

43
To serve as a guide for the analyzing the research questions, the means of all the
SDS questions were calculated and put into a table, as seen below in table 6. In this table,
the variables can be ranked in terms of their effect on consumer purchasing decisions.
Table 6. Ranked SDS question means for impact on purchasing decisions
Beyond the mean effect on each purchasing decision variable, quality perceptions
for different brewery sizes are also interesting to note. Participants were asked to rate
their quality perceptions of different-sized breweries on a 1-5 Likert scale in order to
determine how production size alone influences perceived quality. Table 7 below
displays the results.
Variable Mean Mode
Standard
Dev Missing
recognition 3.69 4 0.96 0
experimental ingredients 3.40 4 1.10 3
personal values 3.31 4 1.20 0
product collaboration 3.31 3 1.09 1
label design 3.20 3 1.10 0
community engagement 3.19 4 1.13 0
sustainability 3.09 4 1.10 0
lifestyle interests 2.94 3 1.18 0
SoP 2.93 4 1.09 0

44
The results of table 7 were produced using a top 2 box method in which the
ordinal data from the original 5-point Likert scale questions was condensed into
categorical data that is simpler to interpret. Levels four (somewhat high quality) and five
(very high quality) for each scale were combined to produce the frequencies and
percentages of each production size. For instance, the 5,000-39,000 production size
received 57.73% positive quality scores (4 and 5), while 42.27 respondents rated it as
either neutral (3) or low quality (2 and 1).
Research Question #1
The first research question generated from the brewery interviews results is that
there is no difference between brewery and consumer perspectives on the price-quality
correlation. Based on the interviews, the consensus from breweries is that there is no
significant correlation between price and quality in the Maine craft beer industry.
Because of this, the use of premium pricing strategies to build brand equity through
perceived quality is not something breweries seek to do.
One survey question was crafted to discover if consumers truly do not associate
higher prices with higher quality. The question asked participants to select either product
quality, premium pricing, or brewery operating costs as the main reason for a price
difference between two beers of the same style and alcohol percentage.
Table 7. Positive quality perceptions regarding brewery size
barrels per year Frequency Percent Missing
5,000-39,999 56 57.73% 3
under 5,000 52 53.61% 3
40,000-100,000 40 41.24% 3
over 100,000 19 19.79% 4

45
Table 8 above shows the results of the price-quality correlation question. An
overwhelming 47% of the respondents chose operating costs as the main reason for the
price difference, while only 21% selected product quality. A multinomial test produced a
p-value of .003, indicating that the observed distribution of responses is significantly
different from an expected even distribution. It is clear here that craft beer consumers in
Maine do not associate higher-priced beer with being of higher quality. These findings
are in alignment with Maine craft brewery expectations.
Research Question #2
The second research question answered by the consumer survey asks whether or
not consumers demonstrate the disloyal behavior assumed of them by craft breweries.
The participating breweries in this research suggested that consumers do not stay loyal to
a single brand. Instead, they tend to consume multiple brands and demonstrate loyalty to
a particular beer style rather than to an actual brand name. For these reasons, Maine craft
breweries do not see loyalty as important to brand equity.
Table 8. Frequencies for price difference
Reasons Frequency
Percent
Valid
Percent
Cumulative
Percent
Product Quality 21 21.000 21.875 21.875
Premium Pricing 28 28.000 29.167 51.042
Brewery Operating
Costs 47 47.000 48.958 100.000
Missing 4 4.000
Total 100 100.000
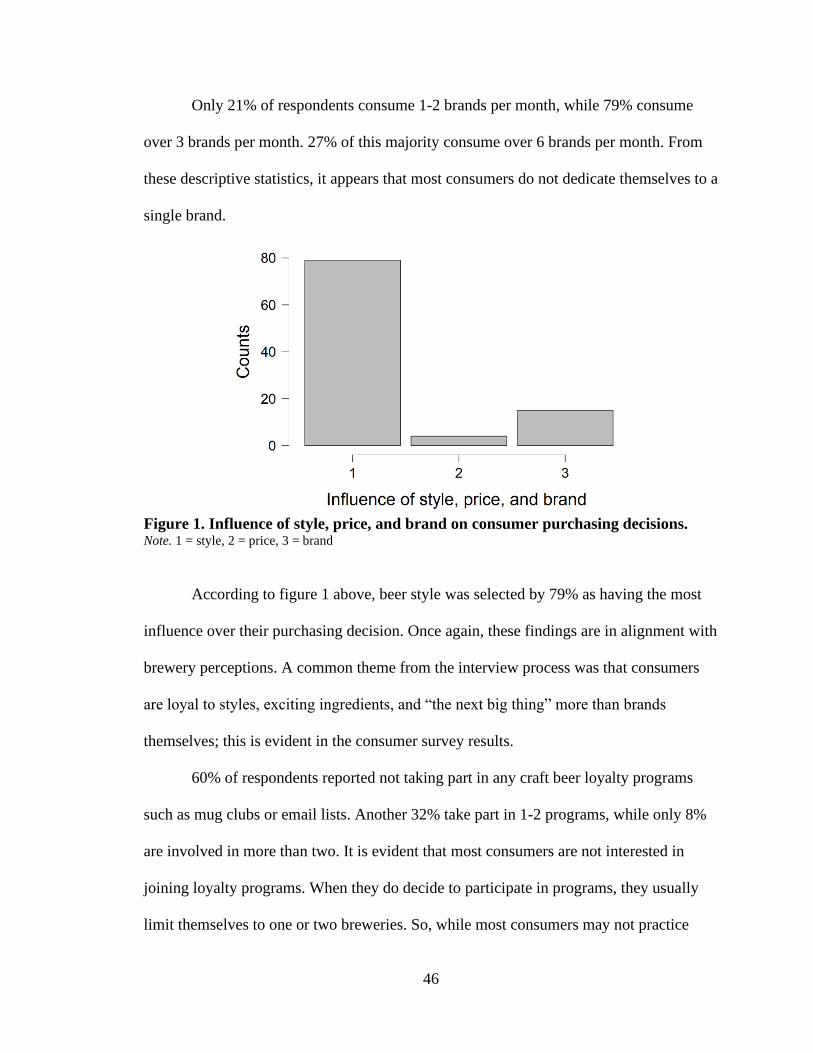
46
Only 21% of respondents consume 1-2 brands per month, while 79% consume
over 3 brands per month. 27% of this majority consume over 6 brands per month. From
these descriptive statistics, it appears that most consumers do not dedicate themselves to a
single brand.
Figure 1. Influence of style, price, and brand on consumer purchasing decisions. Note. 1 = style, 2 = price, 3 = brand
According to figure 1 above, beer style was selected by 79% as having the most
influence over their purchasing decision. Once again, these findings are in alignment with
brewery perceptions. A common theme from the interview process was that consumers
are loyal to styles, exciting ingredients, and “the next big thing” more than brands
themselves; this is evident in the consumer survey results.
60% of respondents reported not taking part in any craft beer loyalty programs
such as mug clubs or email lists. Another 32% take part in 1-2 programs, while only 8%
are involved in more than two. It is evident that most consumers are not interested in
joining loyalty programs. When they do decide to participate in programs, they usually
limit themselves to one or two breweries. So, while most consumers may not practice

47
loyalty strictly in terms of purchases, they at the very least demonstrate a moderate
amount of loyalty when it comes to participating in programs.
As a final indication of loyalty behavior, social media page followings were
measured. Nearly 70% of the population follows more than three different craft breweries
on social media, while 68% of that population follows more than five accounts. From
these results, it seems that the general consumer is interested in the content and news
produced by multiple brands.
Research Question #3
The third and final research question pertains to whether or not brand associations
significantly impact the end-consumer. Brand associations did not get a single brewery
selection as the most important component of brand equity. Many breweries indicated
that associative tools like sense of place (SoP) marketing and user imagery are
insignificant to their branding efforts.
Based purely on mean purchasing decision impact, consumers indicate that brand
associations are not very important; these results are documented in table 9. Out of all the
semantic differential scale (SDS) questions, the one regarding SoP received the lowest
mean score of 2.93 out of 5. Second to last was brewery lifestyle interest alignment, with
a 2.94/5 mean impact on purchasing decisions. However, lifestyle interests are only one
of the major aspects of user imagery. Brewery alignment with personal values, the other
aspect of user imagery, scored third highest for purchasing decision impact with a mean
score of 3.31/5. Based on these scores, it seems as though consumer perceptions are
generally in alignment with brewery expectations. Just as breweries predicted, associative

48
techniques like SoP and user imagery do not play an important role in branding.
However, the alignment of personal values does seem to be important to consumers; this
somewhat goes against brewery expectations. User imagery might be a more effective
strategy than breweries previously thought.
Several Pearson correlations were run to test if different associative qualities are
correlated with one another. By running these correlations, a clearer picture is painted as
to how different brand associations are related, if at all.
Note. Pearson correlation
Table 9 above shows results from a Pearson correlation between the lifestyle
interest alignment and personal values alignment SDS questions. The test results point to
a strong positive correlation between the two variables; this means that most respondents
who reported lifestyle interest alignment having a strong effect on their purchasing
decision also reported personal value alignment having a strong effect. This correlation
makes sense, as both variables are aspects of user imagery. However, it is curious that
personal values received such a higher mean score than lifestyle interests overall.
Table 9. Correlation between brewery lifestyle interest alignment and personal
values alignment
Variable
Effect of lifestyle
interest alignment on
purchasing decision
Effect of personal
values alignment on
purchasing decision
1. Effect of lifestyle
interest alignment on
purchasing decision
Pearson's
r —
p-value —
2. Effect of personal values
alignment on purchasing
decision
Pearson's
r 0.611 —
p-value < .001 —

49
Another Pearson correlation was run to determine if a relationship exists between
brewery sustainability efforts and brewery alignment with personal values. Table 10
below shows the results of this test.
Table 10. Correlation between brewery personal values alignment and
sustainability efforts
Variable
Effect of personal
values alignment on
purchasing decision
Effect of
sustainability on
purchasing decision
1. Personal values
alignment Pearson's r —
p-value —
2. Sustainability efforts Pearson's r 0.649 —
p-value < .001 —
Note. Pearson correlation
Based on a p-value of below .05 and r = .649, a strong positive correlation exists
between brewery alignment with personal values and brewery sustainability efforts
concerning their effect on purchasing decisions. However, brewery sustainability efforts
received a low overall purchasing decision effect score, unlike personal values alignment.
One possible interpretation of this low score is that the effect of brewery sustainability on
purchasing decisions is mediated by alignment with personal values.
Several independent sample t-tests were run to determine whether certain
consumers had more affinity than others towards associative aspects like SoP and
lifestyle interests. First, a test was run to determine if a difference in mean lifestyle
interest alignment scores exists between two populations of brewery social media account
followers. The two populations are described in table 11 below.

50
Table 11. Difference in lifestyle interest alignment effect on heavy and light social
media followers
Independent Samples T-Test t df p
Effect of lifestyle interest alignment on purchasing decision -0.391 97 0.696
Groups Group N Mean SD SE
Effect of lifestyle interest alignment on purchasing
decision 1 69 2.899 1.214 0.146
0 30 3.000 1.114 0.203
Note. 1 = three or more accounts followed, 0 = less than three accounts followed
The null hypothesis, in this case, is that there is no difference between the two
groups. A resulting p-value of .696 fails to reject the null hypothesis, suggesting that
there is no significant difference between the two population means. In other words, the
number of breweries a person follows on social media does not indicate how much
brewery lifestyle interest alignment affects their purchasing decision. This is an
interesting finding in that several participating breweries said that they try to promote
lifestyle imagery on their social media pages to build positive associations. Based on the
results of this test, it seems that heavier social media users are not necessarily swayed
more by personal interest alignment.
A second t-test determines if a difference exists between the effect SoP has on
two different groups. The two groups in question are people who buy beer on-site at
breweries two times a week or under, and people who buy on-site three times a week or
more. The two groups are summarized in table 12 below.

51
Table 12. Difference in SoP’s effect on heavy and light on-site purchasers
Independent Samples T-Test t df p
Effect of SoP on purchasing decision 2.380 96 0.019
Groups
Group N Mean SD SE
Effect of SoP on purchasing decision 0 93 2.968 1.078 0.112
1 5 1.800 0.837 0.374
Note. 0 = twice or less, 1 = three times or more
The null hypothesis is that there is no difference between the two populations.
Following an independent samples t-test, a resulting p-value of .019 rejects the null
hypothesis, suggesting a significant difference between the two population means. It
stands that people who purchase craft beer on-site less frequently, oddly enough, rate
SoP’s effect on their purchasing decision as greater than people who purchase on-site
more frequently.
Overall, it seems as if breweries are correct in their assumptions that brand
associations do not play a significant role in building brand equity amongst consumers.
However, while associations may generally be less important than other aspects of brand
equity, they cannot be discounted completely. Results suggest that consumers do see
alignment with personal values as important to their purchasing decisions; this is
something breweries should continue to focus on.
Additional Findings
Outside of the three primary research questions, there remain several additional
findings that are quite notable. While these findings do not necessarily help to answer the
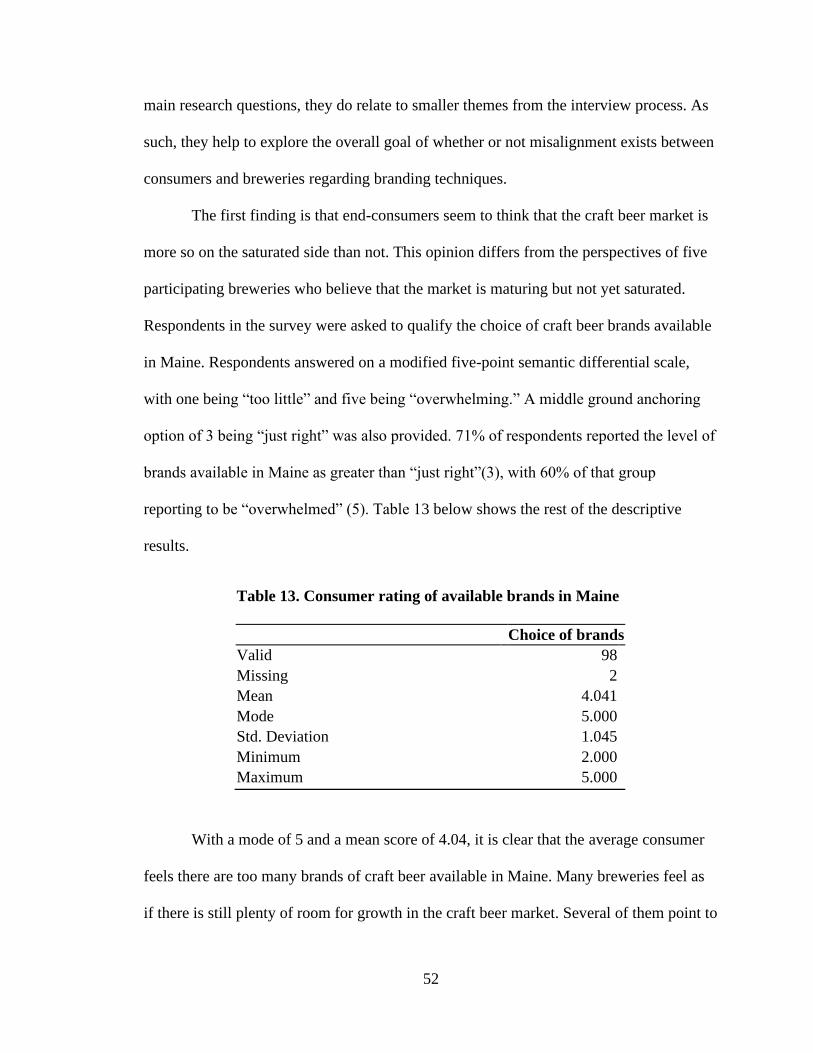
52
main research questions, they do relate to smaller themes from the interview process. As
such, they help to explore the overall goal of whether or not misalignment exists between
consumers and breweries regarding branding techniques.
The first finding is that end-consumers seem to think that the craft beer market is
more so on the saturated side than not. This opinion differs from the perspectives of five
participating breweries who believe that the market is maturing but not yet saturated.
Respondents in the survey were asked to qualify the choice of craft beer brands available
in Maine. Respondents answered on a modified five-point semantic differential scale,
with one being “too little” and five being “overwhelming.” A middle ground anchoring
option of 3 being “just right” was also provided. 71% of respondents reported the level of
brands available in Maine as greater than “just right”(3), with 60% of that group
reporting to be “overwhelmed” (5). Table 13 below shows the rest of the descriptive
results.
With a mode of 5 and a mean score of 4.04, it is clear that the average consumer
feels there are too many brands of craft beer available in Maine. Many breweries feel as
if there is still plenty of room for growth in the craft beer market. Several of them point to
Table 13. Consumer rating of available brands in Maine
Choice of brands
Valid 98
Missing 2
Mean 4.041
Mode 5.000
Std. Deviation 1.045
Minimum 2.000
Maximum 5.000

53
craft beer’s low overall market share compared to macrobeer as evidence for growth
potential. However, based on this survey’s results, they may want to consider the
consumer’s perspective on this matter more.
The second additional finding pertains to the brand equity component of
awareness. Awareness came second in the interview process as the most critical part of
Aaker’s brand equity model. Based on the results of the consumer survey, consumers
reflect the same sentiment. Brand recognition received the highest mean purchasing
decision effect score of 3.69. A paired samples t-test resulting in p = .043 revealed that
this mean is significantly larger than that of the second-highest scoring variable,
experimental ingredients.
One of the key parts of awareness is recognition. While this research looked into
product collaboration and community engagement as methods for building awareness, the
survey results point out that these variables may not help build awareness as much as
previously thought. Breweries indicated that community engagement was a high priority
of theirs that generates goodwill and awareness. Product collaboration, on the other hand,
does not contribute very much to awareness. Three Pearson correlations were conducted
to determine the relationships recognition, community engagement, and product
collaboration have with one another.

54
Based on table 14 above, there is no significant correlation between brand
recognition and community engagement. There is also no significant correlation between
recognition and product collaboration. These results suggest that while brand recognition
strongly impacts the purchasing decision, community engagement and product
collaboration may not be the best ways to achieve recognition.
The final two additional findings concern respondent age. First, it appears that a
small negative correlation exists between age and the effect of label design on purchasing
decisions. The results of a Pearson correlation run between the two variables are shown
below in table 15.
Table 14. Pearson correlations between recognition, community
engagement, and product collaboration
Variable
Effect of
brand
recognition
on
purchasing
decision
Effect of
community
engagement on
purchasing
decision
Effect of
product
collaboration
on purchasing
decision
1 Brand
recognition n —
Pearson's
r —
p-value —
2. Community
engagement n 100 —
Pearson's
r 0.139 —
p-value 0.168 —
3. Product
collaboration n 99 99 —
Pearson's
r 0.009 0.576 —
p-value 0.933 < .001 —

55
According to this correlation, the older a consumer is, the less of an impact label
design has on their purchasing decision. This is significant in that label design was
pointed out as an effective way to increase awareness by breweries. If this is indeed the
case, research needs to be conducted on how to effectively design labels for consumers
segmented by age.
The second finding relating to age is that the effect word of mouth has on
perceptions of quality has a small negative correlation with age. The result of a Pearson
correlation ran between the two variables is displayed below in table 16.
Table 16. Pearson correlation between age and the effect of word of mouth on
perceived quality
Variable Effect of word of mouth
on perceived quality Age
1. Effect of word of mouth on
perceived quality n —
Pearson’s r —
p-value —
2. Age n 96 —
Pearson’s r -0.297 —
p-value 0.003 —
Table 15. Pearson correlation between age and label design
Variable Age
Effect of label design
on purchasing
decision
1. Age Pearson's
r —
p-value —
2. Effect of label design on
purchasing decision Pearson's
r - 0.272 —
p-value 0.007 —

56
Based on a p-value of less than .05 and a Pearson’s r = -0.297, it is clear that the
older a respondent is, the less word of mouth effects their perception of a brewery’s
quality. This finding could be attributed to the fact that older people might be less
inclined to look up brewery reviews online or read social media comments. Or, perhaps it
is because they have more experience and already hold established preferences.

57
CHAPTER 4
DISCUSSION & CONCLUSION
Discussion
Many breweries see perceived quality and awareness as the most important
aspects of brand equity, while associations and proprietary assets play much smaller
roles. Loyalty is perhaps the least important brand equity component in Maine’s craft
beer industry. While loyalty is often considered one of the leading factors in building
brand equity in many other industries, breweries seem to view it as unattainable and
unrealistic due to the nature of the market and the consumers involved.
For established breweries, focusing on curating high perceptions of quality
through consistency, honesty, and complementary associations are the main contributing
factors to positive brand equity. For new entrants, building awareness through
distribution, relationship building, and community engagement is critical. While
proprietary assets currently are not a high priority for breweries, this could change in
coming years. With rising competition, trademark disputes are likely to increase. The
slow erosion of coopetition could cause breweries to develop and protect other potential
technological assets going forward, like trade secrets and patents.
Regarding consumer perspectives on brand equity, awareness again seems to be
of high importance. This is made evident through brand recognition having the strongest
effect on purchasing decisions. Experimental ingredients and the alignment of personal
values are also perceived by consumers as important, as they have the second and third

58
strongest effect on purchasing decisions, respectively. Consumers also indicate that brand
associations and loyalty are not very important to them. Just as breweries predicted, the
average craft beer consumer does not seem to display strong brand loyalty, with beer
style being the predominant reasoning behind purchase intent. Consumer perspectives on
perceptions of quality and proprietary assets are very limited in this research as not many
questions in the survey focused on these subjects.
Consumers are generally overwhelmed by how many craft beer brands are
available to them in Maine; this hints at market saturation at the end-consumer level.
While it is true that craft beer’s overall market share in Maine is still low, end-consumer
perceptions still need to be considered. Consumers also do not associate higher prices
with higher quality, which is very curious as a strong price-quality correlation influences
many industries. Based on these findings, consumers probably see the current offerings
on the market as relatively uniform. Future research should be conducted on the
reasoning for this weak price-quality correlation in the craft beer industry and how it
affects brewery marketing efforts and pricing strategies.
Overall, breweries have a fairly accurate understanding of consumer perspectives
regarding branding techniques. While there are no indications of major perspective
misalignment between breweries and consumers, there are still several small areas where
misalignment may exist. For one, breweries need to be more conscientious about how
consumers feel about the market's saturation. Going forward, consumers might become
increasingly confused about the number of options available to them and what really
makes them “craft” anymore. Further, increasing the number of brand options on shelves
in an already overwhelmed market might lead to consistently diminishing returns. The

59
second area of misalignment is how user imagery might be underutilized. Breweries
made it clear that user imagery is not critical to their branding efforts; however,
consumers rated brewery alignment with personal values as having a significant impact
on purchasing decisions.
Based on the findings of this research, breweries should consider several factors
to develop brand equity. For one, breweries should put resources towards the building of
brand awareness and perceived quality. In order to do this, breweries should seek to
maximize their brand recognition, make use of experimental ingredients, and prioritize
consistency in order to generate positive word of mouth. Breweries should generally
avoid investment into building loyalty, as craft beer consumers demonstrate considerably
disloyal behavior. However, it might be worth the effort for breweries to create online
POS systems for order and delivery; this allows for better tracking of end-consumer
purchasing data. Breweries should also avoid premium pricing strategies since consumer
loyalty is minimal and because there is a low price-quality correlation present in the
industry. Finally, breweries should seek to build brand associations by aligning their own
personal values with the values of a target market through honest and straightforward
communication and marketing.
Limitations
This research has several notable limitations. First, only six breweries out of the
one hundred and fifty-five operating in Maine were interviewed. As such, only about 4%
of the total population participated in the research. The comparison between consumer
and brewery perspectives is also slightly limited in that the data from the breweries is

60
qualitative while the survey results are a mix of qualitative and quantitative data. The
survey questions were also not the same as the interview questions, as they only
referenced Aaker’s model in indirect ways. As such, there are severe limitations to
comparing the two data sets. Self-selection bias is also present in the consumer survey, as
all participants chose to voluntarily take the survey if it interested them; this bias
potentially results in a participant pool that only reflects a specific segment of the overall
sought-after population. Finally, the survey responses were highly uniform in nature,
indicating a population with limited diversity and variance. Central tendency bias was
present, with many respondents favoring middle-ground options on Likert and semantic
differential scale questions. A larger respondent population would help reduce these
biases, increase response diversity, and increase overall accuracy.
Conclusion
Overall, Aaker’s model was helpful in analyzing brand equity in the Maine craft
beer industry. Breweries generally demonstrated a good understanding of all five brand
equity components and provided lots of insight into how they utilize each one. Perceived
quality is the most important aspect of brand equity for Maine craft breweries, while
brand awareness seems to be the most important component to Maine consumers. For the
most part, brewery and consumer perspectives on branding are in alignment. As such,
breweries presently seem to be building brand equity correctly. However, the industry
shows signs of saturation and eroding coopetition, indicating the rising importance of
unique competitive advantage. While craft breweries indeed utilize Aaker’s five
components of brand equity, there is still not enough data to show whether or not they

61
will be vital in developing sustainable competitive advantage in the coming years. For
future research, each component should be extensively studied on its own to better
pinpoint the exact strategies that drive each one.

62
REFERENCES
Aaker, D.A. (1996). Building Strong Brands. Simon & Schuster Inc.
Anisimova, T. (2010). Corporate brand: The company-customer misalignment and its
performance implications. Journal of Brand Management, 17. 10.1057/bm.2010.7
Ariyawardana, A. (2003). Sources of Competitive Advantage and Firm Performance: The
Case of Sri Lankan Value-Added Tea Producers. Asia Pacific Journal of
Management, 20, 73–90. https://doi-org.wv-o-ursus-
proxy02.ursus.maine.edu/10.1023/A:1022068513210
Atkinson, J. (2002). Four Steps to Analyze Data from a Case Study Method. ACIS 2002
Proceedings, 38. https://aisel.aisnet.org/acis2002/38
Barney, J. (1991). Firm Resources and Sustained Competitive Advantage. Journal of
Management 17(1), 99–120.
Bengtsson, M. (2016). How to plan and perform a qualitative study using content
analysis. NursingPlus Open. 2. 8-14. https://doi.org/10.1016/j.npls.2016.01.001.
Bernard, H. R. (2013). Social Research Methods: Qualitative and Quantitative
Approaches (2nd ed). Los Angeles, CA: SAGE Publications.
Biggar, J.M., & Selame, E. (1992). Building Brand Assets. Chief Executive, 78, 36–39.
Brewers Association. (2019, May 28). State Craft Beer Sales; Production Statistics.
www.brewersassociation.org/statistics-and-data/state-craft-beer-stats/.
Bureau of Alcoholic Beverages and Lottery Operations. (2019). So you want to be a
Brewery in Maine [PDF]. State of Maine.
https://www.maine.gov/dafs/bablo/sites/maine.gov.dafs.bablo/files/inline-
files/So%20you%20want%20to%20be%20a%20Brewer%20-
%20Rev%209%202019.pdf
Cachia, M., & Millward, L. (2011). The telephone medium and semi-structured
interviews: A complementary fit. Qualitative Research in Organizations and
Management. 6(3), 265-277. doi:10.1108/17465641111188420
Camiciottoli, B., Ranfagni, S., Guercini, S. (2014). Exploring brand associations: An
innovative methodological approach. European Journal of Marketing, 48(5-6).
1092-1112. 2014. 10.1108/EJM-12-2011-0770

63
Campelo, A., Aitken, R., Thyne, M., Gnoth, J. (2014). Sense of Place: The Importance
for Destination Branding.” Journal of Travel Research, 53(2), 154–166,
doi:10.1177/0047287513496474.
Chen, I. J., & Popovich, K. (2003). Understanding customer relationship management
(CRM) People, process and technology. Business Process Management
Journal, 9(5), 672–688. doi:10.1108/14637150310496758
Crawley, A. (2019). The Economic Contribution of the Craft Brewing Industry in Maine.
School of Economics, University of Maine.
https://www.craftbrewingbusiness.com/wp-content/uploads/2019/01/2018-
Economic-Impact-Report.pdf
Dudoviskiy, J. (2016). The Ultimate Guide to Writing a Dissertation. in Business Studies:
A step-step assistance. 1st Ed. research-methodology.net. http://research-
methodology.net/about-us/ebook/
Faircloth, J., Capella, L., & Alford, B. (2001). The Effect of Brand Attitude and Brand
Image on Brand Equity. Journal of Marketing Theory and Practice, 9(3), 61-75.
http://www.jstor.org/stable/40470049
Gil-Gomez, H., Guerola-Navarro, V., Oltra-Badenes, R., Lozano-Quilis, J. A.
(2020) Customer relationship management: digital transformation and sustainable
business model innovation. Economic Research-Ekonomska Istraživanja.
33(1), 2733-2750, DOI: 10.1080/1331677X.2019.1676283
Guest, G., Namey, E., Chen, M. (2020) A simple method to assess and report thematic
saturation in qualitative research. PLoS ONE 15(5). e0232076.
https://doi.org/10.1371/journal.pone.0232076
Harvey, D. C., & Jones, E. (2020, July 8) Craft Beer Is Becoming the Wine of New
England by Redefining 'Terroir'. The Conversation. theconversation.com/craft-
beer-is-becoming-the-wine-of-new-england-by-redefining-terroir-82232.
Hede, A., & Watne, T. (2013). Leveraging the human side of the brand using a sense of
place: Case studies of craft breweries. Journal of Marketing Management 29(1-2),
207-224. DOI: 10.1080/0267257X.2012.762422
Hsieh, H.-F., & Shannon, S. E. (2005). Three approaches to quantitative analysis.
Qualitative Health Research, 15(9), 1277–1288.
https://doi.org/10.1177/1049732305276687
Keller, K. L. (1993). Conceptualizing, Measuring, and Managing Customer-Based Brand
Equity. Journal of Marketing, 57(1), 1–22. JSTOR,
www.jstor.org/stable/1252054.

64
Keller, K., & Lehmann, D. (2006). Brands and Branding: Research Findings and Future
Priorities. Marketing Science, 25, 740-759. 10.1287/mksc.1050.0153.
Kim, W.-G., & Kim, H.B. (2004). Measuring Customer-Based Restaurant Brand Equity.
Cornell Hotel and Restaurant Administration Quarterly, 45(2), 115–131,
doi:10.1177/0010880404264507.
Lawson-Body, A., & Limayem, M. (2004). The Impact of Customer Relationship
Management on Customer Loyalty: the Moderating Role of Web Site
Characteristics. Journal of Computer-Mediated Communication, 9(4)
JCMC944, https://doi.org/10.1111/j.1083-6101.2004.tb00295.x
Leland, D. M. (2016). Exploring Craft Brewery Owners' Success Though Stakeholder
Involvement. Walden Dissertations and Doctoral Studies. 2364.
https://scholarworks.waldenu.edu/dissertations/2364
Leone, R. P., Rao, V. R., Keller, K. L., Luo, A. M., McAlister, L., & Srivastava, R.
(2006). Linking Brand Equity to Customer Equity. Journal of Service Research,
9(2), 125–138. https://doi.org/10.1177/1094670506293563
Lombardo, C. (2020, April). US Specialized Industry Report 0D4302: Craft Beer
Production. IBISWorld.
MacKenzie, S.B., Lutz, R.J., Belch, G.E. (1986), The Role of Attitude Toward the Ad as
a Mediator of Advertising Effectiveness: A Test of Competing Explanations.
Journal of Marketing Research, 23, 130-143.
Maine Brewers Guild. (2020, May 5). List of Maine Craft Breweries, Brewpubs, Tasting
Rooms and More. mainebrewersguild.org/visit-breweries/our-breweries/.
Marateb, H. R., Mansourian, M., Adibi, P., & Farina, D. (2014). Manipulating
measurement scales in medical statistical analysis and data mining: A review of
methodologies. Journal of research in medical sciences : the official journal of
Isfahan University of Medical Sciences, 19(1), 47–56.
Mathias, B.D., Huyghe, A., Frid, C.J., Galloway, T.L. (2018). An identity perspective on
coopetition in the craft beer industry. Strat Mgmt Journal, 39, 3086 -
3115. https://doi-org.wv-o-ursus-proxy02.ursus.maine.edu/10.1002/smj.2734
Morris, C. (2015, May 16). Is craft beer in a bubble? Fortune Magazine.
Murray, A., & Kline, C. (2014). Rural tourism and the craft beer experience: factors
influencing brand loyalty in rural North Carolina, USA. Journal of Sustainable
Tourism, 23(8-9), 1198-1216. DOI: 10.1080/09669582.2014.987146

65
Narang, G., & Mishra, M. (2014). Statistical approach to consumer decision
making. Global Journal of Emerging Trends in e-Business, Marketing and
Consumer Psychology, 1(1), 16-29.
Osgood, C.E., Suci, G.J., Tannenbaum, P.H. (1957). The Measurement of Meaning.
University of Illinois Press, Urbana, Illinois.
Parker, B. (2005). This Brand's for Me: Brand Personality and User Imagery Based Self-
Congruity. University of Florida. https://ufdc.ufl.edu/UFE0012900/00001
Pechmann, C., & Ratneshwar, S. (1992). Consumer covariation judgments: Theory or
data driven. Journal of Consumer Research, 19, 373-386.
Plassmann, H., O'Doherty, J., Shiv, B., Rangel, A. (2008). Marketing actions can
modulate neural representations of experienced pleasantness. Proceedings of the
National Academy of Sciences. 105(3). 1050-1054. DOI:
10.1073/pnas.0706929105
Qualtrics. (2020, July 24). Brand Equity: Keller vs Aaker Brand Equity Models.
www.qualtrics.com/experience-management/brand/keller-vs-aaker/.
Romaniuk, J., & Ehrenberg, A. (2012). Do Brands Lack Personality? Marketing Theory,
12(3), 333–339, doi:10.1177/1470593112451380.
Ross, Jill & Harradine, Rod. (2011). Fashion value brands: The relationship between
identity and image. Journal of Fashion Marketing and Management, 15, 306-325.
10.1108/13612021111151914.
Saunders, B., Sim, J., Kingstone, T. et al. (2018). Saturation in qualitative research:
exploring its conceptualization and operationalization. Qual Quant, 52, 1893–
1907. https://doi.org/10.1007/s11135-017-0574-8
Tellis, G. J., & Wernerfelt, B. (1987). Competitive Price and Quality under Asymmetric
Information. Marketing Science, 6(3), 240–253. JSTOR,
www.jstor.org/stable/183896.
Trez, C. D. (2016). Consumer identity and brand image in the craft beer industry: case
study analysis of Leopold 7 in South Africa. Louvain School of Management.
Valigra, L. (2019, Jan. 17). Craft Brewers Boost Maine Economy by $260 Million.
Bangor Daily News. bangordailynews.com/2019/01/16/business/craft-brewers-
boost-maine-economy-by-260-million-per-year/.
Van Leewen, C., & Seguin, G. (2006). The concept of terroir in viticulture. Journal of
Wine Research, 17(1), 1–10.

66
Vaudour, E. (2002). The quality of grapes and wine in relation to geography: Notions of
terroir at various scales. Journal of Wine Research, 13(2), 117–141.
Vomberg, A., Homburg, C., Bornemann, T. (2015). Talented people and strong brands:
the contribution of human capital and brand equity to firm value. Strat. Mgmt.
Journal, 36, 2122-2131. doi:10.1002/smj.2328
Wasserman, B. (2015). Valuation of Intangible Assets: Should Brand Equity Be
Accounted for on the Balance Sheet? University of Connecticut Honors Scholar
Theses. 411. https://opencommons.uconn.edu/srhonors_theses/411
Wood, L. (2000), "Brands and brand equity: definition and management", Management
Decision, Vol. 38 No. 9, pp. 662-669.
https://doi.org/10.1108/00251740010379100

67
APPENDICIES

68
APPENDIX A: IRB APPROVAL LETTER

69
APPENDIX B: RATIONALIZED CODES
Table B1. Awareness Codes
General Code Category Code Specific Code Code Decription Brewery Summary
BE AW CN Benefit of introducing canning line Acan art is distinct and helps differentiate the brand. Famous artist makes
all designs
Brecent introduction of canning line increased awareness locally and in
new regions
Ccan art incorporates distinct geometric shapes and bright colors that
makes brand pop on shelves
D canning with savvy distributor
F first brewery in state to launch 12oz cans
BE AW FN Awareness as a foudnation B see as umbrella for other components
C without it, can't really use the other components
Dthe more it increases, the more potential there is to utilize other 4
components
BE AW FL Significance of flagship beer D every IPA drinker in state knows their flagship beer's name
E flagship staple beer on tap in nearly every maine bar
F best selling IPA in maine and first IPA of its kind in the state
BE AW TO Beer tourism ABeer Trail has helped gahter new consumers tremendously well due to
their strategic location
B Beer Trail helpful so far for growth
Cmaine's high reputation makes Beer Trail popular which in turn helps the
brewery's traffic
BE AW RLRelationship building with
retailers/distributorsB
hired sales person specifically to work with building awareness through
relationhip building in local area
Dsignificant goal early on was to travel to bars with high beer sales and
build relationships with them for placement
Emeasure awareness through the good things bar managers and
distributors say about working with their brand
F limited release beer retail placement is very relationship based
Category CodeSub-Category CodeSpecific Code Code Decription Brewery Summary
AW PC NA ability to reach new audiences B cross promtion helps reach people they would not normally reach
D co-branding with non-breweries brings in whole new consumer base
AW PC SM small breweries benefit the most A reached out to very large brewery and was declined
E young breweries should absolutely utilize
Fhave done collaborations in past to help increase awareness for smaller
breweries
AW PC LW low significance towards awareness A done many in past, but does not really to help with awareness
B not a key part of identity
E collaborations do not help their own brewery because already so large
Category CodeSub-Category CodeSpecific Code Code Decription Brewery Summary
AW CE AU authentic in engagement A intent is not to benefit, intent is to be authentic and true to self
D participate in progressive events true to their heart
E "do the right thing and good will come out of it"
F do not do for own benefit, do because true to what they believe in
AW CE PH philanthropic efforts A vetrans, dogs, and cancer events
B local charity events
D political and academic events
E enviroment and sustainability events
F speciality beer lines dedicated to parks and other philanthropic groups
AW CE LE obligation for leadership D engage in guerilla marketing through being a leader in the community
Eenviromental impact of brewing gives obligation to be a leader in the
community - start conversations
Awareness (BE-AW)
Independent Codes
Product Collaborations (AW-PC)
Community Engagement (AW-CE)

70
Table B2. Loyalty Codes
General Code Category Code Specific Code Code Decription Brewery Summary
BE LY RD loyalty is a factor with retailers/distributors B loyalty plays a large role in keeping tap lines with bars
C restaurants aremuch more loyal than consumers
D Loyalty plays a huge role on the distributor/tap line side of thing
E overall they find strong loyalty present in tap lines
F loyalty comes from distributors and retailers
BE LY CQconsistency in quality builds loyalty with
distributors/retailersB
promise and delivery of consistent quality is the reason some
tap lines are loyal
C consistency and awareness help keep tap space in restaurants
Dbeing consistent in product and being true to self creates as
much loyalty as you can get
BE LY CL end consumers not loyal in the industry B
getting brand loyalty is very tough because consumers like to try
new things. If brand becomes too unbiquitous, consumers seek
new options
C people are more loyal to beer styles than beer brands
D"inherently craft beer drinkers are experimental and not 100%
loyal." They drink 5-6 other brands, need to accept.
Fconsumers have loyalty to Maine craft beer, but not necessarily
individual brands.
Category Code Sub-Category Code Specific Code Code Decription Brewery Summary
LY CM SMdo not see tracking social media user metrics as
critical to loyaltyA
can track via Facebook and Instagram POS, but do not see as
heavily needed
B do not track metrics on social media very much
Dunderstanding individual local consumers is a "smaller piece of
the pie compared to distributors."
E
Tracking demographics through social media not seen as
important. Unreliable source for describing whole consumer
base
LY CM ONonline orders due to pandemic helps track
consumer purchasingC
POS system with recent online ordering platform has helped
track individual consumer preferences
Fpandemic brought about delivery which allowed for a little more
ability to track consumer loyalty
LY CM RG track retail sales rates regionally Dtarget retailers that sell high volumes of beer, promote product
in high sales volume regions
E track sales velocity/repurchase rates in regions
F look at trends and velocities of beer sales in locations
LY CM EC limited/no purchase data on the end consumer Chave a difficult time measuring/quantifying consumer
demographics, but would love to have the information
Dunderstanding consuming habits of individual local consumers
doesn’t give them what they are looking for
EUnsure of how much of sales velocity is new consumer
acquisition vs. repurchase rates
F do not have a way to track sales trends down to individual level
Loyalty (BE-LY)
Independent Codes
Customer Relationship Management (LY-CM)

71
Table B3. Perceived Quality Codes
General Code Category Code Specific Code Code Decription Brewery Summary
BE PQ AQ consistent actual quality A consistent high quality is expected
Bconsistent high quality is expected from tap lines and
consumers
Efocus on making best quality product on market - have
maintained for a long time
Fmade investments into quality and consistency early on with
flagship
BE PQ TR cultural terroir of Maine B Maine beer has good reputation and this helps
Cbeer tourism is huge in maine due to the state's high
reputation
Dmaine has great reputation due to successful big brands,
water, and culture of excellence
Ecannot back up with confidence that being from maine
influences them in monetarily beneficial way
BE PQ WM word of mouth/reviews A yelp and untapped give expectations
Cuntapped and social media. Untapped stars dictate selection
for delivery startups like Tavour
D hire PR teams to get a lot of press when doing events
Category Code Sub-Category Code Specific Code Code Decription Brewery Summary
PQ CO CBpricing is mostly cost based or
distributor basedA
price is tied to cost of goods more so than quality or premium
pricing
C work closely with distributors when pricing
Dbrand managers who work for distributors are heavily
involved in pricing
Fonce in a distribution tier, you have very little flexibility with
pricing
PQ CO WCweak correlation between price
and percieved qualityA price point does not dictate quality
Esmall minority may think price = better, but overall this is not
the case
FNew and exciting beers are hot items that will sell no matter
the price
PQ CO CP create perceptions through price B"approachable but still premium" - some companies charge
premium even though most beer is same level of quality
Cbenchmark prices to comparable breweries in local area -
want consumers to associate beer to quality competitors
Ecomfortable with costing a little extra and reflecting the cost
in being a high quality company
Fearly on, aligned pricing with that of bigger brands with
economies of scale
Percieved Quality (BE-PQ)
Independent Codes
Price-Quality Correlation (PQ-CO)

72
Table B4. Association Codes
General Code Category Code Specific Code Code Decription Brewery Summary
BE AS AU authenticity Aintent is always to ge genuine when associating
with anything
E try to be true to selves when promoting interests
F do things true to self
BE AS UI user imagery A do not think about it much at all
Bdoubtful how many choose their beer due to
imagery
C do not utilize user imagery
D
use fun artwork and social media to draw in
young people who don't take themselves
seriously
E not a significant thing they try to do
F do not target certain segments or demographics
BE AS LSactive lifestyles promoted
on social mediaD focus on lifestyle imagery
E
show stuff regular people do not ever do so their
audience can witness and enjoy it in a small way
through them
F "blue collar, gritty, worker's beer"
BE AS OP on premises Arestaurant is right on water and has a german
beer hall vibe - plays large role
E built on an on-premise model
Fon premise is small percentage of business but
massively important to intangible value
BE AS ME maine imagery in branding Abelieves lots of breweries will hop on maine
theme marketing
Dpromotes active lifestyles in famous maine
places
E"absolutely embrace a sense of place". Use
scenery of maine in brand
F outdoors and maine are major associations
BE AS LMuse of local landmarks in
brandingB
use landmarks of local region regularly for labels
and names
Fuse landmarks from maine on labels and
sometimes for name inspiration
Associations (BE-AS)

73
Table B5. Proprietary Assets Codes
General Code Category Code Specific Code Code Decription Brewery Summary
BE PA TDinvolved in
trademark disputeA
have spent high legal fees
on going up against large
domestic brewery over
trademark
F 7 current ongoing
trademark fights
BE PA BUavoidance of
bully imageryA
have friendly agreements
across country with
businesses regarding fair
use
B
believe it would hurt brand
to fight every potential
trademark infringement
D
need human connection
when protecting copycat
issues. Communication is
key
BE PA TS trade secrets Csecret methods for making
sour beers
Edeveloped secrets for
consistency and quality
BE PA FBflagship beer
names hold valueD
always should protect
flagship beer name and
imagery. Distinct names of
beer hold value.
E
longstanding and well
recognized flagship beer
has iconic brand status
F
all trademark fights
currently are to protect
flaghship beer
Proprietary Assets (BE-PA)

74
Table B6. Saturation Codes
General Code Category Code Specific Code Code Decription Brewery Summary
EX ST SSstratification of
saturationB
botique beer retailers and restaurant tap lines
are saturated, but grocery store chains are
good opportunity
Dnot much room for breweries to go national
from Maine
E
space for large breweries is limited; space for
small breweries and growth of existing
breweries remains
EX ST MS
small market
share compared
to macro
breweries
B only 18%-20% of beer sold in Maine is craft
D
every year, the percentage of craft beer sales
goes up. 1% increase makes room for 10 more
breweries
EX ST CP strong coopetition BIs helpful in small towns to have neighboring
brewery
Clarge breweries help smaller breweries,
brewer's guild helps with relationship building
Dfriendly coopetition still exists. Sense of
togetherness is still very important.
F
incredibly collaborative market; discussions are
around how to move maine craft beer forward
as a whole
EX ST CMincreasing
competitionA
everyone is still friendly, but trade secrets are
not given out as much anymore
Berosion is happening within friendly
competition
Dwant to make sure their own company is
winning. will not collaborate with bad brands.
F "so much competition"
Category Code Sub-Category Code Specific Code Code Decription Brewery Summary
ST SR MT Maturing B mature but not saturated yet
C still maturing, but getting close to saturated
D maturing
E "very crowded market place"
F do not think the market is saturated
ST SR ST Saturated Ahas been lost in the shuffle with distributors
because they deal with too many brands
Saturation (EX-ST)
Independent Codes
Overall Saturation Rating (ST-SR)

75
Table B7. Marketing Codes
General Code Category Code Specific Code Code Decription Brewery Summary
EX MK SMsocial media
importantB
one employee brought on strictly for social media
promotion
Csocial media will become more important as market
becomes saturated
Fbrought on one employee strictly to engage with
consumers through social media and email
EX MK BCbrand equity is
criticalB "all you have is your brand"
Ddeveloping brand equity through marketing is most
critical point of business
EX MK NIwill not increase
marketing
investment
Amarketing will become smarter, but budgets will not
increase towards it
C
do not see themselves bringing on anyone
specifically for marketing for a long time. Need to be
much bigger.
E comfortable with large marketing investment as is
F no increase in marketing budgets
EX MK II
will increase
marketing
investment
Bsees company investing more in marketing in the
future
Dconsistently try to learn from young people and stay
fresh in image
Marketing (EX-MK)
Independent Codes
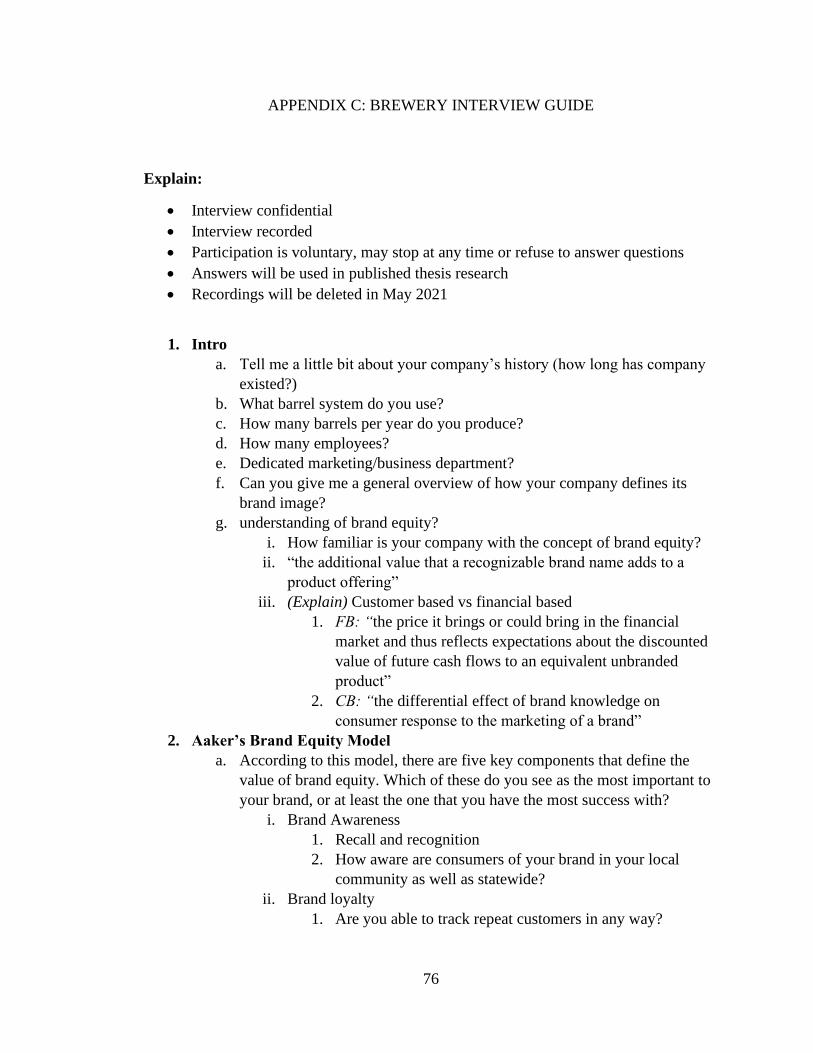
76
APPENDIX C: BREWERY INTERVIEW GUIDE
Explain:
• Interview confidential
• Interview recorded
• Participation is voluntary, may stop at any time or refuse to answer questions
• Answers will be used in published thesis research
• Recordings will be deleted in May 2021
1. Intro
a. Tell me a little bit about your company’s history (how long has company
existed?)
b. What barrel system do you use?
c. How many barrels per year do you produce?
d. How many employees?
e. Dedicated marketing/business department?
f. Can you give me a general overview of how your company defines its
brand image?
g. understanding of brand equity?
i. How familiar is your company with the concept of brand equity?
ii. “the additional value that a recognizable brand name adds to a
product offering”
iii. (Explain) Customer based vs financial based
1. FB: “the price it brings or could bring in the financial
market and thus reflects expectations about the discounted
value of future cash flows to an equivalent unbranded
product”
2. CB: “the differential effect of brand knowledge on
consumer response to the marketing of a brand”
2. Aaker’s Brand Equity Model
a. According to this model, there are five key components that define the
value of brand equity. Which of these do you see as the most important to
your brand, or at least the one that you have the most success with?
i. Brand Awareness
1. Recall and recognition
2. How aware are consumers of your brand in your local
community as well as statewide?
ii. Brand loyalty
1. Are you able to track repeat customers in any way?

77
2. How easily are you able to extend your product line with
success?
iii. Perceived quality
1. Are you able to charge a premium for your product?
iv. Brand associations
1. What do people associate your brand with? How do you
think people feel when they see your brand in stores during
a split second purchasing decision?
v. Patents and proprietary rights
3. Methods of building brand equity
a. SoP branding (brand associations)
i. Are you familiar with sense of place branding?
ii. What kind of cultural characteristics of your local community do
you incorporate into your brand?
1. Folklore, town history, places of interest, etc
iii. What is the role of the taproom beyond the delivery of beer, if any?
1. Brand exposure?
2. SoP?
b. Terroir (perceived quality) (brand association)
i. Terroir has always been a large part of the wine industry,
particularly in terms of environmental and geographical
characteristics. More recently, it has grown to incorporate all
aspects of a region, including local culture and local adjunct
ingredients. What kind of terroir is associated with your products?
ii. How common is it for people to travel long distances simply to try
your beer on-site?
1. Is beer tourism a large part of your business, or do you
focus most of your efforts to catering towards the local
community?
c. User imagery (brand association)
i. People sometimes look for brands that reflect their own
personality. What kind of personality does your company try to
exude in order to attract a certain consumer?
d. CRM (brand loyalty)
i. How loyal are consumers to your brand?
1. NPS (Net Promoter) scores?
2. Online engagement?
3. Tap space at bars?
4. Most success in local area, or somewhere else in state?
ii. What kind of understanding do you have of the demographics of
your consumer base?
iii. What kind of avenues for feedback do you provide for your
customers?

78
e. Local partnerships (brand awareness) (brand associations)
i. What role do you see breweries playing in their local community?
ii. What kind of product development campaigns with other small
businesses in the area has your company involved itself in and can
you explain the collaboration processes?
iii. Do you see collaboration with other local businesses as a growing
trend in how breweries reach new consumers, and if so, why?
4. Methods for tracking brand equity (financial based model)
a. Awareness and perceived quality are two of the main ways brand equity is
measured. What are the ways you measure or track these qualities?
b. Can you put a financial value on your brand?
5. Saturation of market
a. What does the current market saturation of the Maine craft beer industry
signal for the future of the industry going forward?
b. What are the ways a brewery can gain a competitive advantage in today’s
market?
i. Have marketing budgets increased?
ii. Role of building brand equity?
c. When the craft beer boom first began, is it fair to say the mentality of the
times was craft vs macro breweries like Anheuser-Busch?
i. Has this mentality changed? In other words, do you still see a
brewery the next town over from you as an ally, or is competition
for customers increasing?
6. Consumer trends
a. Is your current goal to grow and expand the company, or to stay small and
local? Between these two options, is there a growing preference among
consumers when it comes to perception of a craft brewery?
b. What kinds of consumer and product trends do you see emerging in the
industry?
c. Marketing trends?

79
APPENDIX D: CONSUMER SURVEY
1. Approximately how many different brands of Maine craft beer do you buy in a
single month?
a. 1-2
b. 3-4
c. 5-6
d. 6+
2. How many loyalty programs with Maine craft breweries (mug clubs, email lists,
etc.) are you involved in?
a. 0
b. 1-2
c. 3-4
d. 5+
3. How many different Maine craft breweries do you follow on social media
(Instagram, Twitter, Facebook)?
a. 0
b. 1-2
c. 3-4
d. 5+
4. Of the following three options, which influences your craft beer purchasing
decision the most?
a. Style (lager, IPA, stout, etc.)
b. Price
c. Brand name
5. If you had to drive to get your preferred brand of Maine beer, how far would you
be willing to travel before considering other options?
a. Under 10 minutes
b. 10-20 minutes
c. 21-30 minutes
d. Over 30 minutes
6. (Semantic Differential Scale) To what extent does word of mouth (in-person
conversations or online reviews) affect your perception of a brewery's quality?
7. (Likert Scale) What is your perception of quality of breweries that produce the
following amounts of beer?
a. Less than 5,000 barrels per year
b. 5,000-39,999 barrels per year
c. 40,000-100,000 barrels per year
d. Over 100,000 barrels per year
8. Consider two 4-packs of 16-oz craft beer that are the same style and alcohol
content but are different in price: $11.99 vs. $15.99. What do you think most
likely accounts for the price difference?
a. Product Quality
b. Premium Pricing

80
c. Brewery Operating Costs
9. (Likert Scale) How likely are you to buy a brand of craft beer that you have never
heard of?
10. (Semantic Differential Scale) On a scale from 1 to 5, how much does recognition
of a brand influence your purchasing decision?
11. (Semantic Differential Scale) To what extent does a brewery’s commitment to
sustainability affect your purchasing decision?
12. (Semantic Differential Scale) To what extent does a brewery’s alignment with
your personal values influence your purchasing decision?
13. (Semantic Differential Scale) To what extent does a brewery’s alignment with
your own lifestyle interests influence your purchasing decision?
14. (Semantic Differential Scale) To what extent does brewery product collaboration
with local businesses influence your purchasing decision?
15. (Semantic Differential Scale) To what extent does brewery engagement
(fundraising, charities, etc.) in the local community influence your purchasing
decision?
16. (Semantic Differential Scale) To what extent does label design/aesthetic affect
your purchasing decision?
17. (Semantic Differential Scale) To what extent does a brewery's incorporation of
local history, traditions, folklore, and landmarks affect your purchasing decision?
18. (Semantic Differential Scale) To what extent does a brewery's use of experimental
and unique ingredients affect your purchasing decision?
19. (Semantic Differential Scale) How would you qualify the choice of craft beer
brands (different producers) available to you in the State of Maine?
20. (Semantic Differential Scale) How would you rate your familiarity with the Maine
craft beer industry (producers, process, and ingredients)?
21. In terms of individual bottles/cans/glasses, how much craft beer do you purchase
in a week?
a. Less than one per week
b. 1-4 per week
c. 5-12 per week
d. 13-24 per week
e. 25+ per week
22. How often do you purchase craft beer specifically from retailers (not directly from
breweries)?
a. Less than once a week
b. 1-2 times per week
c. 3-4 times per week
d. 5+ times per week
23. How often do you purchase craft beer directly from a brewery in their taproom?
a. Less than once a week
b. 1-2 times per week
c. 3-4 times per week
d. 5+ times per week
24. What is your age in years?
25. What gender do you identify as?

81
AUTHOR’S BIOGRAPHY
Gustav Anderson was born in Portland, Maine, on December 1, 1998. He was
raised in Phippsburg, Maine, and graduated from Cheverus High School in 2017. Gustav
is a business marketing major and new media minor. He plays for the University of
Maine Ultimate Frisbee Team, is a study abroad ambassador for the Office of
International Programs, a columnist for the Maine Campus student newspaper, a member
of the 2019-20 Sophomore Owls class, and a member of the Beta Gamma Sigma and
Alpha Lambda Delta honors societies. Upon graduation, Gustav plans on pursuing a
career in marketing and brand management in New England.
Recommended