Brainwaves Analysis of Positive and Negative Emotions
FU-CHIEN KAO, SHINPING R. WANG, YU-JUNG CHANG
Department of Computer Science & Information Engineering
Da-Yeh University
168 University Rd., Dacun, Changhua 51591
TAIWAN
{fuchien, swang}@mail.dyu.edu.tw
Abstract: - Emotions, is the generic term for various subjective cognitive experiences and a psychological and
physiological synthesized state generates under a variety of perceptions, thoughts, and behaviours. In general,
emotion can be categorized into Joyful, Angry, Protected, Sad, Surprised, Fear, Satisfied and Unconcerned
eight types of positive-negative emotions. More subtle and delicate emotions include jealousy, humiliation,
shame, pride and other emotions. Emotion is often under influence of mood, personality, temperament, purpose
and other factors. It can also be affected by hormones and neuro transmitters. Whether positive or negative
emotions are all motivations and trigger action. Although some emotional behaviour seems take place
inadvertent, however conscious plays an important role in producing emotion. This paper from the perspective
of cognitive neuroscience investigates difference of human brainwave of 8 types of positive and negative
emotions i.e. Joyful, Angry, Protected, Sad, Surprised, Fear, Satisfied and Unconcerned. The experiment uses
acoustic stimuli to stimulate the positive and negative emotions of the test subjects and uses
Electroencephalogram (EEG) to extract test subjects’ frontal lobe brainwave. The extracted brainwave is
further transformed into frequency domain signal where sub-band energy is calculated, characterized, and
finally digital encoded for analysis. The encoded characteristic brainwaves of positive and negative emotion are
compared for theirs difference. It shows 8 different positive and negative emotions can be effectively identified
by the proposed emotional brainwave digital encoding technique and the technique is promising for developing
future emotion identification technique.
Key-Words: - Brainwave, Cognitive Neuroscience, Emotion Recognition
1 Introduction Emotions can be classified into innate "basic
emotions" and "complex emotions” which acquired
through learning. Basic emotions are innate and
closely relates to human survival instinct. In
contrasting, complex emotional has to be learned
through human interaction and hence each
individual owns different number of complex
emotions and has different definition of them.
Emotion has being described as abrupt response to
the internal or external important events and a
person always takes the same response to the same
event. Emotion lasts for a very short duration; it
collaborating actions of language, physiological,
behavioural and neural mechanism [1]. Human
emotions also derive from biological
functionalities/survival instinct and strengthen
through evolution. It provides simple solutions to
frequent problems that early human have to confront,
such as fear causes evasion [2, 3].
Emotions are both a subjective experience and an
objective physiological response. It is has its
purpose and also a social expression. Emotions are
divisive complex comprehensive events [4]. From
the component-processing model, emotion consist
five basic elements that must be coordinated in a
short time, synchronous manner [5]. The five basic
elements are cognitive assessment, physical
reactions, feelings, tendencies, expression, and
action. These elements are described as follow:
Cognitive Assessment: Observing external
incident (or people), cognitive system automatically
evaluates its emotion, thereby triggering subsequent
emotional response (for instance, seeing the beloved
pet dies, the cognitive system of the owner assesses
the incident as a significant negative event).
Physical reaction: a physiological component of
emotion and a spontaneous reaction of the body that
makes the subject adapt to the sudden event (for
example, realizing irreparable death of the pet, pet
owner’s nervous system becomes less sensitive,
WSEAS TRANSACTIONS on INFORMATION SCIENCE and APPLICATIONSFu-Chien Kao, Shinping R. Wang
Yu-Jung Chang
E-ISSN: 2224-3402 200 Volume 12, 2015
body experiencing malaise, heart rate slow down,
and other physiological reactions).
Feelings: subjective emotions of person (for
example, after the death of their loved ones, family
members produced a series of physical and
psychological reactions. Subjective consciousness
picks up these changes that collectively referred to
as "sad").
Expression: a facial and voice variations show
subject's emotions to convey subject's opinion and
intention to the others (for example, seeing the death
of relatives, family members frown and dropping of
the lip corners to convey a crying expression.) There
are expressions common to all and some are private
[6].
Tendencies: emotions generate motivation (for
example, people tend to find somebody to talk to
when feeling sad and will do something unusual
when feeling anger.)
Beside the subject who is experiencing emotion
shift, bystanders can also learn subject's emotion
shift through observation. However, are there any
other ways to learn people's emotion shift beside
observation and interaction? Is there an effective
scientific approach to identify the inner emotion
shift of people? This study identifies positive and
negative psychological emotions using brainwave
variation. It focuses on analysing eight types of
positive and negative emotions: Joyful, Angry,
Protected, Sad, Surprised, Fear, Satisfied and
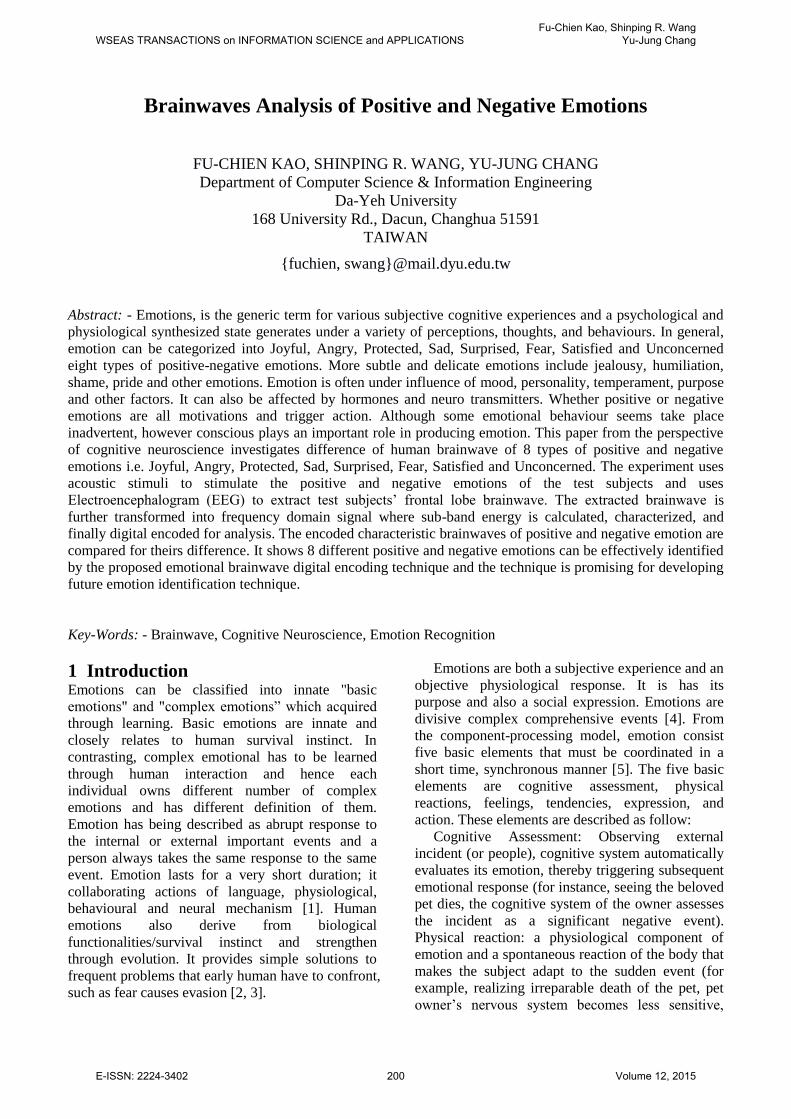
Unconcerned. Figure 1 depicts the relation between
the above emotions in three dimensions. The figure
expands the emotions into three-dimensional space
using three orthogonal axes: the positive or negative,
the strength, and the shift of the emotion.
Figure 1 3D Emotions Graph
Brainwave is an electromagnetic signal
generated by electrochemical process of the nerve
system inside the Brain. The nerve system, by
discharging ironic chemical substance and through
ion permeability transforms chemical signal into
electrical signal. The neuron, core of nerve system is
responsible of generating electric signal. When the
receptor which locates at the surface of the neuron
receives ironic substance from the nerve system, an
action voltage is built up and hence an electric
signal is fired. Different excitations will generate
different types of signal patterns. Rhythmic
potential variation that consists of Electrical
Rhythms and Transient Discharge is generated when
nerve system conducting signal and this aggregative
rhythmic potential variation from billions of neuron
constitutes what we called the Brainwave [7].
Recent brainwave identification technique has
been widely adapted in Brain-computer Interface
(BCI) design, where human intention/thoughts is
extracted and identified by brainwave instrument
and feeds directly to the computer interface circuit
for interaction [8]. Clinically, brainwave signal
analysis is a common practice to diagnosis non-
structural brain lesions diseases (such as Epilepsy,
Alzheimer's disease, Sleep dysfunction, and etc.) [9].
This research, based on the cognitive neuroscience,
uses brainwave sensor to extract brainwave signal of
the test subjects while they are performing the
induction of emotions. The extracted measurements
are further analysed, compiled statistics for its
distribution over the brainwave characteristic
frequency bands, and finally the characteristic
frequency bands of emotional brainwaves are
digitally encoded to come up with a metrics for
human emotions identification.
2 Design of EEG Sensor Module There are four frequency bands such as Alpha (α),
Beta (β), Theta (θ) and Delta (δ) according to the
data provided by the International Federation of
Societies for Electroencephalography and Clinical
Neurophysiology [10]. The α wave is a brainwave
with frequency between 8Hz and 13Hz, and with
amplitude of about 50μV. The β wave has a main
frequency between 13Hz and 22 Hz and a potential
of about 5-20 μV. The θ wave has a frequency
between 4Hz and 8 Hz. The δ wave has a frequency
between 0.2Hz and 4Hz.Brainwave technique was
originally for medical purpose such as diagnosing
epilepsy and other brain related diseases. For
medical purposes, brainwave measurements are
taken under T-20 standard electrode position and the
measurements are used to diagnosis brain related
diseases such as epilepsy, Alzheimer's disease and
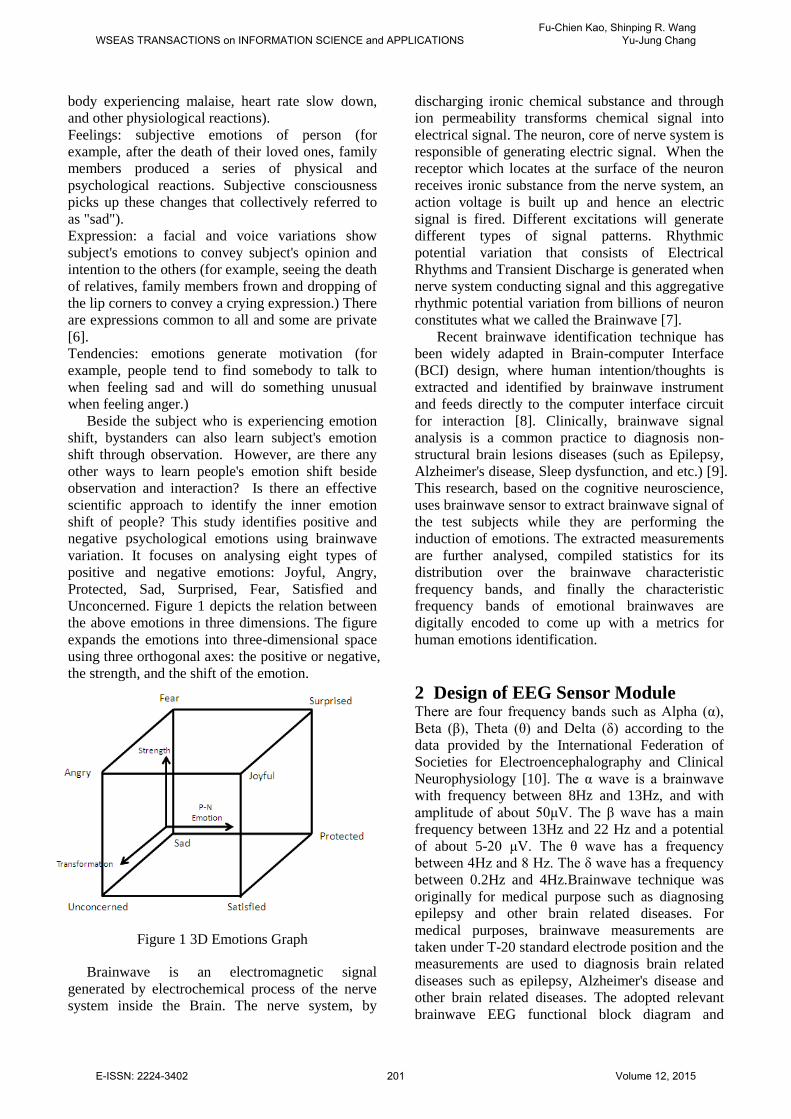
other brain related diseases. The adopted relevant
brainwave EEG functional block diagram and
WSEAS TRANSACTIONS on INFORMATION SCIENCE and APPLICATIONSFu-Chien Kao, Shinping R. Wang
Yu-Jung Chang
E-ISSN: 2224-3402 201 Volume 12, 2015
sensor module is shown as in Fig.2and Fig.3 [11].
The brainwave sensor proposed in this research is
not only small in size, convenient to carry and easy
to operate but also is low in price, and is applicable
to being used in various industries in the future
compared to the medical grade
electroencephalograph.
Figure 2 EEG functional block diagram
Figure 3 EEG sensor module
3 System Implementation and Statistic
Analysis This research follows the perspective of cognitive
neuroscience, develops characteristic frequency
bands of brainwave for identifying positive and
negative emotions of human brain. The research
experiment accomplishes this by extracting test
subjects’ brainwave under different emotion
response. The extracted measurements are then
analyzed and compiled statistics for its distribution
over the brainwave characteristic frequency bands
with respect to different emotional brainwaves, and
finally the digital codes of the emotional brainwaves
are encoded.
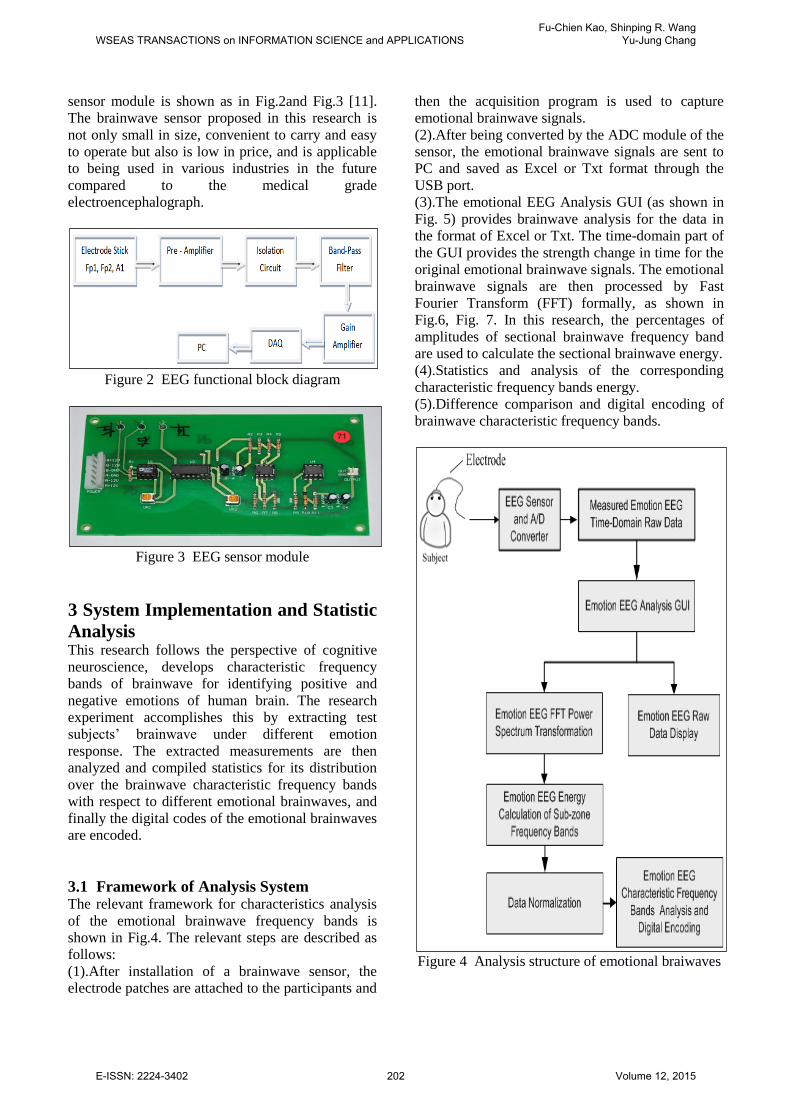
3.1 Framework of Analysis System The relevant framework for characteristics analysis
of the emotional brainwave frequency bands is
shown in Fig.4. The relevant steps are described as
follows:
(1).After installation of a brainwave sensor, the
electrode patches are attached to the participants and
then the acquisition program is used to capture
emotional brainwave signals.
(2).After being converted by the ADC module of the
sensor, the emotional brainwave signals are sent to
PC and saved as Excel or Txt format through the
USB port.
(3).The emotional EEG Analysis GUI (as shown in
Fig. 5) provides brainwave analysis for the data in
the format of Excel or Txt. The time-domain part of
the GUI provides the strength change in time for the
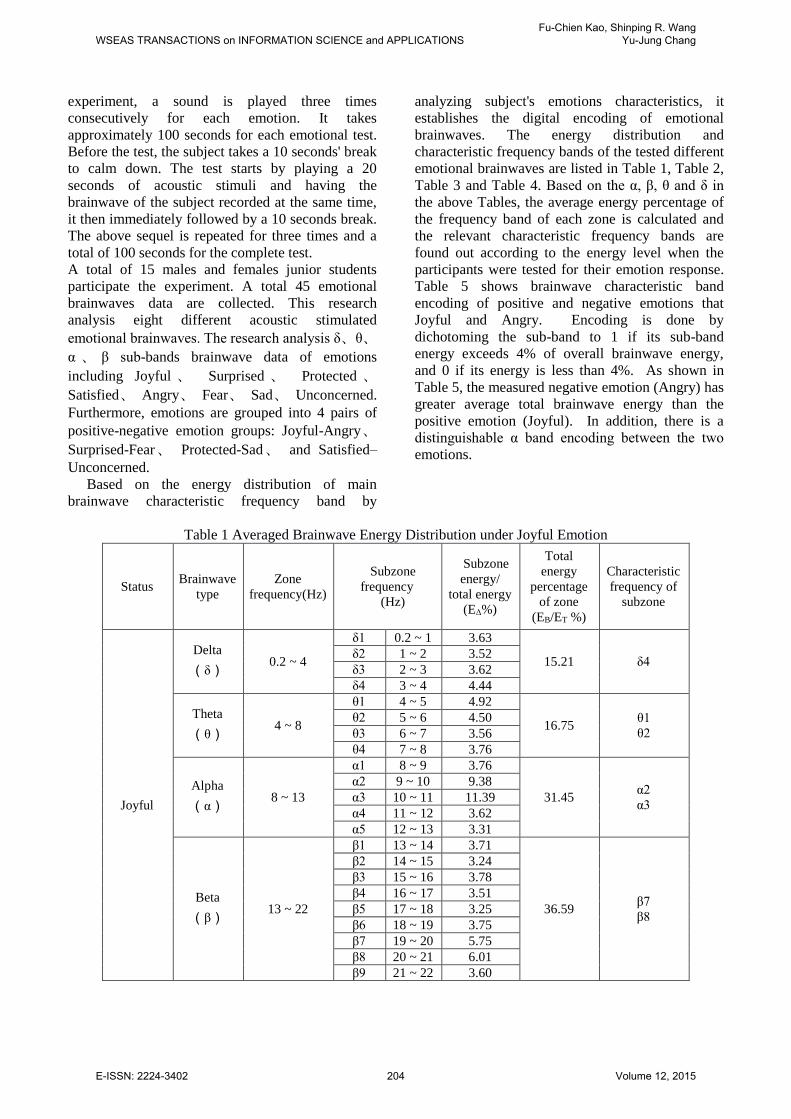
original emotional brainwave signals. The emotional
brainwave signals are then processed by Fast
Fourier Transform (FFT) formally, as shown in
Fig.6, Fig. 7. In this research, the percentages of
amplitudes of sectional brainwave frequency band
are used to calculate the sectional brainwave energy.
(4).Statistics and analysis of the corresponding
characteristic frequency bands energy.
(5).Difference comparison and digital encoding of
brainwave characteristic frequency bands.
Figure 4 Analysis structure of emotional braiwaves
WSEAS TRANSACTIONS on INFORMATION SCIENCE and APPLICATIONSFu-Chien Kao, Shinping R. Wang
Yu-Jung Chang
E-ISSN: 2224-3402 202 Volume 12, 2015
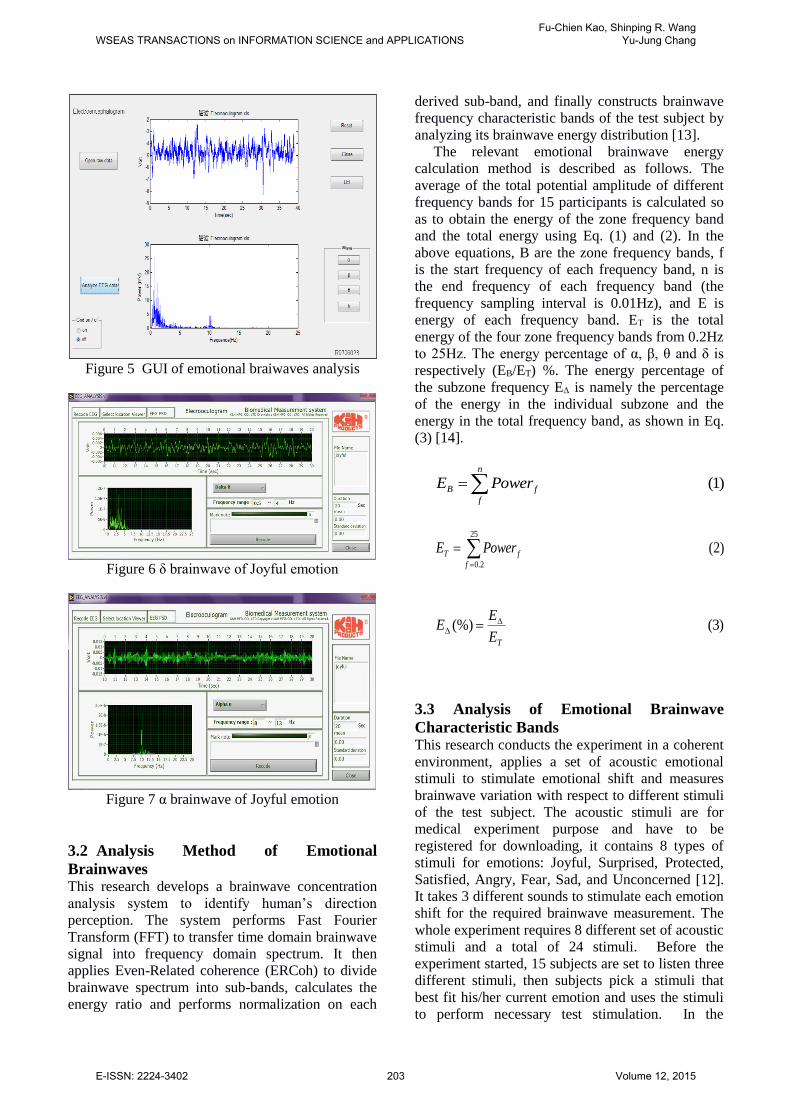
Figure 5 GUI of emotional braiwaves analysis
Figure 6 δ brainwave of Joyful emotion
Figure 7 α brainwave of Joyful emotion
3.2 Analysis Method of Emotional
Brainwaves This research develops a brainwave concentration
analysis system to identify human’s direction
perception. The system performs Fast Fourier
Transform (FFT) to transfer time domain brainwave
signal into frequency domain spectrum. It then
applies Even-Related coherence (ERCoh) to divide
brainwave spectrum into sub-bands, calculates the
energy ratio and performs normalization on each
derived sub-band, and finally constructs brainwave
frequency characteristic bands of the test subject by
analyzing its brainwave energy distribution [13].
The relevant emotional brainwave energy
calculation method is described as follows. The
average of the total potential amplitude of different
frequency bands for 15 participants is calculated so
as to obtain the energy of the zone frequency band
and the total energy using Eq. (1) and (2). In the
above equations, B are the zone frequency bands, f
is the start frequency of each frequency band, n is
the end frequency of each frequency band (the
frequency sampling interval is 0.01Hz), and E is
energy of each frequency band. ET is the total
energy of the four zone frequency bands from 0.2Hz
to 25Hz. The energy percentage of α, β, θ and δ is
respectively (EB/ET) %. The energy percentage of
the subzone frequency EΔ is namely the percentage
of the energy in the individual subzone and the
energy in the total frequency band, as shown in Eq.
(3) [14].
)1( n
f
fB PowerE
)2( 25
2.0
PowerEf
fT
)3( (%) E
EE
T
3.3 Analysis of Emotional Brainwave
Characteristic Bands
This research conducts the experiment in a coherent
environment, applies a set of acoustic emotional
stimuli to stimulate emotional shift and measures
brainwave variation with respect to different stimuli
of the test subject. The acoustic stimuli are for
medical experiment purpose and have to be
registered for downloading, it contains 8 types of
stimuli for emotions: Joyful, Surprised, Protected,
Satisfied, Angry, Fear, Sad, and Unconcerned [12].
It takes 3 different sounds to stimulate each emotion
shift for the required brainwave measurement. The
whole experiment requires 8 different set of acoustic
stimuli and a total of 24 stimuli. Before the
experiment started, 15 subjects are set to listen three
different stimuli, then subjects pick a stimuli that
best fit his/her current emotion and uses the stimuli
to perform necessary test stimulation. In the
WSEAS TRANSACTIONS on INFORMATION SCIENCE and APPLICATIONSFu-Chien Kao, Shinping R. Wang
Yu-Jung Chang
E-ISSN: 2224-3402 203 Volume 12, 2015
experiment, a sound is played three times
consecutively for each emotion. It takes
approximately 100 seconds for each emotional test.
Before the test, the subject takes a 10 seconds' break
to calm down. The test starts by playing a 20
seconds of acoustic stimuli and having the
brainwave of the subject recorded at the same time,
it then immediately followed by a 10 seconds break.
The above sequel is repeated for three times and a
total of 100 seconds for the complete test.
A total of 15 males and females junior students
participate the experiment. A total 45 emotional
brainwaves data are collected. This research
analysis eight different acoustic stimulated
emotional brainwaves. The research analysis δ、θ、
α 、 β sub-bands brainwave data of emotions
including Joyful 、 Surprised 、 Protected 、
Satisfied、 Angry、 Fear、 Sad、 Unconcerned.
Furthermore, emotions are grouped into 4 pairs of
positive-negative emotion groups: Joyful-Angry、
Surprised-Fear、 Protected-Sad、 and Satisfied–
Unconcerned.
Based on the energy distribution of main
brainwave characteristic frequency band by
analyzing subject's emotions characteristics, it
establishes the digital encoding of emotional
brainwaves. The energy distribution and
characteristic frequency bands of the tested different
emotional brainwaves are listed in Table 1, Table 2,
Table 3 and Table 4. Based on the α, β, θ and δ in
the above Tables, the average energy percentage of
the frequency band of each zone is calculated and
the relevant characteristic frequency bands are
found out according to the energy level when the
participants were tested for their emotion response.
Table 5 shows brainwave characteristic band
encoding of positive and negative emotions that
Joyful and Angry. Encoding is done by
dichotoming the sub-band to 1 if its sub-band
energy exceeds 4% of overall brainwave energy,
and 0 if its energy is less than 4%. As shown in
Table 5, the measured negative emotion (Angry) has
greater average total brainwave energy than the
positive emotion (Joyful). In addition, there is a
distinguishable α band encoding between the two
emotions.
Table 1 Averaged Brainwave Energy Distribution under Joyful Emotion
Status Brainwave
type
Zone
frequency(Hz)
Subzone
frequency
(Hz)
Subzone
energy/
total energy
(EΔ%)
Total
energy
percentage
of zone
(EB/ET %)
Characteristic
frequency of
subzone
Joyful
Delta
(δ) 0.2 ~ 4
δ1 0.2 ~ 1 3.63
15.21 δ4 δ2 1 ~ 2 3.52
δ3 2 ~ 3 3.62
δ4 3 ~ 4 4.44
Theta
(θ) 4 ~ 8
θ1 4 ~ 5 4.92
16.75 θ1
θ2
θ2 5 ~ 6 4.50
θ3 6 ~ 7 3.56
θ4 7 ~ 8 3.76
Alpha
(α) 8 ~ 13
α1 8 ~ 9 3.76
31.45 α2
α3
α2 9 ~ 10 9.38
α3 10 ~ 11 11.39
α4 11 ~ 12 3.62
α5 12 ~ 13 3.31
Beta
(β) 13 ~ 22
β1 13 ~ 14 3.71
36.59 β7
β8
β2 14 ~ 15 3.24
β3 15 ~ 16 3.78
β4 16 ~ 17 3.51
β5 17 ~ 18 3.25
β6 18 ~ 19 3.75
β7 19 ~ 20 5.75
β8 20 ~ 21 6.01
β9 21 ~ 22 3.60
WSEAS TRANSACTIONS on INFORMATION SCIENCE and APPLICATIONSFu-Chien Kao, Shinping R. Wang
Yu-Jung Chang
E-ISSN: 2224-3402 204 Volume 12, 2015
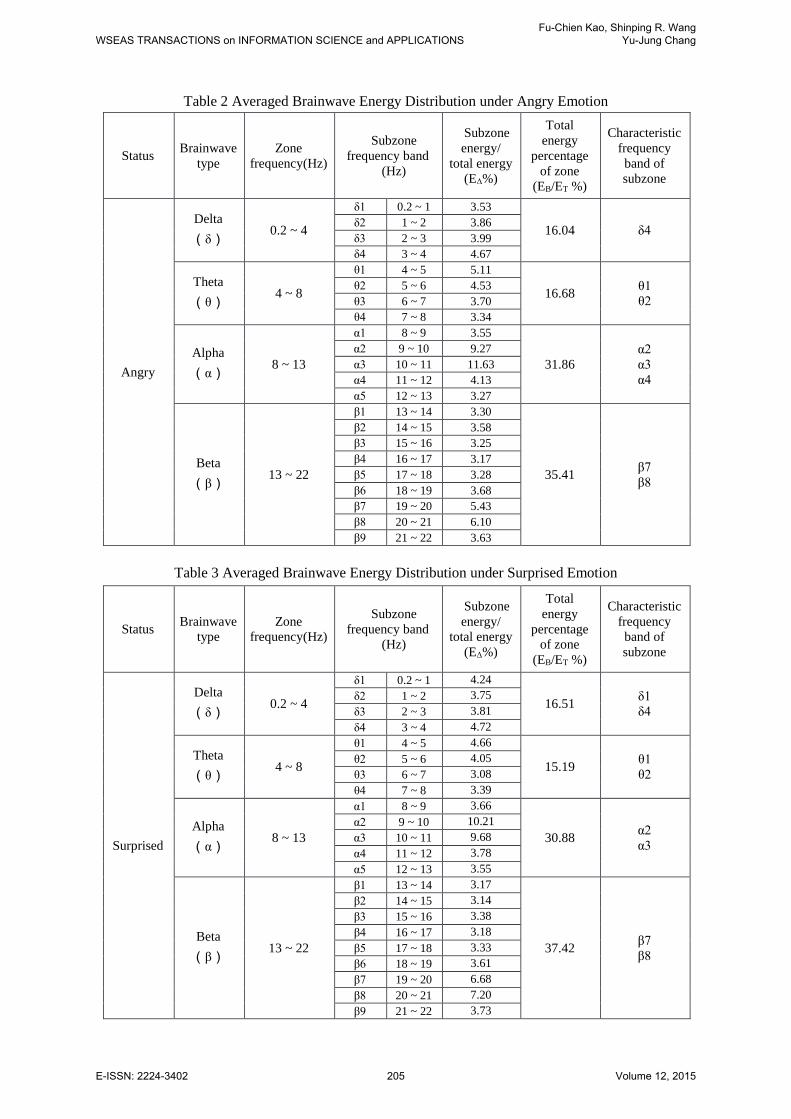
Table 2 Averaged Brainwave Energy Distribution under Angry Emotion
Table 3 Averaged Brainwave Energy Distribution under Surprised Emotion
Status Brainwave
type
Zone
frequency(Hz)
Subzone
frequency band
(Hz)
Subzone
energy/
total energy
(EΔ%)
Total
energy
percentage
of zone
(EB/ET %)
Characteristic
frequency
band of
subzone
Angry
Delta
(δ) 0.2 ~ 4
δ1 0.2 ~ 1 3.53
16.04 δ4 δ2 1 ~ 2 3.86
δ3 2 ~ 3 3.99
δ4 3 ~ 4 4.67
Theta
(θ) 4 ~ 8
θ1 4 ~ 5 5.11
16.68 θ1
θ2
θ2 5 ~ 6 4.53
θ3 6 ~ 7 3.70
θ4 7 ~ 8 3.34
Alpha
(α) 8 ~ 13
α1 8 ~ 9 3.55
31.86
α2
α3
α4
α2 9 ~ 10 9.27
α3 10 ~ 11 11.63
α4 11 ~ 12 4.13
α5 12 ~ 13 3.27
Beta
(β) 13 ~ 22
β1 13 ~ 14 3.30
35.41 β7
β8
β2 14 ~ 15 3.58
β3 15 ~ 16 3.25
β4 16 ~ 17 3.17
β5 17 ~ 18 3.28
β6 18 ~ 19 3.68
β7 19 ~ 20 5.43
β8 20 ~ 21 6.10
β9 21 ~ 22 3.63
Status Brainwave
type
Zone
frequency(Hz)
Subzone
frequency band
(Hz)
Subzone
energy/
total energy
(EΔ%)
Total
energy
percentage
of zone
(EB/ET %)
Characteristic
frequency
band of
subzone
Surprised
Delta
(δ) 0.2 ~ 4
δ1 0.2 ~ 1 4.24
16.51 δ1
δ4
δ2 1 ~ 2 3.75
δ3 2 ~ 3 3.81
δ4 3 ~ 4 4.72
Theta
(θ) 4 ~ 8
θ1 4 ~ 5 4.66
15.19 θ1
θ2
θ2 5 ~ 6 4.05
θ3 6 ~ 7 3.08
θ4 7 ~ 8 3.39
Alpha
(α) 8 ~ 13
α1 8 ~ 9 3.66
30.88 α2
α3
α2 9 ~ 10 10.21
α3 10 ~ 11 9.68
α4 11 ~ 12 3.78
α5 12 ~ 13 3.55
Beta
(β) 13 ~ 22
β1 13 ~ 14 3.17
37.42 β7
β8
β2 14 ~ 15 3.14
β3 15 ~ 16 3.38
β4 16 ~ 17 3.18
β5 17 ~ 18 3.33
β6 18 ~ 19 3.61
β7 19 ~ 20 6.68
β8 20 ~ 21 7.20
β9 21 ~ 22 3.73
WSEAS TRANSACTIONS on INFORMATION SCIENCE and APPLICATIONSFu-Chien Kao, Shinping R. Wang
Yu-Jung Chang
E-ISSN: 2224-3402 205 Volume 12, 2015
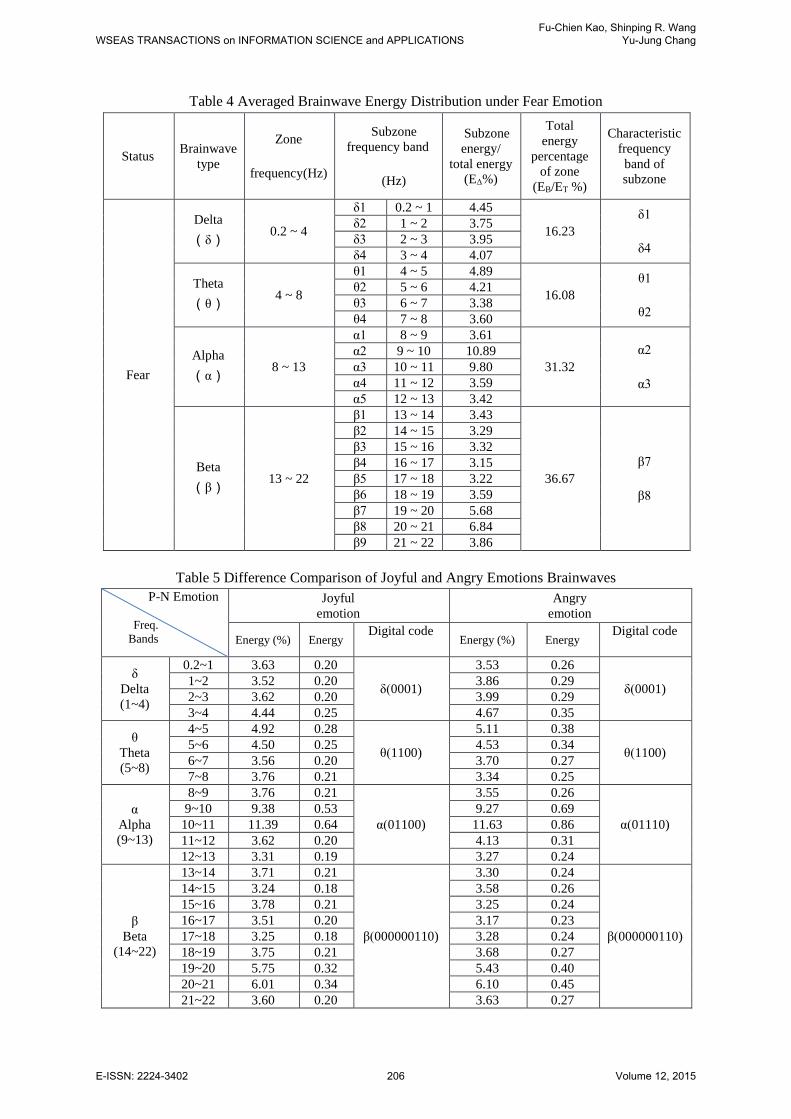
Table 4 Averaged Brainwave Energy Distribution under Fear Emotion
Table 5 Difference Comparison of Joyful and Angry Emotions Brainwaves
Status Brainwave
type
Zone
frequency(Hz)
Subzone
frequency band
(Hz)
Subzone
energy/
total energy
(EΔ%)
Total
energy
percentage
of zone
(EB/ET %)
Characteristic
frequency
band of
subzone
Fear
Delta
(δ) 0.2 ~ 4
δ1 0.2 ~ 1 4.45
16.23
δ1
δ4
δ2 1 ~ 2 3.75
δ3 2 ~ 3 3.95
δ4 3 ~ 4 4.07
Theta
(θ) 4 ~ 8
θ1 4 ~ 5 4.89
16.08
θ1
θ2
θ2 5 ~ 6 4.21
θ3 6 ~ 7 3.38
θ4 7 ~ 8 3.60
Alpha
(α) 8 ~ 13
α1 8 ~ 9 3.61
31.32
α2
α3
α2 9 ~ 10 10.89
α3 10 ~ 11 9.80
α4 11 ~ 12 3.59
α5 12 ~ 13 3.42
Beta
(β) 13 ~ 22
β1 13 ~ 14 3.43
36.67
β7
β8
β2 14 ~ 15 3.29
β3 15 ~ 16 3.32
β4 16 ~ 17 3.15
β5 17 ~ 18 3.22
β6 18 ~ 19 3.59
β7 19 ~ 20 5.68
β8 20 ~ 21 6.84
β9 21 ~ 22 3.86
P-N Emotion
Freq.
Bands
Joyful
emotion
Angry
emotion
Energy (%) Energy Digital code
Energy (%) Energy Digital code
δ
Delta
(1~4)
0.2~1 3.63 0.20
δ(0001)
3.53 0.26
δ(0001) 1~2 3.52 0.20 3.86 0.29
2~3 3.62 0.20 3.99 0.29
3~4 4.44 0.25 4.67 0.35
θ
Theta
(5~8)
4~5 4.92 0.28
θ(1100)
5.11 0.38
θ(1100) 5~6 4.50 0.25 4.53 0.34
6~7 3.56 0.20 3.70 0.27
7~8 3.76 0.21 3.34 0.25
α
Alpha
(9~13)
8~9 3.76 0.21
α(01100)
3.55 0.26
α(01110)
9~10 9.38 0.53 9.27 0.69
10~11 11.39 0.64 11.63 0.86
11~12 3.62 0.20 4.13 0.31
12~13 3.31 0.19 3.27 0.24
β
Beta
(14~22)
13~14 3.71 0.21
β(000000110)
3.30 0.24
β(000000110)
14~15 3.24 0.18 3.58 0.26
15~16 3.78 0.21 3.25 0.24
16~17 3.51 0.20 3.17 0.23
17~18 3.25 0.18 3.28 0.24
18~19 3.75 0.21 3.68 0.27
19~20 5.75 0.32 5.43 0.40
20~21 6.01 0.34 6.10 0.45
21~22 3.60 0.20 3.63 0.27
WSEAS TRANSACTIONS on INFORMATION SCIENCE and APPLICATIONSFu-Chien Kao, Shinping R. Wang
Yu-Jung Chang
E-ISSN: 2224-3402 206 Volume 12, 2015
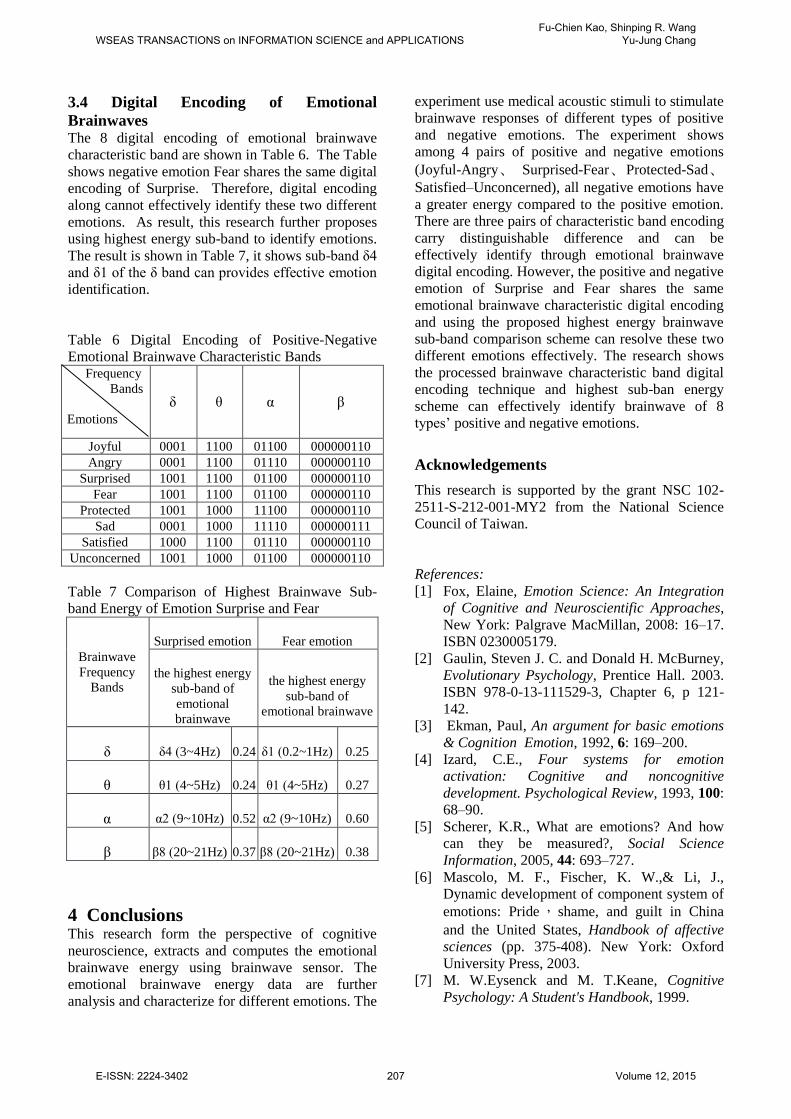
3.4 Digital Encoding of Emotional
Brainwaves The 8 digital encoding of emotional brainwave
characteristic band are shown in Table 6. The Table
shows negative emotion Fear shares the same digital
encoding of Surprise. Therefore, digital encoding
along cannot effectively identify these two different
emotions. As result, this research further proposes
using highest energy sub-band to identify emotions.
The result is shown in Table 7, it shows sub-band δ4
and δ1 of the δ band can provides effective emotion
identification.
Table 6 Digital Encoding of Positive-Negative
Emotional Brainwave Characteristic Bands Frequency
Bands
Emotions
δ θ α β
Joyful 0001 1100 01100 000000110
Angry 0001 1100 01110 000000110
Surprised 1001 1100 01100 000000110
Fear 1001 1100 01100 000000110
Protected 1001 1000 11100 000000110
Sad 0001 1000 11110 000000111
Satisfied 1000 1100 01110 000000110
Unconcerned 1001 1000 01100 000000110
Table 7 Comparison of Highest Brainwave Sub-
band Energy of Emotion Surprise and Fear
Brainwave
Frequency
Bands
Surprised emotion Fear emotion
the highest energy
sub-band of
emotional
brainwave
the highest energy
sub-band of
emotional brainwave
δ δ4 (3~4Hz) 0.24 δ1 (0.2~1Hz) 0.25
θ θ1 (4~5Hz) 0.24 θ1 (4~5Hz) 0.27
α α2 (9~10Hz) 0.52 α2 (9~10Hz) 0.60
β β8 (20~21Hz) 0.37 β8 (20~21Hz) 0.38
4 Conclusions This research form the perspective of cognitive
neuroscience, extracts and computes the emotional
brainwave energy using brainwave sensor. The
emotional brainwave energy data are further
analysis and characterize for different emotions. The
experiment use medical acoustic stimuli to stimulate
brainwave responses of different types of positive
and negative emotions. The experiment shows
among 4 pairs of positive and negative emotions
(Joyful-Angry、 Surprised-Fear、Protected-Sad、
Satisfied–Unconcerned), all negative emotions have
a greater energy compared to the positive emotion.
There are three pairs of characteristic band encoding
carry distinguishable difference and can be
effectively identify through emotional brainwave
digital encoding. However, the positive and negative
emotion of Surprise and Fear shares the same
emotional brainwave characteristic digital encoding
and using the proposed highest energy brainwave
sub-band comparison scheme can resolve these two
different emotions effectively. The research shows
the processed brainwave characteristic band digital
encoding technique and highest sub-ban energy
scheme can effectively identify brainwave of 8
types’ positive and negative emotions.
Acknowledgements
This research is supported by the grant NSC 102-
2511-S-212-001-MY2 from the National Science
Council of Taiwan.
References:
[1] Fox, Elaine, Emotion Science: An Integration
of Cognitive and Neuroscientific Approaches,
New York: Palgrave MacMillan, 2008: 16–17.
ISBN 0230005179.
[2] Gaulin, Steven J. C. and Donald H. McBurney,
Evolutionary Psychology, Prentice Hall. 2003.
ISBN 978-0-13-111529-3, Chapter 6, p 121-
142.
[3] Ekman, Paul, An argument for basic emotions
& Cognition Emotion, 1992, 6: 169–200.
[4] Izard, C.E., Four systems for emotion
activation: Cognitive and noncognitive
development. Psychological Review, 1993, 100:
68–90.
[5] Scherer, K.R., What are emotions? And how
can they be measured?, Social Science
Information, 2005, 44: 693–727.
[6] Mascolo, M. F., Fischer, K. W.,& Li, J.,
Dynamic development of component system of
emotions: Pride, shame, and guilt in China
and the United States, Handbook of affective
sciences (pp. 375-408). New York: Oxford
University Press, 2003.
[7] M. W.Eysenck and M. T.Keane, Cognitive
Psychology: A Student's Handbook, 1999.
WSEAS TRANSACTIONS on INFORMATION SCIENCE and APPLICATIONSFu-Chien Kao, Shinping R. Wang
Yu-Jung Chang
E-ISSN: 2224-3402 207 Volume 12, 2015
[8] C.Holzner, C.Guger and G. Edlinger,Virtual
Smart Home Controlled By Thoughts, 18th
IEEE International Workshops on Enabling
Technologies: Infrastructures for Collaborative
Enterprises, pp.236-239, (2009).
[9] T.B.J,Kuo, C.J.Lai, F.Z. Shaw, C.W. Lai, &
C.C.H.Yang, Sleep-related sympathovagal
imbalance in SHR, Am J. Physiol, 286, H1170-
1176, 2004.
[10] J.G.Webster, Electroencephalography: Brain
electrical activity, Encyclopedia of medical
devices and instrumentation, Vol.2, pp. 1084-
1107, 1988.
[11] Fu-Chien Kao, Jian-Hao Jhong, Analysis of
Brainwave Characteristic Frequency Bands
under Different Physiological Statuses,
INFORMATION-AN INTERNATIONAL
INTERDISCIPLINARY JOURNAL, Vol.16, No.
9(B), pp.7249-7259, October, 2013.
[12] The International Affective Digitized Sounds
(2nd Edition; IADS-2): Affective Ratings of
Sounds and Instruction Manual, NIMH Center
for the Study of Emotion and Attention,
Gainesville.
[13] Fu-Chien Kao, Yun-Kai Lin and Chia-Chun
Hung, Brainwave Analysis during Learning,
ADVANCED SCIENCE LETTERS, Vo.19,
No.2, pp. 439-443, 2013.
[14] Fu-Chien Kao, Shinping R. Wang, Chia-Chun
Hung,Yun-Kai Lin, etc., The Encoding
Analysis of Brainwave for Direction
Recognition, APPLIED MECHANICS AND
MATERIALS, Vol.284-287, PP.1661-1665,
2013.
WSEAS TRANSACTIONS on INFORMATION SCIENCE and APPLICATIONSFu-Chien Kao, Shinping R. Wang
Yu-Jung Chang
E-ISSN: 2224-3402 208 Volume 12, 2015
Recommended