Brain Mapping Unit
The General Linear The General Linear ModelModel
A Basic IntroductionA Basic Introduction
Roger Tait ([email protected])Roger Tait ([email protected])

Brain Mapping Unit
OverviewOverview
What is imaging dataWhat is imaging data
How is data pre-processedHow is data pre-processed
Hypothesis testingHypothesis testing
GLM: simple linear regressionGLM: simple linear regression
Analysis softwareAnalysis software
How to process resultsHow to process results

Brain Mapping Unit
What is imaging data?What is imaging data?

Brain Mapping Unit
DataData
StructuralStructural
fMRIfMRI
A stack of A stack of numbersnumbers
FunctionalFunctional

Brain Mapping Unit
Multiple DataMultiple Data
subjID voxel1 voxel2 voxel 3 voxel 4 …….. voxel n
1 1227.308541 1472.770249 1417.745632 1701.294758 1288.742729
2 1612.461523 1934.953827 1677.661927 2013.194312 1465.051592
3 1466.264739 1759.517687 1559.769586 1871.723503 1827.678127
4 1499.70072 1799.640864 1842.474418 2210.969302 1316.392368
5 1598.121692 1917.746031 1510.850757 1813.020909 1740.286976
6 1408.066243 1689.679492 1399.393815 1679.272578 1534.459154
7 1555.951487 1867.141784 1588.529211 1588.529211 1516.464089
8 1397.721831 1677.266197 1523.825912 1523.825912 1340.814881
9 1333.659118 1600.390941 1384.217926 1384.217926 1461.281399
10 1453.14966 1743.779592 1558.603977 1558.603977 1406.575083

Brain Mapping Unit
ReorientationReorientationNativeNative
MNI152MNI152
ReorientedReoriented

Brain Mapping UnitBasic pre-processing Basic pre-processing (fmri)(fmri)
omprage.niiomprage.nii obrain.niiobrain.nii worest.niiworest.nii
omrest.niiomrest.nii nomrest.niinomrest.nii wnomrest.niiwnomrest.nii

Brain Mapping UnitBasic pre-processing Basic pre-processing (structural)(structural)
omprage.niiomprage.nii gmomprage.niigmomprage.nii wgmomprage.niiwgmomprage.nii
Brain Mapping Unit
How does standard space How does standard space data help?data help?

Brain Mapping Unit
Hypothesis testingHypothesis testing
Statistical inference is commonly done with a test statistic (t, F, …) which has a distribution under H0 mathematically derived.
For example
NB: this assumes that the errors are independent and normally distributed.5%
Parametric Null Distribution
t t = –
SE(–)
^ ^^ ^

Brain Mapping Unit
Introducing The GLMIntroducing The GLM
Y = X + DATA = MODEL + ERROR
DATA = KNOWN * UNKNOWN + ERROR
Encapsulates: t-test (paired, un-paired), F-Encapsulates: t-test (paired, un-paired), F-test, ANOVA (one-way, two-way, main effects, test, ANOVA (one-way, two-way, main effects, factorial) MANOVA, factorial) MANOVA, ANCOVA, MANCOVA, ANCOVA, MANCOVA, simple regression, linear regression, multiplsimple regression, linear regression, multiple e regression, multivariate regression……regression, multivariate regression……

Brain Mapping Unit
GLM definition GLM definition
Y = X + Where Where YY is a matrix with a series of is a matrix with a series of
observed measurementsobserved measurements
Where Where XX is a matrix that might be a design is a matrix that might be a design matrixmatrix
Where Where is a matrix containing parameters is a matrix containing parameters to be estimated to be estimated
And And is a matrix containing error or noise is a matrix containing error or noise

Brain Mapping UnitGLM: Simple Linear GLM: Simple Linear Regression Regression
Y = Y = XX11 + +
Y
X
:: is the Y axis intercept is the Y axis intercept
:: is the gradient of slope is the gradient of slope
Y: the black circles Y: the black circles
: diff between : diff between predicted Y and predicted Y and observed Yobserved Y

Brain Mapping UnitGLM: Simple Linear GLM: Simple Linear RegressionRegression
This is done by choosing This is done by choosing and and so that the so that the sum of the squares of the estimated errors sum of the squares of the estimated errors ii
22 is as small as possible.is as small as possible.
This is called the This is called the Method of Least SquaresMethod of Least Squares..
ii22 is called the is called the Residual Sum of Squares Residual Sum of Squares (RSS)(RSS)
Y = X1 + ^ ^

Brain Mapping Unit
GLM exampleGLM example
= mean reaction time + GENDER + AGE
Y = X1 X2X3X4+
DATA = KNOWN * UNKNOWN + ERROR

Brain Mapping Unit
Dummy VariablesDummy Variables
Continuous variables Continuous variables measurements on a continuous scale measurements on a continuous scale
(age, mRT)(age, mRT)
(-4.01, -0.47, 6.35, -7.06, -7.69, -14.24)(-4.01, -0.47, 6.35, -7.06, -7.69, -14.24)
Dummy VariablesDummy VariablesCode for group membership (disease, Code for group membership (disease,
gender)gender)
controls = 0, patients = 1controls = 0, patients = 1
females = 1, males = -1females = 1, males = -1

Brain Mapping Unit
UsageUsage
Hypothesis tests with GLM can be Hypothesis tests with GLM can be multivariate or several independent multivariate or several independent univariate testsunivariate tests
In multivariate tests the columns of Y are In multivariate tests the columns of Y are tested togethertested together
In univariate tests the columns of Y are In univariate tests the columns of Y are tested independently (multiple univariate tested independently (multiple univariate tests with the same design matrix)tests with the same design matrix)

Brain Mapping Unit
fMRI model specificationfMRI model specification
silent naming tasksilent naming task
The model
BOLD signal

Brain Mapping Unit
Actual retrieved dataActual retrieved data
Brain Mapping Unit
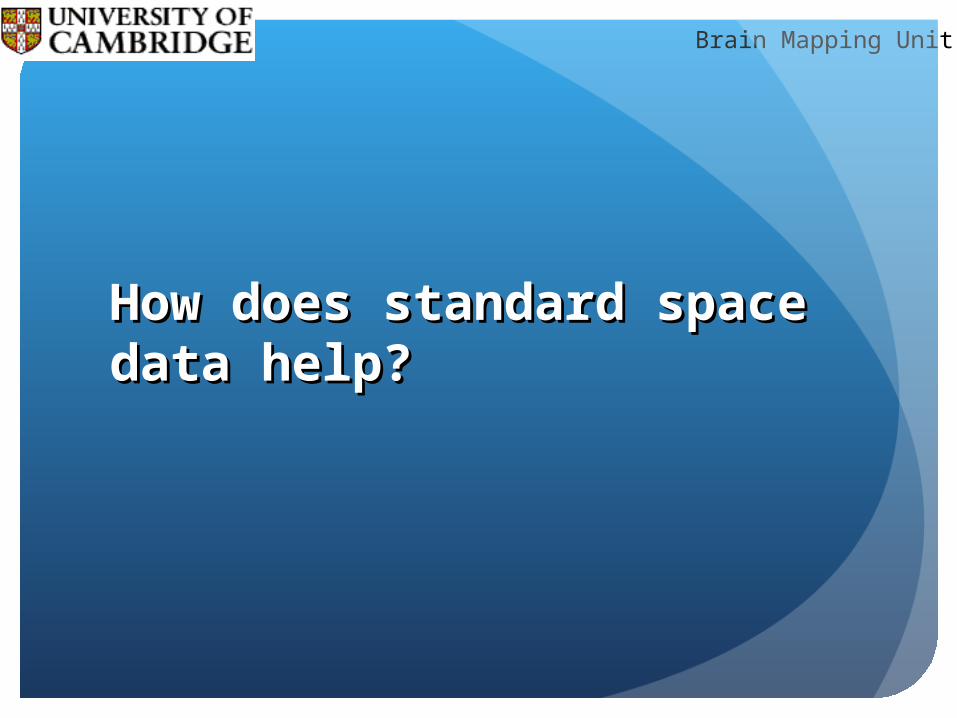
fmri analysis with FSLfmri analysis with FSL

Brain Mapping UnitStructural analysis with Structural analysis with CamBACamBA
groupsex weight

Brain Mapping Unit
Structural analysis outputStructural analysis output
Brain Mapping Unit
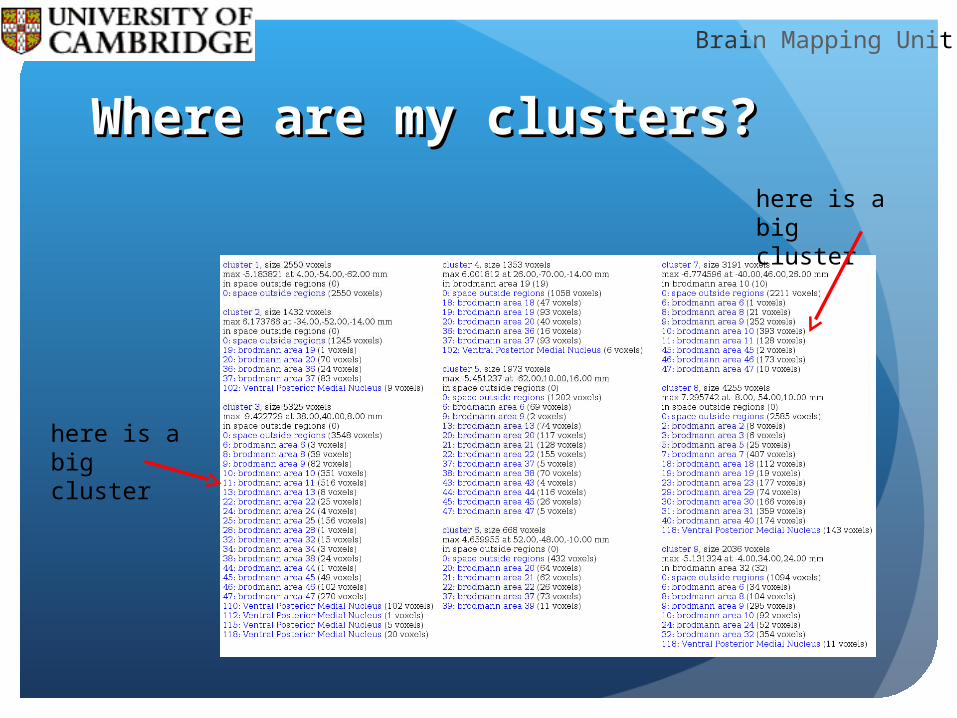
Where are my clusters?Where are my clusters?
here is a big cluster
here is a big cluster

Brain Mapping Unit
Where is the cluster I am Where is the cluster I am interested in?interested in?
position mouse cursor here
cluster location information shown here

Brain Mapping Unit
How do my clusters help How do my clusters help me?me?
Brain Mapping Unit
Statistical TestingStatistical Testing
Convert cluster into a binary maskConvert cluster into a binary mask
Overlay mask on subject dataOverlay mask on subject data
Extract voxel intensitiesExtract voxel intensities
Do some statistical analysis to get more Do some statistical analysis to get more information from your datainformation from your data

Brain Mapping Unit
Correlation with behaviourCorrelation with behaviour
p>0.05 close but cluster Pos_001 does not significantly correlate with behaviour HIT1
for cluster Pos_002
Brain Mapping Unit
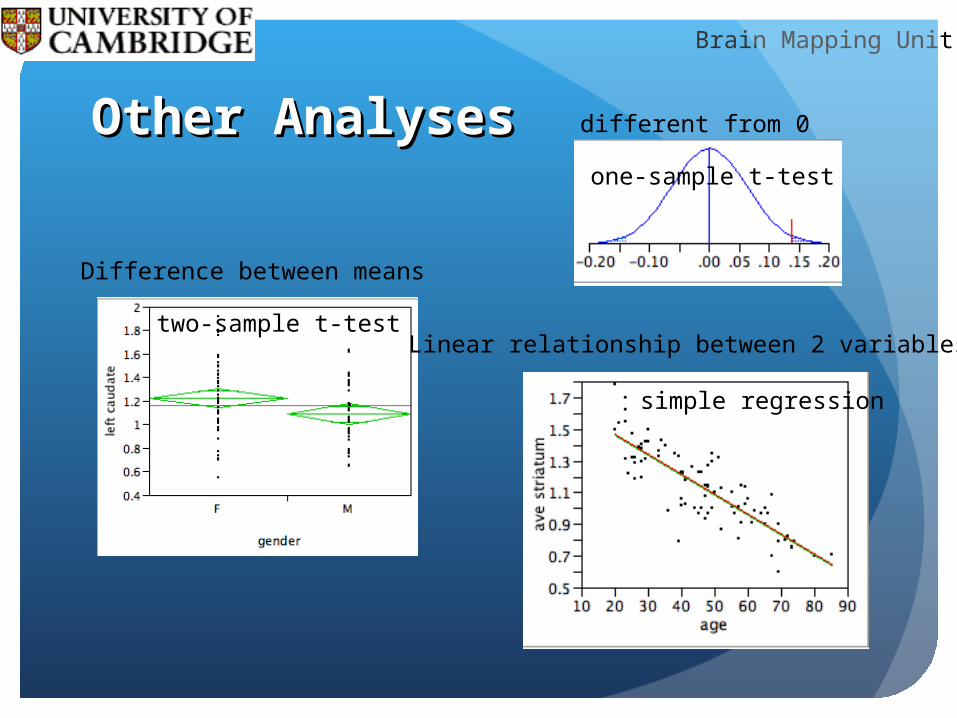
Other AnalysesOther Analyses
two-sample t-test
one-sample t-test
simple regression
Difference between means
different from 0
Linear relationship between 2 variables
Brain Mapping Unit
What else can I do to find What else can I do to find out more about my data?out more about my data?
Brain Mapping Unit
Other types of analysesOther types of analyses
Factorial designsFactorial designsPermits analysis of multiple time dataPermits analysis of multiple time dataShowsShows
Main effects of Factor 1 (time)Main effects of Factor 1 (time)Main effects of Factor 2 (group)Main effects of Factor 2 (group)Interaction between Factor 1 and Factor Interaction between Factor 1 and Factor
22
Brain Mapping Unit
Useful software packageUseful software package
CamBA – CambridgeCamBA – Cambridge http://www-bmu.psychiatry.cam.ac.uk/http://www-bmu.psychiatry.cam.ac.uk/
software/software/
FSL Randomise – OxfordFSL Randomise – Oxford http://fsl.fmrib.ox.ac.uk/fsl/fslwiki/Randomisehttp://fsl.fmrib.ox.ac.uk/fsl/fslwiki/Randomise
SPM8 – UCLSPM8 – UCL http://www.fil.ion.ucl.ac.uk/spm/software/http://www.fil.ion.ucl.ac.uk/spm/software/
spm8/spm8/
Brain Mapping Unit
In summaryIn summary
The GLM allows us to summarize a wide The GLM allows us to summarize a wide variety of research outcomes by specifying variety of research outcomes by specifying the exact equation that best summarizes the the exact equation that best summarizes the data for a study. If the model is wrongly data for a study. If the model is wrongly specified, the estimates of the coefficients specified, the estimates of the coefficients (the beta values) are likely to be biased (i.e. (the beta values) are likely to be biased (i.e. wrong) and the resulting equation will not wrong) and the resulting equation will not describe the data accurately. describe the data accurately.
In complex situations (e.g. cognitive fMRI In complex situations (e.g. cognitive fMRI paradigms), this model specification paradigms), this model specification problem can be a serious and difficult one problem can be a serious and difficult one
Brain Mapping Unit
Any questions?Any questions?
Recommended