Bprtional Aercmautics and Space Administration h s Research Center
. Moffett Field, calif.
polystyrene , polpiny1 chloride and polyethylene terephthalate . Tensile _e.-
yield stress was measured at strain rates varying from 0.003 in . /b . /min
t o 300 h./h./min and at temperatures &ing from approximately 15O C
above the glass transition temperature, Tg, t o at least' 100° C below Tgd I .
I
.'Ihe resultant yield - or i n the brittle temperature range - failure s t r e s s ,
when plattea aa a function of logarithm of strain rate, has been shifted
l a t e r a w t o construct /a y i e u stress master curve similar in concefl t o c
the well-lmawn stress relaxation master curve.! These master curves cover
from I 2 t o 18 decades of shif'ted strain rate. The master curve for-e-wh
material has a char&teri&ic slope which leads, in each case) to a 6hqpl.e
equation relating yield stress t o strain rate and .temperature and is appli-
cable fo r temperatures From Tg t o approximately 100' C below Tg.
t e q p e r a t u r e - h m e n t ,shift factors, q, of each material were determined
for both yieid stress and stress rehaxstion Over the temperature renge.
I
The
Co~uparisan of these -9 curves s d s that in both the ductqle and bri t t le
temperature ranges of each materia i , the shape of the yield stress and stress
relsxation 9 curves are very similar. Hawever, the absolute magnitude of
the change w i t h teqperature can be SubstSntIally different.
- Two possible .
https://ntrs.nasa.gov/search.jsp?R=19650022561 2019-12-29T09:34:41+00:00Z

. 4 .
& INTRODUCTION *
The standard method for determining tensile' strengths of plastic8
by testing at a given temperature and at one selected s t ra in rate is poten- r 1
. tially inadequate for determining the tensile strengths of plastics when
they are subjected t o a brogd range of s t ra in rates and temperatures.
the tempemture range &om the glass transition temperature (Tg) the 'time
In i
. . \.
and temperature dependence of mechanical behavior of polymeric materials . 4 2 4
However , no similar general concepts have been reported for correlating
mechanical behavior of plastics i n the temperature range below their
Knowles and Dietz3 showed that the yield stress of poly$&thyl methacrylate),
(M), wa8 strongly dependent on temperature and s t ra in rate.
Tg.
h h r and
Parker4 showed that the yield stress of MMA detelmined a t different 6- .
peratures and s l i r d n rate8 could be shifted laterally t0 construct a yield
I. stress master curve wfiich, In turn, could be approximated by a simple equa-
t ion contahlng the fipplied etrain rate, i, and 8 temperahre dependent
sh i f t factor, 9. In the present study, the applicability of the yield
-7 - 7
I
st ress master curve concept t o H M A over a greater temperature and s t ra in
rate range and t o three addi t ional plastics was investigated. \
In addition,
the correlation between the temperature dependence of stress relaxation,
yield stress and torsional daq?ing was studied. 1
-To test the generality of'the eld stress master curve concept three i
additional materials %ere chosen ch exhibit sl ightly different behavior 9 I
from FMMA.1 Polystyrene (PS) hss apigh inherent f l a w size,' polyvinyl '
- I I
has been correlated by the equation and Smith's2 failure envelupe.
chloride (PVC) generally behaves in a ductile m e r during tensile tests ..

I
i
0 .
and polyethylene terqhth late (mlar) is partially crystaLL=. mrsiona
wing, tensile-yield stress, and stress relaxation were measured for the
four laateriala over the approximate temperature range of Tg + 15' C t o at
least T~ - ~OO? C. rate thhs a temperature dependent constant) for each material were con-
structed and the constants for the equation4 were calculated.
Y i e l d stress master curves (yield stress versus strain
The temper-
ature dependence of the sh i f t f'tors determined by construction of yield
stress and stress relaxation curves was compared by samewhat arbitrarily' 'k
referencing them t o the temperature, Tr, where the 1ogari.t;tnnic decrement,
. ' I
1 - .I
of the amplitude of free torsional oscillations was equal t o 0.5. This
allowed direct comparison of the tempe&turedependent behavior of the
four materials. L
*
. - Materials
The four principal materials used were purchased as sheet stock fran
C a d i l l a c Plastics Co. %bey w i l l be referred t o herein as follars:-+hxi-
glass G as PMMA-G, polystyrene as PS, polyvinyl chloride as PVC and poly-
etbylene terephthalate as Mylar.
1/32 inch thick and the wlar was 0.010 inch thick.
The first three materials were nominally
The camercial mat-
erials were wed because of the large n-er of tensile specimens required
for verification of the master c-a-vie concept.
of ;he yiela stress and torsional &anping behavior of the PMMA-G w i t h
poIy(nmeW1 methacryhte) of known, composition, several 10- by IO-incb
sheets of poly(metby1 methacrylate) referred t o as HfMA-1 were prepared
To allow Umited comparison
i -

de c r i b d , e except in this instance ue monomer 80
into molds which had teflon gaskets between glass plates and which were evac-
uated and then purged with dry nitrogen.
24 hours and then at llOo C f o r 48 hours.
clear but the thickness of each sheet varied from approximately 0.025 t o
0.035 inch; however, within a given specimen, the variation in thickness did
not exceed 0.003 inch.
The molds were held at 60° C for
Ihe resulting sheets were optically
1,
1 m e materials were characterized mechanic* IJY the freely oscillating<& \,
a
torsional pendulum described previoudy.' The logarithmic decrement, A,
versus temperature curves for the five materials are shown in Fig. 1.
logarithmic decrement is defined as the natural logarithm of the ra t io of
the amplitules of successive free oscillations.
the damping fo r each material peaks within a narrow range of temperatures;
Thie 4
The data'plotted show that
however, as indicated by the daahed lines, the peak temperature could not -
be directly determined in most of thew t e s t s . The approximate peak t em-
peratures for the four connnerclal mterlals are indicated on the figure and
given on table I. However, because of the mcertainty of the location-c# '
' the peak of the damping c-me, a point on the ascending portion of the
\ curve was chosen as a reference temperature, Tr , for each material. The
glass transit ion t e w r a t u r e , Tg , of the PMMA-I was previously' measured
as 108' C. !he damping curve has a value of A = 0.5 at 108O C for PMA-I.
Thus, the tempebture at which A = Oi5 was defined as the Tr for each of
the maieriale And is listed in colum0/2 of table 1. These values of Tr t
I
should be approximately the glass t r&si t ion temperatures of the remaining
materials.
15' t o 160 lower than the accepted value7 of Tg far this material. a2e
Hatever, it may be seen that Tr = 60' c fo r PVC is appro-tew b L
\
-4-
t . ed a sirnil r amount from that sham by
Schmieder and Wolf.' Similarly, t h e value of Tr = 82' C for PS is 18O C
lower than the accepted value' of T
been reportedg with a Tg of 82O C. As w i l l be sham in the discussion
section of t h i s paper, the values given in column 2 of table I probably
I ire within k2O c of the glass transition temperatures of these two can-
m e r c i a l m~teriaLs and the differentials i n
buted to additives in the sheet stock which act as plasticizers.
although data on polystyrene have g'
I
Tg noted sbove - be attri-
Test Equipment and Methods
The torsional damping curve was deiermined by the instrument and methods I
previously described,' except that, i n the transit ion rhgion the temperature
.was increased i n increments of 5' F instead of 10" F and then the sample wa8
given 10 minutes for its tempexatwe t o equilibrate. b
Temperatures for a l l
of the torsional damping, tensile-yield stress, and stress relaxation tests
were measured w i t h a potentioaneter to +1/2' C.
The tensile teste for constructing master curves were run at constant
s t ra in rates in a B&ldwin FGT 56 testing =chine f i t t e d with a Missher
furnace t o control temperatures. For temperatures above ambient, the Missinw
furnace was modified so that two coils supplied heat at a constant rate.
Below slnbient temperatures a variac powered Cal-Rod i n a l iquid nitrogen
boiler supplled a constant flow ofJgaseous nitrogen.
wa8 placed on the outlet side of the air circulation fan.
then controlled temperatures both &ove and below anibient.
t ions produced f1/2' C controlled 'over the length of the test period.
The control sensor
Trro heating coils
IThese xmlifica-
Some
I -
additional tensile tests were run in a Plas-Tech 591 high-speed tensile test
-5 -

machine over a strain rate range of 0.007 t o 300 in./in./min. Sese tests were
made t o verify the corxkinuity of the increase i n yield stress a t higher strain
rates than those available in the Baldwin machine. These tests i n the Plas-
Tech machine were run a t 24O eo C.
were cut f'rom slngle sheets of each of the four commercial materiale for both
the Stre88-1%?h~ati011 and tensile testa. Becauee of the small. amount of €%MA-1
*
Standard AS'IM D-638 tensile specimens
available and the variation i n thickness across each sheet, smaller specimens
with cross sections of 0.250 inch wide and over-all length of 3-l/2 inches''D
were tested t o canpare the tensile strength of the PMMA-I and PMMA-G.
- a
The
small specimens of PMMA-G were tested t o determine if there was a specimen
size effect. a
Ihe strain rate was determined by dividing the crosshead speed
by the distance between grip faces which was 3-1/2 incdes fo r the D438 speci-
.mens and 2-1/2 inches for the smaller specimens. That th i s procedure gave the
true strain rate within 23 percent through the yield point was verified by .
compasistm rates determined by placing Baldwin Microformer extensometers
directly on the gage section of the specimens.
The stress relaxation was measured with the instrument sham I rF Ig . 2.
The specimen is elorlgated by a known and reproducible amount by an essen-
tially instantaneous stroke of the linear actuator, and the load is there- \
after recorded a8 a function of time. The instrument was designed for high
stiffness, rapid loadhg and reproducible displacements,
is linked to'the wedgestcould be activated ei ther electrically o r mechani-
cally so thak the entire loading p cess wa8 completed in not over 0.04 sec-
ond.
application.
The plunger, which
i Fp -
Data were then taken start^ a t 0.4 second after the i n i t i a l load
Ihe displacement, whhh was 0.050 inch fo r a l l k 6 t s reported
here, was reproducible within +O.o002 inch as measured by SR-4 strain gages.
t
on a specimen and a .linear variable differential transformer fastened t o
the two gripe. !&e assembly i n F i g . 2 was mounted on the frwt panel of
a Stat- SD-8 air bath temperature control cabinet. !The Kulite Itytrex
JP-100 semicondflctor load cell was excited by a Harrison Isb 6226A parer
aupp~y.
Oscilloriter.
the lowest temperature for the particular series t o be run, l e t t ing the
me b a d cell output waa recorded on a b h tnmten t s
The test sequence consisted i n cooling the specimen t o
x. temperature equilibrate for one hour, taking up slack t o account for
thermal expansion or contraction,loading, and allowing the specimen to
relax for appraximstely 30 minutes, thus producing a relaxation curve
extending Over nearly 4 decades of t h e .
and the next higher temperature set.
4
* The specimen & then unloaded
t
RESULTS AND DISCUSSION
Y i e l d Stress Master Curves
Three def;ln$.tiw o f yield stress are q l o y e d i.n th l s p a ~ r . W e - -
dist inct types of behavior were observed depend- on the p a r t i c d r 5 t e r i a l
an& k q e r a t u r e . The first type i s known as b r i t t l e behavior and is observed
when a msterial suddenly fails while s t i l l i n the ascending portion of i t s
stress-strain curve. In th i s case, The yiela stress is the failtire load
divided by the initiaJ cross-sectional area.
t o the true failure stress if the dross-sectional area has not decreased s i g -
nificantly. ' The second type is askociated with the temperature range in c
which plastics behave in a manner ;similar t o low carbon steel; that is, they
shuw a definite yield with subsequent easily observable reduction i n cross-
Thus, it is essent- equal
I
i -
1
sectional area and then proceed t o fa i l . In th i s second case, the yield
stress is calculated from the peak load at the f i r s t yield point and might
h

1
I : ?
s
L . aclusluy be significantly greater or less than the true failure stress.
th i rd type for plastics seems t o occur in the region of their glass t ransi-
t ion temperature.
num in that the stress as a function of s t ra in increases a t a decreasing
ra te . However, for the region above Tg t h i s stress-strain behavior in
plast ics can continue t o strains of' 100 percent or =re. Here the yield
stress has been calculated from the load at which a line drawn from
The
Here the stress-strain curve is similar t o that of alumi-
~ 2-percent strain paral le l t o the in i t ia l slope of the load-strain curve
intersects the curve*
sectional area. Each of the four materials discussed exhibit a t least two
of these three types of behavior in the temperature range covered.
'a
This load i s then divided by the i n i t i a l cross-
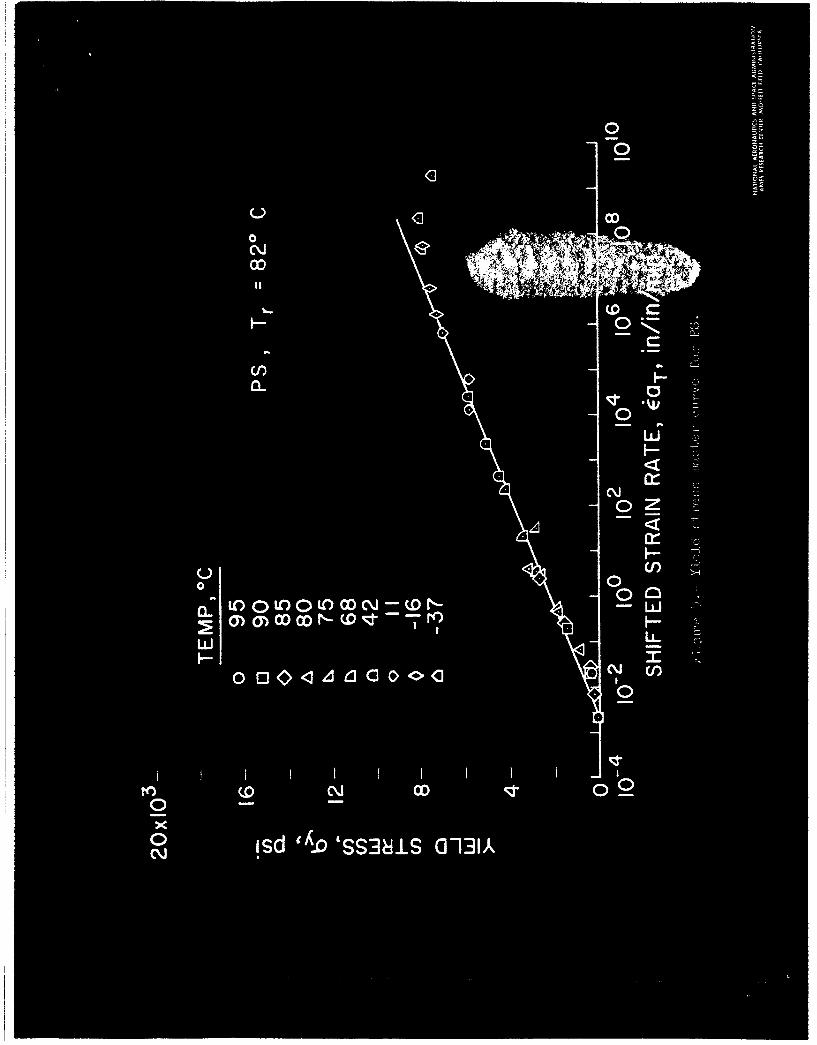
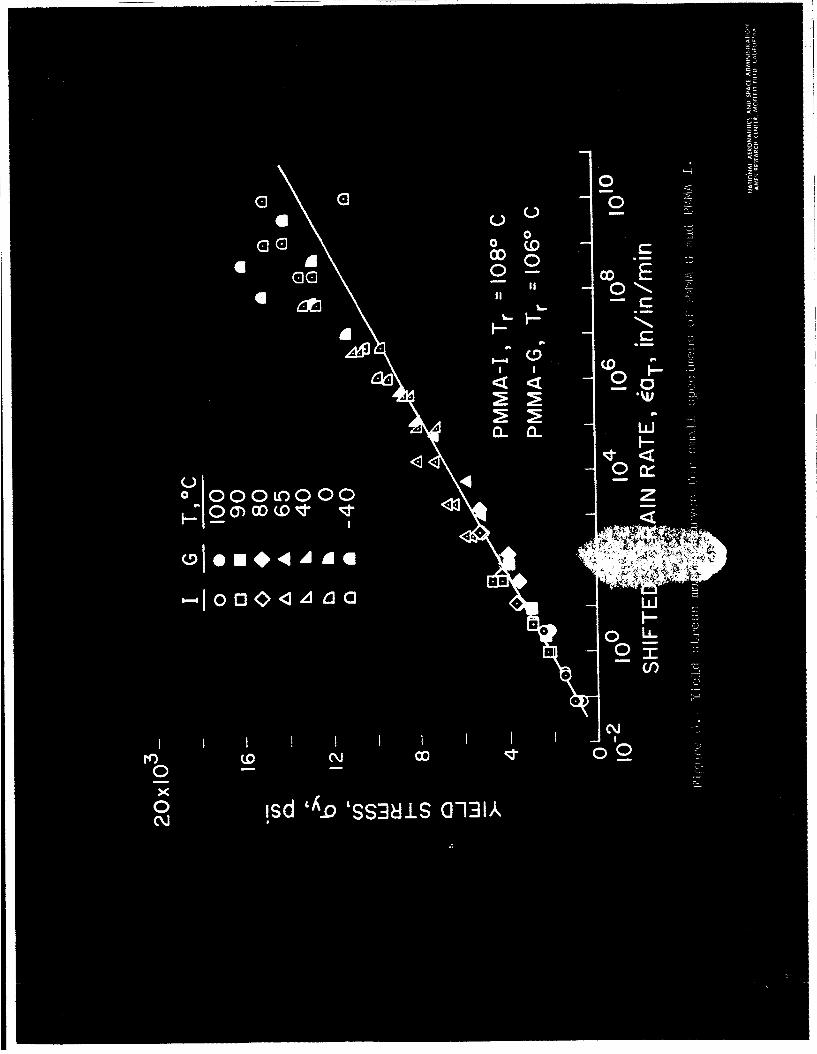
Yield stresses of PMMA-G determined at the temperatures shown and at
s t ra in r s tes from approximately 0.005 t o 3 in./in./min were shifted l a t e r a m
t o construct the master curve of yield stress, u
times the temperature shift factor, 9, as shown in Fig. 3.
referenced at Tr = 106'; thus % has the value of 1 at th i s temperature
and Fig. 3 could be used directly t o predict yield stresses at t h i s fem-
perature for the strhin rates shown.
9 will be given la te r in th i s section.
structed in a similar manner are shown for wlar, PS, and W C in Figs. 4, 5,
\
xersus s t ra in rate, k ,
lbe curve is Y
More discussion about the values of
Yield stress master curve6 con-
and 6, respectively. .In general, the yield stresses in Figs. 3 through 6
vary approxhte ly linesrly with the logarithm sf the s t ra in ra te . Thus,
each master curve in / the four figurbs has been approximated by a straight
line !be data of Figs. 4, 5 , and 6 f a l l very closely along one straight
l
line, whereas the PMMA-G data in Fig. 3 might have been approximated by
two l ines. It is *resting t o obseme that for PMMA-G, the steeper
slope which seems t o occur in the curve fo r yield stresses determined 1 1.
-0-

L . . <
lr at 40° C and lower corresponds t o the temperature range below the secondary
damp- peak observed h Fig. 1. The other three materials do not have this
secondary damping peak and have a more linear relationship between yield
stress and strain rate.
The et ra lght linee drawn through the yield stre46 ma8ter curves nay be
represented by an equation of the form:
= K , + K , 2 n - 9 €
aY El
where ay, 6, and are as defined above; Kl and K2 are constants which
depend on the type of material and on the reference temperature chosen; and
e , is equal t o 1 in./in./min.
units of psi, 6 in units of in./in./min, and % is dimensionless. This
5s the same general equation reported previously* except that the constants
d
For this paper, %, K1, and & w i l l be in <
-
have been recast t o allow easier calculation of yield stress f'rcen a given
s t ra in rate and shif t factor. The values of the constants K1 and & and
the stress and temperature limits of aFglicabili%y of equstioa (3.) se Ceter-
mined in th i s series of tests are given i n table I. _ _ _ I
Equation (1) cduld be used t o determine yield stresses a t any temper-
ature within the range studied and Over a wide range of s t ra in rates,
including those not readily available in the laboratory.
calculated from equation (l), the constants of table I, and the s h i f t fac-
tors! 9, derived from the construction of the master curves, were eompared
with yield stresses determined frd tensile tests run on a Plas-Tech 591
tensile test machine.
are plotted as a function of strain rate.
Yieid stresses
i The cornparidon is s h m in Fig. 7 where yield stresses
i
The agreement is very satisfactory.
-9 - \
1

c . * The yield stress master curves f o r the s m a l l samples of FW4A-G and
=-I are compared i n Fig. 8. Also in Fig . 8 is the straight line
approximation of the master curve for the larger samples of PMMA-G used
t o obtain the data of Fig. 3.
curvce of BM4-0 and --I were essentially the 8- within the scatter
It may be seen from F i g . 8 that the msster
of the data.
data of -Fig. 8 quite w e l l , indicating that the effect of specimen size
is small.
Ihe straight l ine approximation from Fig. 3 also fits the
Relations Between 9 Shift Factors
#
Just as it was possible to gain insight into polymer behavior i n the
temperature region above the glass t r a n s i t i o n temperat&, Tg, by use of
the WLF equation,' it should be possible t o learn something about the
behavior of polymers a t temperatures below Tg by comparing the shift
factors determined by construction of yield stress and stress relaxation
master curves. To this end, Figs. 9 through l2 contain the shift factors
aT plotted as a function of temperature fo r the four principalmaterials.
Shift factors used for constructing both the yield stress and stress relax-
ation master curves are shown for each material. In a l l cases, &r has the
value 1 at the reference temperature. Where possible, data from other
authors'have been compareit w i t h the experimental sh i f t factors determined
as par t of t h i s work.
properly, it was necessary t o know w h a t reference temperature t o use.
Tobolsky e t a1." define a referexhe temperature, T i , as the temperature
a t which the relaxation modulus attains the value of 109 dynes/cm2 in
10 seconds.
To include tpze sh i f t factors of these authors
i
The relaxation modulus is defined as the time-dependent stress
., I
. . -10-
~
\
4 .r , .'

. . divided by the imposed strain. V a l u e s of T i derived with Tobolsky's
definition were calculated from the current stress relaxation tests and
included in table I as Ti* This definition is not applicable t o Wlar,
i
!.
* ;
however, because even a t the highest temperature tested, 130' C, the
m o d u l u s had not decreased t o 109 dynes/cm2.
that Ti and Tr are close enough t o be used interchangeably. Thus, it
L
i. i
It may be seen from table I
f: should be possible t o campsre other investigators'work, which is referenced 1.
i a t Ti, with the current data which are referenced a t Tr. It w i l l be ", + i
i necessary only t o sh i f t their data la teral ly an amount equal t o T i - Tr.
Therefore, i n Fig. 9, where the data of Tobolsky e t a1.l' and d
Iwayanagi12 have been included, the data of ref. 11 (Ti = logo C ) have
been shifted 3' C to the le f t , and the data of ref. G, which have a T i
The data for polystyrene'l . of 119' C1l were shifted 13O C t o the left.
shown in Fig. 11 were shifted 21' C left .
did not include a reference temperature; therefore, the
were arbitrarily plotted so that 9 = 1 a t T, = 96O C.
Ward's13 data on mlar (fig. 10)
&r sh i f t factors
I n both Figs. 9 and ll the agreement among the s t ress relaxation sh i f t
factors (SR 9) determined in this study and those from refs. 11 and 12
is seen t o be quite good indicating the correctness of the temperature
referencing system just described. The divergence of SR &r in the 65' I I*
t o 80' C temperature .region shown in Fig. 10 may be due t o improper referenc-
i n g or could easily be due to differences in crystall inity as Ward's material t
[ f.4.
was i n m o n o k i w n t form. i I I 1
_ -
A general observation which nky be made from studying Figs. 9 through \
I 2 separately is that, i n general, the yield stress shift factor (YS %)
-u-

4 points lay below the 8R &r points i n the region below Tg. Two possible
explanations for th i s may be given. In the vicinity of the glass transit ion F
temperature, Tg, and above, the temperature dependence of SR 8~ and YS &r
(or failure strese 9) is given by the WLF equation2 and is the same fo r
both.
stress and st rain may became nonlinear (i.e., a t the same increment of time
t I
E m r , banesth Tg, as the strain increases, the relation between f / i 5 $ after loading, twice the imposed strain w i l l not produce twice the stress). .
This nonlinearity would cause lower yield stresses and consequently lower',.
incremental YS 9. This argument is consistent witin the experiments
because the
YS 9 were determined a t generally h i d e r strains up t o about 4 percent.
The other possible explanation i s that the material is 'not able t o reach
.
SR q were determined a t 1.43 percent strain, whereas the
1
i ts "true yield stress" before it fai ls , because cracks propagate from
inherent flaws as discussed by Berry.'
the yield stress which might be calculated from a strength theory such as
Bue~he's '~ w h i ch is formulated formaterials i n their glassy state or from
equation (1) using SR &re
additive, it is fel t that the la t te r probably explains the ma3or portion of
the wide diversity between
difference i n slope of the two sets of points then would indicate an increas-
ing inherent f l a w size with decreasina; temperature.
Berry' 8' work indicates that the inherent f l a w size iricresses with increas - ing 'strain Pate.
work because of the demonstrated e,ufvalence between decreasing temperature
and increasing s t ra in rate.
This true yield stress would be
9
Although these two general effects will ,be-
SR 9 and YS 9 for FS shown i n Fig. ll. The
Close examinstion of
The proposed mec$anism is therefore Consistent with Berry's
1 :-i:
h _ F
i- i
-12-
I c

-,-
I
The YS 9 for a l l four materials are s h m in Fig. 13. H e r e the
YS &r points i n Figs. 9 through I2 have been plotted so as t o pass through
a common reference temperature. Thm, the figure consists of s h i f t factors
plotted againsethe difference between the test temperature and the reference
temperature.
for PMMA-G, PVC and mlar may easily be seen.
%e strong similarity i n the temperature dependence of YS 8~ It is also not surprising,
i n light of the just discussed teqerature-dependent f l a w mechanism, t o
see that for PS the YS 9 fall below those f o r the other three materials. c
The best f i t curve for IMMA-G, Mylar and PVC of Fig. 13 is carried over
into Fig. 14 where
t e s t temperature and the reference temperatures of each material.
SR % are plotted against the difference between the 4
Here the
agreement m n g the four materials is not as good as $or the YS &r shown
in Fig. 13. However, i n both figures there are some definite differences.
For instance, i n the transition or reference temperature region, the slope
of the
the average slape of the l3MA-G and PS % curves. Also, the incremental
SR % cannot be measured as accurately as the YS % because the percent
change i n the streds relaxation m o d a l u s i n the glassy state is often much
&r points fo r PVC is definitely greater and that of Mylar less than
i' !
less than the cha.nge in yield stress.
reproducibility of the displacement distance i n the stress relaxation system
shown i n Fig. 2. Attaining reproducibility a t temperatures between freezing
and cryogenic temperatures is madeldifficult by dome stickiness of the loading
mechanism and f ros t buildup on the wedges.
This would accentuate errors in
*
r' -
i
It should be pointed out that, at leas t at t h i s stage of the development
of polymer science, it should not'be expected that the shapes of the 5
a 3 -

i. ' j I
! '
i * versus temperature c . m s in the glassy region w o u l d superpose i n a manner P
similar t o that described by the WLF equation above
hold that relaxation below Tg consists of side group motions; thus d i f -
ferent materiali, because they have different side groups, would not be
expected t o r e h a t the s m e rate or have the same temperature dependence.
The relations noted in this paper are therefore primarily of phenomenological
interest but may also be of use i n understanding basic polymer behavior.
Tg. Current theories" t
I i
. I
'i M
CONCLUDING REMAFXS
i '
s' c 3 ' The concept of the yield stress master curve was applied t o the four
I #
materials studied, poly(metw1 methacrylate ), polyvinyl chloride, poly-
styrene,and polyethalene terephthalate, and seems t o be an effective way l
a
of correlating the temperature and s t ra in ra te dependence of their yield
I 5. b. stresses even though the master curves may cover a behavior range encompass- i
\ ing br i t t l e , brittle-ductile, and highly ductile behavior.
curves can then be described by a s-le equation involving t w o constants,
These master
. - __.
one of which depends on the nature of the materialand the other on the
reference teqerat&e chosen.
yield stresses of approximately 1,000 t o 20,000 p s i with two exceptions.
One exception is for
The equation is applicabie over a range of
F'S, because the yield stresses do not go above about 1
8,000 psi; the other .exception is for wlar below 4,000 p s i because crystal- . . f .
I ,
? l i n i ty apparently causes the yieldlstresses t o be higher than given by the
equation. The approximate temperature range for applicatioa of the equation
I - > . I F'.
I
P 2,
is from Tg t o at least 100' C below Tg.
Conrparison of the shift factors required for constructing both yield
s t ress and stress relaxation master curves showed a strong simihrity i n
I -14 - 1
i 1
* . C - .
the temperature dependence of the four materials. Emver , the temperature
dependence does not appear t o be identical for all materials, nor is it the
same for both yield stress and stress relaxation, as it is above the glass
transit ion temperature.
of PVC and R4W-G is thought t o be a manifestation of nonlinearity a t high
loads, w h e r e a s the greatly divergent behavior of the PS Wt factors is
thought to be primarily due to failure ini t ia ted by terqPerature and s t ra in
rate dependent inherent flaws.
4
The slightly lower yield stress sh i f t factor curve
a
The reference temperature Tr picked f r o m the torsional wing curve
a t A = 0.5 for each material seems to be approximately equal to T i and
Tg different materials. #
d
and can be used 86 a reference temperature i n coqaring behavior of
I i
i i I
-15 -

. 1.
2 .
3.
4.
5 .
6.
7 .
8.
9.
10.
11.
12.
13
14.
15 9
W i l l i a ? n s , M. L., R. F. Landel and J. D. Ferry, J. Amer. chem.
soc., 77, 3701 (1955).
Smith, TO L a , ASTM Special Technical Publication No. 325 (1962).
Knowles, J. KO and A. Go N. Dietz, Trans. A.S.M.E. 77, 177 (1955).
L o b , J. J. and J. A. Parker, Polymer Preprints, New York A.C.S.
Meeting, 368 (1963).
Berry, J. P., J. Poly. Sci., L, 313 (1961).
Dudek, T. J. and J. J. Lob, t o be published i n J. A p p l . Poly. Sci.
Ferry, J. D., Viscoelastic Properties of Polymers, Wiley, New York
a
( 1961 1 I
Schmeider, K. and K. Wolf, Kolloid - Z., my 65 (1952).
Jenckel, E. and R. Heusch, Kolloid - Z. , 130, 89 (1953).
Tobolsliy, A. V., D. Carlson and N. Indictor, J. Appl. Poly. Si.,
7, 393 (1963).
Takahashi, M., M. C. Sen , R. B. Taylor and A. V. Tobolsky, J. A p p l .
Poly. Sci., 8, 1549 (1964). #
Iwayansgi, S., J. Sci. Res. Inst. Japan, 49, 4 (1955).
Ward, I. M., Polymer, 5 , 59 (1964).
Bueche, F.,Physical Prop er t ies of Polymers, Interscience:
Boyer, R.. F., Rubber Reviews, X X X V I , 1303 (1963).
New York (1962).
i
-
I
-16 -

TABLE I.
Characteristic Parameters for the Materials Studied and the
Limits of Applicability of Equation (1)
PVC
110
95
70
96 N.A. 5840 405 4,0OO<aj,<22,000 -37 to n o 82 81 2160 358 W O O < % < 8,000 -16 to go
60 61 3100 531 5OO< %<2O,OOO -37 to 60 RWA-I 108 .
I -17 - 1
__ ..

L i s t of Figures
Fig. 1.-
Fig. 2.-
Fig. 3. -
Fig. 4.-
Fig. 5.-
Fig. 6.-
Fig. 7.-
Torsional pendulum results for PMMA-G, =-I, NyW, PVC, and PS.
Schematic diagram of stress relaxation instrument.
Yield stress master curve f o r PMMA-G.
Yield stress master curve for whir. Yield stress master curve for PS.
Yield stress master curve fo r PVC.
Comparison of results of tensile tests a t 24O 2 2' C using Phs-Tech591
with predictions of equation (1) using constants of table I obtained by use
of Baldwin machine.
Fig. 8.- Yield s t ress master curves for small specimens of PMMA-G and =-I.
Fig. 9.- Yield stress and stress relaxation sh i f t factors for PMMA-G.
I
Fig. 10.: Yield stress and stress relaxation sh i f t factors for Wlar.
Fig. ll.- Yield stress and stress relaxation sh i f t factors for PS.
Fig. 12.- Yield stress and stress relaxation sh i f t factors for PVC.
F Q . 13.- Cmrparfeon of yield etrese sh i f t ftlctal~s with the temperature dlf-
ference between t e s t texrperature and reference temperature for the four
.
. -
principal materials.
Fig. 14.- Comparison of s t ress relaxation sh i f t factors with the teqerature
difference between t e s t temperature and reference texperature for the four
principal materials ,
-18 -


Recommended