Important disclosures appear on the last page of this report.
The Henry Fund Henry B. Tippie School of Management
Benjamin Martin [Benjamin‐[email protected]]
BorgWarner, Inc. (BWA) March 31, 2016
Consumer Discretionary – Automobile Parts Manufacturers Stock Rating Buy
Investment Thesis Target Price $70 ‐ $76 The Buy rating given to BorgWarner is based on a discounted cash flow model and a holding period of 3 – 5 years. This recommendation reflects our view that the company has a solid position in technology that reduces emissions and improves fuel economy. In addition, they are making investments in hybrid/electric engine technology, which is anticipated to be an important segment of the auto market in coming years. Drivers of Thesis
Increasingly strict emissions regulations and zero‐emission vehicle mandates in several US states are driving demand for more fuel efficient vehicles.
Increased adoption of turbocharger technology is expected to benefit BorgWarner’s engine segment. Currently, turbocharger sales are expected to grow in the neighborhood of 8% per year.
The 2015 acquisition of Remy International positions BorgWarner to gain from an acceleration in demand for hybrid electric vehicles.
Low oil prices typically provide a boost to the global auto market. Risks to Thesis
Lower GDP per Capita expectations for China and the other BRIC nations has weighed heavily on shares.
Only a small portion of total automotive sales are expected to come from electric vehicles until at least 2020.
Oil & gas prices have different effects depending on the region of the world and may not be as relevant in certain markets
Additionally, low oil and gasoline prices may cause some consumers to lose interest in hybrid/electric vehicle technology, pressuring sales in the near term.
Henry Fund DCF $76.90Henry Fund DDM $32.63Relative P/E $40.12Price Data Current Price $38.4052wk Range $27.68 – $62.70Consensus 1yr Target $41.53Key Statistics Market Cap (B) $7.65Shares Outstanding (M) $224.4Institutional Ownership 96.6%Five Year Beta 1.75Dividend Yield 1.59%Est. 5yr Growth 10.7%Price/Earnings (TTM) 12.93Price/Earnings (FY1) 12.11Price/Sales (TTM) 1.0Price/Book (mrq) 2.2Profitability Operating Margin 11.7%Profit Margin 7.6%Return on Assets (TTM) 7.6%Return on Equity (TTM) 16.7%
Earnings Estimates Year 2013 2014 2015 2016E 2017E 2018E
EPS $2.73 $2.89 $2.72 $2.90 $3.37 $3.87
growth 23.0% 5.9% ‐5.9% 6.5% 16.5% 14.6%
12 Month Performance Company Description BorgWarner, Inc. is a global supplier of automotive components for powertrain applications such as turbochargers and automatic transmissions. The company operates primarily as a Tier 1 supplier to many of the major global automotive original equipment manufacturers, with Ford & Volkswagen comprising 15% each. In 2015, approximately 75% of revenue was generated outside of the United States. China is currently BorgWarner’s most important growth market, averaging 25% annual growth over the last five years.
12.1
16.7
7.3
11.1
26.4
7.1
0
5
10
15
20
25
30
NTM P/E ROE EV/EBITDA
BWA Auto Parts: OEM
‐80%
‐60%
‐40%
‐20%
0%
M A M J J A S O N D J F
BWA S&P 500
Source: Yahoo Finance

Page2
EXECUTIVE SUMMARY
BorgWarner has managed to carve out a respectable stake in the global auto parts supply industry. By focusing on improving fuel economy and reducing emissions output in the vehicles they supply BorgWarner managed to weather the storm of the financial crisis and build a business that is even stronger than before. Over the last five years, this focus has allowed them to grow total revenue at more than double the rate of global auto production, the underlying driver of demand at the company. Going forward, stricter fuel economy standards and emissions regulations, combined with a couple other broad auto trends, should allow BorgWarner to continue to grow their top line around 5% per year out to 2020 compared to auto production growth of 3.7% over that same time period.
However, this expectation comes with more than a few risks. Of the most significant is a further slowdown in China. Over the last 30 years, the world’s second largest economy has been able to achieve incredible growth, the result of a highly subsidized, export driven economy. However, as they begin to shift towards a more sustainable model built on domestic consumption, growth is expected to slow. In 2015, the impact of these lower growth estimates triggered a correction among parts suppliers with significant exposure in that region, including BorgWarner.
While this news is certainly something to keep an eye on, the underlying drivers of growth are still intact and the company is well positioned relative to their competitors. It is for these reasons that we believe the worst is behind us and a Hold rating is recommended.
COMPANY DESCRIPTION
BorgWarner is classified as a Tier 1 auto parts supplier, meaning that the majority of their products are sold directly to the original equipment manufacturers (OEMs). Many of the company’s products are aimed at increasing fuel efficiency and reducing vehicle emissions. These products include turbochargers, timing systems, emissions systems, thermal systems, various mechanical/electrical components for automatic transmissions and, as of 2015, hybrid electric motors. Approximately 95% of BorgWarner’s revenue is generated by direct sales to OEMs, with the remaining 5% coming from distributors of aftermarket replacement parts.
As a result of the demand for more fuel efficient vehicles, BorgWarner’s sales of turbochargers, which help boost engine power while improving fuel economy and reducing emissions, grew to 31% of total revenue in 2015.
The company reports in two segments, Engine and Drivetrain, and has operations all over the world.
Light Vehicles84%
Commercial Vechicles
7%
Off‐Highway4%
Aftermarket5%
2015 Sales by Product Line
Source: BWA 2015 10‐k
ForecastHistorical

Page3
Engine
BorgWarner’s Engine segment produces turbochargers, timing systems, emissions systems, thermal systems, thermostats, and diesel cold start/gasoline ignition technology. These products all help vehicles run more efficiently and with fewer carbon emissions. At a high level, demand for these types of products is driven by global automobile production. Going forward, growth in this segment will be influenced by two factors: global auto production and growth in turbocharger sales. Based on estimates by IHS Automotive and PricewaterhouseCoopers, auto production is anticipated to grow at an average annual rate of 3.7% out to 2020. Sales of turbochargers are expected to grow at nearly double this rate, or 8% annually, driven by stricter fuel economy and emissions standards.
Drivetrain
BorgWarner’s Drivetrain segment designs and manufactures two broad types of products: mechanical products (friction plates, clutch modules, torque management products, etc.) for automatic transmissions and rotating electrical components (starter motors, alternators, & hybrid electric engines) for light and commercial vehicles. While operating margins are lower than in the Engine segment, Drivetrain has made some significant progress overseas through a combination of joint ventures and acquisitions. One recent example is the acquisition of Remy International, which added several models of hybrid electric motors to BorgWarner’s product line‐up. However, hybrid/EV engines are only a small part (~$14 million in 2015) of segment revenue. As a result, we have modeled Drivetrain revenue growing at an annual rate of 3.7%, approximately in‐line with global auto production.
Customers & Geography
Two OEMs, Ford and Volkswagen, both account for approximately 15% of BorgWarner’s total revenue. As a result, BorgWarner’s results are highly influenced by auto activity in both the United States and in Germany.
In 2015, the United States regained the lead from Germany as BorgWarner’s most important individual country, the result of lower sales to Volkswagen following the highly publicized emissions scandal at the German auto manufacturer late last year.
However, Europe as a whole still accounted for 44% of total sales, demonstrating the importance of international markets to overall results. Sales in China grew an impressive 14% and finally surpassed the $1 billion mark. BorgWarner entered the Chinese market in 2005 when their Japanese joint venture, NSK‐Warner, opened their first production facility in Ningbo. China is a key market in the company’s global growth plan and, since 2010, has averaged 25% annual revenue growth.
United States25%
Germany23%
Hungary6%
France4%
Other Europe11%
South Korea9%
China13%
Other Foreign8%
BWA Sales by Geography ‐2015
Source: BWA 2015 10‐k
Page4
Growth
Despite volatility in the year‐over‐year growth rate, BorgWarner has managed to increase their revenue from ~$4.5 billion to just over $8 billion since 2006, a 6.4% annual growth rate over that time. Key drivers of revenue growth over the last 10 years have been a recovery in light vehicle sales following the Great Recession and the growing market for turbocharger technology that has resulted from a renewed focus on greater fuel economy and tougher emissions regulations. M&A has also played a part in fueling growth. In 2015, the ‐3.4% decline in revenue was partially the result of tougher end market conditions and partially the result of a stronger US dollar. 2016 revenue is forecasted to grow 18.1% before moderating to an annual rate of 4.6% ‐ 5.7%. The large jump in 2016 is the result of fully incorporating Remy International’s business. Ex. Remy, BorgWarner’s top line is forecasted to grow 5.1% in 2016.
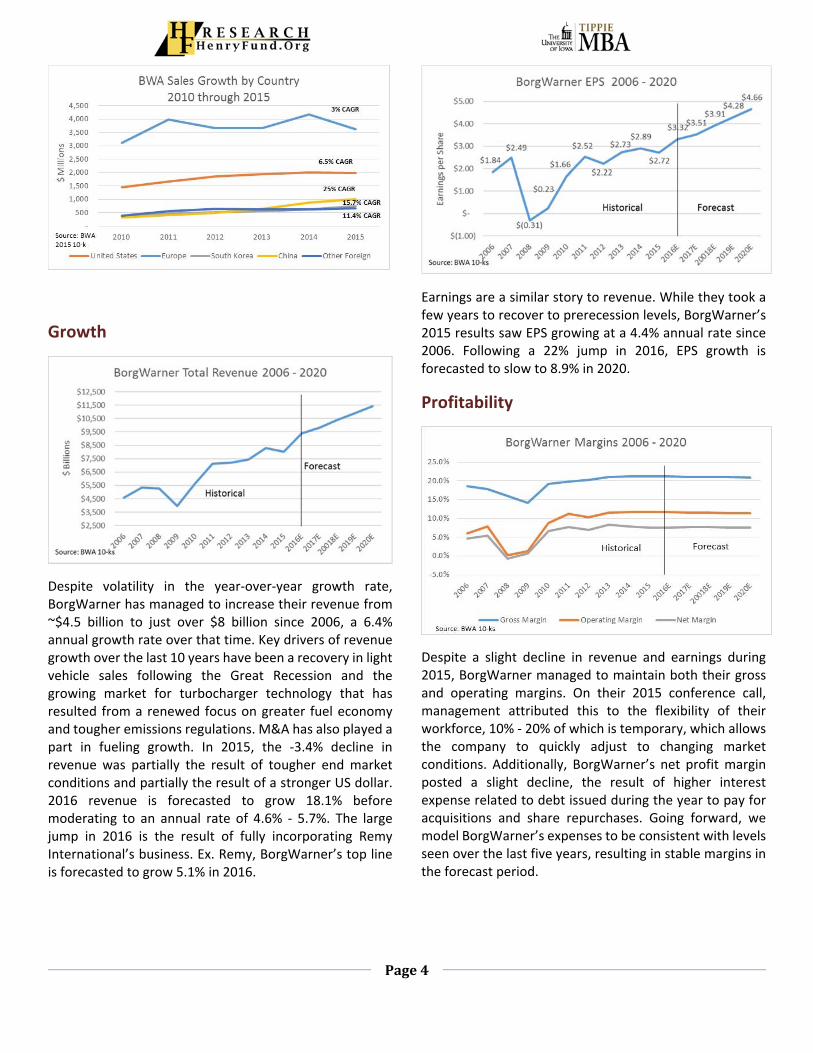
Earnings are a similar story to revenue. While they took a few years to recover to prerecession levels, BorgWarner’s 2015 results saw EPS growing at a 4.4% annual rate since 2006. Following a 22% jump in 2016, EPS growth is forecasted to slow to 8.9% in 2020.
Profitability
Despite a slight decline in revenue and earnings during 2015, BorgWarner managed to maintain both their gross and operating margins. On their 2015 conference call, management attributed this to the flexibility of their workforce, 10% ‐ 20% of which is temporary, which allows the company to quickly adjust to changing market conditions. Additionally, BorgWarner’s net profit margin posted a slight decline, the result of higher interest expense related to debt issued during the year to pay for acquisitions and share repurchases. Going forward, we model BorgWarner’s expenses to be consistent with levels seen over the last five years, resulting in stable margins in the forecast period.
Page5
Leverage & Liquidity
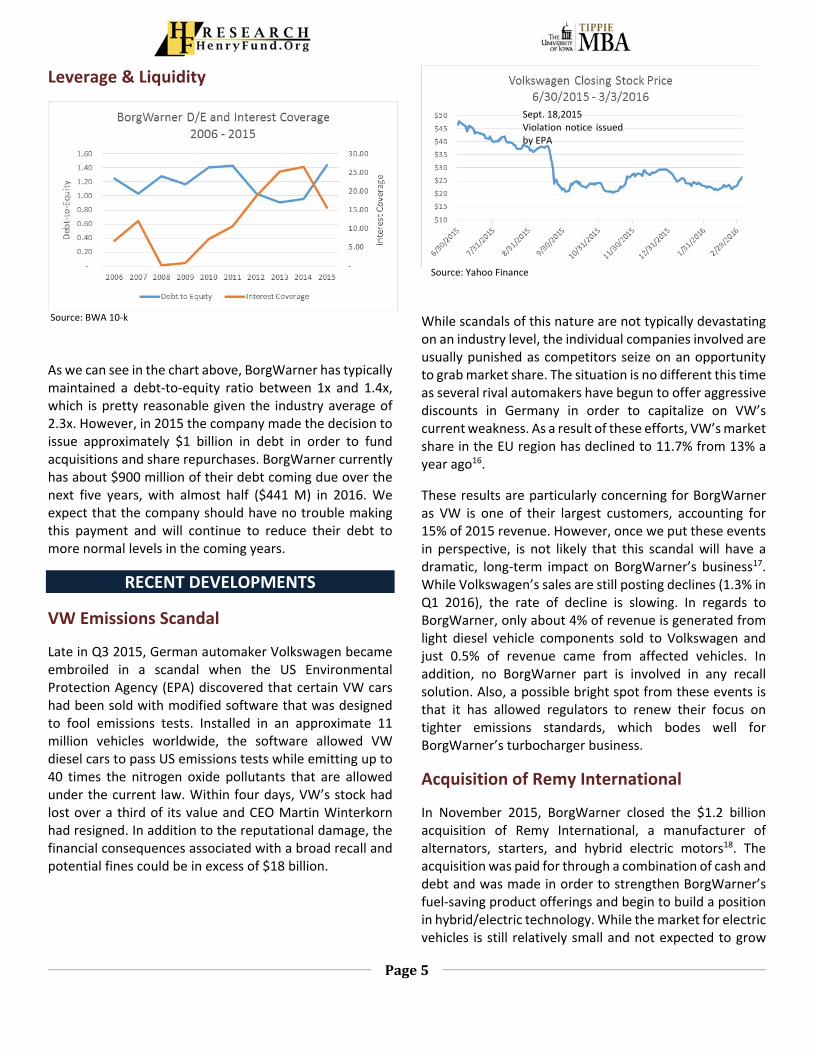
As we can see in the chart above, BorgWarner has typically maintained a debt‐to‐equity ratio between 1x and 1.4x, which is pretty reasonable given the industry average of 2.3x. However, in 2015 the company made the decision to issue approximately $1 billion in debt in order to fund acquisitions and share repurchases. BorgWarner currently has about $900 million of their debt coming due over the next five years, with almost half ($441 M) in 2016. We expect that the company should have no trouble making this payment and will continue to reduce their debt to more normal levels in the coming years.
RECENT DEVELOPMENTS
VW Emissions Scandal
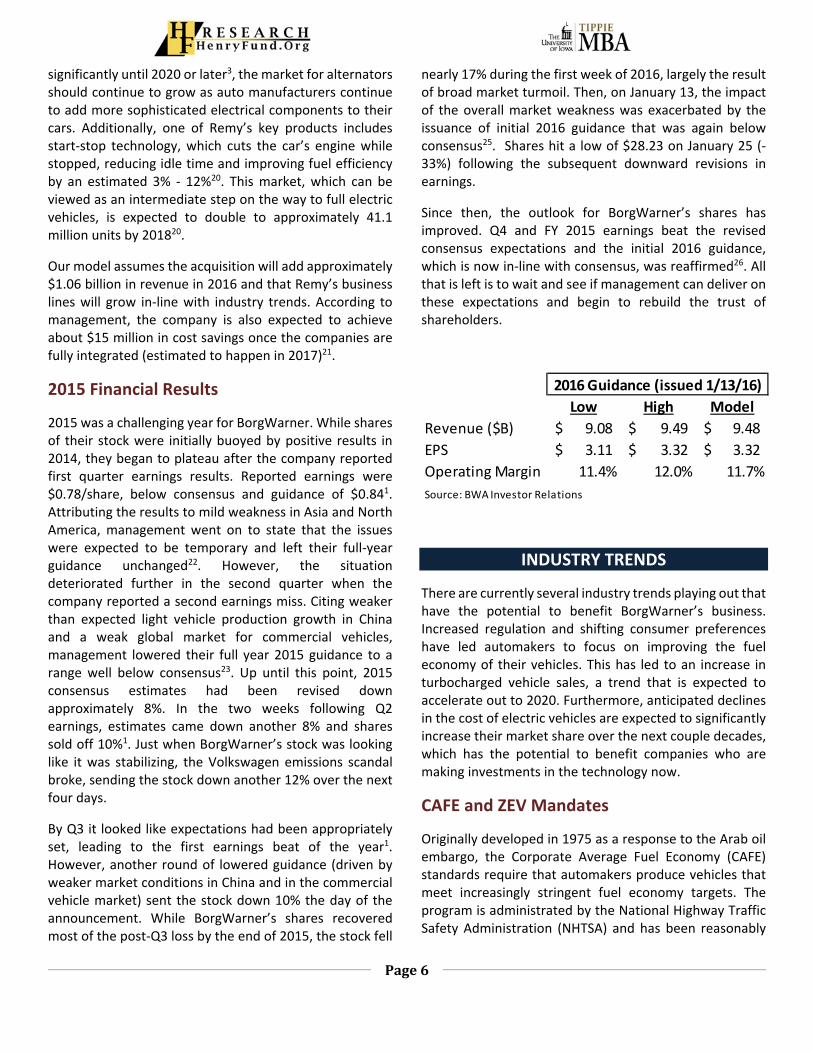
Late in Q3 2015, German automaker Volkswagen became embroiled in a scandal when the US Environmental Protection Agency (EPA) discovered that certain VW cars had been sold with modified software that was designed to fool emissions tests. Installed in an approximate 11 million vehicles worldwide, the software allowed VW diesel cars to pass US emissions tests while emitting up to 40 times the nitrogen oxide pollutants that are allowed under the current law. Within four days, VW’s stock had lost over a third of its value and CEO Martin Winterkorn had resigned. In addition to the reputational damage, the financial consequences associated with a broad recall and potential fines could be in excess of $18 billion.
While scandals of this nature are not typically devastating on an industry level, the individual companies involved are usually punished as competitors seize on an opportunity to grab market share. The situation is no different this time as several rival automakers have begun to offer aggressive discounts in Germany in order to capitalize on VW’s current weakness. As a result of these efforts, VW’s market share in the EU region has declined to 11.7% from 13% a year ago16.
These results are particularly concerning for BorgWarner as VW is one of their largest customers, accounting for 15% of 2015 revenue. However, once we put these events in perspective, is not likely that this scandal will have a dramatic, long‐term impact on BorgWarner’s business17. While Volkswagen’s sales are still posting declines (1.3% in Q1 2016), the rate of decline is slowing. In regards to BorgWarner, only about 4% of revenue is generated from light diesel vehicle components sold to Volkswagen and just 0.5% of revenue came from affected vehicles. In addition, no BorgWarner part is involved in any recall solution. Also, a possible bright spot from these events is that it has allowed regulators to renew their focus on tighter emissions standards, which bodes well for BorgWarner’s turbocharger business.
Acquisition of Remy International
In November 2015, BorgWarner closed the $1.2 billion acquisition of Remy International, a manufacturer of alternators, starters, and hybrid electric motors18. The acquisition was paid for through a combination of cash and debt and was made in order to strengthen BorgWarner’s fuel‐saving product offerings and begin to build a position in hybrid/electric technology. While the market for electric vehicles is still relatively small and not expected to grow
Source: BWA 10‐k
Source: Yahoo Finance
Sept. 18,2015 Violation notice issued by EPA
Page6
significantly until 2020 or later3, the market for alternators should continue to grow as auto manufacturers continue to add more sophisticated electrical components to their cars. Additionally, one of Remy’s key products includes start‐stop technology, which cuts the car’s engine while stopped, reducing idle time and improving fuel efficiency by an estimated 3% ‐ 12%20. This market, which can be viewed as an intermediate step on the way to full electric vehicles, is expected to double to approximately 41.1 million units by 201820.
Our model assumes the acquisition will add approximately $1.06 billion in revenue in 2016 and that Remy’s business lines will grow in‐line with industry trends. According to management, the company is also expected to achieve about $15 million in cost savings once the companies are fully integrated (estimated to happen in 2017)21.
2015 Financial Results
2015 was a challenging year for BorgWarner. While shares of their stock were initially buoyed by positive results in 2014, they began to plateau after the company reported first quarter earnings results. Reported earnings were $0.78/share, below consensus and guidance of $0.841. Attributing the results to mild weakness in Asia and North America, management went on to state that the issues were expected to be temporary and left their full‐year guidance unchanged22. However, the situation deteriorated further in the second quarter when the company reported a second earnings miss. Citing weaker than expected light vehicle production growth in China and a weak global market for commercial vehicles, management lowered their full year 2015 guidance to a range well below consensus23. Up until this point, 2015 consensus estimates had been revised down approximately 8%. In the two weeks following Q2 earnings, estimates came down another 8% and shares sold off 10%1. Just when BorgWarner’s stock was looking like it was stabilizing, the Volkswagen emissions scandal broke, sending the stock down another 12% over the next four days.
By Q3 it looked like expectations had been appropriately set, leading to the first earnings beat of the year1. However, another round of lowered guidance (driven by weaker market conditions in China and in the commercial vehicle market) sent the stock down 10% the day of the announcement. While BorgWarner’s shares recovered most of the post‐Q3 loss by the end of 2015, the stock fell
nearly 17% during the first week of 2016, largely the result of broad market turmoil. Then, on January 13, the impact of the overall market weakness was exacerbated by the issuance of initial 2016 guidance that was again below consensus25. Shares hit a low of $28.23 on January 25 (‐33%) following the subsequent downward revisions in earnings.
Since then, the outlook for BorgWarner’s shares has improved. Q4 and FY 2015 earnings beat the revised consensus expectations and the initial 2016 guidance, which is now in‐line with consensus, was reaffirmed26. All that is left is to wait and see if management can deliver on these expectations and begin to rebuild the trust of shareholders.
INDUSTRY TRENDS
There are currently several industry trends playing out that have the potential to benefit BorgWarner’s business. Increased regulation and shifting consumer preferences have led automakers to focus on improving the fuel economy of their vehicles. This has led to an increase in turbocharged vehicle sales, a trend that is expected to accelerate out to 2020. Furthermore, anticipated declines in the cost of electric vehicles are expected to significantly increase their market share over the next couple decades, which has the potential to benefit companies who are making investments in the technology now.
CAFE and ZEV Mandates
Originally developed in 1975 as a response to the Arab oil embargo, the Corporate Average Fuel Economy (CAFE) standards require that automakers produce vehicles that meet increasingly stringent fuel economy targets. The program is administrated by the National Highway Traffic Safety Administration (NHTSA) and has been reasonably
Low High Model
Revenue ($B) 9.08$ 9.49$ 9.48$
EPS 3.11$ 3.32$ 3.32$
Operating Margin 11.4% 12.0% 11.7%
Source: BWA Investor Relations
2016 Guidance (issued 1/13/16)

Page7
successful since its inception with the average MPG of new passenger cars rising from 24.3 in 1980 to 36.4 in 20146.
Currently, the standards require the collective auto fleet to be able to achieve 49.6 MPG by 20257. Although automakers are fighting to weaken the standards, the amount of political will behind these standards make it unlikely that they will achieve any significant reduction.
While the CAFE standards are the federal government’s attempt to reduce dependency on fossil fuels and improve the fuel economy of cars, several states are taking things one step farther. First enacted in 1990 as a response to the poor air quality in Los Angeles, the California Air Resources Board (CARB) began requiring that a certain percentage of all automobiles delivered in the state be “zero‐emission”, in other words, an automobile that emits no pollutants or has zero impact on the environment. While the program initially implemented a fixed percentage system, pressure from the automakers has led the state to adopt a credit based system that allows manufacturers a little more flexibility in their ability to meet the ZEV requirements8.
Currently, there are 9 additional states that have adopted California’s ZEV standards (Connecticut, Maine, Maryland,
Massachusetts, New Jersey, New York, Oregon, Rhode Island, and Vermont) and three that have adopted the less stringent Low Emission Vehicle (LEV) program (Washington, Delaware, and Pennsylvania)9.
As the standards required by these programs ramp up, automakers are increasingly turning to technology that improves the fuel efficiency and reduces the emissions output of their vehicles. This is very positive for BorgWarner given their product portfolio.
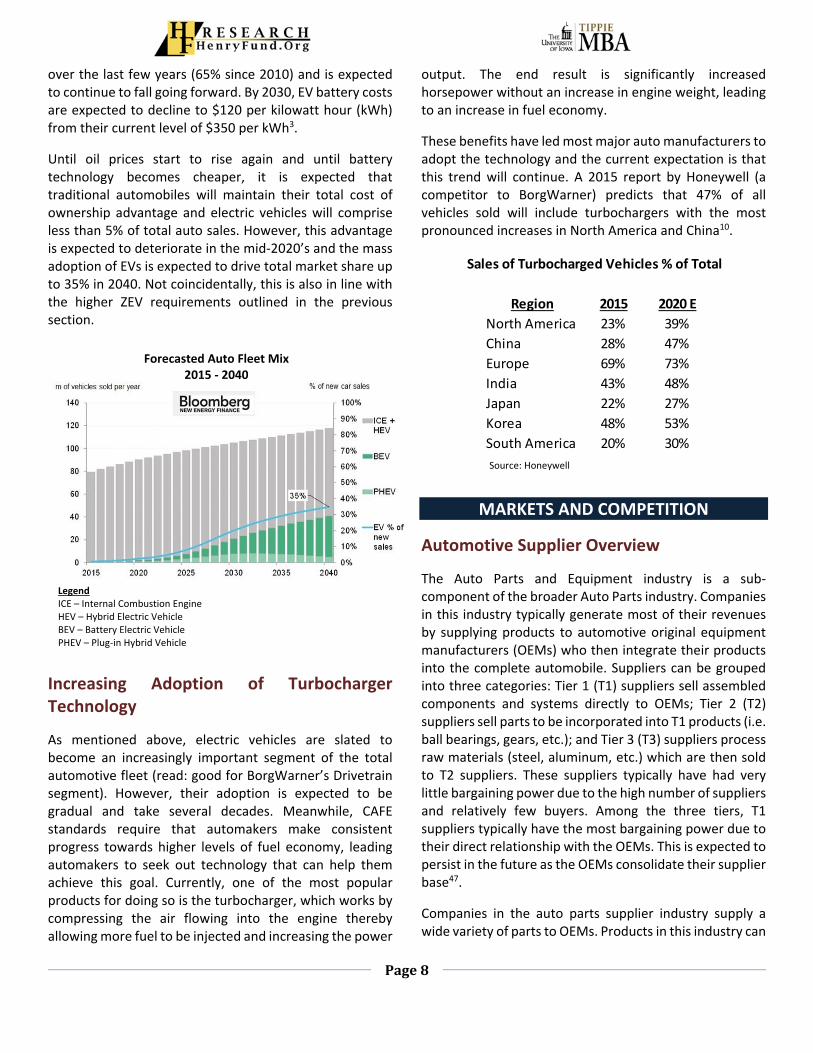
Rise of Hybrid/Electric Cars
Over the last several years, the popularity of electric vehicles (EVs) has increased as consumer preferences have begun to shift towards more fuel efficient vehicles. As options for EVs become more readily available, an increasing number of consumers have shown a willingness to adopt the technology. Evidence for this trend can be seen in the 2015 sales numbers, where an estimated 462,000 EVs were sold, an increase of 60% over 20143. However, this does not mean that the world is ready to turn its back on conventional internal combustion engines (ICE) just yet. Two of the largest current headwinds include the low price of oil/gas and the total cost of ownership. While oil and gas prices are not expected to remain at current levels forever (the EIA expects oil prices to recover to about $50 in 2017 and gradually trend higher out to 20404), their current depressed levels have raised doubts in some consumer’s minds over the real benefits of owning an electric vehicle. Additionally, hybrid/electric vehicles typically cost several thousand dollars45 more than traditional vehicles and the payback period can range between 8 and 15 years in some cases5, largely due to the cost of the lithium‐ion batteries used in these cars. The cost for these batteries has already declined significantly
Source: California Air Resources Board
Page8
over the last few years (65% since 2010) and is expected to continue to fall going forward. By 2030, EV battery costs are expected to decline to $120 per kilowatt hour (kWh) from their current level of $350 per kWh3.
Until oil prices start to rise again and until battery technology becomes cheaper, it is expected that traditional automobiles will maintain their total cost of ownership advantage and electric vehicles will comprise less than 5% of total auto sales. However, this advantage is expected to deteriorate in the mid‐2020’s and the mass adoption of EVs is expected to drive total market share up to 35% in 2040. Not coincidentally, this is also in line with the higher ZEV requirements outlined in the previous section.
Increasing Adoption of Turbocharger Technology
As mentioned above, electric vehicles are slated to become an increasingly important segment of the total automotive fleet (read: good for BorgWarner’s Drivetrain segment). However, their adoption is expected to be gradual and take several decades. Meanwhile, CAFE standards require that automakers make consistent progress towards higher levels of fuel economy, leading automakers to seek out technology that can help them achieve this goal. Currently, one of the most popular products for doing so is the turbocharger, which works by compressing the air flowing into the engine thereby allowing more fuel to be injected and increasing the power
output. The end result is significantly increased horsepower without an increase in engine weight, leading to an increase in fuel economy.
These benefits have led most major auto manufacturers to adopt the technology and the current expectation is that this trend will continue. A 2015 report by Honeywell (a competitor to BorgWarner) predicts that 47% of all vehicles sold will include turbochargers with the most pronounced increases in North America and China10.
MARKETS AND COMPETITION
Automotive Supplier Overview
The Auto Parts and Equipment industry is a sub‐component of the broader Auto Parts industry. Companies in this industry typically generate most of their revenues by supplying products to automotive original equipment manufacturers (OEMs) who then integrate their products into the complete automobile. Suppliers can be grouped into three categories: Tier 1 (T1) suppliers sell assembled components and systems directly to OEMs; Tier 2 (T2) suppliers sell parts to be incorporated into T1 products (i.e. ball bearings, gears, etc.); and Tier 3 (T3) suppliers process raw materials (steel, aluminum, etc.) which are then sold to T2 suppliers. These suppliers typically have had very little bargaining power due to the high number of suppliers and relatively few buyers. Among the three tiers, T1 suppliers typically have the most bargaining power due to their direct relationship with the OEMs. This is expected to persist in the future as the OEMs consolidate their supplier base47.
Companies in the auto parts supplier industry supply a wide variety of parts to OEMs. Products in this industry can
Sales of Turbocharged Vehicles % of Total
Region 2015 2020 E
North America 23% 39%
China 28% 47%
Europe 69% 73%
India 43% 48%
Japan 22% 27%
Korea 48% 53%
South America 20% 30%
Forecasted Auto Fleet Mix 2015 ‐ 2040
Source: Honeywell
Legend ICE – Internal Combustion Engine HEV – Hybrid Electric Vehicle BEV – Battery Electric Vehicle PHEV – Plug‐in Hybrid Vehicle

Page9
be grouped into several categories including electrical & electronic components, steering & suspension, exhaust systems, brake systems, auto body parts & wheels, HVAC parts, airbags, filters, radiators, & other components.
A breakdown of industry products by type is shown in the following table27.
Demand for these products is driven by global automotive production as more parts are required during periods where OEMs are producing more vehicles. Ultimately, demand for automobiles is influenced by several macroeconomic factors including GDP growth, consumer spending, wage/disposable income growth, employment levels, and interest rates. Due to the global nature of the industry, the economic situations in North America, Europe, and the BRIC nations (Brazil, Russia, India, China) tends to be the most influential. Currently, auto production is expected to grow about 3.3% annually to just under 108 M units by 202044.
To a lesser extent, demand is also influenced by the production mix. In periods of economic stability and rising incomes, demand for more expensive trucks and luxury cars is boosted and suppliers’ margins may realize a slight expansion.
Automotive parts are manufactured from a wide variety of raw materials and, as a result, profitability can be affected by volatile commodity prices. Major industry inputs include steel, copper, aluminum, and plastic resins. While a limited amount of hedging takes place to help alleviate these costs, suppliers will usually try to pass through any material increase in raw material costs to the OEMs. However, suppliers are rarely successful in these efforts
and it is considered unlikely that increases in the cost of materials will be recouped.
Basis for Competition
Being a mature industry with a high number of companies (800+)31, competition in auto parts supply is intense. Several factors influence the competitive environment including:
Many suppliers, few buyers – While there well over 1,000 global parts suppliers, there are only around 50 significant manufacturers of automobiles39. As a result, a large portion of supplier’s revenue comes from only one or two OEMs. The implication of this imbalance is that the OEMs have a very large influence on how products are priced and typically demand annual price decreases from their suppliers. This puts a huge amount of pressure on supplier margins and leads to price‐based competition.
Company Major Customers % of 2015 Revenue
BorgWarner Volkswagen, Ford 30%
Delphi General Motors 14%
TRW* Volkswagen, Ford, Fiat 58%
*Pre‐acquisition 2014 revenues
*Source: BorgWarner, Delphi, TRW Automotive annual reports
Product
TurbochargersBorgWarner
Honeywell
Mitsubishi Heavy Industries
Cummins
Bosch
IHI
Emissions systems
Mahle
T. RAD
Pierburg
NKG
BorgWarner
Denso
Bosch
Eldor
Thermal Systems
BorgWarner
Iwis
Tsubake Group
Denso
Schaeffler Group
Chassis Systems
Advics
JTEKT
Nexteer
ZF Group/TRW
Bosch
Continental AG
Safety SystemsKey Safety
Takata
ZF Group/TRW
Autoliv
Electronics
Delphi
Denso
Magna
Bosch
Autoliv
Continental AG
Infotainment
Mitsubishi Electronics
Aisin Seiki
Delphi
Harman
Denso
Alpine
Bosch
Panasonic
Continental AG
Visteon
Competitors
Source: Automotive News – 2014 Top Suppliers Report
Automotive Suppliers Product Categories & Competitors
Page10
Multiple competitors in every product category – A number of different companies are competing in each area of the industry, requiring investment in R&D in order to stay on the cutting edge and continue to secure design wins. A few examples of major product categories and their competitors are listed in the table on the prior page28.
Success Factors
Among some of the major global suppliers, total revenue growth is expected to be in the low single‐digits (roughly in‐line with auto production) and the high degree of competition has whittled net profit margins down to about 5%40. The degree of success that companies in this industry realize depends on a few different factors including:
Degree of Globalization – Driven by the global expansion of OEMs, auto parts suppliers who can capitalize on opportunities in foreign markets will typically enjoy a larger degree of success. For example, among the top 100 global OEM parts suppliers, almost every single one generates a significant amount of revenue in North America, Europe, and Asia. An important component of this factor includes outsourcing manufacturing operations to areas where they can be utilized in the just‐in‐time manufacturing operations of the OEMs. Currently, some of the best positioned companies in this region are Continental AG, Delphi Automotive, Autoliv, BorgWarner, and Bosch.
Investments in R&D – Successful companies need to invest sufficient capital into research and development in order to stay ahead of the technology curve and continue to secure design wins and supply contracts. In 2015, top spenders on R&D included Continental AG, Autoliv, WABCO Holdings, Allison Transmission, and BorgWarner.
Effective cost controls – As the industry becomes increasingly global and as new, low‐cost, regional suppliers enter the market (particularly in China), success may come down to who can operate more efficiently. In addition, many OEMs demand annual price reductions from their suppliers, further pressuring margins and placing an emphasis on efficient operations. Based on 2015 results, some of the companies who are executing successfully in this area are BorgWarner, Delphi Automotive, Continental AG, and Hyundai Mobis.
Recent Developments in Automotive Supply
Increased Globalization & OEM Portfolio Rationalization
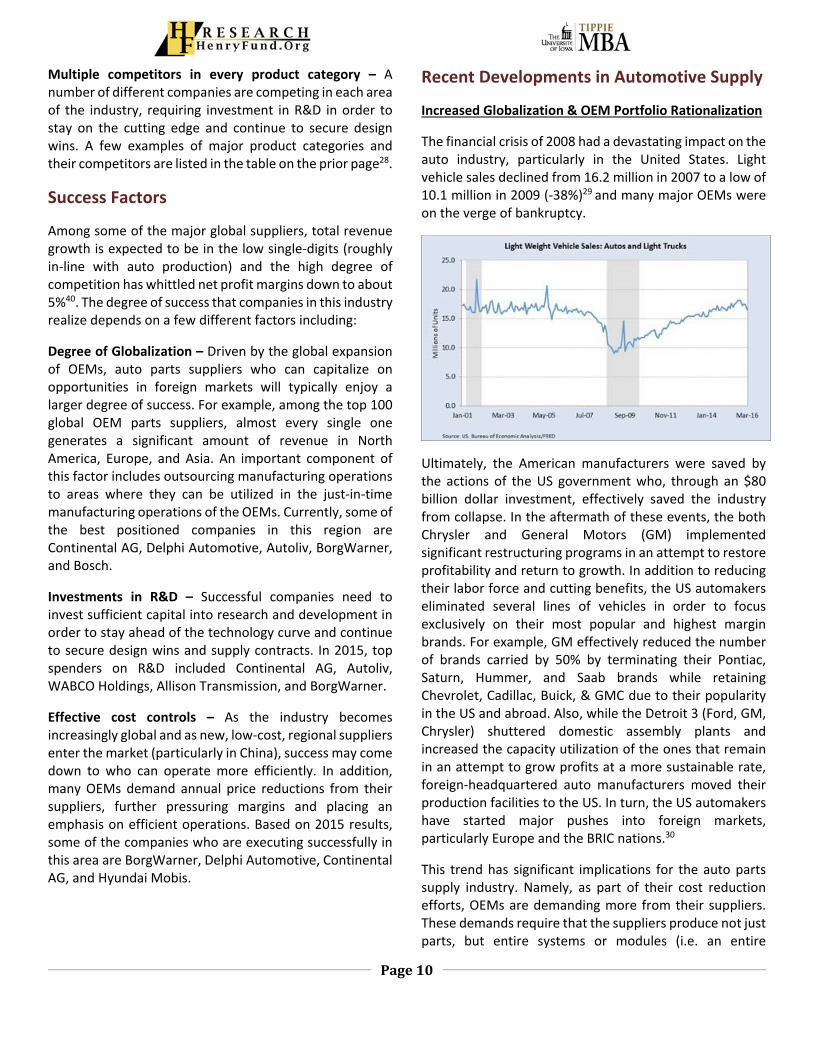
The financial crisis of 2008 had a devastating impact on the auto industry, particularly in the United States. Light vehicle sales declined from 16.2 million in 2007 to a low of 10.1 million in 2009 (‐38%)29 and many major OEMs were on the verge of bankruptcy.
Ultimately, the American manufacturers were saved by the actions of the US government who, through an $80 billion dollar investment, effectively saved the industry from collapse. In the aftermath of these events, the both Chrysler and General Motors (GM) implemented significant restructuring programs in an attempt to restore profitability and return to growth. In addition to reducing their labor force and cutting benefits, the US automakers eliminated several lines of vehicles in order to focus exclusively on their most popular and highest margin brands. For example, GM effectively reduced the number of brands carried by 50% by terminating their Pontiac, Saturn, Hummer, and Saab brands while retaining Chevrolet, Cadillac, Buick, & GMC due to their popularity in the US and abroad. Also, while the Detroit 3 (Ford, GM, Chrysler) shuttered domestic assembly plants and increased the capacity utilization of the ones that remain in an attempt to grow profits at a more sustainable rate, foreign‐headquartered auto manufacturers moved their production facilities to the US. In turn, the US automakers have started major pushes into foreign markets, particularly Europe and the BRIC nations.30
This trend has significant implications for the auto parts supply industry. Namely, as part of their cost reduction efforts, OEMs are demanding more from their suppliers. These demands require that the suppliers produce not just parts, but entire systems or modules (i.e. an entire

Page11
interior). The pressure to meet these expectations is even greater as foreign suppliers enter the market.
Industry Consolidation
In order keep pace with the global growth strategies of their biggest customers, auto parts suppliers are also expanding their operations overseas, primarily through the acquisition of smaller, regional companies. In addition, as the major OEMs continue to consolidate their supplier base, T1 suppliers are buying up smaller competitors to increase their product offerings and hopefully regain some bargaining power.
Source: PwC Automotive
In 2015, auto parts suppliers closed over 200 deals for a total of about $48 billion31, marking six consecutive years of increased M&A activity. However, it is worth noting that $29 billion of that value is the result of Johnson Controls spin‐off of their auto interiors business34. Excluding that transaction, the total would be a more on‐trend $19 billion. Popular targets for acquisition include producers of powertrain components (particularly ones that help improve fuel economy), technology for connected vehicles/autonomous driving, and infotainment products. There were a number of acquisitions in 2015 that are consistent with these trends. Examples include:
On November 10, 2015 BorgWarner closed the $1.2 billion acquisition of Remy International in a bid to enter into the hybrid/electric motor market and further establish themselves as a leader in fuel economy18.
In May 2015, German auto supplier ZF Friedrichshafen (ZF Group) acquired TRW Automotive, a leader in active and passive safety systems32. In July, the new combined company demonstrated their Highway
Driving Assist system which is designed to assist drivers through automatic steering, braking, acceleration, and lane maintenance while on the highway33.
In 2015, it was announced that Johnson Controls would spin‐off their auto interior business and merge with a Chinese supplier. Named Adient, the new company is expected to have about 15% market share in the auto interior market34.
Also in 2015, Harman International Industries, Inc. paid about $950 million to acquire two automotive infotainment systems companies (Symphony Teleca and Red Band Software, Inc.). The pair of acquisitions are expected to accelerate growth in Harman’s infotainment and navigation product line up35.
Peer Comparisons
The table on the next page shows a few operating metrics for some of the larger automotive parts suppliers.
Going forward, the companies that are likely to outperform are those that position themselves to take advantage of the long‐term trends currently playing out in the auto industry (fuel efficiency, hybrid/electric vehicles, interconnected vehicles, autonomous vehicles, active safety) as well as companies who are executing on the success factors mentioned in the previous section (global presence, investment in R&D, cost controls). In addition, companies with the financial strength to make acquisitions are likely will likely realize the highest growth rates and be less risky in times of global economic uncertainty. Based on these factors some of the best positioned companies are:
Honeywell International Inc. – Supplies parts and equipment (aircraft engines, power systems, electronics, etc.) to the aerospace industry; manufacturers turbochargers for autos; provides products and services (heating/cooling, ventilation, lighting, etc.) for homes, commercial buildings, and industrial facilities; provides process technology for the production of petroleum products; and produces high performance chemicals and materials. While they do operate in the auto space, the majority of their revenue comes from their other business lines, possibly explaining their above average performance.

Page12
Cummins Inc. – Manufacturers and services diesel engines, turbochargers, filtration systems, and various other control systems for the commercial truck industry. Unlike most of the other companies on this list, Cummins focuses almost exclusively on the commercial vehicle market, which operates on a different cycle and may be influencing their 2015 results.
WABCO Holdings Inc. – Produces braking systems, transmissions, suspensions, and electronics systems for commercial trucks and buses. Like Cummins, WABCO focuses their efforts on the commercial vehicle market.
Allison Transmission Holdings Inc. – Manufacturers a variety of different transmission products for the commercial vehicle and defense industries. One possible reason that the company had a 2015 gross margin well above the entire peer group could be that they only have 2,700 total employees vs. an average of 16,500 for other companies with $2 billion ‐ $6 billion in revenue last year. (For reference, these companies report their direct labor expenses as a part of their cost of sales).
ZF Friedrichshafen – Doesn’t have the strongest margins and leverage is a little high but their recent acquisition of TRW Automotive leaves them well positioned within autonomous driving/active safety.
Company Market Cap 2015 Revenues Gross Margin Net Margin Debt/Equity P/E
Honeywell International Inc 83,202 38,581 30.7% 12.4% 1.66 17.5
NSK Ltd. (Japan) 56,032 8,125 23.1% 6.4% 1.47 108.5
Johnson Controls Inc 24,613 37,179 17.3% 4.2% 1.86 15.7
Mitsubishi Electric Corp. 23,188 36,032 29.9% 5.4% 1.20 11.9
Continental AG (Germany, Fed. Rep.) 20,733 41,942 25.1% 6.9% 1.83 7.2
Delphi Automotive Plc 19,852 15,165 19.9% 9.6% 4.32 13.7
Cummins, Inc. 17,823 19,110 25.9% 7.3% 1.04 12.7
Magna International Inc. 16,852 36,641 13.7% 5.1% 1.09 9.0
Denso Corp. (Japan) 15,861 35,921 17.6% 6.0% 0.59 7.4
JTEKT Corp 13,944 11,302 15.0% 3.1% 1.38 39.3
Aisin Seiki Co., Ltd. 11,398 24,704 14.0% 2.6% 1.52 17.7
Autoliv Inc. 9,912 9,170 20.1% 5.0% 1.18 21.7
Goodyear Tire & Rubber Co. 8,748 16,443 26.0% 1.9% 3.19 28.5
Lear Corp. 8,117 18,211 10.0% 4.1% 2.21 10.9
BorgWarner Inc 7,652 8,023 21.2% 7.6% 1.49 12.6
WABCO Holdings Inc 5,609 2,628 29.9% 10.5% 2.29 20.4
Allison Transmission Holdings Inc 4,344 1,986 47.0% 9.2% 2.71 23.8
Visteon Corp. 2,833 3,245 13.3% 70.4% 3.43 1.2
Tenneco Inc 2,738 8,209 16.6% 3.0% 8.16 11.1
Faurecia S.A. (France) 2,431 22,887 8.3% 0.9% 4.30 12.1
Dana Holding Corp 1,951 6,060 14.0% 2.6% 4.94 12.3
NTN Corp. (Japan) 1,786 5,850 18.8% 3.3% 2.49 9.2
Calsonic Kansei Corp 1,340 8,048 8.2% 2.1% 1.31 8.0
American Axle & Manufacturing Holdings Inc 1,174 3,903 16.3% 6.0% 9.62 5.0
Metaldyne Performance Group Inc 984 3,047 16.9% 4.1% 3.99 7.9
Meritor Inc 736 3,505 13.2% 1.8% ‐4.27 11.5
Takata Corp 734 5,358 16.3% ‐4.6% 2.23 N/A
TS Tech Co., Ltd. Private 3,620 16.1% 5.1% 0.60 N/A
Mando Corp Private 5,357 14.4% 3.2% 2.07 N/A
Mahle GmbH (Germany) Private 12,460 21.6% 2.7% 2.42 N/A
ZF Friedrichshafen AG (Germany) Private 22,384 16.8% 3.5% 2.07 N/A
Hyundai Mobis Co Ltd (South Korea) Private 33,073 14.3% 9.5% 0.69 N/A
Bosch (Robert) GmbH (Germany Fed. Rep.) Private 59,500 34.7% 4.9% 1.19 N/A
Averages 19.6% 4.9% 2.31 13.9
Source: Mergent Online Note: Average net margin excludes results from Visteon (large gain from discontinued operations) and average P/E excludes NSK.
Page13
BorgWarner Inc. – Strong position in turbocharger technology and hybrid/electric vehicles, above average margins, and reasonable leverage.
Continental AG – Has a presence in hybrid/electric vehicles, autonomous driving, active safety, and connectivity, strong margins, and reasonable leverage.
Autoliv – Presence in active safety, strong margins, and reasonable leverage.
Mitsubishi Electric Corp. – Various fuel efficiency products, strong margins, and low leverage.
Robert Bosch GmbH – Bosch is the world’s largest automotive parts supplier. Their core products include electrical components, starters, and steering systems.
ECONOMIC OUTLOOK
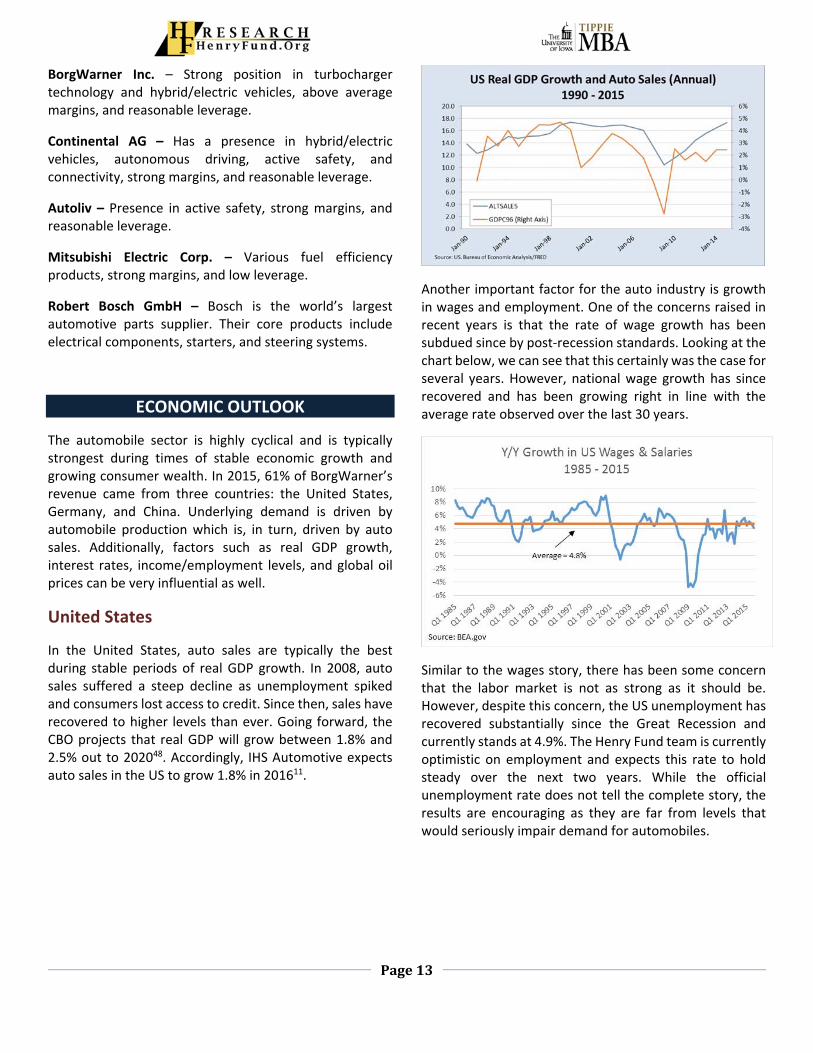
The automobile sector is highly cyclical and is typically strongest during times of stable economic growth and growing consumer wealth. In 2015, 61% of BorgWarner’s revenue came from three countries: the United States, Germany, and China. Underlying demand is driven by automobile production which is, in turn, driven by auto sales. Additionally, factors such as real GDP growth, interest rates, income/employment levels, and global oil prices can be very influential as well.
United States
In the United States, auto sales are typically the best during stable periods of real GDP growth. In 2008, auto sales suffered a steep decline as unemployment spiked and consumers lost access to credit. Since then, sales have recovered to higher levels than ever. Going forward, the CBO projects that real GDP will grow between 1.8% and 2.5% out to 202048. Accordingly, IHS Automotive expects auto sales in the US to grow 1.8% in 201611.
Another important factor for the auto industry is growth in wages and employment. One of the concerns raised in recent years is that the rate of wage growth has been subdued since by post‐recession standards. Looking at the chart below, we can see that this certainly was the case for several years. However, national wage growth has since recovered and has been growing right in line with the average rate observed over the last 30 years.
Similar to the wages story, there has been some concern that the labor market is not as strong as it should be. However, despite this concern, the US unemployment has recovered substantially since the Great Recession and currently stands at 4.9%. The Henry Fund team is currently optimistic on employment and expects this rate to hold steady over the next two years. While the official unemployment rate does not tell the complete story, the results are encouraging as they are far from levels that would seriously impair demand for automobiles.
Page14
Germany
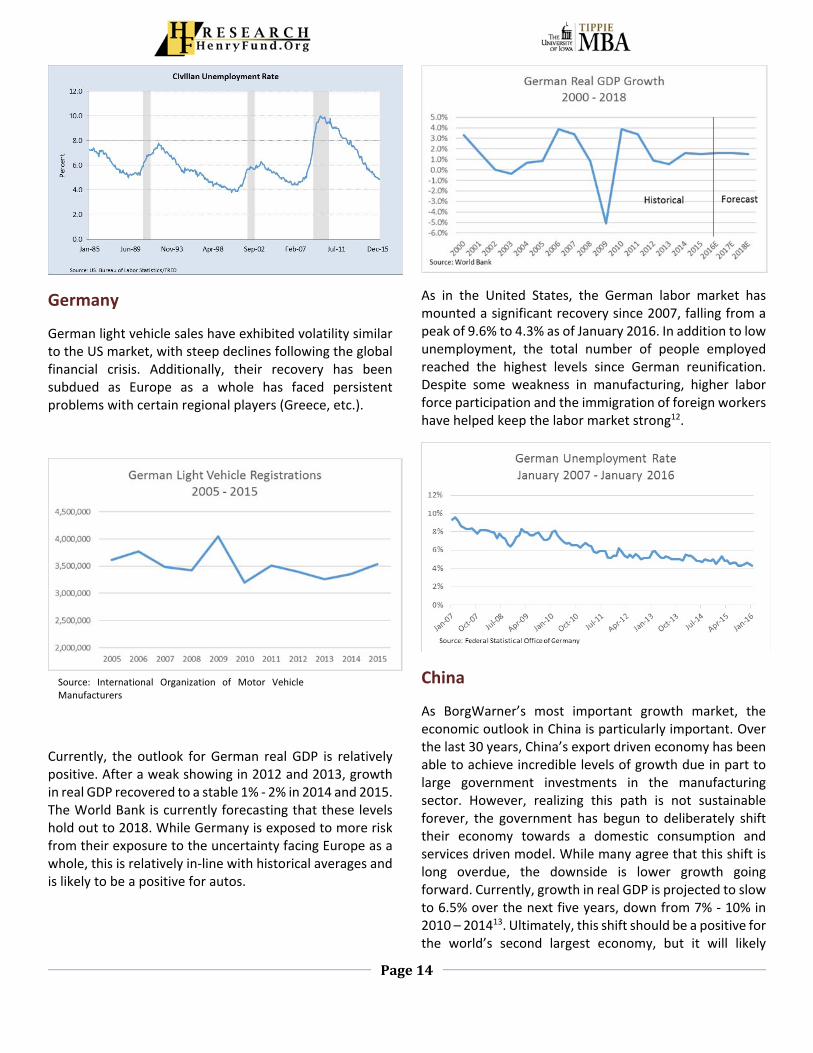
German light vehicle sales have exhibited volatility similar to the US market, with steep declines following the global financial crisis. Additionally, their recovery has been subdued as Europe as a whole has faced persistent problems with certain regional players (Greece, etc.).
Currently, the outlook for German real GDP is relatively positive. After a weak showing in 2012 and 2013, growth in real GDP recovered to a stable 1% ‐ 2% in 2014 and 2015. The World Bank is currently forecasting that these levels hold out to 2018. While Germany is exposed to more risk from their exposure to the uncertainty facing Europe as a whole, this is relatively in‐line with historical averages and is likely to be a positive for autos.
As in the United States, the German labor market has mounted a significant recovery since 2007, falling from a peak of 9.6% to 4.3% as of January 2016. In addition to low unemployment, the total number of people employed reached the highest levels since German reunification. Despite some weakness in manufacturing, higher labor force participation and the immigration of foreign workers have helped keep the labor market strong12.
China
As BorgWarner’s most important growth market, the economic outlook in China is particularly important. Over the last 30 years, China’s export driven economy has been able to achieve incredible levels of growth due in part to large government investments in the manufacturing sector. However, realizing this path is not sustainable forever, the government has begun to deliberately shift their economy towards a domestic consumption and services driven model. While many agree that this shift is long overdue, the downside is lower growth going forward. Currently, growth in real GDP is projected to slow to 6.5% over the next five years, down from 7% ‐ 10% in 2010 – 201413. Ultimately, this shift should be a positive for the world’s second largest economy, but it will likely
Source: International Organization of Motor Vehicle Manufacturers

Page15
continue to cause some turbulence in financial markets as market participants adjust to this new reality.
Chinese light vehicle registrations grew 7% in 2014 and 4.7% in 201539. While 2016 expectations were initially cut to 4.5% ‐ 5%, recent data has indicated that the auto market in China is not as weak as the downward revisions in GDP would suggest. Last month, the 2016 forecast was raised to 6%51, in‐line with recent growth.
Global Oil Prices
Beginning in June 2014, an abundance of supply and subdued demand has sent the price of WTI oil tumbling from over $100/barrel to less than $30, a level many never expected to see again. Currently, many industry experts are beginning to adopt the stance that prices will remained low for the foreseeable future and the Henry Fund team agrees. The majority of our analysts expect oil to remain in the $40 ‐ $50 range over the next two years. Additionally, the average price of gasoline in the U.S. has fallen 20% in the last year alone14. This action effectively increases the
disposable income of consumers and is typically good for auto sales. Assuming a sustained drop in prices does not spark a recession, these lower gas prices and the greater levels of purchasing power among consumers should be a positive for the auto industry.
CATALYSTS FOR GROWTH
At the end of the day, demand for BorgWarner’s products is driven by global automobile production and sales. A few factors that may influence production in the future include:
GDP growth in North America, Europe, and BRIC nations
Oil and gas prices
Specific trends relevant to BorgWarner include:
Increased adoption of turbocharger technology driven by tighter regulations on automakers
Production mix of traditional internal combustion engines and hybrid/electric vehicles
INVESTMENT POSITIVES
Strong position in turbocharger production. This should benefit BorgWarner as increasingly strict fuel economy standards begin to take effect.
Acquisition of Remy International gives BorgWarner a foothold in the production of hybrid/electric vehicles, one of the biggest trends currently facing the auto industry.
Source: International Organization of Motor Vehicle Manufacturers
Page16
Joint ventures in China give BorgWarner access to an important growth market.
Low oil prices typically increase the demand for automobiles.
INVESTMENT NEGATIVES
Slower growth expectations in China may continue to weigh on shares.
Hybrid/EV market is still in its infancy and is expected to make up less than 5% of total auto production until 2020. This forecast may be pushed out by a few years if oil and gas prices remain low longer than expected.
VALUATION
The target price range for BorgWarner of $70 ‐ $76 is based on a discounted cash flow valuation model. Furthermore, based on our 2016 earnings forecast and a set of comparable companies, we see a price floor in the neighborhood of $43.
Revenue
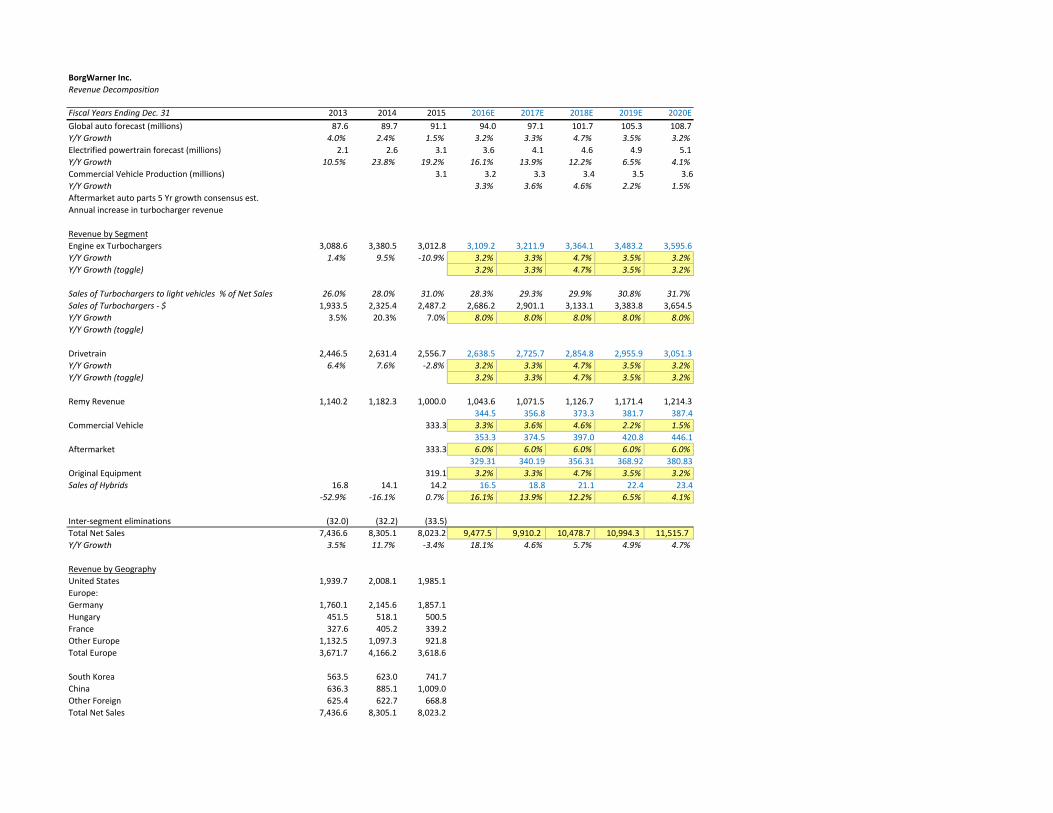
The most important fundamental factor in DCF model is the revenue forecast. At BorgWarner, revenue was divided into three segments: engine, drivetrain, and Remy.
Engine Segment
Revenue in the engine segment is forecasted to grow between 5.4% in 2016. Growth should improve to 6.2% in 2018 as auto production picks up slightly before moderating back down to 5.6% in 2020. This forecast is driven by two factors: global light vehicle production and growth in turbocharger revenue.
Global Light Vehicle Production ‐ Estimates from IHS Automotive and PricewaterhouseCoopers indicate that global light vehicle production is expected to increase between 3.2% and 4.7% over the 2016 – 2020 period.
Turbochargers ‐ Data from competitor Honeywell indicates that the total market for turbochargers should grow about 8% annually out to 202010.
Drivetrain Segment
The drivetrain segment is currently forecast to grow at a 3.6% CAGR out to 2020, in‐line with global auto production. This is due to a lack of any specific product (i.e. turbochargers) that may drive outperformance.
Remy International
Revenues from the Remy acquisition are anticipated to grow at a 4% CAGR out to 2020. While this segment will be incorporated into the drivetrain segment in the future, we view it as prudent to forecast revenues separately for the time being. For the model, this segment was divided into four sub‐segments: commercial vehicle, aftermarket, original equipment, and hybrid/electric engines.
Commercial Vehicle – Revenues are forecasted to grow in‐line with the IHS Automotive forecast for global medium/heavy trucks. Currently, the forecast calls for 3.3% growth in 2016 which moderates to 1.5% in 2020.
Aftermarket – Currently forecasted to grow 6% in each year out to 2020. This is based on comments from some of the larger retailers of aftermarket parts.
Original Equipment – Forecast to grow in‐line with global light vehicle production.
Hybrid/Electric Engines – This is the smallest but fastest growing segment of Remy. While hybrid/EV engines only generated $14.2 million in revenue in 2015, a KPMG survey of auto industry executives indicated that this will be the fastest growing segment of the auto market going forward. Consistent with this expectation, we have modeled hybrid/EV revenue growing 16.1% in 2016, which moderates down to 4.1% by 2020.
Key Expenses and Margins
There are three key expenses that have a significant
impact on the valuation of BorgWarner: Cost of Goods Sold
(COGS), Selling, General, & Administrative expenses
(S,G,&A), and Research and Development (R&D).
Cost of Goods Sold – BorgWarner has been able to
improve their cost of goods sold marginally over the last
5 years. We anticipate modest improvement to 74.5% of
revenue in 2016, which holds steady out to 2020. As a
result, gross margin is expected to maintain historical
levels of just over 21%
Page17
Selling, General & Administrative Expenses – With no
clear trend over the last five years, SG&A expenses are
forecasted as a constant 4.7% of revenue. This is
consistent with recent performance.
Research & Development – R&D is an important
component of BorgWarner’s cost structure as these
investments are made in programs that fuel both short
and long‐term growth. Historically, R&D has held steady
between 3% and 4% of total revenue. For the purposes of
the model, R&D is expected to remain constant at 4% of
revenue. This estimate is based on the company’s long‐
term R&D target as laid out in their 2015 10‐k.
Operating Margin – After accounting for these key
expenses, operating margin is forecast to hold steady
between 11.4% and 11.7% out to 2020. This is consistent
with recent years but below the 12% target issued by
management.
Discounted Cash Flow Valuation
As previously mentioned, the DCF target price for
BorgWarner indicates a value of about $76 per share. In
order to arrive at that target price, we must first come up
with forward looking estimates for NOPLAT, invested
capital (IC), and the weighted‐average cost of capital
(WACC).
Net Operating Profit Less Adjusted Taxes (NOPLAT) –
NOPLAT is calculated by estimating earnings before
interest, taxes, and amortized goodwill (EBITA),
subtracting the provision for income taxes (once it has
been adjusted for non‐operating expenses), and adding
back any change in deferred tax liabilities. As can be seen
in the attached Value Driver worksheet, the revenue and
expense assumptions mentioned above have the largest
influence on EBITA. However, a few other relatively minor
expenses such as stock based compensation, the implied
interest on operating leases, and “other” expenses must
also be accounted for. Next, we need to adjust the
provision for income taxes for the tax effects of any non‐
operating expenses like interest expense/income and
impact of affiliate investments. Finally, by assuming
deferred tax assets and liabilities will continue to grow in‐
line with their average rate over the last five years, we
arrive at an estimate for NOPLAT.
Invested Capital – The next step in the DCF valuation
process is to estimate invested capital. There are three
primary inputs in this calculation: net operating working
capital (NWC), net property, plant, & equipment (net
P,P,&E), and other long‐term operating assets and
liabilities.
Net Operating Working Capital (NWC) – BorgWarner’s key
working capital accounts include the following: normal
cash, accounts receivable, inventories, prepaid expenses,
trade payables, accrued expenses, and income tax
payable. In 2015, many of these accounts increased
significantly compared to prior years. However, an
examination of BorgWarner’s 2015 10‐k reveals that these
increases are almost entirely the result of the Remy
International acquisition, which closed late in the year and
didn’t give BorgWarner enough time to unwind some of
these accounts. Going forward, the model assumes that all
of these accounts will be scaled back to levels more in‐line
with their historical averages by 2018/2019.
Net Property, Plant, & Equipment (net P,P,&E) – As
BorgWarner continues to grow and expand their
manufacturing capabilities, continued investments in
P,P,&E are going to be necessary. In the model, the
forecasts for capital expenditures and depreciation are the
key drivers. Capital expenditures are forecasted as a
constant 6% of sales ($500 ‐ $700 million), in‐line with
historical levels. Annual depreciation is expected to be a
constant 15% of prior year net P,P,&E which is also in‐line
with historical levels.
Other Long‐Term Operating Assets/Liabilities – Line items
in these categories include intangible assets, capitalized
operating leases, deferred revenue, and “other”
assets/liabilities. All of these items (excluding intangibles)
are expected to remain at a constant percentage of sales
out to 2020. Intangible assets are expected to gradually
amortize over time according to the schedule laid out in
BorgWarner’s 2015 10‐k.
Other Inputs
Weighted Average Cost of Capital – The final input to the
DCF model is the discount rate or the weighted average
cost of capital. Our model estimates this variable at 9.16%.
The key estimates in my cost of capital are the risk‐free
rate, the equity risk premium, beta, pre‐tax cost of debt,

Page18
and marginal tax rate. The assumptions for these variables
are laid out as follows:
Risk‐Free Rate – approximates as 2.61% which is based on
the 30‐Yr Treasury bond YTM as of 3/31/2016.
Equity Risk Premium – estimate of 5% is the consensus
ERP from the Henry Fund.
Beta – average of the 1, 2, 3, 4, & 5‐year monthly beta
calculations via Bloomberg.
Pre‐Tax Cost of Debt – YTM of a BBB+ rated bond recently
issued by BorgWarner that matures in 2045.
Marginal Tax Rate – 26% in the forecast period. Calculated
from data in BorgWarner’s 2015 10‐k.
Results of Model and Sensitivity Testing
After all forecasts have been made, free cash flow is expected to grow at an 8.3% CAGR from 2016 – 2020. Additionally, ROIC is expected come in around 27% ‐ 29%, down from the low 30% range observed over the last few years. Given the WACC of 9.16% and a 3% continuing value NOPLAT assumption, we arrive at our target price of $76.88.
After running sensitivity analyses on several of the key input variables, a target price range of $70 ‐ $76 seems reasonable. However, the model is quite sensitive to several variables. Predictably, the estimate of intrinsic value is very sensitive to our continuing value ROIC and NOPLAT assumptions of 29.4% and 3%, respectively. However, we view our assumptions as reasonable given the historical performance of the firm and the long term outlook for the global auto industry. The model is also extremely sensitive to beta and the equity risk premium. While the beta of BorgWarner is certainly not set in stone, we view our 1.6 as appropriate. Even if the beta were to increase to 1.8 (as it has over certain time periods) our intrinsic value still comes in at just under $70. Additionally, we view our estimate of 5% for the equity risk premium as conservative given the premiums observed in the market over the last 10 years. Even if the ERP were to rise to near 7%, as it did in 2008, BorgWarner still appears undervalued. Finally, while there are many different drivers of revenue, our target price appears to be most sensitive to the assumption we have made regarding turbocharger growth. That said, even if turbocharger
revenue grew 0% in each year of our forecast period, our target price is still just under $70.
Model vs. Consensus Estimates
Currently, consensus estimates are predicting 2016
revenue and earnings to come in at $9.2 billion and $3.26,
respectively. Our model in slightly more optimistic at $9.4
billion and $3.32. While this is slightly higher than
consensus, we are right at the high end of management’s
guidance range.
Despite similar operating expectations, our target price
range is substantially above the consensus target price of
$41. The biggest reason we have identified for the
divergence is our preference for the DCF method of
valuation compared to the price‐to‐earnings multiples
used by nearly all of the sell side analysts. While the Henry
Fund believes that DCF is a superior method for estimating
the long‐term value a company can generate, we
recognize that it may take time for the market to recognize
that value.
Relative Valuation
While our recommendation of Buy is based primarily on a
DCF valuation, it is important to consider other metrics in
order to help build an understanding of how other market
participants are valuing a stock. In BorgWarner’s case, with
the amount of fear and uncertainty currently present in
global financial markets, it is prudent to examine how the
company’s stock is priced relative to a group of
competitors. The peer group chosen consists of 9 other
tier 1 global auto parts suppliers with a similar geographic
distribution to BorgWarner. Based on 2016 and 2017
earnings estimates1, the industry average forward P/E
ratio for 2016 is 12.1x and 10.8x for 2017. BorgWarner is
currently trading at 11.6x and 10.9x the modeled 2016 and
2017 EPS estimates. While this is modestly below the
industry average, it is reasonable in the context of
BorgWarner’s 5‐Yr EPS CAGR, as predicted by the model,
which is slightly below most of the other companies that
have higher valuations, such as Plastic Omnium and Hella
Hueck & Co. Additionally, they are valued at a premium to
most of the companies with lower growth rates, like
Schaeffler AG and Dana Holding Corp.

Page19
Looking at a long‐term chart of BorgWarner’s NTM P/E
multiple, we can see that their shares are trading at some
of the lowest levels in the last decade. If we exclude the
spike in NTM P/E caused by the extreme negative earnings
revisions coming out of the Great Recession, the average
NTM P/E for BorgWarner is about 14.7x. If shares were
able to regain ground to 14x – 15x 2016 EPS it would imply
a share price of about $43, an approximate 20% premium
from current levels.
Source: FactSet
KEYS TO MONITOR
Going forward, BorgWarner is positioned well to take advantage of several of the intermediate and long‐term trends taking place in the auto industry. Assuming these trends play out as expected, the company has a very good chance to realize above average top and bottom line growth. However, as we continue to hold their stock, there are several sources of data that will be important to monitor to determine if our thesis is still on track.
Auto production and sales ‐ The International Organization of Motor Vehicle Manufacturers (OICA) reports quarterly production numbers and auto sales are reported monthly by the industry blog, Automotive News.
BWA earnings and guidance ‐ Next report is scheduled for late April/early May.
Growth news out of China ‐ Monitor news and estimates from the International Monetary Fund and the World Bank, both of which provide estimates for growth.
REFERENCES
1. FactSet 2. Bloomberg Terminal 3. Bloomberg New Energy Finance: Electric Vehicle
Report http://about.bnef.com/press‐releases/electric‐vehicles‐to‐be‐35‐of‐global‐new‐car‐sales‐by‐2040/
4. U.S. Energy Information Administration: Annual Energy Outlook 2015 http://www.eia.gov/forecasts/aeo/
5. FuelEconomy.gov: Hybrid Comparison http://www.fueleconomy.gov/feg/hybridCompare.jsp
6. Bureau of Transportation Statistics: Avg. Fuel Economy of Light Vehicles http://www.rita.dot.gov/bts/sites/rita.dot.gov.bts/files/publications/national_transportation_statistics/html/table_04_23.html
7. Edmunds.com: New Corporate Average Fuel Economy Standards http://www.edmunds.com/fuel‐economy/faq‐new‐corporate‐average‐fuel‐economy‐standards.html
8. California Air Resources Board: ZEV Regulations http://www.arb.ca.gov/msprog/zevprog/zevregs/zevregs.htm
9. EV News: 10 EV Friendly States and Counting http://evnews.net/ten‐us‐ev‐friendly‐zev‐states‐counting/
10. Honeywell: Turbocharger Adoption Report https://turbo.honeywell.com/whats‐new‐in‐turbo/press‐release/honeywells‐2015‐turbocharger‐forecast‐signals‐increased‐expectations‐of‐turbo‐technology‐as‐global‐penetration‐nears‐50‐percent‐by‐2020/
11. IHS Automotive: US Light Vehicle Report for February http://blog.ihs.com/same‐day‐analysis%3A‐us‐light‐vehicle‐sales‐grow‐69‐february%2C‐best‐monthly‐saar‐in‐15‐yearsDeStatis
12. German Labor Market Statistics https://www.destatis.de/EN/FactsFigures/Indicators/ShortTermIndicators/LabourMarket/arb410.html
13. China GDP Forecast http://data.worldbank.org/country/china
14. AAA: National Average Fuel Prices http://fuelgaugereport.aaa.com/
15. BBC News: Volkswagen Scandal Explained http://www.bbc.com/news/business‐34324772
16. Automotive News Europe: European January Auto Sales

Page20
http://europe.autonews.com/article/20160216/ANE/160219917/european‐car‐sales‐rise‐6‐in‐january‐but‐vw‐share‐hit‐by‐diesel
17. Barron’s.com: BorgWarner VW Impact http://blogs.barrons.com/stockstowatchtoday/2015/09/21/why‐volkswagen‐turmoil‐is‐no‐big‐deal‐for‐borgwarner‐harman/
18. BorgWarner/Remy Intl. Acquisition Completion Notice http://www.borgwarner.com/en/News/PressReleases/BWNews/11%2010%2015%20BorgWarner%20Completes%20Acquisition%20of%20Remy%20International.pdf
19. WSJ.com: BorgWarner to Acquire Remy Intl. http://www.wsj.com/articles/borgwarner‐to‐buy‐remy‐international‐1436790596
20. Remy International 10‐k http://ir.remyinc.com/phoenix.zhtml?c=132337&p=irol‐irhome
21. BorgWarner Q4 2015 Earnings Call http://seekingalpha.com/article/3890306‐borgwarners‐bwa‐ceo‐james‐verrier‐q4‐2015‐results‐earnings‐call‐transcript?part=single
22. BorgWarner Q1 2015 Earnings Press Release http://www.borgwarner.com/en/News/PressReleases/BWNews/8%20K%203.31.2015%20Exhibit%2099.1%20Press%20Release.pdf
23. BorgWarner Q2 2015 Earnings Press Release http://www.borgwarner.com/en/News/PressReleases/BWNews/8%20K%206.30.2015%20Exhibit%2099.1%20Press%20Release_w%20Logo.pdf
24. BorgWarner Q3 2015 Earnings Press Release http://www.borgwarner.com/en/News/PressReleases/BWNews/8%20K%209.30.2015%20Exhibit%2099.1%20Press%20Release.pdf
25. BorgWarner 2016 Guidance Update http://www.borgwarner.com/en/News/PressReleases/BWNews/2016%20Net%20New%20Business%20and%20Guidance%20Release_010916.pdf
26. BorgWarner 2015 Earnings Press Release http://www.borgwarner.com/en/News/PressReleases/BWNews/8%20K%2012.31.2015%20Exhibit%2099.1%20Press%20Release%20‐%20with%20logo.pdf
27. IBISWorld 28. Automotive News: 2014 Top Suppliers Report
http://www.magna.com/docs/default‐source/default‐document‐library/2014‐top‐suppliers‐06‐15‐2015.pdf?sfvrsn=2
29. Chicago Fed: Detroit Back from the Brink?
https://www.chicagofed.org/publications/economic‐perspectives/2012/2q‐klier‐rubenstein
30. Wards Auto: GM International Operations http://wardsauto.com/news‐analysis/gm‐international‐operations‐powering‐reorganized‐auto‐maker
31. PwC Strategy: M&A in the Global Auto Industry http://www.strategyand.pwc.com/reports/mergers‐acquisitions‐auto‐industry
32. ZF TRW Acquisition Press Release http://ir.trw.com/releasedetail.cfm?ReleaseID=913417
33. PR Newswire: ZF TRW Demonstration http://www.prnewswire.com/news‐releases/zf‐trw‐demonstrates‐semi‐automated‐highway‐driving‐assist‐system‐300107352.html
34. WSJ.com: JCI Spin‐off http://www.wsj.com/articles/SB10001424052702304198504579569741641633918
35. Bloomberg.com: Harman Acquisition http://www.bloomberg.com/news/articles/2015‐01‐22/harman‐spending‐almost‐1‐billion‐on‐two‐software‐acquisitions
36. BorgWarner 2015 10‐k http://www.borgwarner.com/en/Investors/SEC/default.aspx
37. TRW Automotive 2014 10‐k http://ir.trw.com/sec.cfm
38. Harman International Industries 2015 10‐k http://investor.harman.com/sec.cfm?DocType=Annual&Year=&SortOrder=Date+Descending&FormatFilter
39. International Organization of Motor Vehicle Manufacturers: Annual Production Statistics http://www.oica.net/category/production‐statistics/2014‐statistics/
40. Mergent Online http://mergentonline.com/basicsearch.php
41. Thomson ONE Investment Banking research portal 42. BorgWarner Q3 Conference Call Transcript
http://seekingalpha.com/article/3621976‐borgwarners‐bwa‐ceo‐james‐verrier‐q3‐2015‐results‐earnings‐call‐transcript?part=single
43. Zipcar statement on impact of ride sharing market https://sustainabledevelopment.un.org/content/documents/10664zipcar.pdf
44. PwC Global Market Update http://www.pwc.com/gx/en/automotive/autofacts/analyst‐notes/pdf/pwc‐analyst‐note‐global‐market‐update‐november‐2015.pdf

Page21
45. PwC State of the Plug in Electric Vehicle Market http://www.pwc.com/gx/en/automotive/industry‐publications‐and‐thought‐leadership/assets/pwc‐ec‐state‐of‐pev‐market‐final.pdf
46. KPMG: Global Automotive Executive Survey 2015 http://www.kpmg.com/LU/en/IssuesAndInsights/Articlespublications/Pages/Global‐Automotive‐Executive‐Survey‐2015.aspx
47. Bloomberg.com: Ford Supplier Reductions http://www.bloomberg.com/news/articles/2013‐10‐21/ford‐wants‐to‐pare‐number‐of‐suppliers‐by‐40‐executive‐says
48. Congressional budget Office: The Budget & Economic Outlook 2016 – 2026 (Jan 2016) https://www.cbo.gov/publication/51129
49. WSJ.com: German GDP Growth Forecast http://www.wsj.com/articles/german‐government‐cuts‐economic‐growth‐forecast‐for‐2016‐to‐1‐7‐1453901950
50. German GDP Estimates http://data.worldbank.org/country/germany#cp_gep
51. IHS Automotive: Chinese Auto Forecast http://blog.ihs.com/same‐day‐analysis%3A‐ihs‐automotive‐upgrades‐chinese‐growth‐forecast
IMPORTANT DISCLAIMER
Henry Fund reports are created by student enrolled in the Applied Securities Management (Henry Fund) program at the University of Iowa’s Tippie School of Management. These reports are intended to provide potential employers and other interested parties an example of the analytical skills, investment knowledge, and communication abilities of Henry Fund students. Henry Fund analysts are not registered investment advisors, brokers or officially licensed financial professionals. The investment opinion contained in this report does not represent an offer or solicitation to buy or sell any of the aforementioned securities. Unless otherwise noted, facts and figures included in this report are from publicly available sources. This report is not a complete compilation of data, and its accuracy is not guaranteed. From time to time, the University of Iowa, its faculty, staff, students, or the Henry Fund may hold a financial interest in the companies mentioned in this report.

CV NOPLAT Growth S,G,&A % of Sales
76.90$ ‐2.0% ‐1.0% 0.0% 1.0% 2.0% 3.0% 4.0% 5.0% 6.0% 7.0% 8.0% 76.90$ 2.0% 2.5% 3.0% 3.5% 4.0% 4.5% 5.0% 5.5% 6.0% 6.5%
5.00% 66.97 63.38 59.00 53.55 46.59 37.36 24.55 5.60 (25.33) (84.87) (246.72) 2.0% 78.20 78.05 77.91 77.77 77.63 77.48 77.34 77.20 77.06 76.91
10.00% 58.20 58.56 59.00 59.55 60.25 61.17 62.46 64.36 67.47 73.45 89.71 2.5% 78.05 77.91 77.77 77.63 77.48 77.34 77.20 77.06 76.91 76.77
15.00% 55.28 56.96 59.00 61.55 64.80 69.11 75.10 83.95 98.41 126.22 201.85 3.0% 77.91 77.77 77.63 77.48 77.34 77.20 77.06 76.91 76.77 76.63
20.00% 53.82 56.15 59.00 62.55 67.08 73.08 81.41 93.75 113.87 152.61 257.92 3.5% 77.77 77.63 77.48 77.34 77.20 77.06 76.91 76.77 76.63 76.49
25.00% 52.94 55.67 59.00 63.14 68.45 75.47 85.20 99.62 123.16 168.44 291.57 4.0% 77.63 77.48 77.34 77.20 77.06 76.91 76.77 76.63 76.49 76.34
30.00% 52.36 55.35 59.00 63.54 69.36 77.05 87.73 103.54 129.34 179.00 314.00 4.5% 77.48 77.34 77.20 77.06 76.91 76.77 76.63 76.49 76.34 76.20
35.00% 51.94 55.12 59.00 63.83 70.01 78.19 89.54 106.34 133.76 186.54 330.02 5.0% 77.34 77.20 77.06 76.91 76.77 76.63 76.49 76.34 76.20 76.06
5.5% 77.20 77.06 76.91 76.77 76.63 76.49 76.34 76.20 76.06 75.92
Beta 6.0% 77.06 76.91 76.77 76.63 76.49 76.34 76.20 76.06 75.92 75.77
76.90$ 1.00 1.20 1.40 1.60 1.80 2.00 2.20 2.40 2.60 6.5% 76.91 76.77 76.63 76.49 76.34 76.20 76.06 75.92 75.77 75.63
1% 807.97 654.72 549.79 473.44 415.39 369.77 332.96 302.65 277.25
2% 369.77 302.65 255.65 220.90 194.17 172.96 155.72 141.43 129.40 CapEx % of Sales
3% 237.07 194.17 163.91 141.43 124.07 110.25 99.00 89.65 81.76 76.90$ 2% 3% 4% 5% 6% 7% 8% 9% 10%
4% 172.96 141.43 119.13 102.51 89.65 79.40 71.03 64.08 58.21 1% 78.35 78.55 78.74 78.94 79.14 79.34 79.54 79.74 79.93
5% 135.17 110.25 92.58 79.40 69.18 61.02 54.37 48.83 44.14 2% 78.32 78.52 78.72 78.91 79.11 79.31 79.51 79.71 79.90
6% 110.25 89.65 75.01 64.08 55.60 48.83 43.29 38.68 34.78 3% 78.29 78.49 78.69 78.88 79.08 79.28 79.48 79.68 79.87
7% 92.58 75.01 62.52 53.18 45.93 40.13 35.39 31.44 28.10 4% 78.26 78.46 78.66 78.86 79.05 79.25 79.45 79.65 79.85
8% 79.40 64.08 53.18 45.02 38.68 33.61 29.46 26.00 23.07 5% 78.23 78.43 78.63 78.83 79.02 79.22 79.42 79.62 79.82
9% 69.18 55.60 45.93 38.68 33.05 28.54 24.85 21.77 19.16 6% 78.20 78.40 78.60 78.80 78.99 79.19 79.39 79.59 79.79
10% 61.02 48.83 40.13 33.61 28.54 24.48 21.15 18.37 16.02 7% 78.17 78.37 78.57 78.77 78.97 79.16 79.36 79.56 79.76
8% 78.14 78.34 78.54 78.74 78.94 79.13 79.33 79.53 79.73
Drivetrain Growth Relative to Global Electrified Powertrain Forecast
76.90$ ‐2 ‐1.75 ‐1.5 ‐1.25 ‐1 ‐0.75 ‐0.25 0 0.25 0.5 0.75 1 1.25 1.5 1.75 2
‐2 59.05 59.61 60.18 60.78 61.40 62.05 63.40 64.12 64.86 65.63 66.42 67.25 68.10 68.98 69.88 70.83
‐1.75 59.71 60.26 60.84 61.44 62.06 62.70 64.06 64.77 65.52 66.28 67.08 67.90 68.75 69.63 70.54 71.48
‐1.5 60.39 60.94 61.52 62.12 62.74 63.38 64.74 65.45 66.19 66.96 67.76 68.58 69.43 70.31 71.22 72.16
‐1.25 61.09 61.65 62.22 62.82 63.44 64.08 65.44 66.16 66.90 67.67 68.46 69.28 70.13 71.01 71.92 72.86
‐1 61.82 62.38 62.95 63.55 64.17 64.81 66.17 66.89 67.63 68.40 69.19 70.01 70.87 71.74 72.65 73.59
‐0.75 62.58 63.13 63.71 64.31 64.93 65.57 66.93 67.65 68.39 69.16 69.95 70.77 71.62 72.50 73.41 74.35
‐0.25 64.18 64.73 65.31 65.91 66.53 67.17 68.53 69.25 69.99 70.76 71.55 72.37 73.22 74.10 75.01 75.95
0 65.02 65.58 66.15 66.75 67.37 68.02 69.37 70.09 70.83 71.60 72.39 73.22 74.07 74.95 75.86 76.80
0.25 65.90 66.45 67.03 67.63 68.25 68.89 70.25 70.96 71.71 72.47 73.27 74.09 74.94 75.82 76.73 77.67
0.5 66.80 67.36 67.93 68.53 69.15 69.79 71.15 71.87 72.61 73.38 74.17 74.99 75.85 76.72 77.63 78.57
0.75 67.74 68.29 68.87 69.47 70.09 70.73 72.09 72.81 73.55 74.31 75.11 75.93 76.78 77.66 78.57 79.51
1 68.71 69.26 69.84 70.44 71.06 71.70 73.06 73.77 74.52 75.28 76.08 76.90 77.75 78.63 79.54 80.48
1.25 69.71 70.26 70.84 71.44 72.06 72.70 74.06 74.78 75.52 76.29 77.08 77.90 78.75 79.63 80.54 81.48
1.5 70.75 71.30 71.88 72.48 73.10 73.74 75.10 75.81 76.55 77.32 78.12 78.94 79.79 80.67 81.58 82.52
1.75 71.82 72.37 72.95 73.55 74.17 74.81 76.17 76.88 77.63 78.39 79.19 80.01 80.86 81.74 82.65 83.59
2 72.93 73.48 74.06 74.66 75.28 75.92 77.28 77.99 78.73 79.50 80.30 81.12 81.97 82.85 83.76 84.70
Annual Growth in Turbochargers
76.90$ ‐10% ‐8% ‐6% ‐4% ‐2% 0% 2% 4% 6% 8% 10%
‐6% 61.74 62.83 64.02 65.31 66.72 68.23 69.88 71.65 73.56 75.62 77.84
‐5% 61.82 62.92 64.11 65.40 66.80 68.32 69.96 71.73 73.65 75.71 77.92
‐4% 61.91 63.00 64.19 65.49 66.89 68.41 70.05 71.82 73.74 75.79 78.01
‐3% 62.00 63.10 64.29 65.58 66.98 68.50 70.14 71.91 73.83 75.89 78.10
‐2% 62.10 63.19 64.38 65.68 67.08 68.60 70.24 72.01 73.92 75.98 78.20
‐1% 62.20 63.29 64.48 65.78 67.18 68.70 70.34 72.11 74.02 76.08 78.30
0% 62.30 63.40 64.59 65.88 67.28 68.80 70.44 72.21 74.13 76.19 78.40
1% 62.41 63.50 64.69 65.99 67.39 68.91 70.55 72.32 74.23 76.29 78.51
2% 62.52 63.62 64.81 66.10 67.50 69.02 70.66 72.43 74.35 76.41 78.62
3% 62.64 63.73 64.92 66.22 67.62 69.14 70.78 72.55 74.46 76.52 78.74
4% 62.76 63.85 65.04 66.34 67.74 69.26 70.90 72.67 74.58 76.64 78.86
5% 62.89 63.98 65.17 66.46 67.86 69.38 71.02 72.80 74.71 76.77 78.98
6% 63.02 64.11 65.30 66.59 67.99 69.51 71.16 72.93 74.84 76.90 79.11
7% 63.15 64.25 65.44 66.73 68.13 69.65 71.29 73.06 74.98 77.04 79.25
8% 63.29 64.39 65.58 66.87 68.27 69.79 71.43 73.20 75.12 77.18 79.39
Equity Risk
Premium
Annual Growth
in Aftermarket
R&D % of
Sales
Share
Repurchases
% of Sales
CV ROIC
Engine Growth
Relative to
Global Auto
Forecast
BorgWarner Inc.
Revenue Decomposition
Fiscal Years Ending Dec. 31 2013 2014 2015 2016E 2017E 2018E 2019E 2020E
Global auto forecast (millions) 87.6 89.7 91.1 94.0 97.1 101.7 105.3 108.7
Y/Y Growth 4.0% 2.4% 1.5% 3.2% 3.3% 4.7% 3.5% 3.2%
Electrified powertrain forecast (millions) 2.1 2.6 3.1 3.6 4.1 4.6 4.9 5.1
Y/Y Growth 10.5% 23.8% 19.2% 16.1% 13.9% 12.2% 6.5% 4.1%
Commercial Vehicle Production (millions) 3.1 3.2 3.3 3.4 3.5 3.6
Y/Y Growth 3.3% 3.6% 4.6% 2.2% 1.5%
Aftermarket auto parts 5 Yr growth consensus est.
Annual increase in turbocharger revenue
Revenue by Segment
Engine ex Turbochargers 3,088.6 3,380.5 3,012.8 3,109.2 3,211.9 3,364.1 3,483.2 3,595.6
Y/Y Growth 1.4% 9.5% ‐10.9% 3.2% 3.3% 4.7% 3.5% 3.2%
Y/Y Growth (toggle) 3.2% 3.3% 4.7% 3.5% 3.2%
Sales of Turbochargers to light vehicles % of Net Sales 26.0% 28.0% 31.0% 28.3% 29.3% 29.9% 30.8% 31.7%
Sales of Turbochargers ‐ $ 1,933.5 2,325.4 2,487.2 2,686.2 2,901.1 3,133.1 3,383.8 3,654.5
Y/Y Growth 3.5% 20.3% 7.0% 8.0% 8.0% 8.0% 8.0% 8.0%
Y/Y Growth (toggle)
Drivetrain 2,446.5 2,631.4 2,556.7 2,638.5 2,725.7 2,854.8 2,955.9 3,051.3
Y/Y Growth 6.4% 7.6% ‐2.8% 3.2% 3.3% 4.7% 3.5% 3.2%
Y/Y Growth (toggle) 3.2% 3.3% 4.7% 3.5% 3.2%
Remy Revenue 1,140.2 1,182.3 1,000.0 1,043.6 1,071.5 1,126.7 1,171.4 1,214.3
344.5 356.8 373.3 381.7 387.4
Commercial Vehicle 333.3 3.3% 3.6% 4.6% 2.2% 1.5%
353.3 374.5 397.0 420.8 446.1
Aftermarket 333.3 6.0% 6.0% 6.0% 6.0% 6.0%
329.31 340.19 356.31 368.92 380.83
Original Equipment 319.1 3.2% 3.3% 4.7% 3.5% 3.2%
Sales of Hybrids 16.8 14.1 14.2 16.5 18.8 21.1 22.4 23.4
‐52.9% ‐16.1% 0.7% 16.1% 13.9% 12.2% 6.5% 4.1%
Inter‐segment eliminations (32.0) (32.2) (33.5)
Total Net Sales 7,436.6 8,305.1 8,023.2 9,477.5 9,910.2 10,478.7 10,994.3 11,515.7
Y/Y Growth 3.5% 11.7% ‐3.4% 18.1% 4.6% 5.7% 4.9% 4.7%
Revenue by Geography
United States 1,939.7 2,008.1 1,985.1
Europe:
Germany 1,760.1 2,145.6 1,857.1
Hungary 451.5 518.1 500.5
France 327.6 405.2 339.2
Other Europe 1,132.5 1,097.3 921.8
Total Europe 3,671.7 4,166.2 3,618.6
South Korea 563.5 623.0 741.7
China 636.3 885.1 1,009.0
Other Foreign 625.4 622.7 668.8
Total Net Sales 7,436.6 8,305.1 8,023.2

BorgWarner Inc.
Income Statement
Fiscal Years Ending Dec. 31 2013 2014 2015 2016E 2017E 2018E 2019E 2020E
Sales 7,436.6$ 8,305.1$ 8,023.1$ $ 9,477.5 $ 9,910.2 $10,478.7 $10,994.3 $11,515.7
COGS ex. D&A 5,571.7 6,217.3 5,999.9 7,060.7 7,383.1 7,806.6 8,190.7 8,579.2
Depreciation 272.7 303.2 301.0 367.2 397.4 427.0 457.3 487.6
Amortization of Intangibles 26.7 27.2 19.1 40.4 39.2 37.9 37.4 37.0
Gross Income 1,565.5 1,757.4 1,703.1 2,009.1 2,090.5 2,207.2 2,308.9 2,411.9
SG&A Expense 336.5 362.7 354.6 448.7 469.2 496.1 520.6 545.2
R&D Expense, net 303.2 336.2 307.4 361.7 378.2 399.9 419.6 439.5
Stock-Based Compensation Expense 36.6 32.1 40.2 46.9 49.1 51.9 54.4 57.0
Other expense (income) 26.0 61.7 61.2 46.3 48.4 51.2 53.7 56.2
Goodwill Write Off ‐ ‐ ‐ ‐ ‐ ‐ ‐ ‐
Reorganization and Restructure Expense ‐ ‐ ‐ ‐ ‐ ‐ ‐ ‐
EBIT (Operating Income) 863.2 964.7 939.7 1,105.47 1,145.53 1,208.02 1,260.57 1,313.86
Equity in Earnings of Affiliates 43.5 47.3 40.0 42.1 44.3 46.6 49.0 51.6
Interest income 4.8 5.5 7.5 5.3 7.4 6.0 4.6 3.6
Interest expense & finance charges (34.2) (36.4) (60.4) (124.4) (145.7) (129.3) (114.5) (100.1)
Pretax Income 869.3 980.1 926.8 1,028.5 1,051.5 1,131.3 1,199.7 1,268.9
Total Provision for Income Taxes 218.3 292.6 280.4 267.4 273.4 294.1 311.9 329.9
Consolidated Net Income 651.0 687.5 646.4 761.1 778.1 837.1 887.7 939.0
Minority Interest 26.7 31.7 36.7 41.1 46.0 51.5 57.7 64.6
Net Income 624.3 655.8 609.7 720.0 732.1 785.6 830.1 874.4
EPS (recurring) 2.73$ 2.89$ 2.72$ 3.32$ 3.51$ 3.91$ 4.28$ 4.66$
Total Shares Outstanding 228.6 227.2 224.4 216.8 208.6 201.0 194.1 187.7
Total Dividends 56.8 116.1 116.7 144.0 146.4 157.1 166.0 174.9
Dividends per Share 0.25 0.51 0.52 0.66 0.70 0.78 0.86 0.93

BorgWarner Inc.
Balance Sheet
Fiscal Years Ending Dec. 31 2013 2014 2015 2016E 2017E 2018E 2019E 2020E
Assets
Cash 939.5 797.8 577.7 810.6 654.0 500.0 390.4 262.8
Accounts Receivables, net 1,248.5 1,443.5 1,665.0 1,895.5 1,882.9 1,886.2 1,869.0 1,957.7
Inventories, net 458.1 505.7 723.6 805.6 743.3 733.5 714.6 748.5
Prepaid Expenses 83.7 130.2 169.0 130.7 136.7 144.6 151.7 158.9
Deferred Income Taxes 68.7 93.6 - - - - - ‐
Total Current Assets 2,798.5 2,970.8 3,135.3 3,642.5 3,416.9 3,264.2 3,125.7 3,127.9
Total Gross P,P,&E 3,038.7 3,170.7 3,484.9 4,053.5 4,648.2 5,276.9 5,936.5 6,627.5
Accumulated Depreciation 1,099.3 1,076.8 1,036.8 1,404.0 1,801.4 2,228.5 2,685.7 3,173.3
Total Net P,P,&E 1,939.4 2,093.9 2,448.1 2,649.5 2,846.7 3,048.4 3,250.8 3,454.1
LT Investment - Affiliate Companies 201.5 184.2 200.1 211.5 223.5 236.1 249.4 263.3
Other Long-Term Receivables 203.6 219.1 260.8 241.1 252.1 266.6 279.7 293.0
Net Goodwill 1,197.0 1,205.7 1,757.7 1,757.7 1,757.7 1,757.7 1,757.7 1,757.7
Net Other Intangibles 169.5 151.1 543.8 503.4 464.2 426.3 388.9 351.9
Deferred Income Taxes 257.6 180.5 213.5 213.5 213.5 213.5 213.5 213.5
Product Liability Insurance Asset 96.7 111.8 108.5 132.7 138.7 146.7 153.9 161.2
Tangible Other Assets 53.2 110.9 173.7 189.5 198.2 209.6 219.9 230.3
Total Assets 6,917.0 7,228.0 8,841.5 9,541.45 9,511.60 9,569.14 9,639.49 9,852.99
Liabilities & Shareholders' Equity
ST Debt 194.8 601.2 280.7 288.4 304.7 309.1 316.5 322.8
Current Portion of LT Debt 6.8 22.5 160.8 49.9 13.9 134.1 259.9 14.6
Trade Payables 872.6 979.2 1,225.6 1,374.2 1,387.4 1,414.6 1,429.3 1,497.0
Accrued Expenses 511.2 551.1 640.8 659.1 689.2 728.7 764.6 800.8
Income Tax Payable 38.5 14.2 49.4 45.9 46.9 50.4 53.5 56.6
Total Current Liabilities 1,623.9 2,168.2 2,357.3 2,417.5 2,442.1 2,637.0 2,823.7 2,691.8
Long-Term Debt 1,021.0 716.3 2,124.6 2,479.1 2,182.7 1,771.5 1,360.4 1,387.4
Retirement-Related Liabilities 312.9 326.6 312.9 287.9 262.8 237.8 212.7 187.7
Deferred Income Taxes 81.3 46.8 120.1 120.1 120.1 120.1 120.1 120.1
Other Liabilities (excl. Deferred Income) 199.3 241.4 258.5 284.7 297.7 314.8 330.3 346.0
Deferred Income 46.2 37.8 36.6 44.0 46.0 48.7 51.1 53.5
Total Liabilities 3,284.6 3,537.1 5,210.0 5,633.30 5,351.45 5,129.85 4,898.26 4,786.46
Common Stock & APIC 1,124.4 1,114.9 1,112.2 1,135.6 1,135.6 1,135.6 1,135.6 1,135.6
Retained Earnings 3,177.4 3,717.1 4,210.1 4,827.2 5,458.9 6,138.9 6,860.6 7,624.7
Accumulated Other Comprehensive Income/(Loss) (14.0) (383.6) (610.2) (637.6) (666.3) (696.6) (728.4) (761.7)
Treasury Stock (727.2) (832.2) (1,158.4) (1,503.8) (1,865.0) (2,246.9) (2,647.5) (3,067.2)
Total Shareholders' Equity 3,560.6 3,616.2 3,553.7 3,821.3 4,063.2 4,331.0 4,620.2 4,931.3
Accumulated Minority Interest 71.8 74.7 77.8 86.8 97.0 108.3 121.0 135.2
Total Equity 3,632.4 3,690.9 3,631.5 3,908.1 4,160.1 4,439.3 4,741.2 5,066.5
Total Liabilities & Shareholders' Equity 6,917.0 7,228.0 8,841.5 9,541.45 9,511.60 9,569.14 9,639.49 9,852.99

BorgWarner Inc.
Cash Flow Statement
Fiscal Years Ending Dec. 31 2016E 2017E 2018E 2019E 2020E
Operating Activities
Net Income 761.1$ 778.1$ 837.1$ 887.7$ 939.0$
Adjustments for Non-Cash Charges
Depreciation 367.2 397.4 427.0 457.3 487.6
Amortization of Intangibles 40.4 39.2 37.9 37.4 37.0
Goodwill Write Off ‐ ‐ ‐ ‐ ‐
Restructuring Charges ‐ ‐ ‐ ‐ ‐
Equity in Affiliate Earnings, net of dividends (11.4) (12.0) (12.6) (13.3) (14.0)
Change in Deferred Taxes ‐ ‐ ‐ ‐ ‐
Changes in Working Capital
Receivables (230.5) 12.6 (3.2) 17.1 (88.7)
Inventories (82.0) 62.3 9.8 18.9 (33.9)
Prepaid Expenses 38.3 (6.0) (7.8) (7.1) (7.2)
Trade Payables 148.6 13.2 27.2 14.6 67.8
Accrued Expenses 18.3 30.1 39.5 35.9 36.3
Income Taxes Payable (3.5) 1.0 3.6 3.0 3.1
Deferred Revenue 7.4 2.0 2.6 2.4 2.4
Net Operating Cash Flow 1,053.9 1,318.0 1,361.0 1,454.0 1,429.5
Investing Activities
Capital Expenditures (568.6) (594.6) (628.7) (659.7) (690.9)
Net Assets from Acquisitons/Sale of Business ‐ ‐ ‐ ‐ ‐
(Purchase)/Sale of Investments ‐ ‐ ‐ ‐ ‐
(Increase)/Decrease in Other Assets (20.4) (25.7) (33.8) (30.6) (31.0)
(Increase)/Decrease in Other Liabilities 1.2 (12.0) (8.0) (9.6) (9.4)
Net Investing Cash Flow (587.8) (632.4) (670.5) (699.9) (731.3)
Financing Activities
Cash Dividends Paid (144.0) (146.4) (157.1) (166.0) (174.9)
Repurchase of Common & Preferred Stk. (345.4) (361.2) (381.9) (400.7) (419.7)
Sale of Common & Preferred Stock 23.4 ‐ ‐ ‐ ‐
Change in Current Debt (103.2) (19.7) 124.6 133.2 (239.0)
Issuance/(Reduction) of Long-Term Debt 354.5 (296.4) (411.2) (411.2) 27.0
Change in Minority Interest 9.0 10.1 11.3 12.7 14.2
Net Financing Cash Flow (205.7) (813.6) (814.2) (832.0) (792.4)
Exchange Rate Effects (27.4) (28.7) (30.3) (31.8) (33.3)
Net Change in Cash 232.9 (156.6) (154.0) (109.7) (127.5)
Beginning Cash 577.7 810.6 654.0 500.0 390.4
Ending Cash 810.6 654.0 500.0 390.4 262.8

BorgWarner Inc.
Common Size Income Statement
Fiscal Years Ending Dec. 31 2013 2014 2015 2016E 2017E 2018E 2019E 2020E
Sales 100.00% 100.00% 100.00% 100.00% 100.00% 100.00% 100.00% 100.00%
COGS ex. D&A 74.92% 74.86% 74.78% 74.50% 74.50% 74.50% 74.50% 74.50%
Depreciation 3.67% 3.65% 3.75% 3.87% 4.01% 4.08% 4.16% 4.23%
Amortization of Intangibles 0.36% 0.33% 0.24% 0.43% 0.40% 0.36% 0.34% 0.32%
Gross Income 21.05% 21.16% 21.23% 21.20% 21.09% 21.06% 21.00% 20.94%
SG&A Expense 4.52% 4.37% 4.42% 4.73% 4.73% 4.73% 4.73% 4.73%
R&D Expense, net 4.08% 4.05% 3.83% 3.82% 3.82% 3.82% 3.82% 3.82%
Stock-Based Compensation Expense 0.49% 0.39% 0.50% 0.50% 0.50% 0.50% 0.50% 0.50%
Other expense (income) 0.35% 0.74% 0.76% 0.49% 0.49% 0.49% 0.49% 0.49%
Goodwill Write Off 0.00% 0.00% 0.00% 0.00% 0.00% 0.00% 0.00% 0.00%
Reorganization and Restructure Expense 0.00% 0.00% 0.00% 0.00% 0.00% 0.00% 0.00% 0.00%
EBIT (Operating Income) 11.61% 11.62% 11.71% 11.66% 11.56% 11.53% 11.47% 11.41%
Equity in Earnings of Affiliates 0.58% 0.57% 0.50% 0.44% 0.45% 0.44% 0.45% 0.45%
Interest income 0.06% 0.07% 0.09% 0.06% 0.07% 0.06% 0.04% 0.03%
Interest expense & finance charges ‐0.46% ‐0.44% ‐0.75% ‐1.31% ‐1.47% ‐1.23% ‐1.04% ‐0.87%
Pretax Income 11.69% 11.80% 11.55% 10.85% 10.61% 10.80% 10.91% 11.02%
Total Provision for Income Taxes 2.94% 3.52% 3.49% 2.82% 2.76% 2.81% 2.84% 2.86%
Consolidated Net Income 8.75% 8.28% 8.06% 8.03% 7.85% 7.99% 8.07% 8.15%
Minority Interest 0.36% 0.38% 0.46% 0.43% 0.46% 0.49% 0.52% 0.56%
Net Income 8.39% 7.90% 7.60% 7.60% 7.39% 7.50% 7.55% 7.59%
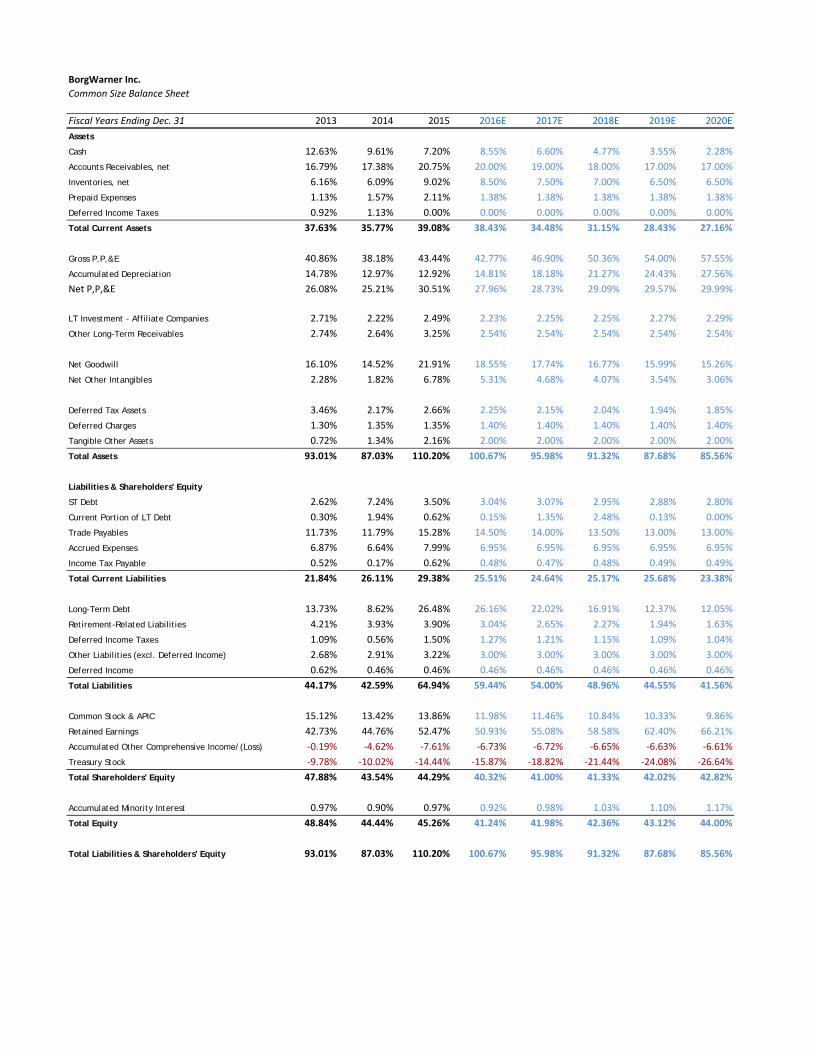
BorgWarner Inc.
Common Size Balance Sheet
Fiscal Years Ending Dec. 31 2013 2014 2015 2016E 2017E 2018E 2019E 2020E
Assets
Cash 12.63% 9.61% 7.20% 8.55% 6.60% 4.77% 3.55% 2.28%
Accounts Receivables, net 16.79% 17.38% 20.75% 20.00% 19.00% 18.00% 17.00% 17.00%
Inventories, net 6.16% 6.09% 9.02% 8.50% 7.50% 7.00% 6.50% 6.50%
Prepaid Expenses 1.13% 1.57% 2.11% 1.38% 1.38% 1.38% 1.38% 1.38%
Deferred Income Taxes 0.92% 1.13% 0.00% 0.00% 0.00% 0.00% 0.00% 0.00%
Total Current Assets 37.63% 35.77% 39.08% 38.43% 34.48% 31.15% 28.43% 27.16%
Gross P,P,&E 40.86% 38.18% 43.44% 42.77% 46.90% 50.36% 54.00% 57.55%
Accumulated Depreciation 14.78% 12.97% 12.92% 14.81% 18.18% 21.27% 24.43% 27.56%
Net P,P,&E 26.08% 25.21% 30.51% 27.96% 28.73% 29.09% 29.57% 29.99%
LT Investment - Affiliate Companies 2.71% 2.22% 2.49% 2.23% 2.25% 2.25% 2.27% 2.29%
Other Long-Term Receivables 2.74% 2.64% 3.25% 2.54% 2.54% 2.54% 2.54% 2.54%
Net Goodwill 16.10% 14.52% 21.91% 18.55% 17.74% 16.77% 15.99% 15.26%
Net Other Intangibles 2.28% 1.82% 6.78% 5.31% 4.68% 4.07% 3.54% 3.06%
Deferred Tax Assets 3.46% 2.17% 2.66% 2.25% 2.15% 2.04% 1.94% 1.85%
Deferred Charges 1.30% 1.35% 1.35% 1.40% 1.40% 1.40% 1.40% 1.40%
Tangible Other Assets 0.72% 1.34% 2.16% 2.00% 2.00% 2.00% 2.00% 2.00%
Total Assets 93.01% 87.03% 110.20% 100.67% 95.98% 91.32% 87.68% 85.56%
Liabilities & Shareholders' Equity
ST Debt 2.62% 7.24% 3.50% 3.04% 3.07% 2.95% 2.88% 2.80%
Current Portion of LT Debt 0.30% 1.94% 0.62% 0.15% 1.35% 2.48% 0.13% 0.00%
Trade Payables 11.73% 11.79% 15.28% 14.50% 14.00% 13.50% 13.00% 13.00%
Accrued Expenses 6.87% 6.64% 7.99% 6.95% 6.95% 6.95% 6.95% 6.95%
Income Tax Payable 0.52% 0.17% 0.62% 0.48% 0.47% 0.48% 0.49% 0.49%
Total Current Liabilities 21.84% 26.11% 29.38% 25.51% 24.64% 25.17% 25.68% 23.38%
Long-Term Debt 13.73% 8.62% 26.48% 26.16% 22.02% 16.91% 12.37% 12.05%
Retirement-Related Liabilities 4.21% 3.93% 3.90% 3.04% 2.65% 2.27% 1.94% 1.63%
Deferred Income Taxes 1.09% 0.56% 1.50% 1.27% 1.21% 1.15% 1.09% 1.04%
Other Liabilities (excl. Deferred Income) 2.68% 2.91% 3.22% 3.00% 3.00% 3.00% 3.00% 3.00%
Deferred Income 0.62% 0.46% 0.46% 0.46% 0.46% 0.46% 0.46% 0.46%
Total Liabilities 44.17% 42.59% 64.94% 59.44% 54.00% 48.96% 44.55% 41.56%
Common Stock & APIC 15.12% 13.42% 13.86% 11.98% 11.46% 10.84% 10.33% 9.86%
Retained Earnings 42.73% 44.76% 52.47% 50.93% 55.08% 58.58% 62.40% 66.21%
Accumulated Other Comprehensive Income/(Loss) ‐0.19% ‐4.62% ‐7.61% ‐6.73% ‐6.72% ‐6.65% ‐6.63% ‐6.61%
Treasury Stock ‐9.78% ‐10.02% ‐14.44% ‐15.87% ‐18.82% ‐21.44% ‐24.08% ‐26.64%
Total Shareholders' Equity 47.88% 43.54% 44.29% 40.32% 41.00% 41.33% 42.02% 42.82%
Accumulated Minority Interest 0.97% 0.90% 0.97% 0.92% 0.98% 1.03% 1.10% 1.17%
Total Equity 48.84% 44.44% 45.26% 41.24% 41.98% 42.36% 43.12% 44.00%
Total Liabilities & Shareholders' Equity 93.01% 87.03% 110.20% 100.67% 95.98% 91.32% 87.68% 85.56%

BorgWarner Inc.
Value Driver Estimation
Fiscal Years Ending Dec. 31 2013 2014 2015 2016E 2017E 2018E 2019E 2020E
Marginal tax rate calculation
Pre‐Tax Income 869.3 980.1 926.8
Tax at US statutory rate of 35% 304.3 343.0 324.4
State Taxes 2.3 2.6 8.2
Foreign rate differentia (73.4 (84.1 (92.6)
233.2 261.5 240.0
Marginal Tax Rate 27% 27% 26% 26% 26% 26% 26% 26%
NOPLAT Calculation
Net Revenue 7,436.6 8,305.1 8,023.1 9,477.5 9,910.2 10,478.7 10,994.3 11,515.7
‐COGS 5,571.7 6,217.3 5,999.9 7,060.7 7,383.1 7,806.6 8,190.7 8,579.2
‐S,G,&A Expense 336.5 362.7 354.6 448.7 469.2 496.1 520.6 545.2
‐R&D Expense, net 303.2 336.2 307.4 361.7 378.2 399.9 419.6 439.5
‐Stock Based Compensation Expense 36.6 32.1 40.2 46.9 49.1 51.9 54.4 57.0
‐Other Expense 26.0 61.7 61.2 46.3 48.4 51.2 53.7 56.2
+Implied interest on operating leases 2.5 3.3 3.5 3.8 4.1 4.4 4.7 5.0
EBITA 1,165.1 1,298.4 1,263.3 1,516.9 1,586.3 1,677.3 1,759.9 1,843.5
Less: Adjusted taxes
Income tax provision 218.3 292.6 280.4 267.4 273.4 294.1 311.9 329.9
+Tax shield on goodwill write‐of ‐ ‐ ‐ ‐ ‐ ‐ ‐ ‐
+Tax shield on reorganization expens ‐ ‐ ‐ ‐ ‐ ‐ ‐ ‐
‐Tax on equity in earnings of affiliate 11.7 12.6 10.4 10.9 11.5 12.1 12.7 13.4
+Tax shield on interest expense 9.2 9.7 15.6 32.3 37.9 33.6 29.8 26.0
‐Tax on interest income 1.3 1.5 1.9 1.4 1.9 1.6 1.2 0.9
+Tax shield on implied interest on Op Leases 0.7 0.9 0.9 1.0 1.1 1.1 1.2 1.3
Adjusted Taxes 241.1 317.3 309.3 313.0 325.8 342.6 356.8 371.6
Plus: Change in Deferred Tax Liabilities
LT deferred tax liability 281.5 266.5 441.1 458.7 477.1 496.2 516.0 536.7
LT deferred tax asset 522.7 491.0 534.5 542.8 551.1 559.6 568.3 577.1
Net deferred tax liabilities (241.2) (224.5) (93.4) (84.0) (74.0) (63.5) (52.3) (40.4)
Change in deferred tax liabilities 6.8 16.7 131.1 9.4 10.0 10.6 11.2 11.9
NOPLAT 930.8 997.8 1,085.2 1,213.2 1,270.5 1,345.3 1,414.3 1,483.8
Invested Capital Calculation
Operating Current Assets
"Normal" cash 148.7 166.1 160.5 189.5 198.2 209.6 219.9 230.3
Accounts receivable 1,248.5 1,443.5 1,665.0 1,895.5 1,882.9 1,886.2 1,869.0 1,957.7
Inventories 458.1 505.7 723.6 805.6 743.3 733.5 714.6 748.5
Prepaid Expenses 83.7 130.2 169.0 130.7 136.7 144.6 151.7 158.9
Total operating current assets 1,939.0 2,245.5 2,718.1 3,021.4 2,961.1 2,973.8 2,955.2 3,095.4
Operating Current Liabilities
Accounts payable & accrued expenses 872.6 979.2 1,225.6 1,374.2 1,387.4 1,414.6 1,429.3 1,497.0
Income tax payable 38.5 14.2 49.4 45.9 46.9 50.4 53.5 56.6
Total operating current liabilities 911.1 993.4 1,275.0 1,420.1 1,434.3 1,465.1 1,482.7 1,553.6
Net Operating Working Capita 1,027.9 1,252.1 1,443.1 1,601.3 1,526.8 1,508.7 1,472.5 1,541.7
Plus: Net P,P,&E
Gross P,P,&E 3,038.7 3,170.7 3,484.9 4,053.5 4,648.2 5,276.9 5,936.5 6,627.5
Accumulated depreciation 1,099.3 1,076.8 1,036.8 1,404.0 1,801.4 2,228.5 2,685.7 3,173.3
Net P,P,&E 1,939.4 2,093.9 2,448.1 2,649.5 2,846.7 3,048.4 3,250.8 3,454.1
Plus: Other LT Operating Assets
Net other intangibles 169.5 151.1 543.8 503.4 464.2 426.3 388.9 351.9
Present value of operating leases 48.0 63.5 68.3 73.9 79.4 85.0 90.7 96.3
Tangible other assets 53.2 110.9 173.7 189.5 198.2 209.6 219.9 230.3
Total LT operating assets 270.7 325.5 785.8 766.9 741.8 720.9 699.5 678.6
Less: Other LT Operating Liabilities
Other liabilities 199.3 241.4 258.5 284.7 297.7 314.8 330.3 346.0
Deferred revenue 46.2 37.8 36.6 44.0 46.0 48.7 51.1 53.5
Total LT operating liabilities 245.5 279.2 295.1 328.8 343.8 363.5 381.4 399.5
Invested Capital 2,992.5 3,392.3 4,381.8 4,688.9 4,771.6 4,914.6 5,041.4 5,275.0
Return on Invested Capital
NOPLAT 930.8 997.8 1,085.2 1,213.2 1,270.5 1,345.3 1,414.3 1,483.8
Beg. Invested Capital 2,783.3 2,992.5 3,392.3 4,381.8 4,688.9 4,771.6 4,914.6 5,041.4
ROIC 33.44% 33.34% 31.99% 27.69% 27.09% 28.19% 28.78% 29.43%
Free Cash Flow
NOPLAT 930.8 997.8 1,085.2 1,213.2 1,270.5 1,345.3 1,414.3 1,483.8
Change in Invested Capital 209.2 399.8 989.5 307.1 82.7 143.0 126.8 233.6
Free Cash Flow 721.6 598.0 95.7 906.2 1,187.8 1,202.3 1,287.5 1,250.1
Economic Profit
Beg. Invested Capital 2,783.3 2,992.5 3,392.3 4,381.8 4,688.9 4,771.6 4,914.6 5,041.4
ROIC 33.44% 33.34% 31.99% 27.69% 27.09% 28.19% 28.78% 29.43%
WACC 9% 9% 9% 9% 9% 9% 9% 9%
Economic Profit 675.7 723.6 774.3 811.7 840.8 908.1 963.9 1,021.8
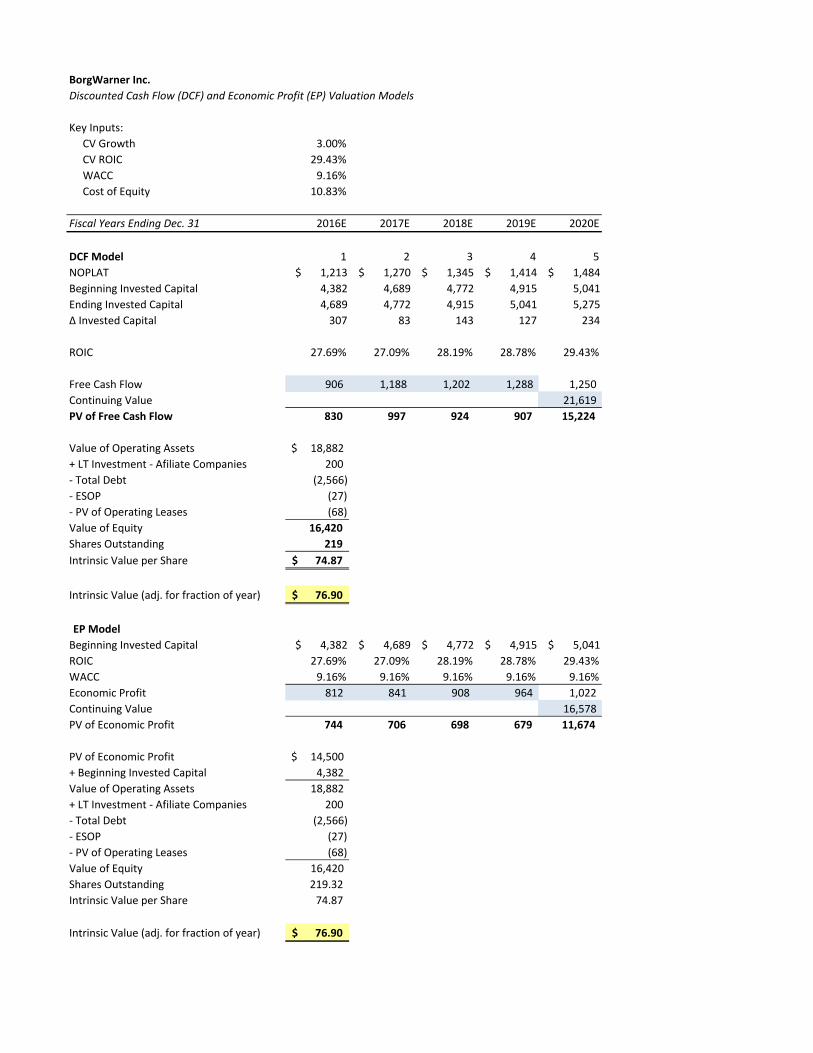
BorgWarner Inc.
Discounted Cash Flow (DCF) and Economic Profit (EP) Valuation Models
Key Inputs:
CV Growth 3.00%
CV ROIC 29.43%
WACC 9.16%
Cost of Equity 10.83%
Fiscal Years Ending Dec. 31 2016E 2017E 2018E 2019E 2020E
DCF Model 1 2 3 4 5
NOPLAT $ 1,213 $ 1,270 $ 1,345 $ 1,414 $ 1,484
Beginning Invested Capital 4,382 4,689 4,772 4,915 5,041
Ending Invested Capital 4,689 4,772 4,915 5,041 5,275
∆ Invested Capital 307 83 143 127 234
ROIC 27.69% 27.09% 28.19% 28.78% 29.43%
Free Cash Flow 906 1,188 1,202 1,288 1,250
Continuing Value 21,619
PV of Free Cash Flow 830 997 924 907 15,224
Value of Operating Assets 18,882$
+ LT Investment ‐ Afiliate Companies 200
‐ Total Debt (2,566)
‐ ESOP (27)
‐ PV of Operating Leases (68)
Value of Equity 16,420
Shares Outstanding 219
Intrinsic Value per Share 74.87$
Intrinsic Value (adj. for fraction of year) 76.90$
EP Model
Beginning Invested Capital $ 4,382 $ 4,689 $ 4,772 $ 4,915 $ 5,041
ROIC 27.69% 27.09% 28.19% 28.78% 29.43%
WACC 9.16% 9.16% 9.16% 9.16% 9.16%
Economic Profit 812 841 908 964 1,022
Continuing Value 16,578
PV of Economic Profit 744 706 698 679 11,674
PV of Economic Profit 14,500$
+ Beginning Invested Capital 4,382
Value of Operating Assets 18,882
+ LT Investment ‐ Afiliate Companies 200
‐ Total Debt (2,566)
‐ ESOP (27)
‐ PV of Operating Leases (68)
Value of Equity 16,420
Shares Outstanding 219.32
Intrinsic Value per Share 74.87
Intrinsic Value (adj. for fraction of year) 76.90$
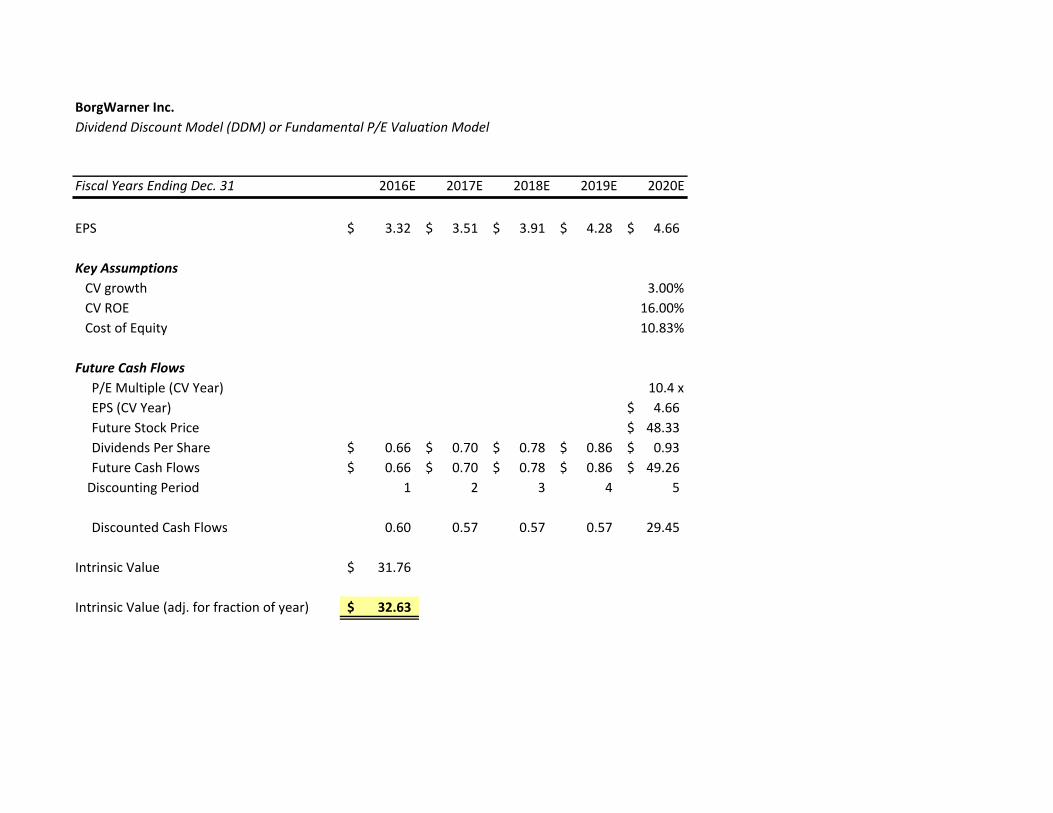
BorgWarner Inc.
Dividend Discount Model (DDM) or Fundamental P/E Valuation Model
Fiscal Years Ending Dec. 31 2016E 2017E 2018E 2019E 2020E
EPS 3.32$ 3.51$ 3.91$ 4.28$ 4.66$
Key Assumptions
CV growth 3.00%
CV ROE 16.00%
Cost of Equity 10.83%
Future Cash Flows
P/E Multiple (CV Year) 10.4 x
EPS (CV Year) 4.66$
Future Stock Price 48.33$
Dividends Per Share 0.66$ 0.70$ 0.78$ 0.86$ 0.93$
Future Cash Flows 0.66$ 0.70$ 0.78$ 0.86$ 49.26$
Discounting Period 1 2 3 4 5
Discounted Cash Flows 0.60 0.57 0.57 0.57 29.45
Intrinsic Value 31.76$
Intrinsic Value (adj. for fraction of year) 32.63$

BorgWarner Inc.
Relative Valuation Models
EPS EPS Est. 5yr
Ticker Company Price 2016E 2017E P/E 16 P/E 17 EPS gr. PEG 16 PEG 17
ALV Autoliv Inc. $107.00 $6.82 $7.54 15.7 14.2 0.073 2.15 1.94
SHA‐DE Schaeffler AG $15.36 $1.66 $1.78 9.3 8.6 0.075 1.23 1.15
TEN Tenneco Inc. $45.75 $5.50 $6.21 8.3 7.4 0.136 0.61 0.54
HLE‐DE Hella KGaA Hueck & Co $48.55 $3.60 $4.00 13.5 12.1 0.122 1.10 0.99
HON Honewell $107.98 $6.60 $7.25 16.4 14.9 0.092 1.78 1.62
POM‐FR Plastic Omnium SA $30.91 $2.32 $2.84 13.3 10.9 0.193 0.69 0.56
DLPH Delphi Automotive $75.02 $6.05 $6.98 12.4 10.7 0.142 0.87 0.76
CON Continental AG $213.13 $16.81 $18.14 12.7 11.7 0.062 2.04 1.89 DAN Dana Holding Corp $12.31 $1.70 $1.97 7.2 6.2 0.034 2.11 1.82
Average 12.1 10.8 1.4 1.3
BWA BorgWarner Inc. $38.40 $ 3.32 $ 3.51 11.6 10.9 0.114 1.0 1.0
Implied Value:
Relative P/E (EPS16) $ 40.12 Source: FactSet
Relative P/E (EPS17) 37.78$ Euro/USD exchange rate = 0.91 (2/28/2016)
PEG Ratio (EPS16) 52.84$ Prices as of 2/26/2016
PEG Ratio (EPS17) 50.05$

BorgWarner Inc.
Weighted Average Cost of Capital (WACC) Estimation
Data as of: 3/3/2016 Beta Estimates (As of 2/25/2016 via Bloomberg)
Current price: $38.40 Time Period Weekly Monthly
1 Yr 1.36 1.45
Risk free rate 2.61% 2 Yr 1.43 1.78
Equity risk premium 5% 3 Yr 1.43 1.72
Beta (avg. of monthly betas) 1.64 4 Yr 1.47 1.53
Cost of equity 10.83% 5 Yr 1.46 1.75
Average 1.43 1.64
Pre‐tax cost of debt 5.17%
Marginal tax rate 26.00%
After‐tax cost of debt 3.83%
Shares outstanding 219.32
Current price/share $38.40
MV of equity (E) 8,422.07$
Short‐term debt 280.7
Current portion of LT debt 160.8
Lont‐term debt 2124.6
PV of operating leases 68
Total BV of debt (D) 2,634.39$
MV of equity 8,422.07$
BV of debt 2,634.39$
Total value of firm (V) 11,056.46$
WACC Calculation
Cost of equity 10.83%
*(E/V) 76.17%
+
After‐tax cost of debt 3.83%
*(D/V) 23.83%
WACC 9.16%

BorgWarner Inc.
Key Management Ratios
Fiscal Years Ending Dec. 31 2011 2012 2013 2014 2015 2016E 2017E 2018E 2019E 2020E
Liquidity Ratios
Current Ratio
Current Assets/Current Liabilities 1.12 1.54 1.72 1.37 1.33 1.51 1.40 1.24 1.11 1.16
Quick Ratio
(Current Assets‐Inventory)/Current Liabilities 0.88 1.26 1.44 1.14 1.02 1.17 1.09 0.96 0.85 0.88
Cash Ratio
Cash/Current Liabilities 0.19 0.45 0.58 0.37 0.25 0.34 0.27 0.19 0.14 0.10
Activity or Asset‐Management Ratios
Receivables Turnover
Total Revenue/Average Accounts Receivable 6.4 6.2 6.2 6.2 5.2 5.3 5.2 5.6 5.9 6.0
Average Collection Period
365/Receivables Turnover 56.6 59.2 58.8 59.2 70.7 68.6 69.6 65.6 62.3 60.6
Inventory Turnover
COGS/Average Inventory 12.3 12.1 12.3 12.9 9.8 9.2 9.5 10.6 11.3 11.7
Days in Inventory (DIO)
365/Inventory Turnover 29.8 30.2 29.7 28.3 37.4 39.5 38.3 34.5 32.3 31.1
Payables Turnover
COGS/Average Trade Payables 7.0 6.7 6.6 6.7 5.4 5.4 5.3 5.6 5.8 5.9
Days Payables Outstanding (DPO)
365/Payables Turnover 52.5 54.9 55.3 54.4 67.1 67.2 68.3 65.5 63.4 62.2
Cash Conversion Cycle
Avg. Collection Period + DIO ‐ DPO 33.9 34.6 33.2 33.1 41.0 40.9 39.6 34.7 31.2 29.5
Financial Leverage Ratios
Debt‐to‐Equity
Total Liabilities/Total Equity 1.4 1.0 0.9 1.0 1.4 1.4 1.3 1.2 1.0 0.9
Debt‐to‐Total Capital
Total Debt/(Total Debt+Total Equity) 0.6 0.5 0.5 0.5 0.6 0.6 0.6 0.5 0.5 0.5
Interest Coverage
Operating Income/Interest Expense 10.7 18.7 25.2 26.5 15.6 8.9 7.9 9.3 11.0 13.1
Profitability Ratios
Gross Margin
Gross Income/ Total Revenue 19.8% 20.2% 21.1% 21.2% 21.2% 21.2% 21.1% 21.1% 21.0% 20.9%
Operating Margin
Operating Income/Total Revenue 11.2% 10.3% 11.6% 11.6% 11.7% 11.7% 11.6% 11.5% 11.5% 11.4%
Return on Average Equity (ROE)
Net Income/Average Total Equity 23.1% 17.9% 18.4% 17.9% 16.7% 19.1% 18.1% 18.3% 18.1% 17.8%
Return on Average Assets (ROA)
Net Income/Average Total Assets 9.6% 8.1% 9.4% 9.3% 7.6% 7.8% 7.7% 8.2% 8.6% 9.0%
Payout Policy Ratios
Current Dividend Yield
Current Per Share Dividends/Current Price 1.59%
Dividend Payout Ratio
Total Dividends/Net Income N/A N/A 9.1% 17.7% 19.1% 20.0% 20.0% 20.0% 20.0% 20.0%
Total Payout Ratio
(Total Dividends+Share Repurchases)/Net Income 65.0% 59.1% 45.2% 39.0% 76.5% 68.0% 69.3% 68.6% 68.3% 68.0%
Recommended