Board of Directors Meeting January 16, 2014
1
2
Agenda
A. Call to Order and IntroductionsB. Public CommentC. Review and Approval of MinutesD. CEO ReportE. Operations UpdateF. Information Technology UpdateG. Marketing & Sales UpdateH. All Payer Claims Database UpdateI. Finance UpdateJ. Strategy Committee UpdateK. Adjournment

Welcome and Introductions

Public Comment

CEO Update
Operations Update
6
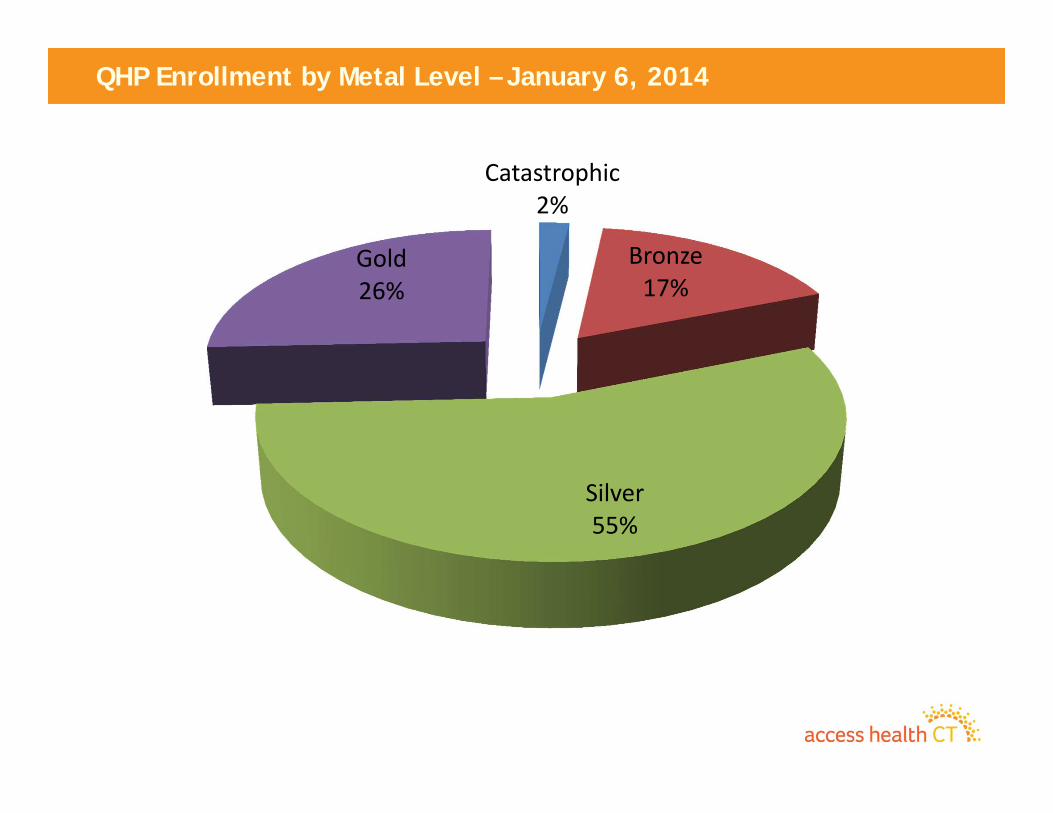
QHP Enrollment by Metal Level – January 6, 2014
Catastrophic2%
Bronze17%
Silver55%
Gold26%
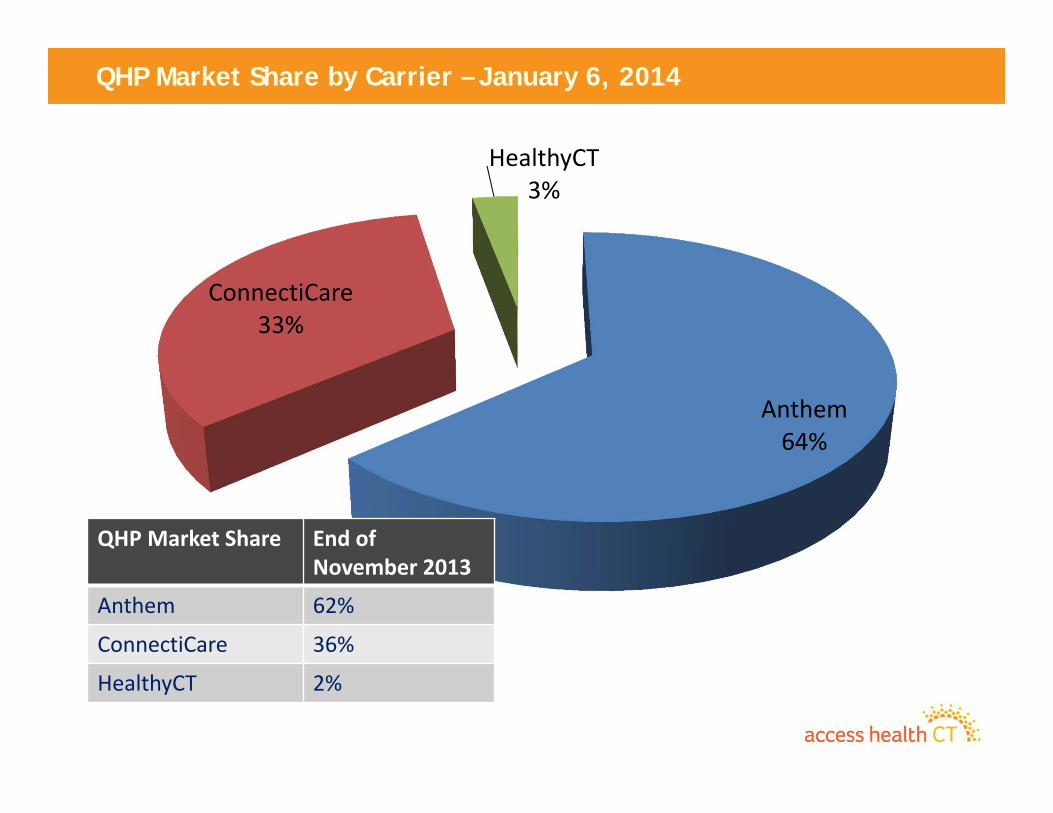
QHP Market Share by Carrier – January 6, 2014
Anthem64%
ConnectiCare33%
HealthyCT3%
QHP Market Share End of November 2013
Anthem 62%
ConnectiCare 36%
HealthyCT 2%
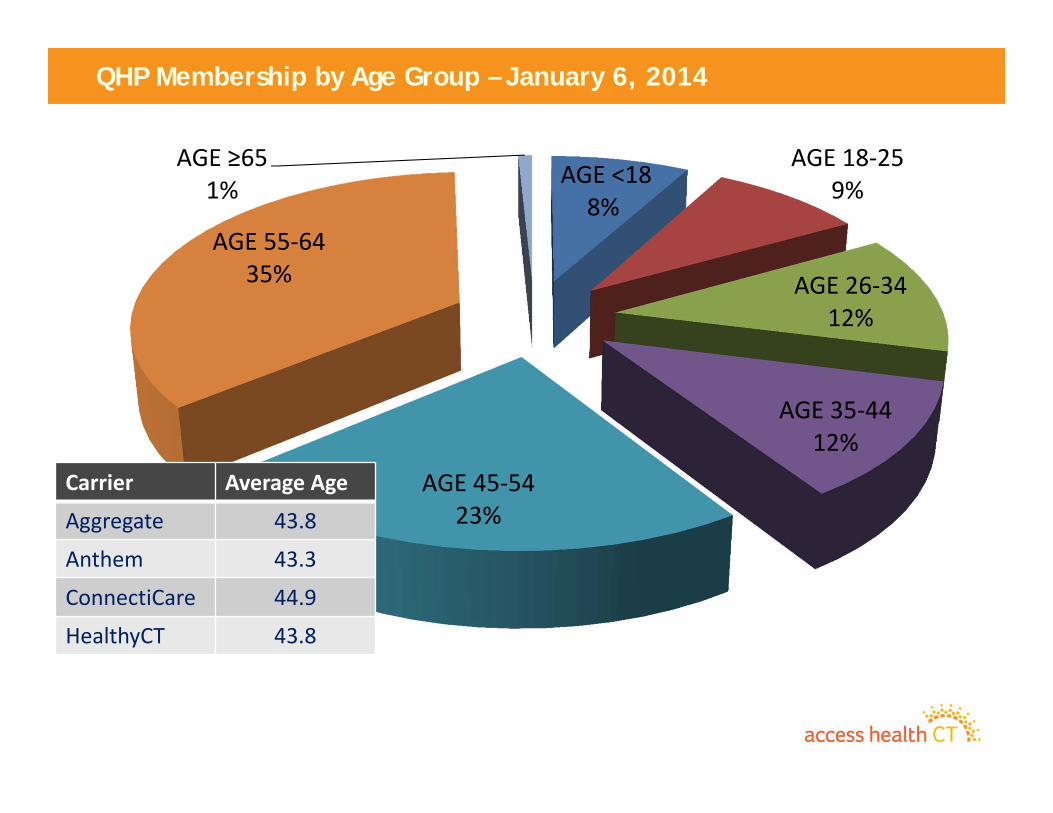
QHP Membership by Age Group – January 6, 2014
AGE <188%
AGE 18‐259%
AGE 26‐3412%
AGE 35‐4412%
AGE 45‐5423%
AGE 55‐6435%
AGE ≥651%
Carrier Average Age
Aggregate 43.8
Anthem 43.3
ConnectiCare 44.9
HealthyCT 43.8
10
Follow Up from Operations Trends for December– Expected 31,000 members to apply in December
• Over 37,000 applied• Small Employer Health Options program membership is unsatisfactory
– Effective customer service was deemed at risk• Our Call Center performance was unsatisfactory• HUSKY applications backlogged at DSS• Carriers were backlogged with bills, payment application, and ID cards
– Call Center Preparations• We started a Two Fold Approach:
– Lower the number of calls» Implemented a technical support line for Brokers, Assisters and application
counselors that was very well received and utilized» Aggressive re‐education of brokers, assisters on system use and ACA
– Increase Capacity» Began increase, but we did not avoid poor service» Originally thought 149 representatives» Now working towards 300 by the end of this week.
11
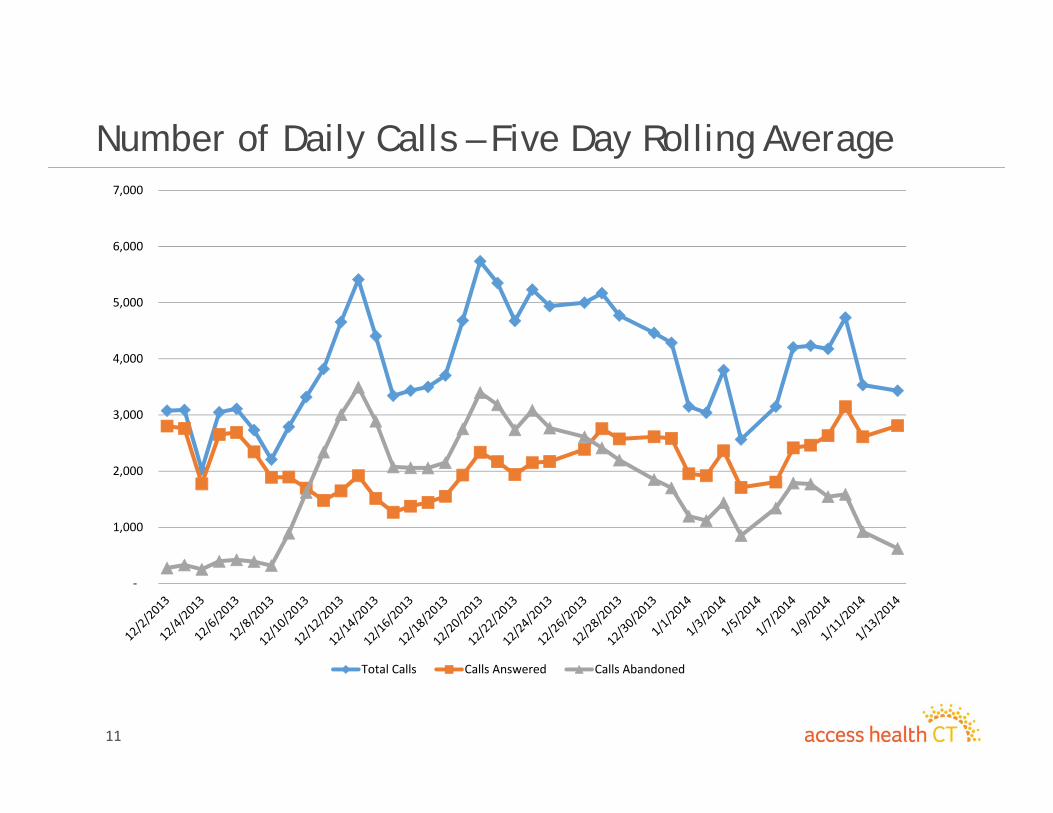
Number of Daily Calls – Five Day Rolling Average
‐
1,000
2,000
3,000
4,000
5,000
6,000
7,000
Total Calls Calls Answered Calls Abandoned
12
Major Call Topics – Changing over time
• Early December– Basic questions about insurance and ACA– Broker/Assister technical issues
• Mid‐December– Customer issues on use of system– Customer concern about lack of carrier communication
• Third Week of December– Customers calling to apply
• Now– Concerns about coverage
• Insurance Carriers• HUSKY/CHIP
13
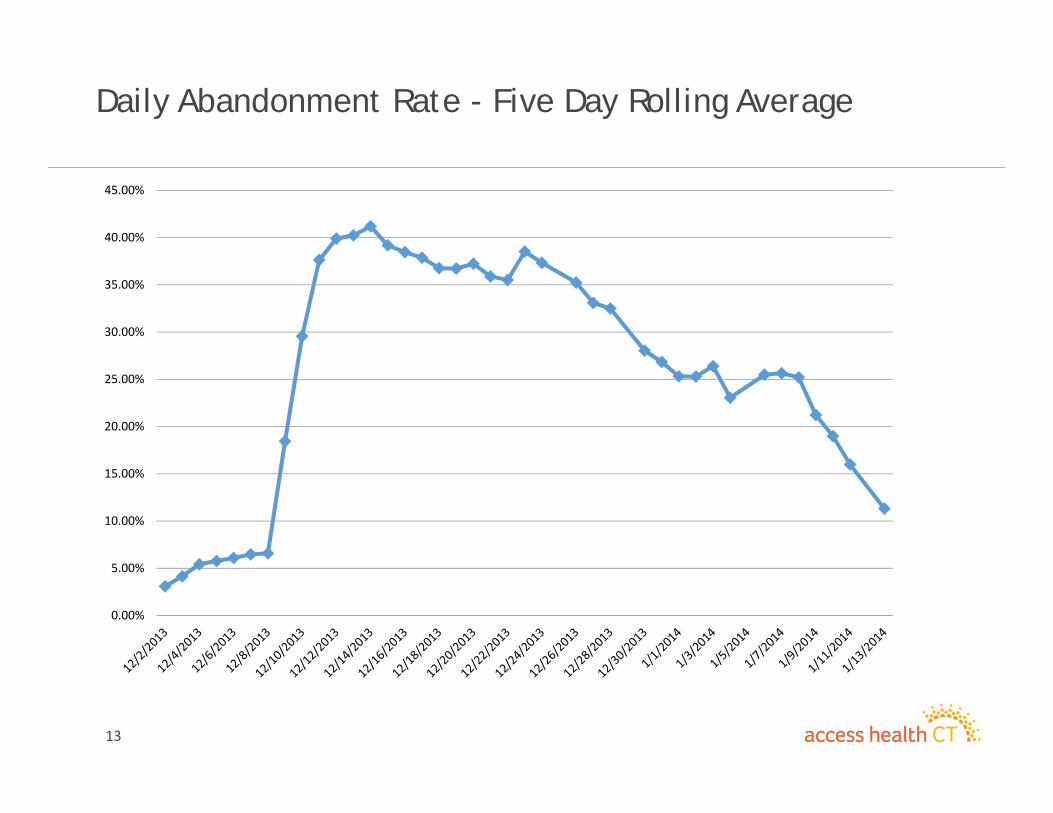
Daily Abandonment Rate - Five Day Rolling Average
0.00%
5.00%
10.00%
15.00%
20.00%
25.00%
30.00%
35.00%
40.00%
45.00%
14
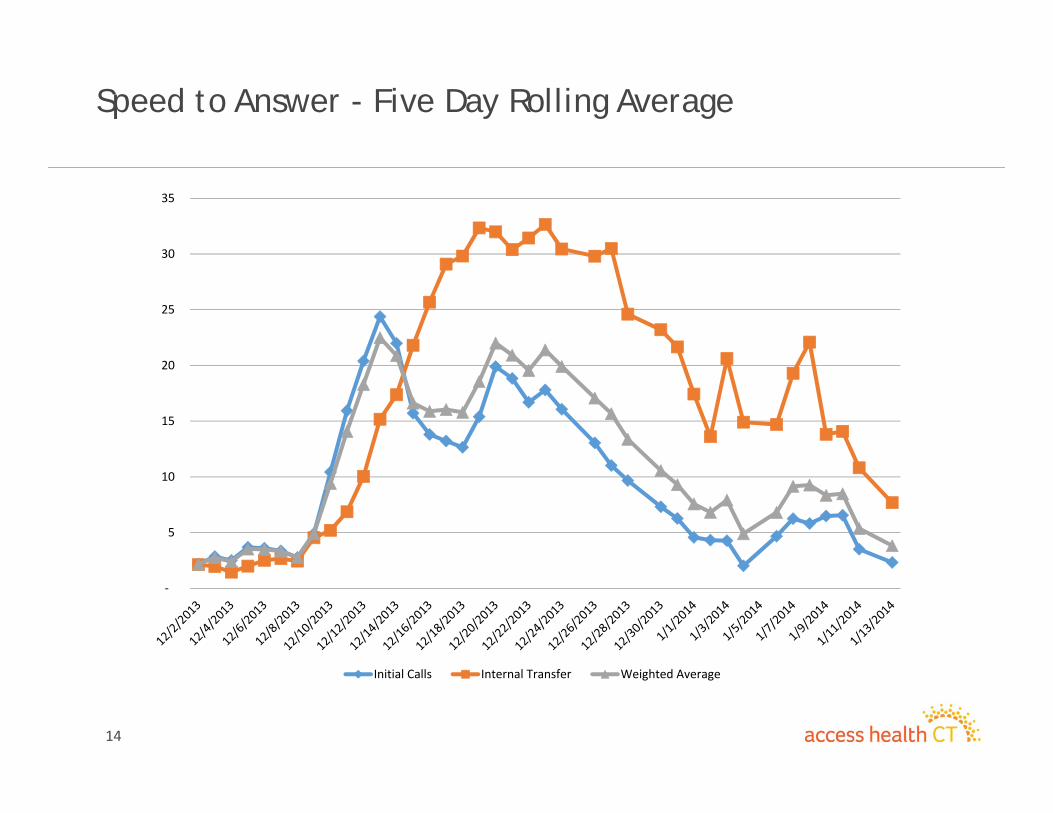
Speed to Answer - Five Day Rolling Average
‐
5
10
15
20
25
30
35
Initial Calls Internal Transfer Weighted Average
15
January Issues and Actions– Membership continues to grow
– Customer Service – “RPM” Rollout Performance Management• Call center capacity and effectiveness
– Expansion to over 300 call center representatives in January– Continued aggressive engagement of call center vendor– Appropriate handling of customers
» HUSKY/CHIP calls to DSS» Insurance calls to carriers
• Address Member Issues – Access to benefits– Customer education– System improvements
• HUSKY/CHIP Customers– Work with DSS to increase their capacity to handle annual redeterminations
» Education» Technical Support
– Engagement of current contractors for data entry and call center support
16
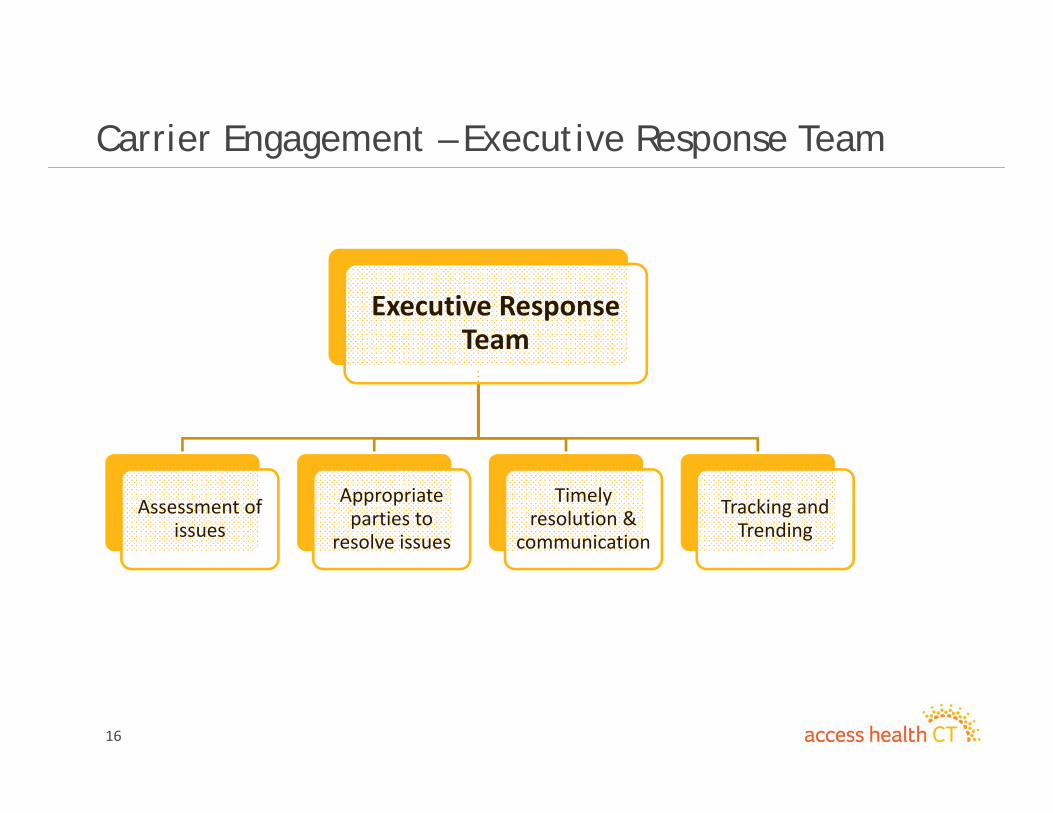
Carrier Engagement – Executive Response Team
Executive Response Team
Assessment of issues
Appropriate parties to
resolve issues
Timely resolution &
communication
Tracking and Trending
17
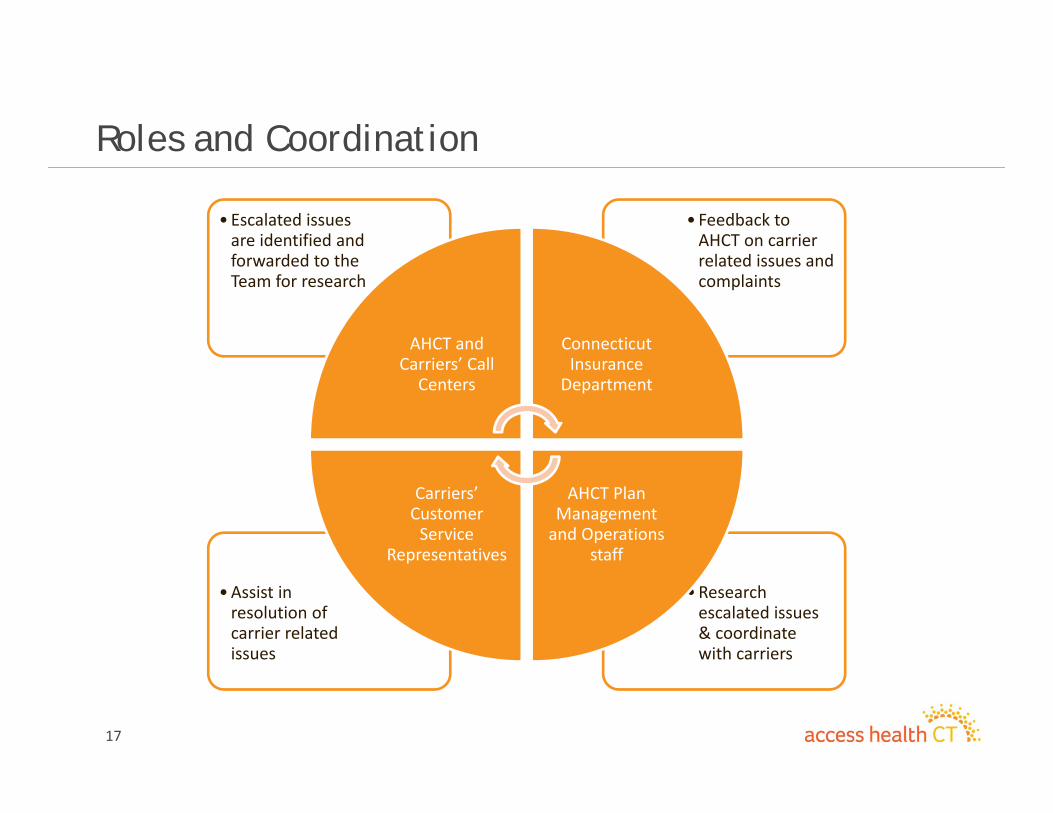
Roles and Coordination
•Research escalated issues & coordinate with carriers
•Assist in resolution of carrier related issues
• Feedback to AHCT on carrier related issues and complaints
• Escalated issues are identified and forwarded to the Team for research
AHCT and Carriers’ Call Centers
Connecticut Insurance Department
AHCT Plan Management and Operations
staff
Carriers’ Customer Service
Representatives
18
Operations – Background Material1) Operating Summary Reports
a. January 13‐19, 2014b. January 6‐12, 2014
2) Carrier Hospital Contract Update
19
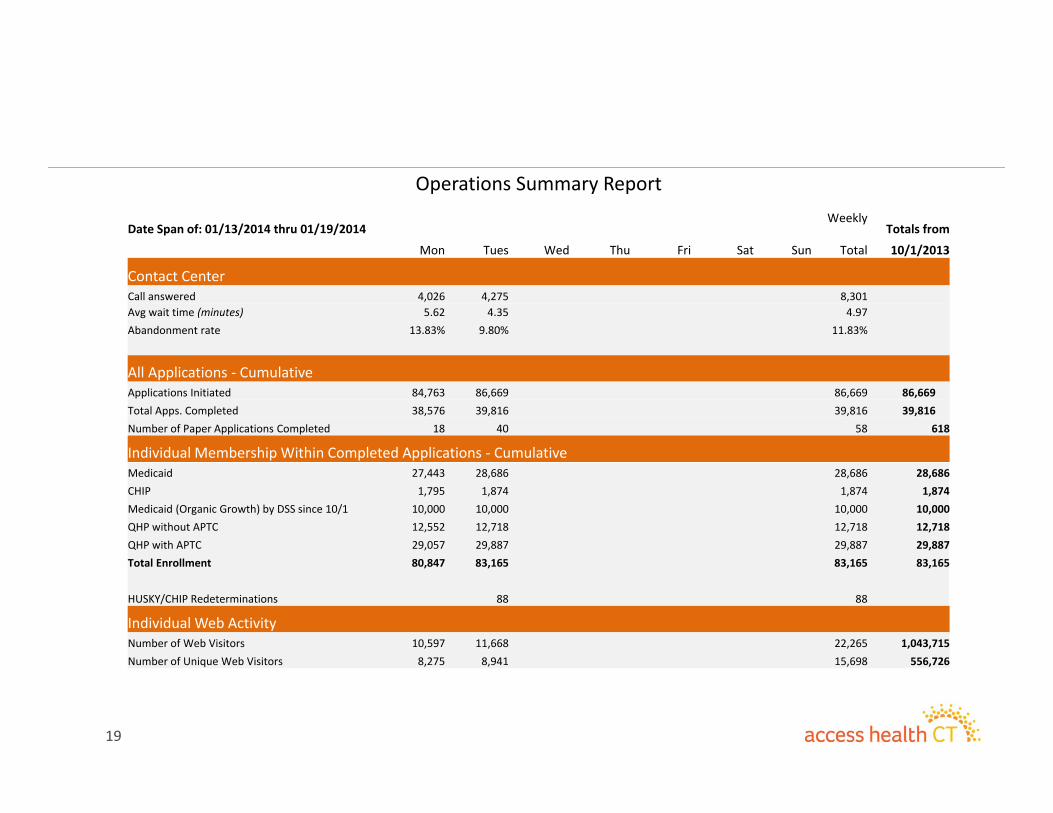
Operations Summary Report
Date Span of: 01/13/2014 thru 01/19/2014Weekly
Totals from
Mon Tues Wed Thu Fri Sat Sun Total 10/1/2013
Contact Center Call answered 4,026 4,275 8,301 Avg wait time (minutes) 5.62 4.35 4.97Abandonment rate 13.83% 9.80% 11.83%
All Applications ‐ CumulativeApplications Initiated 84,763 86,669 86,669 86,669 Total Apps. Completed 38,576 39,816 39,816 39,816 Number of Paper Applications Completed 18 40 58 618
Individual Membership Within Completed Applications ‐ CumulativeMedicaid 27,443 28,686 28,686 28,686CHIP 1,795 1,874 1,874 1,874Medicaid (Organic Growth) by DSS since 10/1 10,000 10,000 10,000 10,000QHP without APTC 12,552 12,718 12,718 12,718QHP with APTC 29,057 29,887 29,887 29,887Total Enrollment 80,847 83,165 83,165 83,165
HUSKY/CHIP Redeterminations 88 88
Individual Web ActivityNumber of Web Visitors 10,597 11,668 22,265 1,043,715 Number of Unique Web Visitors 8,275 8,941 15,698 556,726
20
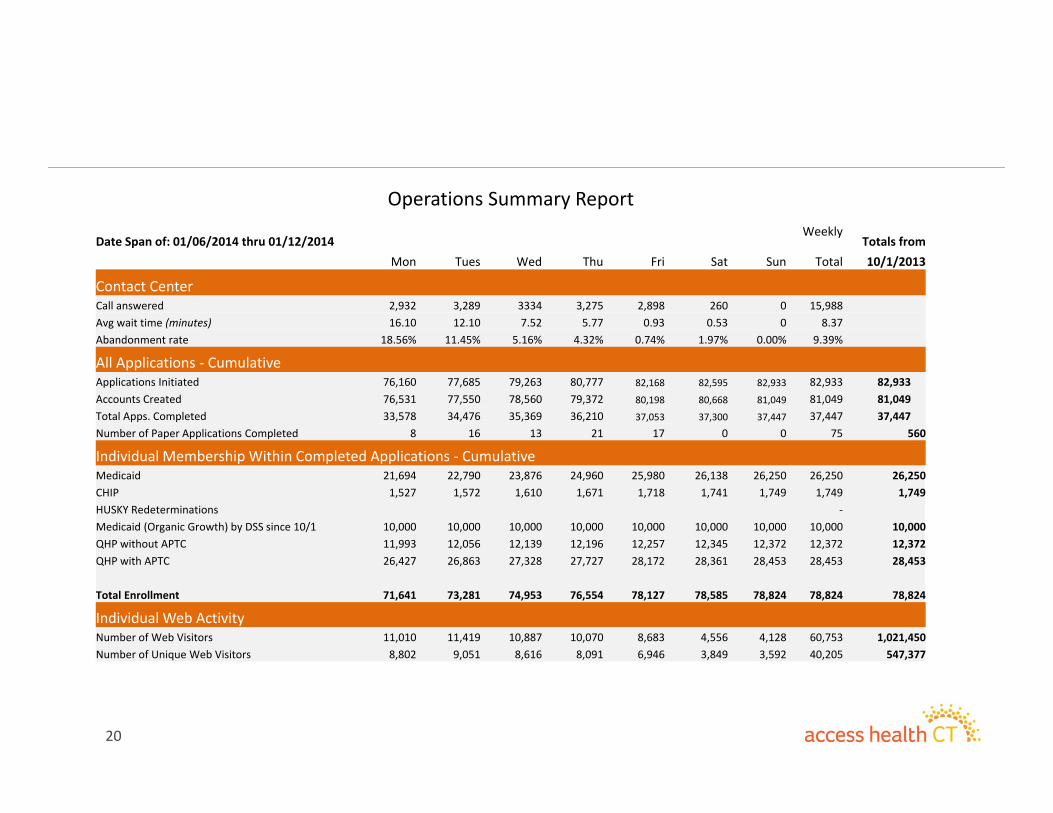
Operations Summary Report
Date Span of: 01/06/2014 thru 01/12/2014Weekly
Totals from Mon Tues Wed Thu Fri Sat Sun Total 10/1/2013
Contact Center Call answered 2,932 3,289 3334 3,275 2,898 260 0 15,988 Avg wait time (minutes) 16.10 12.10 7.52 5.77 0.93 0.53 0 8.37Abandonment rate 18.56% 11.45% 5.16% 4.32% 0.74% 1.97% 0.00% 9.39%
All Applications ‐ CumulativeApplications Initiated 76,160 77,685 79,263 80,777 82,168 82,595 82,933 82,933 82,933 Accounts Created 76,531 77,550 78,560 79,372 80,198 80,668 81,049 81,049 81,049 Total Apps. Completed 33,578 34,476 35,369 36,210 37,053 37,300 37,447 37,447 37,447 Number of Paper Applications Completed 8 16 13 21 17 0 0 75 560
Individual Membership Within Completed Applications ‐ CumulativeMedicaid 21,694 22,790 23,876 24,960 25,980 26,138 26,250 26,250 26,250CHIP 1,527 1,572 1,610 1,671 1,718 1,741 1,749 1,749 1,749HUSKY Redeterminations ‐Medicaid (Organic Growth) by DSS since 10/1 10,000 10,000 10,000 10,000 10,000 10,000 10,000 10,000 10,000QHP without APTC 11,993 12,056 12,139 12,196 12,257 12,345 12,372 12,372 12,372QHP with APTC 26,427 26,863 27,328 27,727 28,172 28,361 28,453 28,453 28,453
Total Enrollment 71,641 73,281 74,953 76,554 78,127 78,585 78,824 78,824 78,824
Individual Web ActivityNumber of Web Visitors 11,010 11,419 10,887 10,070 8,683 4,556 4,128 60,753 1,021,450 Number of Unique Web Visitors 8,802 9,051 8,616 8,091 6,946 3,849 3,592 40,205 547,377

21
Carrier Hospital Contracting
Provider Name Facility Name Facility City Anthem CBI HCT UHCBridgeport Hospital Bridgeport Hospital Bridgeport Both On Both BothSaint Vincent's Medical CenteSaint Vincent's Medical Center Bridgeport Both On Both BothBristol Hospital, Inc. Bristol Hospital, Inc. Bristol Both On Both BothWestern CT Health Network Danbury Hospital Danbury Both On Both BothGriffin Hospital Griffin Hospital Derby Both On Both BothState of CT, University of CT HJohn Dempsey Hospital Farmington Both On Under Negotiation BothGreenwich Hospital Greenwich Hospital Greenwich Both On Both BothCT Children's Medical Center CT Children's Medical Center Hartford Both On Both BothHartford HealthCare Hartford Hospital Hartford Both On Both BothSaint FrancisCare Saint Francis Hospital and MedicHartford Off On Under Negotiation BothEastern CT Health Network Manchester Memorial Hospital Manchester Both On Both BothHartford HealthCare Mid‐State Medical Center Meriden Both On Both BothMiddlesex Hospital Middlesex Hospital Middletown Both On Under Negotiation BothMilford Hospital, Inc. Milford Hospital, Inc. Milford Both On Not Contracted BothHartford HealthCare Hospital of Central CT, The New Britain Both On Both BothYale‐New Haven Health Syste Hospital of Saint Raphael New Haven Both On Both BothYale‐New Haven Health Syste Yale‐New Haven Hospital New Haven Both On Both BothLawrence and Memorial Hosp Lawrence and Memorial HospitaNew London Both On Both BothWestern CT Health Network New Milford Hospital New Milford Both On Both BothNorwalk Hospital Association Norwalk Hospital Norwalk Off On Both BothWilliam W. Backus Hospital, TWilliam W. Backus Hospital, TheNorwich Both On Both BothDay Kimball Healthcare, Inc. Day Kimball Hospital Putnam Both Under Negotiation Both BothEssent Healthcare of CT, Inc. Sharon Hospital Sharon Both On Both BothHartford HealthCare Hospital of Central CT, The Southington Both On Both BothJohnson Memorial Medical CeJohnson Memorial Medical CentStafford Springs Both On Not Contracted BothStamford Hospital, The Stamford Hospital, The Stamford Both On Both BothCharlotte Hungerford HospitaCharlotte Hungerford Hospital, TTorrington Both On Both BothEastern CT Health Network Rockville General Hospital Vernon Both On Both BothSaint Mary's Health System Saint Mary's Hospital, Inc. Waterbury Both On Both BothWaterbury Hospital Waterbury Hospital Waterbury Both On Both BothHartford HealthCare Windham Hospital Willimantic Both On Both Both
Total Hospitals 31 31 31 31Not Contracted 0 0 2 0Off Exchange Only 2 0 0 0Under Negotiation 0 1 3 0On Exchange 29 30 26 31

Information Technology Update
23
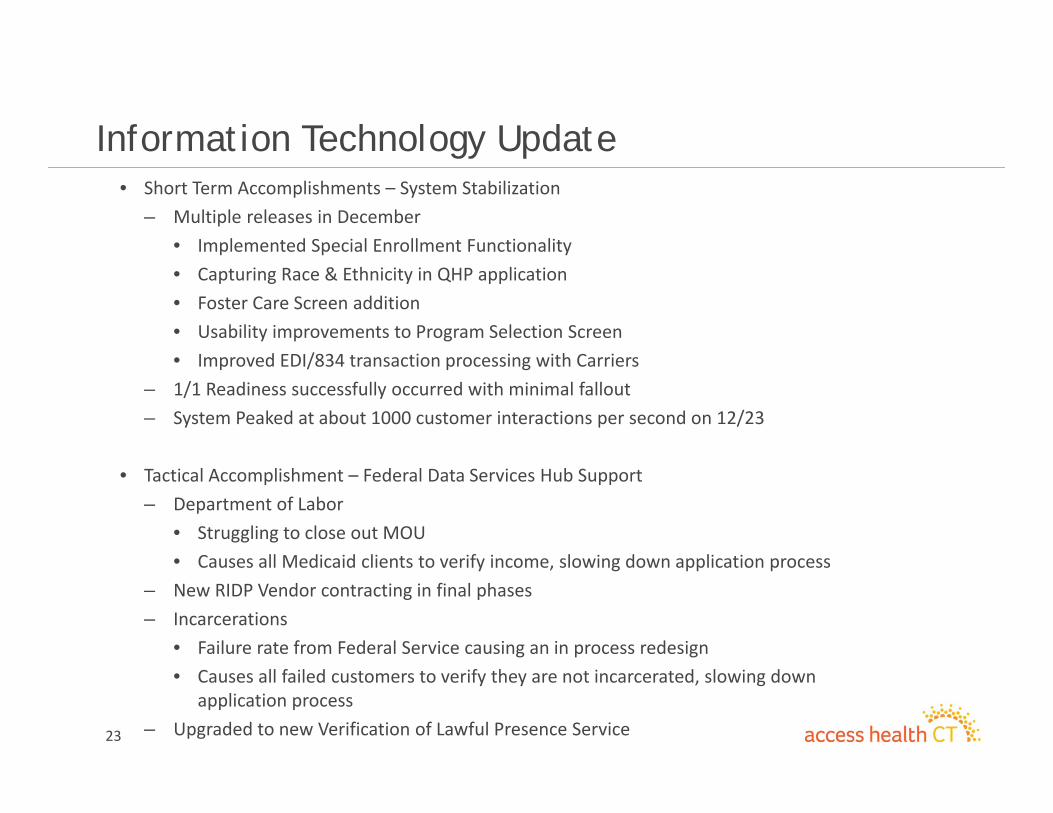
Information Technology Update• Short Term Accomplishments – System Stabilization
– Multiple releases in December• Implemented Special Enrollment Functionality• Capturing Race & Ethnicity in QHP application• Foster Care Screen addition• Usability improvements to Program Selection Screen• Improved EDI/834 transaction processing with Carriers
– 1/1 Readiness successfully occurred with minimal fallout– System Peaked at about 1000 customer interactions per second on 12/23
• Tactical Accomplishment – Federal Data Services Hub Support– Department of Labor
• Struggling to close out MOU• Causes all Medicaid clients to verify income, slowing down application process
– New RIDP Vendor contracting in final phases– Incarcerations
• Failure rate from Federal Service causing an in process redesign• Causes all failed customers to verify they are not incarcerated, slowing down
application process– Upgraded to new Verification of Lawful Presence Service
24
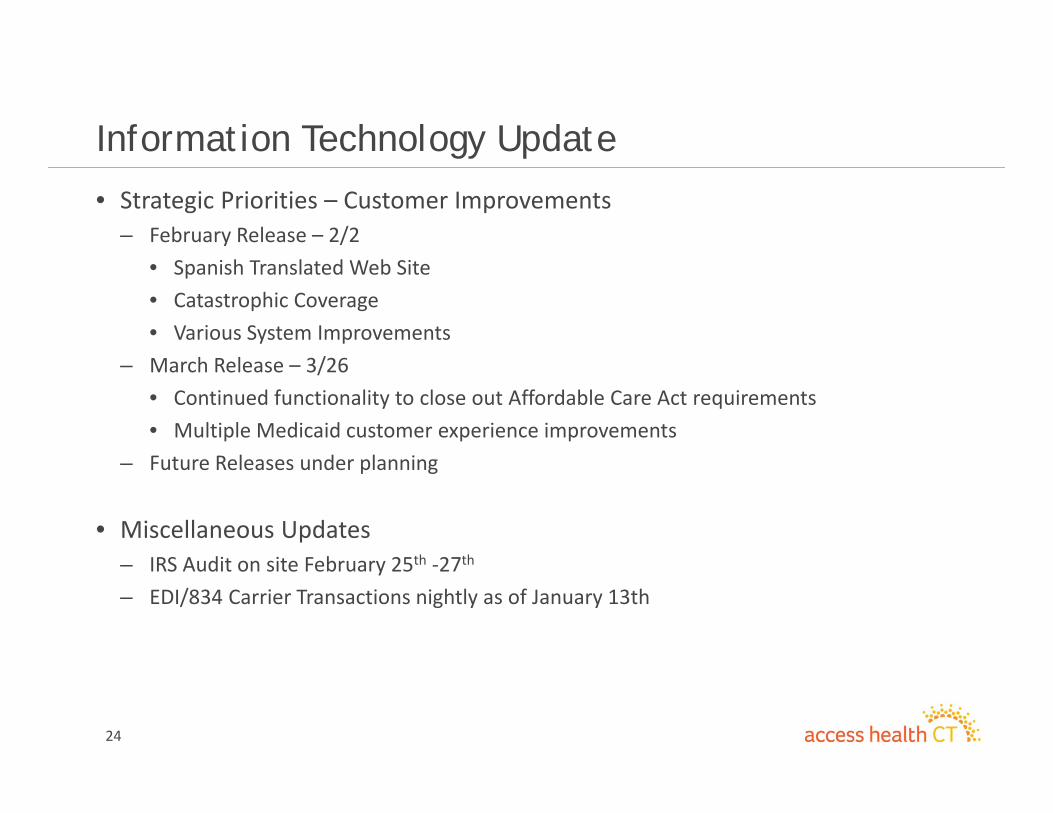
Information Technology Update
• Strategic Priorities – Customer Improvements– February Release – 2/2
• Spanish Translated Web Site• Catastrophic Coverage• Various System Improvements
– March Release – 3/26• Continued functionality to close out Affordable Care Act requirements• Multiple Medicaid customer experience improvements
– Future Releases under planning
• Miscellaneous Updates– IRS Audit on site February 25th ‐27th
– EDI/834 Carrier Transactions nightly as of January 13th
Marketing Update
26
Contents
• Update on Media Efforts• Overview of Key Marketing Metrics• Highlights of Recent NIPA Conference
27
Media Update
January activity building on strong December spend• Decembers spend of $1.2M is continuing to have an impact as we enter Q1
– January media activity will total roughly half (or $600k)– Activity will be focused on high profile media opportunities in Jan and Feb– Spend will also be directed to particular geographies and populations needing additional
exposure
28
Media Update
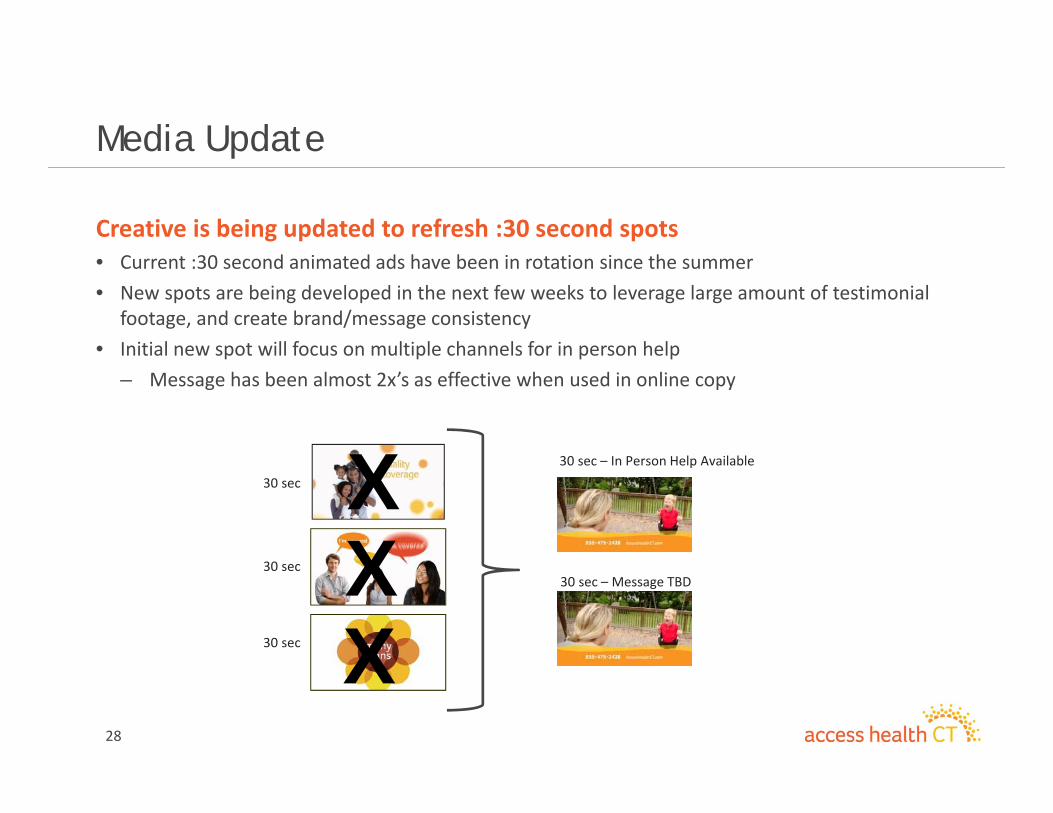
Creative is being updated to refresh :30 second spots• Current :30 second animated ads have been in rotation since the summer• New spots are being developed in the next few weeks to leverage large amount of testimonial
footage, and create brand/message consistency• Initial new spot will focus on multiple channels for in person help
– Message has been almost 2x’s as effective when used in online copy
30 sec
30 sec
30 sec
30 sec – In Person Help Available
30 sec – Message TBD
XXX
29
Media Update
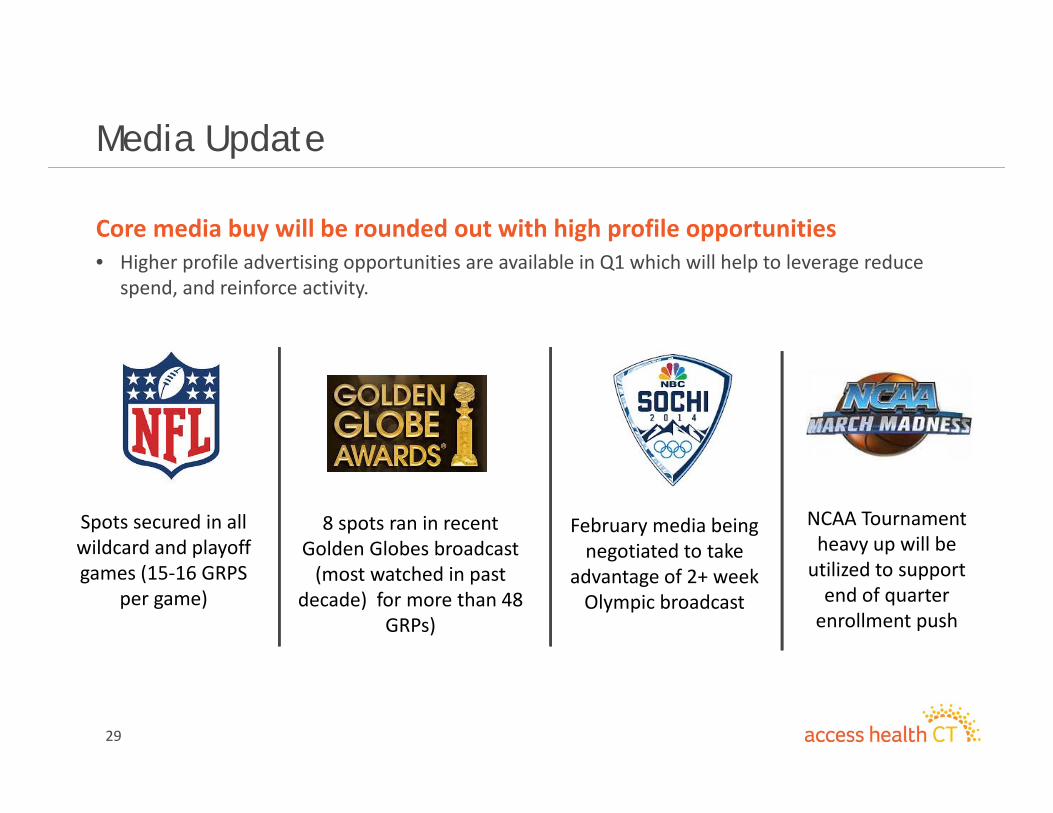
Core media buy will be rounded out with high profile opportunities• Higher profile advertising opportunities are available in Q1 which will help to leverage reduce
spend, and reinforce activity.
Spots secured in all wildcard and playoff games (15‐16 GRPS
per game)
8 spots ran in recent Golden Globes broadcast (most watched in past
decade) for more than 48 GRPs)
February media being negotiated to take
advantage of 2+ week Olympic broadcast
NCAA Tournament heavy up will be utilized to support end of quarter enrollment push
30
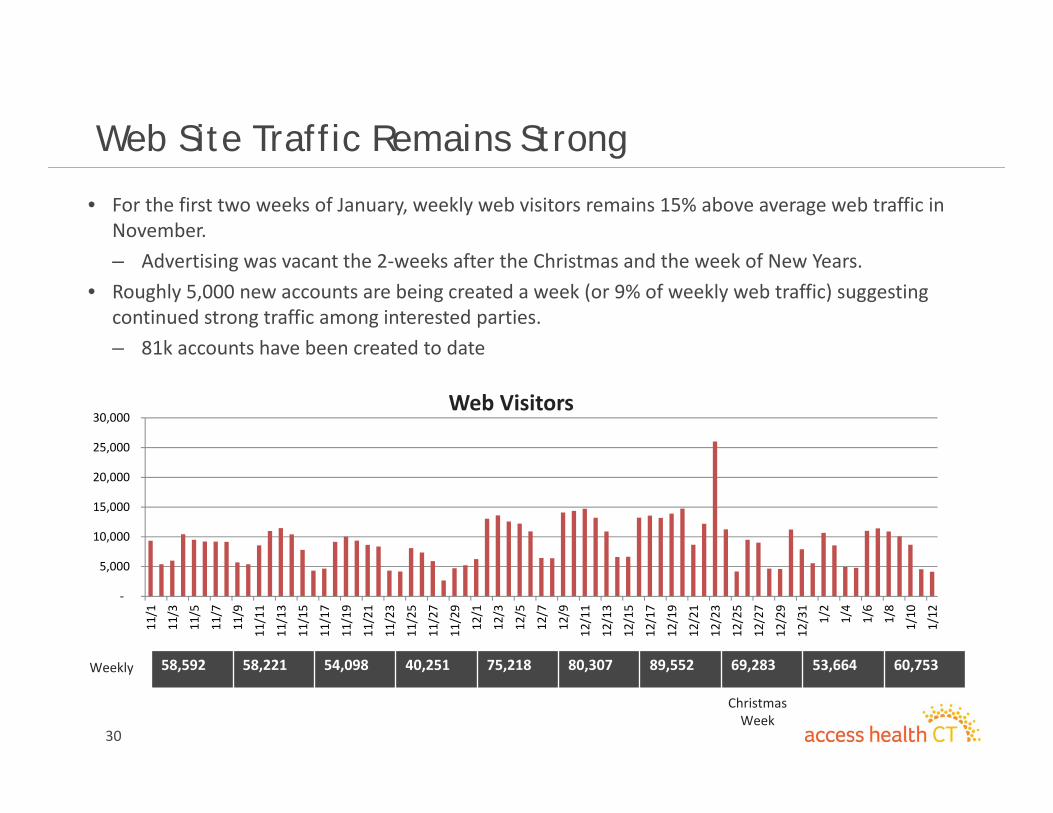
Web Site Traffic Remains Strong
• For the first two weeks of January, weekly web visitors remains 15% above average web traffic in November.– Advertising was vacant the 2‐weeks after the Christmas and the week of New Years.
• Roughly 5,000 new accounts are being created a week (or 9% of weekly web traffic) suggesting continued strong traffic among interested parties.– 81k accounts have been created to date
‐
5,000
10,000
15,000
20,000
25,000
30,000
11/1
11/3
11/5
11/7
11/9
11/11
11/13
11/15
11/17
11/19
11/21
11/23
11/25
11/27
11/29
12/1
12/3
12/5
12/7
12/9
12/11
12/13
12/15
12/17
12/19
12/21
12/23
12/25
12/27
12/29
12/31
1/2
1/4
1/6
1/8
1/10
1/12
58,592 58,221 54,098 40,251 75,218 80,307 89,552 69,283 53,664 60,753Weekly
ChristmasWeek
Web Visitors
31
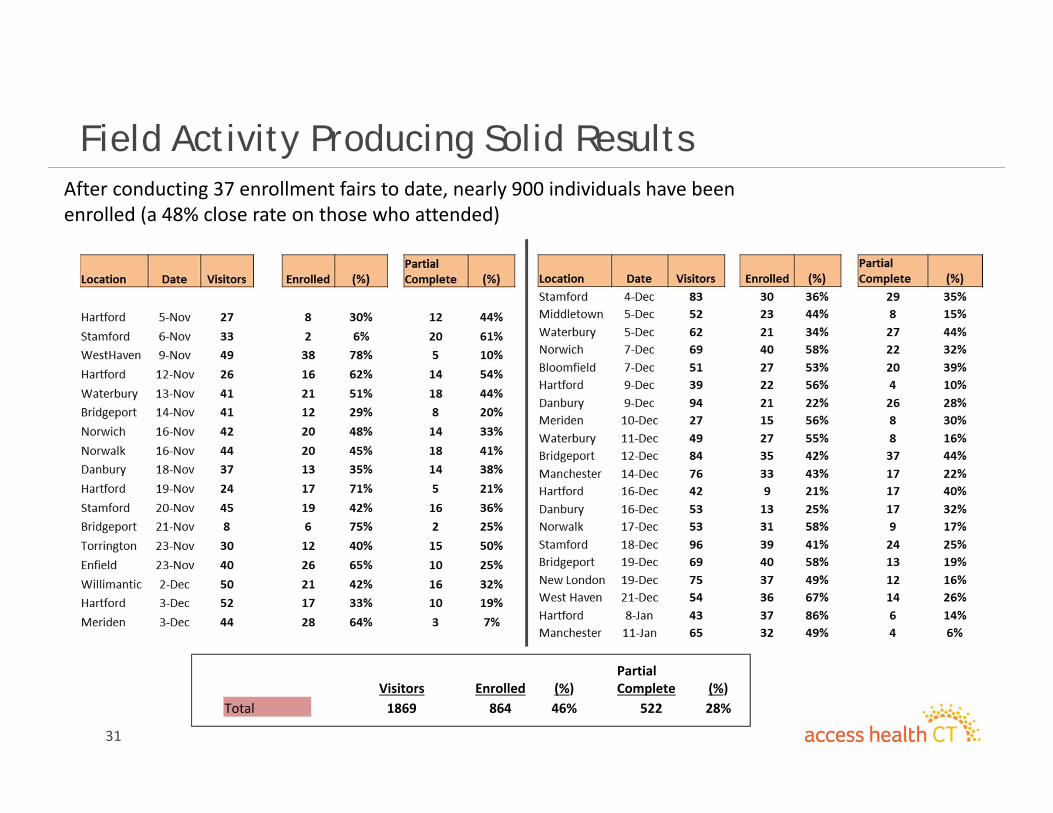
Field Activity Producing Solid ResultsAfter conducting 37 enrollment fairs to date, nearly 900 individuals have been enrolled (a 48% close rate on those who attended)
Visitors Enrolled (%)Partial Complete (%)
Total 1869 864 46% 522 28%
32
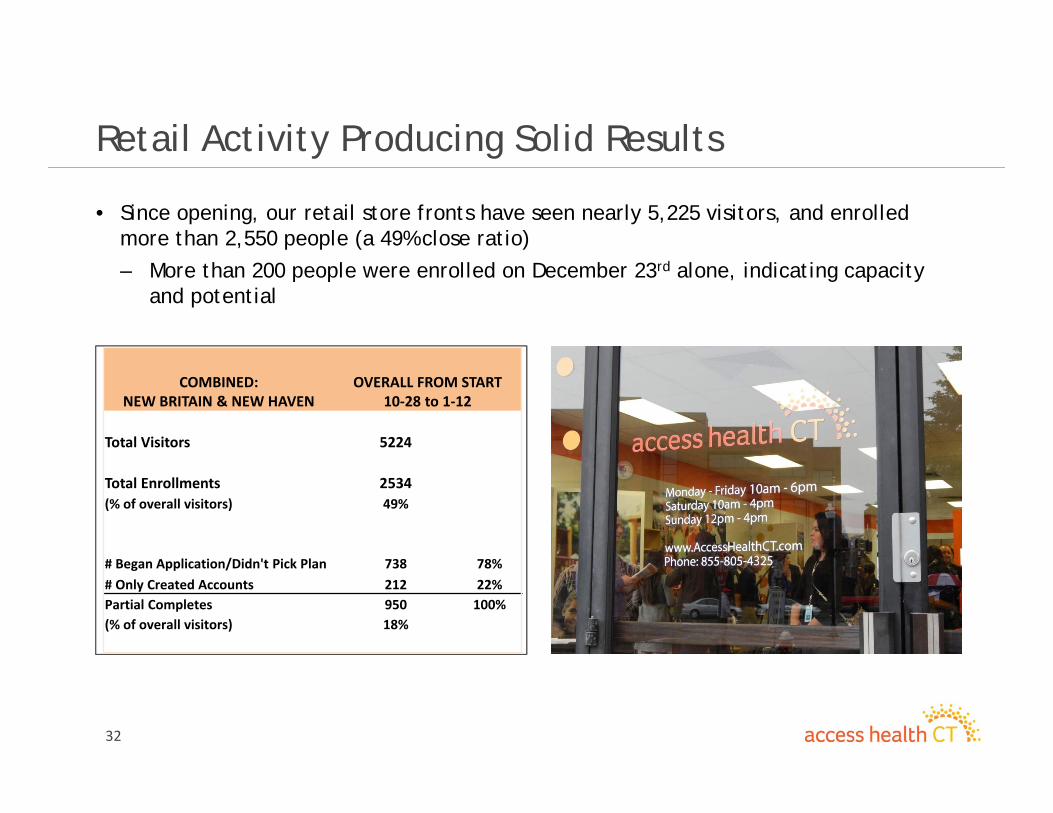
Retail Activity Producing Solid Results
• Since opening, our retail store fronts have seen nearly 5,225 visitors, and enrolled more than 2,550 people (a 49% close ratio)
– More than 200 people were enrolled on December 23rd alone, indicating capacity and potential
COMBINED: NEW BRITAIN & NEW HAVEN
OVERALL FROM START 10‐28 to 1‐12
Total Visitors 5224
Total Enrollments 2534(% of overall visitors) 49%
# Began Application/Didn't Pick Plan 738 78%# Only Created Accounts 212 22%Partial Completes 950 100%(% of overall visitors) 18%
33
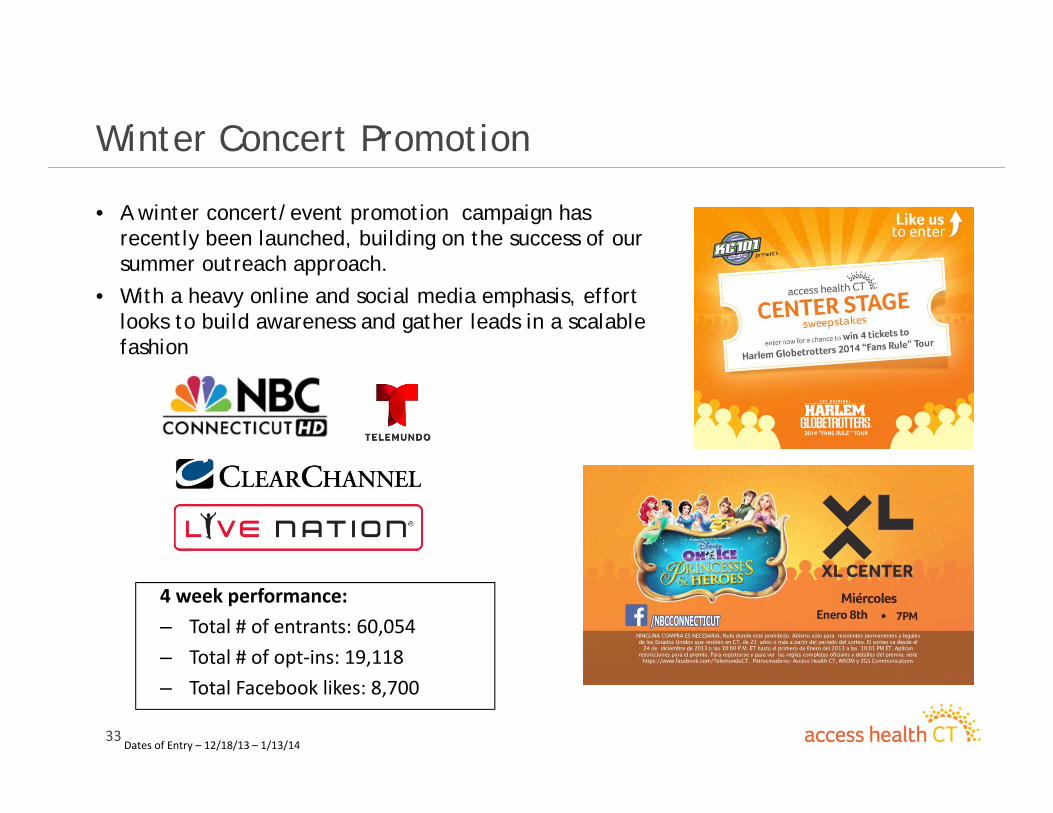
Winter Concert Promotion
4 week performance: – Total # of entrants: 60,054– Total # of opt‐ins: 19,118– Total Facebook likes: 8,700
Dates of Entry – 12/18/13 – 1/13/14
• A winter concert/event promotion campaign has recently been launched, building on the success of our summer outreach approach.
• With a heavy online and social media emphasis, effort looks to build awareness and gather leads in a scalable fashion
3434
Navigator and Assister Outreach Program
3535
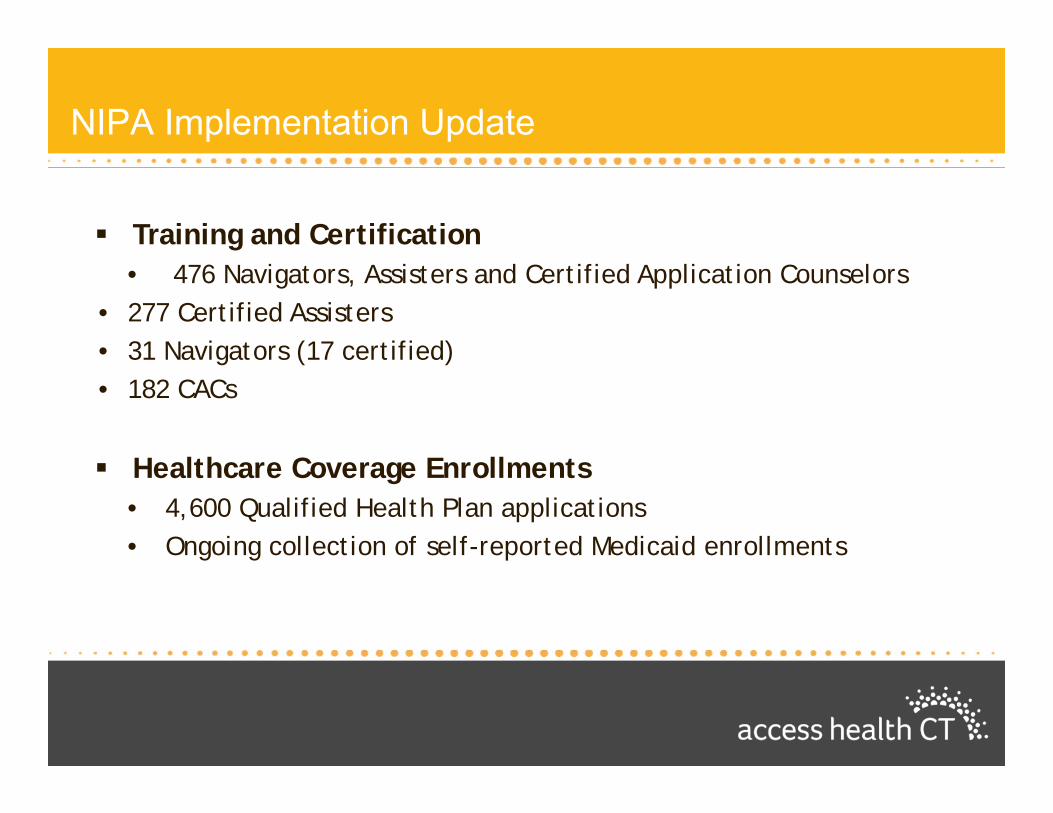
NIPA Implementation Update
35
Training and Certification• 476 Navigators, Assisters and Certified Application Counselors
• 277 Certified Assisters• 31 Navigators (17 certified)• 182 CACs
Healthcare Coverage Enrollments• 4,600 Qualified Health Plan applications • Ongoing collection of self-reported Medicaid enrollments
3636
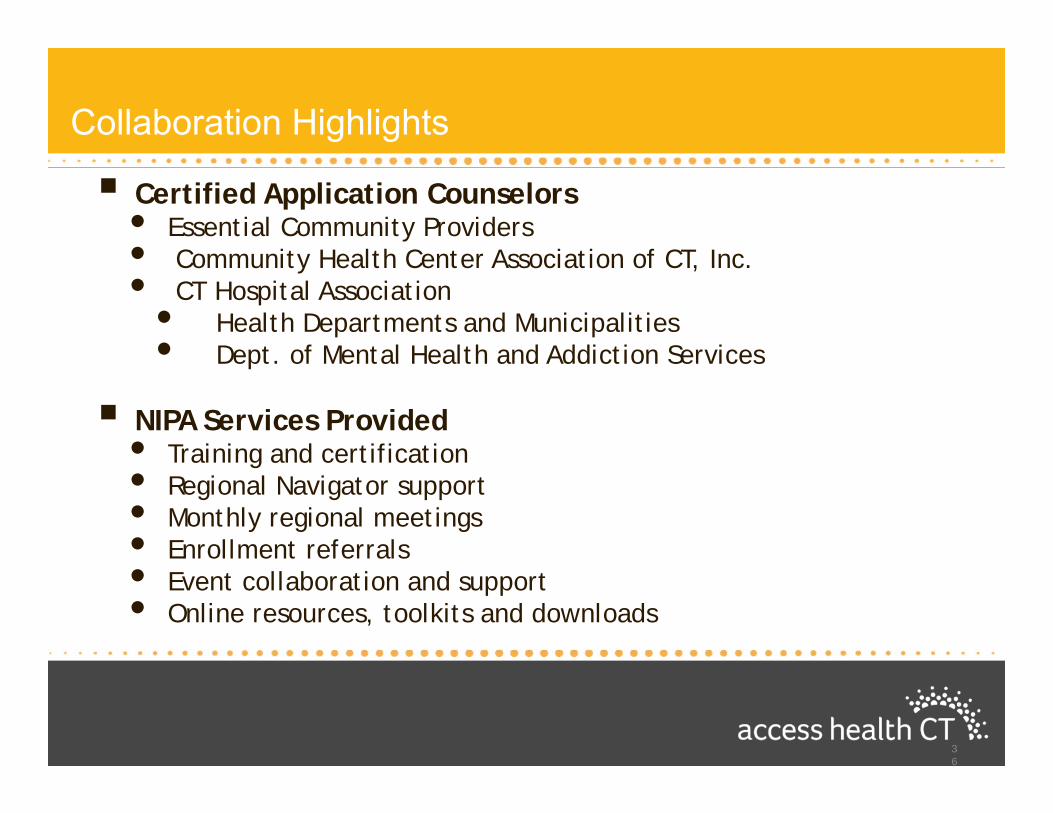
Collaboration Highlights
36
Certified Application Counselors • Essential Community Providers• Community Health Center Association of CT, Inc.• CT Hospital Association
• Health Departments and Municipalities• Dept. of Mental Health and Addiction Services
NIPA Services Provided• Training and certification• Regional Navigator support• Monthly regional meetings• Enrollment referrals• Event collaboration and support• Online resources, toolkits and downloads
3737
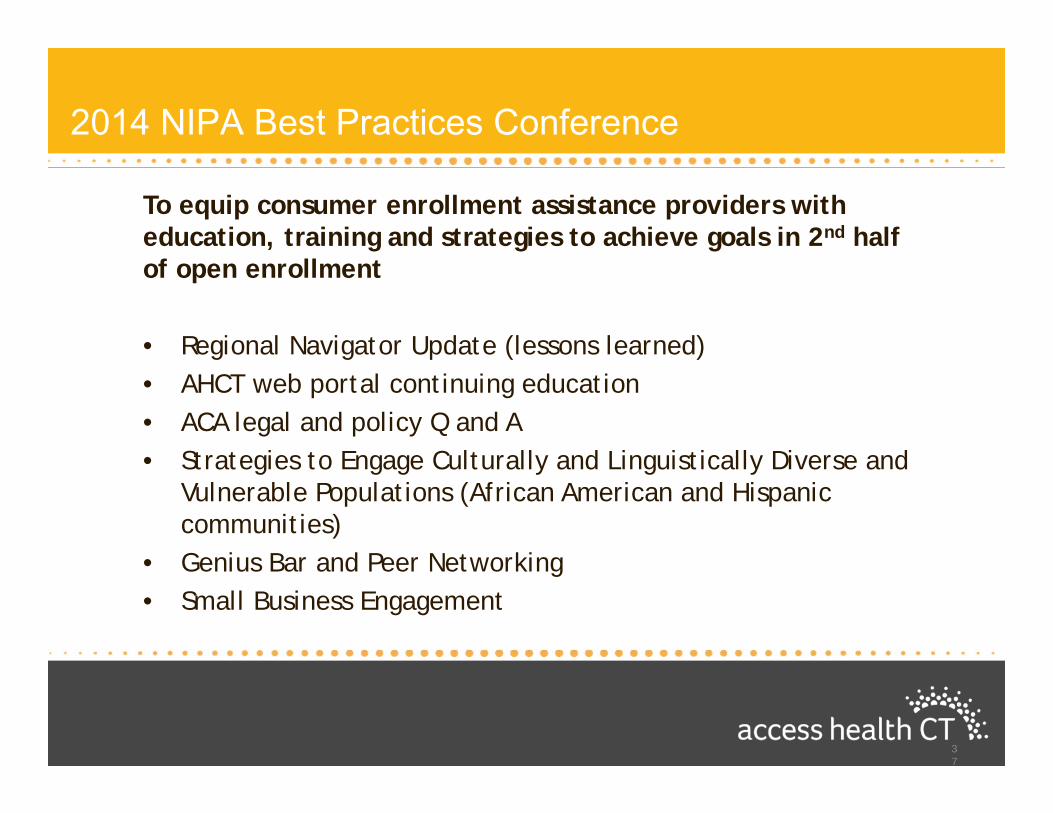
2014 NIPA Best Practices Conference
37
To equip consumer enrollment assistance providers with education, training and strategies to achieve goals in 2nd half of open enrollment
• Regional Navigator Update (lessons learned)• AHCT web portal continuing education• ACA legal and policy Q and A• Strategies to Engage Culturally and Linguistically Diverse and
Vulnerable Populations (African American and Hispanic communities)
• Genius Bar and Peer Networking• Small Business Engagement

3838
• Lt. Governor Nancy Wyman
• Christie Hager, HHS Region 1 Director
• Enroll America
• CT Health Foundation
• Community Health Center Association of CT, Inc.
• Small Business Majority
Conference Guests, Panelists and Supporters
38

39
2014 NIPA Conference Guests, Panelists and Participants
39
40
People are already benefitting from some very real changes.Thank You!
40
Denise Smith, CHW [email protected]: 860-757-5355 www.ahctcommunity.org
All Payer Claims Database Update
42
Presentation Agenda
• Overview of APCD – CEO/ED Update• Data Management Process – Developing RFP• Observations from the NAHDO Conference• Develop Data Use Cases• Annual Registration Process• Status of Subcommittees• Future Meetings
43
CEO / ED Update
CEO Update– We have articulated a well defined role of the Advisory Group– Two subcommittees were formed
• Data Privacy & Security• Policy & Procedure Enhancement
– Included 2 Advisory Group members in RFP Evaluation committee– RFP Evaluation Committee includes
• Select AHCT’s SLT (CEO, CFO, COO, CIO)• ED / Manager of Access Health Analytics (AHA ‐ new name for CT’s APCD)• 2 Advisory Group members (Dean Myshrall and Bob Tessier)
– Proceeding to obtain Trademark for AHA– Evaluated various vendors for consumer decision support tools/information
44
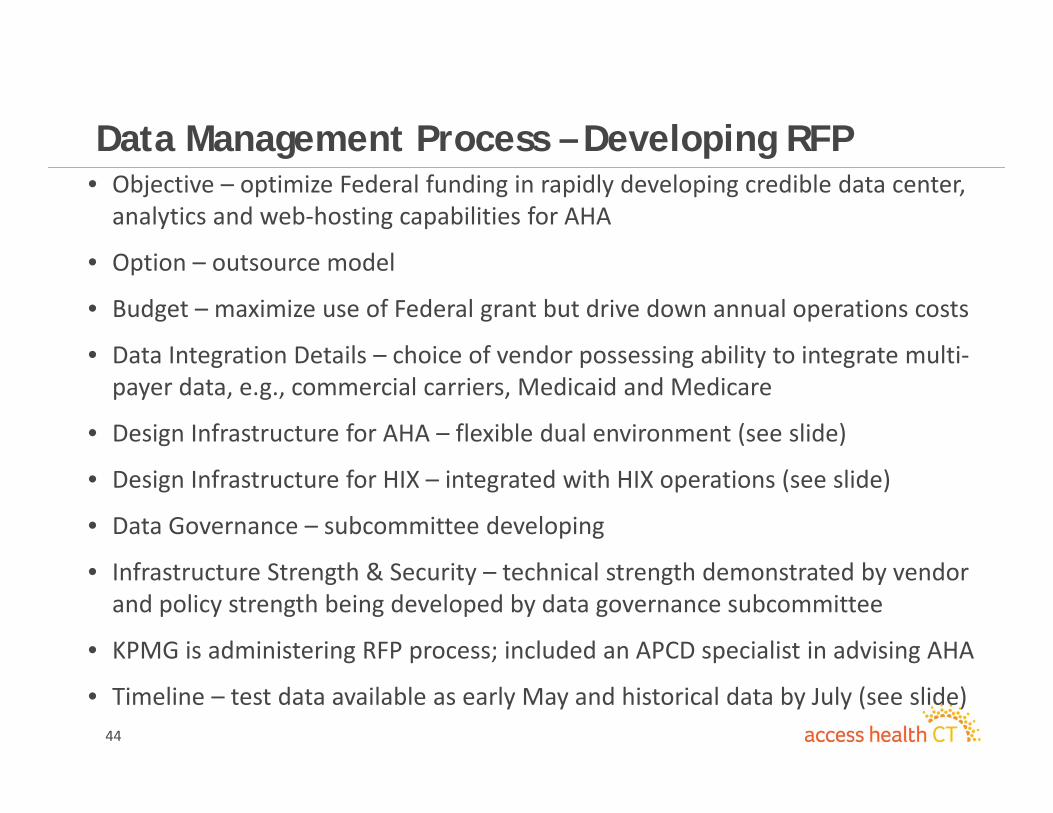
Data Management Process – Developing RFP• Objective – optimize Federal funding in rapidly developing credible data center, analytics and web‐hosting capabilities for AHA
• Option – outsource model
• Budget – maximize use of Federal grant but drive down annual operations costs
• Data Integration Details – choice of vendor possessing ability to integrate multi‐payer data, e.g., commercial carriers, Medicaid and Medicare
• Design Infrastructure for AHA – flexible dual environment (see slide)
• Design Infrastructure for HIX – integrated with HIX operations (see slide)
• Data Governance – subcommittee developing
• Infrastructure Strength & Security – technical strength demonstrated by vendor and policy strength being developed by data governance subcommittee
• KPMG is administering RFP process; included an APCD specialist in advising AHA
• Timeline – test data available as early May and historical data by July (see slide)
45
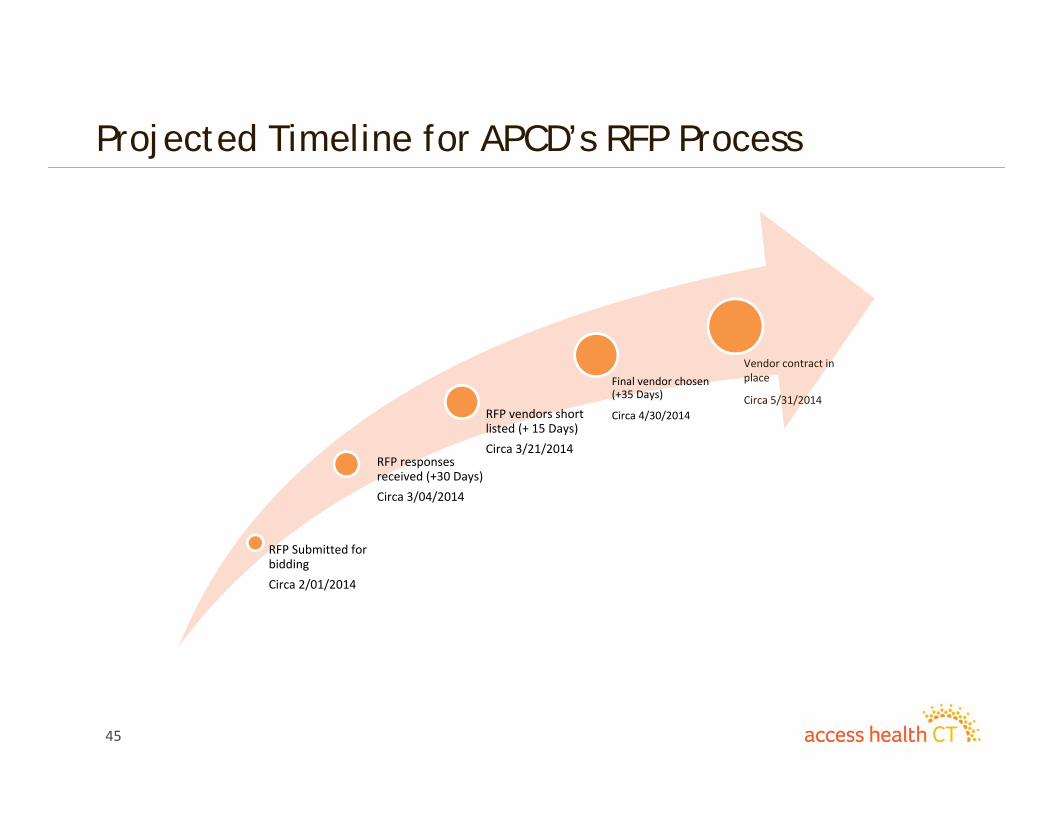
Projected Timeline for APCD’s RFP Process
Data Submission Timeline
RFP Submitted for biddingCirca 2/01/2014
RFP responses received (+30 Days)Circa 3/04/2014
RFP vendors short listed (+ 15 Days)Circa 3/21/2014
Final vendor chosen (+35 Days)
Circa 4/30/2014
Vendor contract in place
Circa 5/31/2014
46
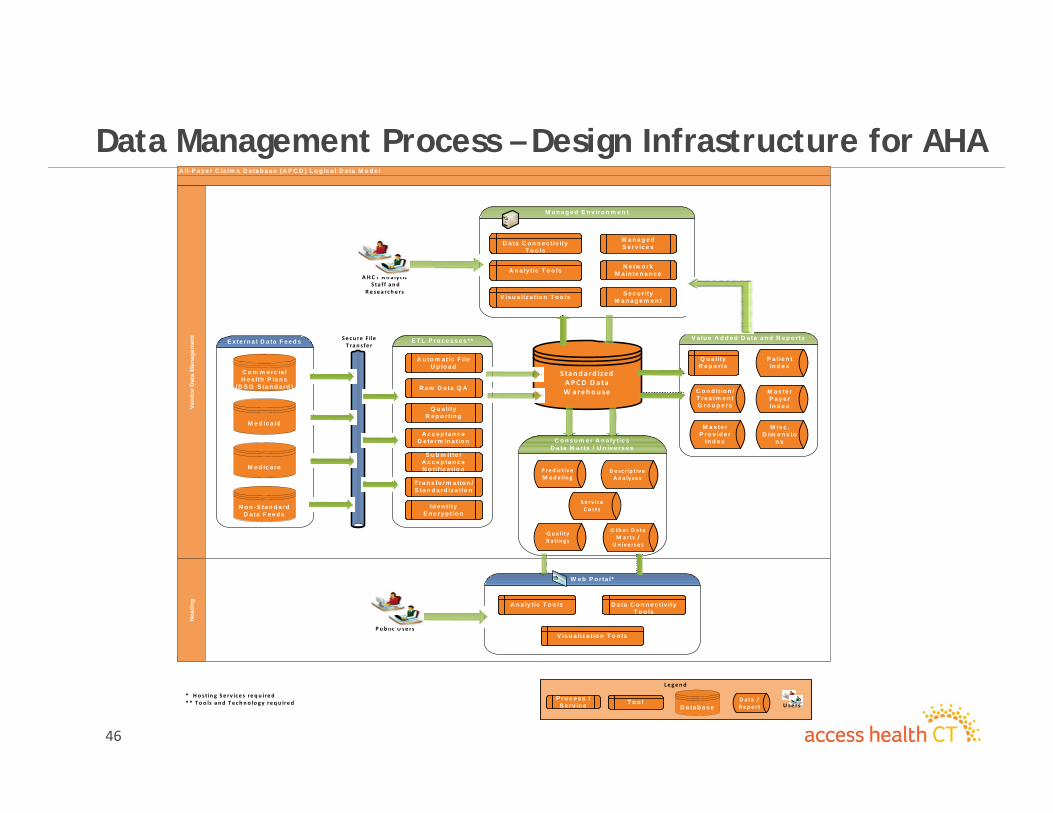
Data Management Process – Design Infrastructure for AHAA ll-P a y e r C la im s D a ta b a s e (A P C D ) L o g ic a l D a ta M o d e l
Hos
ting
Vend
or D
ata
Man
agem
ent
E x te rn a l D a ta F e e d s E T L P ro c e s s e s **Se cu re F ile T ran s fe r
A u to m a tic F ile U p lo a d
R a w D a ta Q A
Q u a lity R e p o rtin g
A c c e p ta n c e D e te rm in a tio n
S u b m itte r A c c e p ta n c e N o tif ic a tio n
T ra n s fo rm a tio n /S ta n d a rd iz a tio n
Id e n tity E n c ry p tio n
S ta n d a rd ized A PCD D a ta W arehou se
O th e r D a ta M arts /
U n ive rse s
Q ua lity R a tin g s
P red ic t iv e M ode lin g
D e sc r ip t iv e A n a ly se s
C o m m e rc ia l H e a lth P la n s
(D S G S ta n d a rd )
V a lu e A d d e d D a ta a n d R e p o rts
M e d ic a id
M e d ic a re
N o n -S ta n d a rd D a ta F e e d s
C o n s u m e r A n a ly tic s D a ta M a rts / U n iv e rs e s
W e b P o r ta l*
S e c u r ity M a n a g e m e n t
M a n a g e d E n v iro n m e n t
M a n a g e d S e rv ic e s
N e tw o rk M a in te n a n c e
P u b lic U se rs
A H C T A n a ly t icS ta f f an d
R e sea rch e rs
A n a ly tic T o o ls
C o n d it io n /T re a tm e n t G ro u p e rs
M a s te r P ro v id e r
In d e x
M a s te r P a y e r In d e x
M is c . D im e n s io
n s
P a tie n t In d e x
V is u a liz a tio n T o o ls
D a ta C o n n e c tiv ity T o o ls
D a ta C o n n e c tiv ity T o o ls
A n a ly tic T o o ls
V is u a liz a tio n T o o ls
Le gen d
P ro c e s s / S e rv ic e D a ta b a s e
D a ta / R ep o rt
T o o l U se rs
* H o st in g Se rv ice s req u ired* * Too ls and Te ch n o lo gy requ ired
Se rv ice Co sts
Q u a lity R e p o rts
47
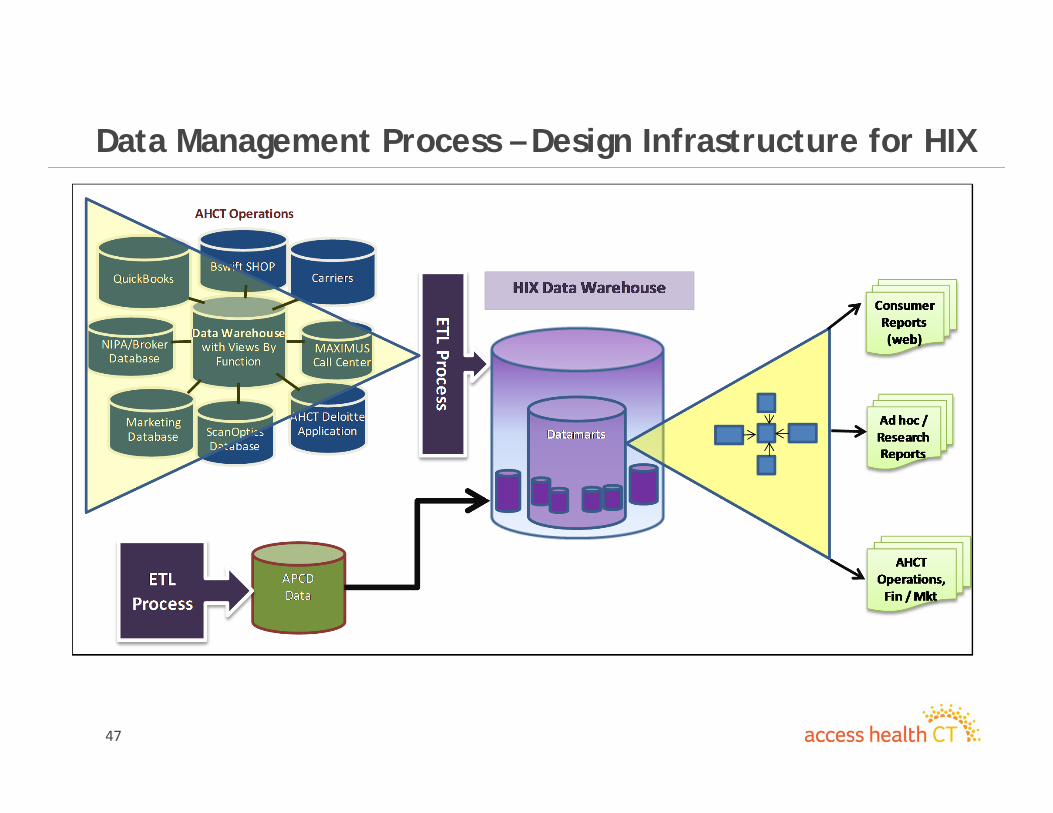
Data Management Process – Design Infrastructure for HIX
48
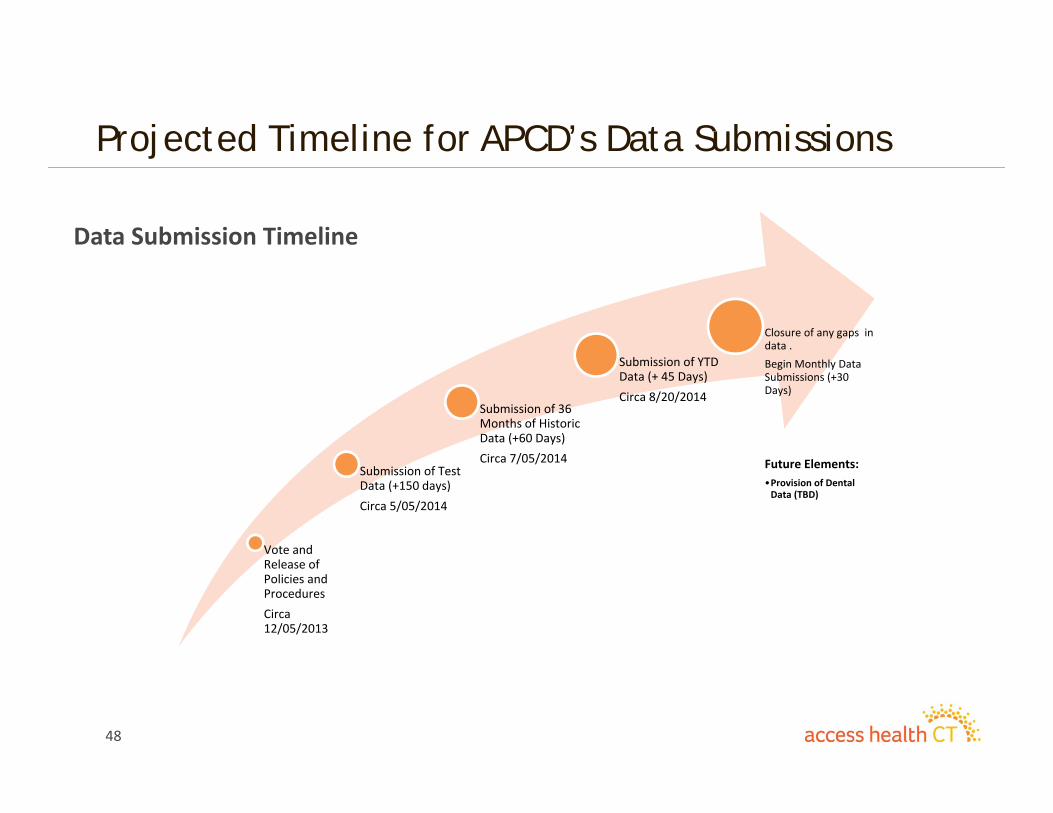
Projected Timeline for APCD’s Data Submissions
Data Submission Timeline
Vote and Release of Policies and ProceduresCirca 12/05/2013
Submission of Test Data (+150 days)Circa 5/05/2014
Submission of 36 Months of Historic Data (+60 Days)Circa 7/05/2014
Submission of YTD Data (+ 45 Days)Circa 8/20/2014
Closure of any gaps in data . Begin Monthly Data Submissions (+30 Days)
Future Elements:•Provision of Dental Data (TBD)
49
APCD Landscape -National Association of Health Data Organizations (NAHDO) 28th Annual Conference
APCD interest and implementations expanding across the nation. • 10 existing APCDs • Approx. 6 in implementation (including CT)• Over 20 with strong interest in establishing an APCD
Major Challenges
• Data management implementations can be challenging• States shifting focus to cost transparency, decision support, and public facing reporting tools
• Levels and degrees of data accessibility vary across states• Creation of a master provider index is one of the biggest challenges in the creation of a useful APCD

50
Develop Data Use Cases - Stakeholders

51
Develop Data Use Cases – Consumer AdvocateTypes Measures Categories Data Challenges
Variations in Care Variations in Costs
Prevalence Costs / Utilization
Episodes of care Risks Clinical quality Access to care Under delivery of care
Barriers to care Safety Complications
Costs Quality Sanctions Safety/Risks
Conditions Types of services Payer Race Regions Urban vs. Rural Hospitals Physicians Facilities
Conditions Types of services Payer Facilities Physicians Regions/Locations
APCD Hospital’s administrative data
ED Others APCD Hospital’s administrative data
ED Others
Developing Master Physician Index
Attributing services to physicians
Determining location of services
Episode of Care Episode completeness
Claims leakage Establishing equivalence Same as above
52
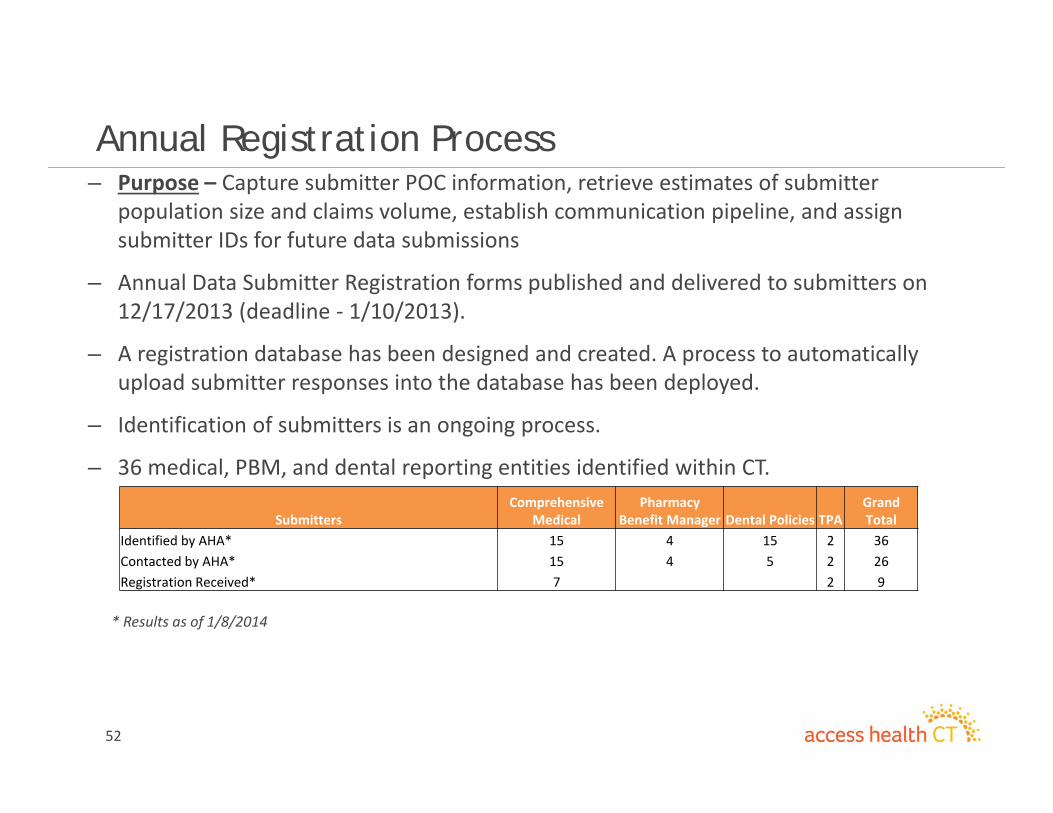
Annual Registration Process– Purpose – Capture submitter POC information, retrieve estimates of submitter
population size and claims volume, establish communication pipeline, and assign submitter IDs for future data submissions
– Annual Data Submitter Registration forms published and delivered to submitters on 12/17/2013 (deadline ‐ 1/10/2013).
– A registration database has been designed and created. A process to automatically upload submitter responses into the database has been deployed.
– Identification of submitters is an ongoing process.
– 36 medical, PBM, and dental reporting entities identified within CT.
* Results as of 1/8/2014
SubmittersComprehensive
MedicalPharmacy
Benefit Manager Dental Policies TPAGrand Total
Identified by AHA* 15 4 15 2 36Contacted by AHA* 15 4 5 2 26Registration Received* 7 2 9
January 2014Finance Update
54
Finance Update
• Finance focus continues on tasks needed to effectively meet the commitments required by the transition to a “Going Concern.”
• As part of securing financial resources, the market based assessment notices are complete and are being readied for distribution.
• Business process will be enhanced as an end user analytical and reporting tool vendor was selected whose product includes a new general ledger and a customer relationship management (CRM) application.
• Regulatory requirements continue to be met:o New monthly CMS/CCIIO Budget Reporting requirements were
implemented with the first report filed in December.o The Board approved AHCT Fiscal Year 2013 Annual Report was submitted
to the Governor and the Auditors of Public Accounts.o Finance is coordinating the activities for the Eligibility audit begun January
6th by The HHS Office of Inspector General. • The December 2013 dashboard follows, which displays year to date results through the 2nd Quarter of 2014.

December 2013 Finance Dashboard
Q2 - 2014
55
56
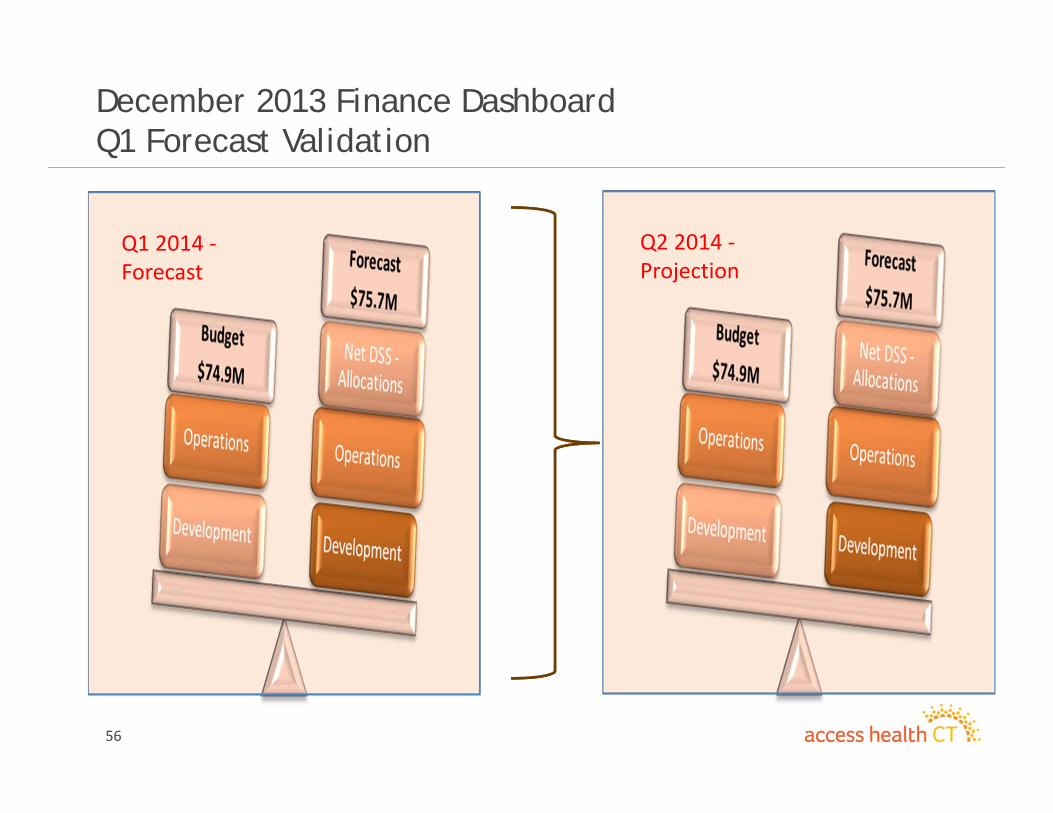
December 2013 Finance DashboardQ1 Forecast Validation
Q1 2014 ‐Forecast
Q2 2014 ‐Projection
57
December 2013 Finance DashboardOverview
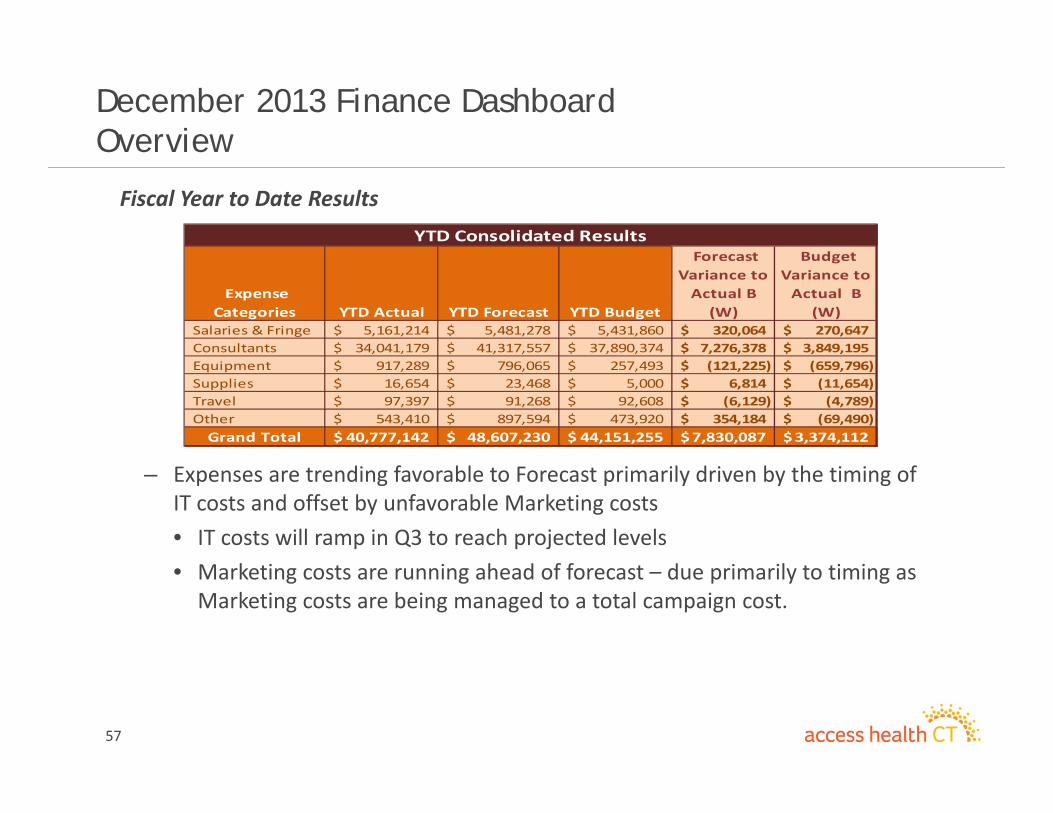
Fiscal Year to Date Results
– Expenses are trending favorable to Forecast primarily driven by the timing of IT costs and offset by unfavorable Marketing costs• IT costs will ramp in Q3 to reach projected levels• Marketing costs are running ahead of forecast – due primarily to timing as Marketing costs are being managed to a total campaign cost.
Expense Categories YTD Actual YTD Forecast YTD Budget
Forecast Variance to Actual B (W)
Budget Variance to Actual B
(W) Salaries & Fringe 5,161,214$ 5,481,278$ 5,431,860$ 320,064$ 270,647$ Consultants 34,041,179$ 41,317,557$ 37,890,374$ 7,276,378$ 3,849,195$ Equipment 917,289$ 796,065$ 257,493$ (121,225)$ (659,796)$ Supplies 16,654$ 23,468$ 5,000$ 6,814$ (11,654)$ Travel 97,397$ 91,268$ 92,608$ (6,129)$ (4,789)$ Other 543,410$ 897,594$ 473,920$ 354,184$ (69,490)$ Grand Total 40,777,142$ 48,607,230$ 44,151,255$ 7,830,087$ 3,374,112$
YTD Consolidated Results
58
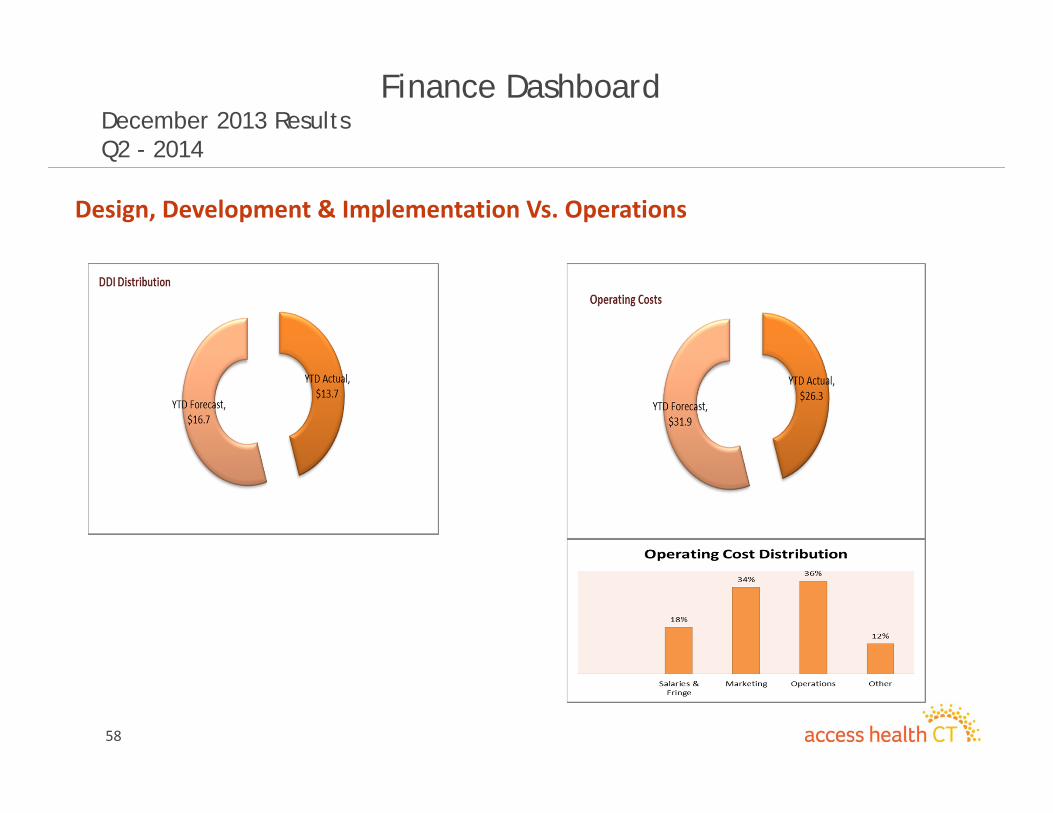
Finance Dashboard December 2013 ResultsQ2 - 2014
Design, Development & Implementation Vs. Operations
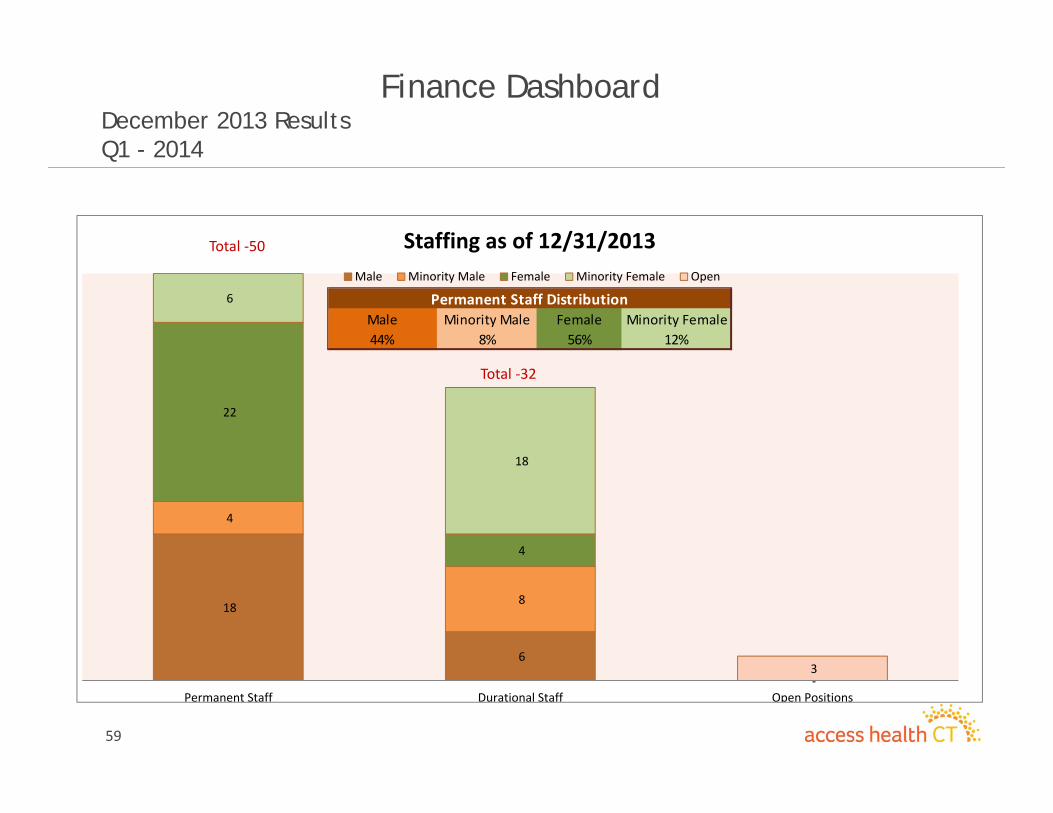
59
Finance Dashboard December 2013 ResultsQ1 - 2014
18
6
‐
4
8
22
4
6
18
3
Permanent Staff Durational Staff Open Positions
Staffing as of 12/31/2013Male Minority Male Female Minority Female Open
Total ‐32
Male Minority Male Female Minority Female44% 8% 56% 12%
Permanent Staff Distribution
Total ‐50
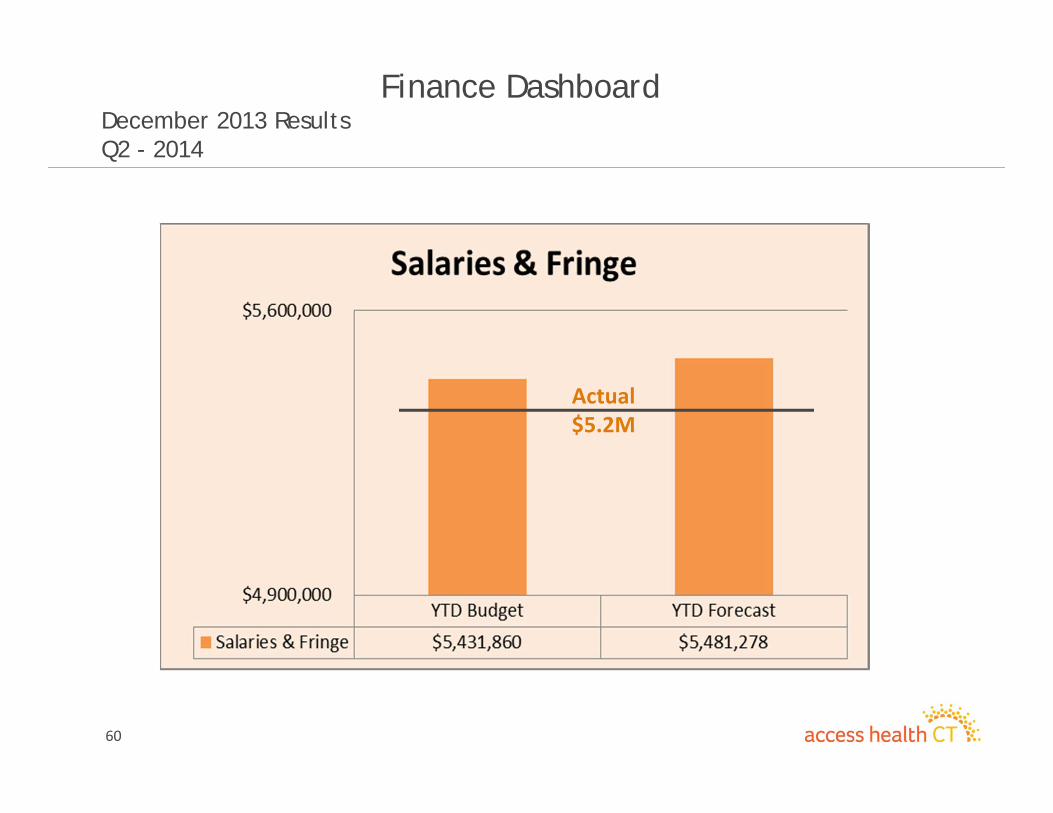
60
Finance Dashboard December 2013 ResultsQ2 - 2014
Actual $5.2M
Strategy Committee Update
Robert Scalettar, MDJanuary 16, 2014
62
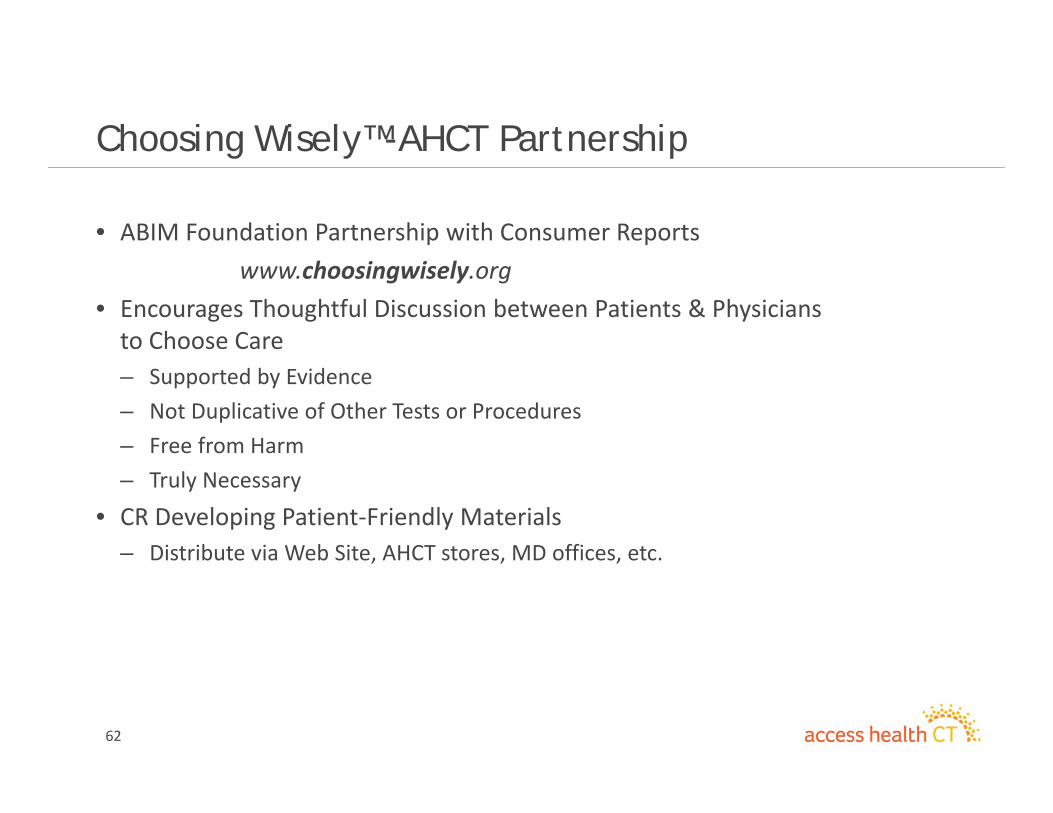
Choosing Wisely™-AHCT Partnership
• ABIM Foundation Partnership with Consumer Reportswww.choosingwisely.org
• Encourages Thoughtful Discussion between Patients & Physicians to Choose Care– Supported by Evidence– Not Duplicative of Other Tests or Procedures– Free from Harm– Truly Necessary
• CR Developing Patient‐Friendly Materials– Distribute via Web Site, AHCT stores, MD offices, etc.
63
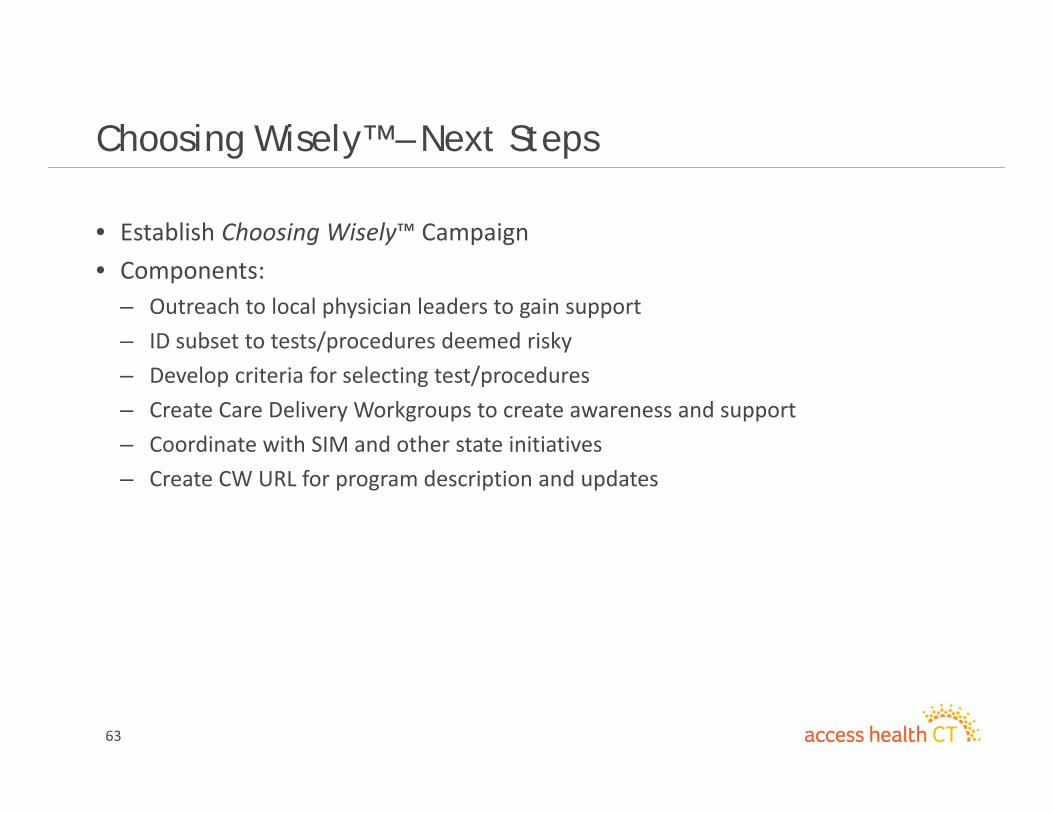
Choosing Wisely™ – Next Steps
• Establish Choosing Wisely™ Campaign• Components:
– Outreach to local physician leaders to gain support– ID subset to tests/procedures deemed risky– Develop criteria for selecting test/procedures– Create Care Delivery Workgroups to create awareness and support– Coordinate with SIM and other state initiatives– Create CW URL for program description and updates
Adjournment
Recommended