
1 1 .3 :D ayton & Montgomery Coi
Public Library
J U L l 51969
Document collection
MDUSTRY WA6E SURVEYWork Clothing
FEBRUARY 1968
Bulletin No. 1 6 2 4
UNITED STATES DEPARTMENT OF LABOR
B U R E A U O F LA B O R STATISTICS
Digitized for FRASER http://fraser.stlouisfed.org/ Federal Reserve Bank of St. Louis

Digitized for FRASER http://fraser.stlouisfed.org/ Federal Reserve Bank of St. Louis

INDUSTRY WAGE SURVEY
Work Clothing
February 1968
Bulletin No. 1 6 2 4
June 1969
UNITED STATES DEPARTMENT OF LABOR George P. Shultz, Secretary
BUREAU OF LABOR STATISTICS Geoffrey H. Moore, Commissioner
For sole by the Superintendent of Documents, U.S. Government Printing Office, Washington, D.C., 20402 - Price 50 cent*
Digitized for FRASER http://fraser.stlouisfed.org/ Federal Reserve Bank of St. Louis

Digitized for FRASER http://fraser.stlouisfed.org/ Federal Reserve Bank of St. Louis

Preface
T h is bu lletin su m m a rize s the re su lts o f a B ureau o f L a b or S ta tis tics su rvey o f w ages and su pp lem en tary w age p r a c t ic e s fo r the w ork cloth in g m an u factu rin g in du stry in F e b ru a ry 1968.
S eparate r e le a s e s fo r the fo llow in g States w e re issu ed e a r l ie r : A la b a m a , C a lifo rn ia , G e o rg ia , Indiana, K entucky, M is s is s ip p i , M is s o u r i , N orth C a r o l i n a , P en n sy lvan ia , T e n n e sse e , T e x a s , and V irg in ia . C op ies o f th ese r e le a s e s a re a va ila b le fr o m the B ureau o f L a b or S ta tis t ic s , W ash in g ton , D. C . , 20212, o r fr o m any o f its re g io n a l o f f ic e s .
The study w as con ducted in the B u rea u 's O ffice o f W ages and In du stria l R e la tion s . The a n a ly s is in th is b u lletin w as p re p a re d by F re d R . Nagy in the D iv is ion o f O ccu pationa l W age S tru ctu res . F ie ld w ork fo r the su rvey w as d ire c te d by the B u rea u 's A ss is ta n t R eg ion a l D ir e c to r s fo r O p era tion s .
O ther r e p o r ts '■available fr o m the B u re a u 's p ro g ra m o f in du stry w age s tu d ies , as w e ll as the a d d r e s s e s o f the B u rea u 's eight re g io n a l o f f ic e s , a re lis te d at the end o f th is b u lle tin .
Digitized for FRASER http://fraser.stlouisfed.org/ Federal Reserve Bank of St. Louis

Contents
P a g e
S u m m a ry ----- -----------------------------------------------------------------------------------------In d u stry c h a r a c te r is t ic s -------------------------------------------------------------------
L o c a t io n ------------------------------------------------------------------------------------------E sta b lish m en t s i z e ----------------------------------------------------------------------M eth ods o f p r o d u c t io n ----- -----------------------------------------------------------U n io n iz a t io n -----------------------------------------------------------------------------------Sex and o c c u p a t io n ----------------------------------------------------------------------M ethod o f w age p a y m e n t ----------------------------------------------------------
A v e r a g e h o u r ly ea rn in gs —--------------------------------------------------------------O ccu p a tion a l e a r n in g s ----------------------------------------------------------------------E sta b lish m en t p r a c t ic e s and su p p lem en ta ry w age p r o v is io n s
S ch edu led w eek ly h ou rs and sh ift p r a c t i c e s —-----------------------P a id h o l i d a y s --------------------------------------------------------------------------------P a id v a c a t io n s ---------------------------------------------------- -----------—------------H ealth , in su ra n ce , and p e n s io n p l a n s -----------— --------------------O ther s e le c te d b e n e f i t s ------------------------------—---------------- ------------
112223333456 6 6 6 6 7
T a b le s :1. A v e r a g e h o u r ly e a rn in g s : B y s e le c te d c h a r a c t e r i s t i c s -------------------- ------ -— — — 82. A v e r a g e h o u r ly earn in gs and em p loym en t c h a r a c te r is t ic s : S e le c te d S ta te s -------------— 8
E arn ings d is tr ib u tion :3. A ll e s ta b lish m e n ts ----------------------------------------------------------------------------------------------------------------- 94. B y m a jo r p r o d u c t - ------------------------------------------------------------------------------------------- ----------------------10
O ccu p a tion a l a v e r a g e s :5. A ll e s t a b l is h m e n t s ---------------------------------- —-------------------------------------- -----——------------------------- 116. B y la b o r -m a n a g e m e n t co n tra c t c o v e r a g e and com m u n ity s iz e — — -------------------127. B y la b o r -m a n a g e m e n t co n tra c t c o v e r a g e and e s ta b lish m en t s iz e —------------------------ 148. B y m a jo r p r o d u c t ----------------------------------------------------------------------——-------- -----—----------------------16
O ccu p a tion a l ea rn in g s :9. A la b a m a --------- ----------- ---------------------------- --------------------------------------------—---------------------------------17
10. C a l i f o r n ia ------------------------------------------------------------------------------------------------------------:-------------------- 1811. G e o r g ia ------------------------------------------------------------------------------------------------------------------------------------- 1912. In d ia n a -------------------------------------------------------------------------------------------------------------------------------------- 2113. K en tu cky----------------------------------------------------------------------------------------------------------------------------------- 2214. M is s i s s ip p i— -------------------------------------------------------------------------------------------------------------------------- 2315. M is s o u r i ----------------------------------------------------------------------------------------------------------------------------------- 2516. N orth C a r o l in a ----------------------------------------------------------------------------------------------------------------------- 2617. P e n n s y lv a n ia ---------------—----------------------------------------- — —----------———---------------------------------- 2718. T e n n e s s e e --------------------------------------------------------------------------------------------------------------------------------- 2819. T e x a s --------------------------------------------------------------------------------------------------------------------------------------- 3020. V i r g in ia ----------------------------------------------------------------------------------------------------------------------------------- 32
E sta b lish m en t p r a c t ic e s and su p p lem en ta ry w age p r o v is io n s :21. M ethod o f w age p a y m e n t ------------------------------------------------------------------------------------------------------ 3322. S ch edu led w eek ly h o u r s -------------------------------------------------------------------------------------------------------- 3323. P a id h o lid a y s --------------------------------------------------------------------------------- — ------------------------------------- 3424. P a id v a c a t io n s --------------------------------------------------------------------------------- —------— ------------------------- 3525. H ealth , in su ra n ce , and re t ir e m e n t p l a n s ---------------------------------- —------------- — ------------- 36
A p p en d ix es :A . S cop e and m ethod o f s u r v e y --------------------------------------------------------------------------------------------------- 39B . O ccu p a tion a l d e s c r ip t i o n s ----------------------- - ---------------------------------------------------------------------- 43
iv
Digitized for FRASER http://fraser.stlouisfed.org/ Federal Reserve Bank of St. Louis

Industry Wage Survey—
W ork Clothing, 1968
Summary
Straight-time earnings of production and related workers in the work clothing manufacturing industry averaged $1.84 an hour in February 1968. Women, accounting for seven-eighths of the 62,775 workers covered by the Bureau’ s survey1 and largely employed as sewing-machine operators, averaged $1.81 an hour compared with $2.03 for men. About one- third of the workers had earnings at or slightly above the $1.60 an hour Federal minimum wage for manufacturing establishments. Earnings of the remaining workers were more widely dispersed, ranging up to $3 an hour.
Regionally, average hourly earnings of production workers ranged from $1.81 in the Southwest to $1.94 in the Middle Atlantic and Pacific. Workers in the Southeast region, slightly more than one-third of the industry’ s employment, averaged $1.84. Earnings levels also varied by size of community, size of establishment, labor-management contract status, major product branch, and occupation.
Among the occupations studied separately, nationwide averages ranged from $1.68 for janitors to $2.57 an hour for sewing-machine repairmen, two jobs largely staffed by men. Sewing-machine operators, virtually all women and making up seven-tenths of the industry’ s work force, averaged $1.82 an hour. Their earnings levels varied by type of garment sewn.
Paid holidays, most commonly 6 or 7 days annually, and paid vacations were provided by establishments employing more than nine-tenths of the production workers. Typically, production workers
1 See appendix A for scope and method of survey. Wage data contained in this bulletin exclude premium pay for overtime and for work on weekends, holidays, and late shifts.
2 See Industry Wage Survey: Work Clothing. May-June 1964 (BLS Bulletin 1440, 1965).
3 See Industry Wage Survey: Work Clothing. May-June 1961 (BLS Bulletin 1321, 1962).
received 1 week of vacation pay after 1 year of service and at least 2 weeks after 5 years; provisions for 3 weeks after 15 years of service were reported by establishments employing one-fourth of the workers. Life, hospitalization, and surgical insurance plans for which employers paid at least part of the cost also were available to a large majority of the workers in the industry. Three-tenths of the production workers were in plants providing retirement pension plans.
Industry Characteristics
Work c l o t h i n g manufacturing establishments covered by the Bureau’ s survey employed 62,775 production and related workers in February 1968— an increase of nearly 9 percent over the employment level recorded in May-June 1964, the date of a similar study. 2 During this period, changes in employment varied substantially among the regions studied separately: Increases of 37 percent in the Southwest and 35 percent in the Middle West; virtually no change in the Southeast, the largest region in terms of industry employment; and declines of between 3 and 6 percent in the other regions. As indicated in the tabulation below, the Southwest region accounted for most of the industry’ s employment growth since 1961. 3
AreaFebruary May-June May-June
1968 1964 1961
United States1 -------------------- 62,775 57,669 51,594
Middle Atlantic------------------ 2,078 2,185 2, 552Border States----------------------- 9,003 9, 626 7, 837Southeast---------------------------- 23,011 22,897 20,447Southwest---------------------------- 15,393 11,246 7,271Great Lakes----------------------- 3, 846 3,959 4,776Middle West----------------------- 6, 554 4, 844 5,432Pacific------------------------------- 2,225 2,322 2, 501
1 Includes data for regions in addition to those shown separately.
1
Digitized for FRASER http://fraser.stlouisfed.org/ Federal Reserve Bank of St. Louis
2
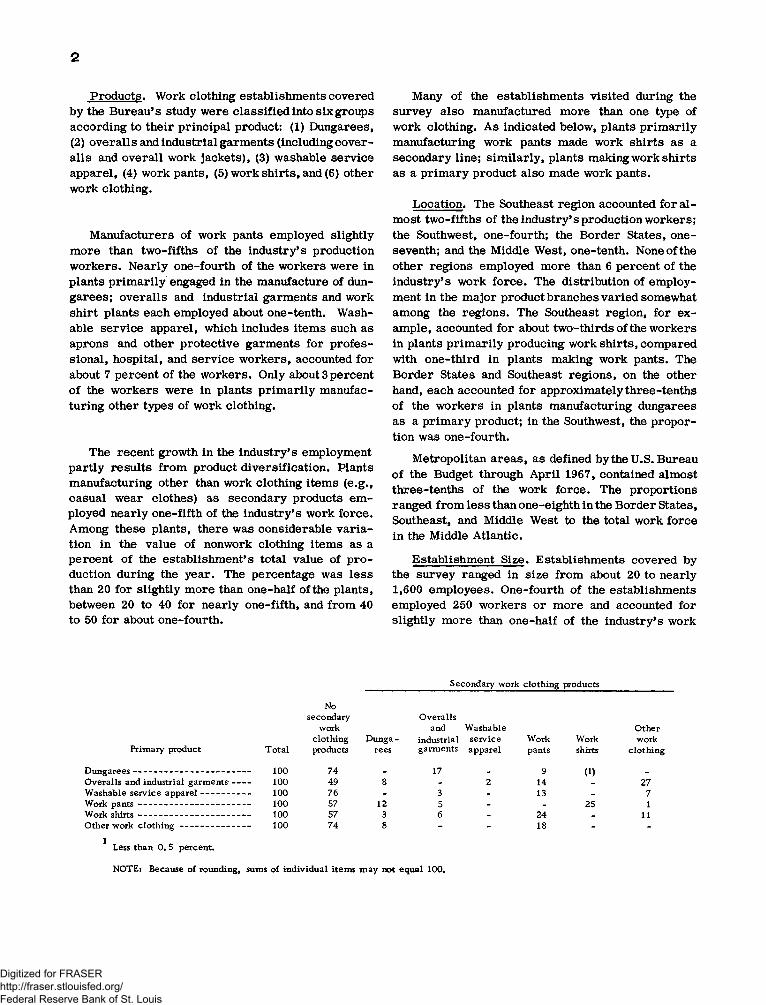
Products. Work clothing establishments covered by the Bureau’ s study were classified into six groups according to their principal product: (1) Dungarees, (2) overalls and industrial garments (including coveralls and overall work jackets), (3) washable service apparel, (4) work pants, (5) work shirts, and (6) other work clothing.
Manufacturers of work pants employed slightly more than two-fifths of the industry’ s production workers. Nearly one-fourth of the workers were in plants primarily engaged in the manufacture of dungarees; overalls and industrial garments and work shirt plants each employed about one-tenth. Washable service apparel, which includes items such as aprons and other protective garments for professional, hospital, and service workers, accounted for about 7 percent of the workers. Only about 3 percent of the workers were in plants primarily manufacturing other types of work clothing.
The recent growth in the industry’ s employment partly results from product diversification. Plants manufacturing other than work clothing items (e.g., casual wear clothes) as secondary products employed nearly one-fifth of the industry’ s work force. Among these plants, there was considerable variation in the value of nonwork clothing items as a percent of the establishment’ s total value of production during the year. The percentage was less than 20 for slightly more than one-half of the plants, between 20 to 40 for nearly one-fifth, and from 40 to 50 for about one-fourth.
Many of the establishments visited during the survey also manufactured more than one type of work clothing. As indicated below, plants primarily manufacturing work pants made work shirts as a secondary line; similarly, plants making work shirts as a primary product also made work pants.
Location. The Southeast region accounted for almost two-fifths of the industry’ s production workers; the Southwest, one-fourth; the Border States, one- seventh; and the Middle West, one-tenth. None of the other regions employed more than 6 percent of the industry’ s work force. The distribution of employment in the major product branches varied somewhat among the regions. The Southeast region, for example, accounted for about two-thirds of the workers in plants primarily producing work shirts, compared with one-third in plants making work pants. The Border States and Southeast regions, on the other hand, each accounted for approximately three-tenths of the workers in plants manufacturing dungarees as a primary product; in the Southwest, the proportion was one-fourth.
Metropolitan areas, as defined bytheU.S. Bureau of the Budget through April 1967, contained almost three-tenths of the work force. The proportions ranged from less than one-eighth in the Border States, Southeast, and Middle West to the total work force in the Middle Atlantic.
Establishment Size. Establishments covered by the survey ranged in size from about 20 to nearly 1,600 employees. One-fourth of the establishments employed 250 workers or more and accounted for slightly more than one-half of the industry’ s work
Secondary work clothing products
Primary product Total
Nosecondary
workclothingproducts
Dunga- rees
Overallsand
industrialgarments
Washableserviceapparel
Workpants
Workshirts
Otherwork
clothing
Dungarees-------------------------------------- 100 74 _ 17 _ 9 (1) _
Overalls and industrial garments------ 100 49 8 - 2 14 - 27Washable service apparel---------------- 100 76 - 3 - 13 - 7Work pants------------------------------------ 100 57 12 5 - - 25 1Work shirts------------------------------------ 100 57 3 6 - 24 - 11Other work clothing----------------------- 100 74 8 - - 18 - -
Less than 0. 5 percent.
NOTE: Because of rounding, sums of individual items may not equal 100.
Digitized for FRASER http://fraser.stlouisfed.org/ Federal Reserve Bank of St. Louis

3
force. Among the regions, establishments of this size employed the following approximate proportions: One-sixth of the workers in the Middle Atlantic, one - third in the Middle West, two-fifths in the Great Lakes, one-half in the Southeast, three-fifths in the Border States, two-thirds in the Southwest, and five- sixths in the Pacific.
Methods of Production. The progressive bundle system was the major method of production in establishments e m p l o y i n g three-fourths of the workers. The bundle system was used in establishments employing about one-sixth of the work force and the line system was used in plants accounting for less than 6 percent.4 Regionally, the progressive bundle system was the predominant method except in the Middle Atlantic, where the bundle system was more important.
Unionization. Establishments having collective bargaining agreements covering a majority of their production workers employed slightly less than one- half of the industry’ s work force. The proportions of workers in union establishments were about one- fourth in the Southeast, slightly more than two-fifths in the Border States and Southwest, two-thirds in the Great Lakes, seven-eighths in the Middle West, and more than nine-tenths in the Middle Atlantic and Pacific regions. The degree of unionization also varied among the States selected for separate study.
Labor-management contract coverage was higher in metropolitan areas than in smaller communities (nearly three-fifths and slightly more than two-fifths of the workers, respectively), and higher in plants employing 250 workers or more (58 percent) than
Establishments were classified according to their major method of production as follows: (1) Line system—an operation in which parts of garments move down a line as each sewing-machine operator performs a standard task on a piece and then passes it on to the next operator for further processing, usually by means of a slide board or chute; (2) bundle system—an operation in which bundles of garments or parts of garments are distributed to individual operators who perform one or more operations on a number of identical pieces and rebundle the garments for movement to another operator; (3) progressive bundle system—an operation in which the bundles of garments flow in a logical order of work from operator to operator, each performing one or two assigned tasks on various pieces in the bundle. Since the procedure is standardized, the need for checking in and reassigning the work, as under the bundle system, is eliminated.
Percent of production workers in establishments having collective bargaining
agreements
United States-------------------------- 45-49
Middle Atlantic----------------------- 90-94Pennsylvania----------------------- 90-94
Border States-------------------------- 40-44Kentucky---------------------------- 50-54Virginia------------------------------ 25-29
Southeast--------------------------------- 25-29Alabama---------------------------- 30-34Georgia------------------------------ (1)Mississippi-------------------------- 25-29North Carolina------------------- (1)Tennessee-------------------------- 40-44
Southwest------------------------------- 45-49Texas--------------------------------- 35-39
Great Lakes---------------------------- 65-69Indiana------------------------------- 80-84
Middle West---------------------------- 85-89Missouri------------------------------ 954-
Pacific------------------------------------- 95+California-------------------------- 95+
* None of the establishments visited had collective bargaining agreements covering a majority of their production workers.
in plants employing 20-249 workers (36 percent). Similar relationships existed in most regions studied separately. The major unions in the industry were the United Garment Workers of America (AFL—CIO) and the Amalgamated Clothing Workers of America (AFL-CIO).
Sex and Occupation. Women accounted for seven- eighths of all production workers in the industry; regionally, the proportions ranged from about four- fifths in the Middle Atlantic to nine-tenths in the Pacific. Virtually all or a large majority of the sewing-machine operators, inspectors, pressers, and thread trimmers were women. Men, on the other hand, were predominant in jobs such as janitors, machine cutters, markers, sewing-machine repairmen, spreaders, stock and shipping clerks, and work distributors.
Method of Wage Payment. Approximately four- fifths of the industry’ s production workers were paid under incentive wage payment systems, most commonly individual piece rates (table 21). Occupations generally paid on an incentive basis included sewing-machine o p e r a t o r s , inspectors, machine pressers, and thread trimmers. In 5 of the 7 regions, the proportions of workers under incentive systems were closely grouped (81 to 87 percent);
Digitized for FRASER http://fraser.stlouisfed.org/ Federal Reserve Bank of St. Louis

4
%in the Great Lakes and Middle Atlantic, 69 and 62 percent, respectively, were under incentive systems. The wages of about seven-tenths of the workers paid on a time-rated basis were determined primarily according to individual employee qualifications, Wage systems consisting of a single rate for each job, and those providing a range of rates for each job, applied to about one-tenth and to one- fifth of the time-rated workers, respectively. Occupations usually paid on a time-rated basis included sewing-machine repairmen, machine cutters, markers, and spreaders.
Average Hourly Earnings
Straight-time earnings of the 62,775 production workers covered by the study averaged $1.84 an hour in February 1968 (table l ) .5 This was 29 percent above the average of $1.43 recorded in May-June 1964. 6 During the 1964-68 period, average earnings increased between 28 and 32 percent in the Border States, Southeast, and Southwest regions. Average earnings in the remaining regions rose 26 percent in the Great Lakes, 24 percent in the Middle West, and 23 percent in the Middle Atlantic and Pacific, the two highest paying regions. This general pattern of greater percent increases for the relatively low paid segments of the industry also may be noted by other changes in industry characteristics. For example, increases in average earnings for workers in metropolitan areas amounted to 26 percent, compared with 30 percent for those .in smaller communities; the increase was 29 percent for women and 26 percent for men; and sewing-machine operators (virtually all women) had an average increase of 29 percent contrasted with 20 percent for the high paid sewing-machine repairmen (all men). At least part of the increases noted above resulted from upward adjustments to the Federal minimum wage for manufacturing establishments that occurred between the two surveys. 7 The minimum was $1.25 an hour at the time of the 1964 survey, and raised to $1.40 on February 1, 1967, and to $1.60 on February 1, 1968.
Regionally, average hourly earnings for production workers in February 1968 ranged from $1.81 in the Southwest to $1.94 in the Middle Atlantic and Pacific. Workers in the Southeast averaged $1.84 and those in the Border States, $1.82. Average earnings for workers in the 12 States studied separately ranged from $1.78 in North Carolina to $1.94
in California (table 2). Increases in average earnings since May-June 1964 among these States, which accounted for about four-fifths of the industry’ s work force, ranged from 20 percent in California to 35 percent in Texas, and tended to narrow the difference in State averages. The February 1968 average in California, for example, exceeded that in North Carolina by 9 percent, whereas the corresponding spread was 19 percent in 1964.
The 54,829 women covered by the study averaged $1.81 an hour in February 1968—22 cents less than the 7,946 men. Average wage advantages for men ranged from 15 cents an hour in the Southeast to 59 cents in the Pacific. Differences in average pay levels for men and women may be the result of several factors, including differences in the distribution of the sexes among establishments and, as pointed out in the discussion of industry characteristics, among jobs having different pay levels. Differences noted in averages for men and women in the same job and geographic location may reflect minor differences in duties. Job descriptions used in classifying workers in wage surveys are usually more generalized than those used in individual establishments because allowance must be made for minor differences among establishments in specific duties performed. Also, earnings in some jobs are largely determined by production at piece rates. Variations in incentive earnings for individuals or
The straight-time average hourly earnings in this bulletin differ in concept from the gross average hourly earnings published in the Bureau's monthly hours and earnings series ($1.89 in February 1968). Unlike the latter, the estimates presented here exclude premium pay for overtime and for work on weekends, holidays, and late shifts. Average earnings were calculated by summing individual hourly earnings and dividing by the number of individuals; in the monthly series, the sum of the man-hour totals reported by establishments in the industry was divided into the reported payroll totals.
The estimates of the number of production workers within scope of the study is intended only as a general guide to the size and composition of the labor force included in the survey. They differ from those published in the monthly series (67,300 in February 1968) by the exclusion of establishments employing fewer than 20 workers. The advance planning necessary to make the survey required the use of lists of establishments assembled considerably in advance of data collection. Thus,, establishments new to the industry are omitted, as are establishments originally classified in the work clothing industry, but found to be in other industries at the time of the survey.
Op. c it ., BLS Bulletin 1440.7 The Federal minimum wage law applies to manufacturing
establishments engaged in interstate commerce. Under specific conditions, workers certified as learners or handicapped workers may be psud less than the legal minimum.
Digitized for FRASER http://fraser.stlouisfed.org/ Federal Reserve Bank of St. Louis

5
sex groupings may be traceable to differences in work experience, effort, work flow, or other factors which the worker may or may not control.
Among the five major product branches for which separate earnings are presented, nationwide averages were highest in work shirt plants ($1.88) and lowest in washable service apparel plants ($1.82). The wage relationships among these branches varied somewhat by region. In the Southeast, for example, workers in dungaree plants averaged 9 cents an hour more than those in work pants establishments ($1.91 compared with $1.82), whereas the averages for the two types of establishments were only 1 cent apart in the Border States and Southwest (table 1).
Average hourly earnings of production workers did not vary significantly by the establishment’ s union agreement status, size of community, or size of establishment. Nationwide, hourly earnings averaged 5 cents higher in union than in nonunion establishments ($1.87 compared with $1.82), 2 cents higher in metropolitan areas than in smaller communities ($1.86 and $1.84), and 2 cents higher in establishments employing 250 workers or more than in smaller establishments ($1.85 and $1.83). Where comparisons were possible within the same region, average earnings, with a few exceptions, did not vary substantially by the above characteristics. It is not possible in a survey such as this to isolate and measure the exact influence of any one characteristic, as a determinant of wage levels. The interrelationship of characteristics, such as unionization, size of establishment, and size of community, is pointed out in the d i s c u s s i o n of industry characteristics.
Earnings of nearly all production workers covered by the survey were between $1.60 and $3 an hour (table 3). Slightly more than one-third of the workers were paid at or slightly above the Federal mininum wage for manufacturing establishments, earning between $1.60 and $1.65 an hour. Sewing-machine operators, who are typically paid piece rates, constituted three-fourths of the workers in the $1.60 to $1.65 earnings interval. As shown in the following tabulation, the proportions of workers at lower earnings levels were greater in the three southern regions and the Middle West than in the other regions.
Percent of production workers earning less than—
Region $1.65 $1.70 $1.75
Middle Atlantic------------- ------ 19.9 29.0 35.3Border States----------------------- 37.2 46.6 53.6Southeast---------------------------- 35.1 45.0 52.3Southwest---------------------- ------ 43.2 49.9 57.0Great Lakes------------------------- 28.9 36.4 45.1Middle West------------------------- 37.0 42.8 49.9P a c if ic ------------------------- ------ 8.4 38.7 43.3
Occupational Earnings
Separate information was obtained for 20 occupational classifications selected to represent earnings levels for the various activities performed by production workers in the industry. 8 These jobs accounted for nearly nine-tenths of the industry’ s production workers. Average hourly earnings for the jobs studied ranged from $1.68 for janitors to $2.57 for sewing-machine repairmen (table 5), two jobs largely staffed by men and typically paid time rates. Men also were in the majority in the other two jobs which averaged at least $2.25 an hour, markers ($2.25), and machine cutters ($2.42).
The 44,363 sewing-machine operators, virtually all women and usually under incentive sytems, averaged $1.82 an hour. Their earnings levels varied by type of garment sewn, ranging from $1.77 for operators working on washable service apparel to $1.85 for those engaged in sewing work shirts.
Of the six occupations for which earnings data could be presented in each of the regions, averages were lowest in the three southern regions (Border States, Southeast, and Southwest) and usually highest in the Pacific region. Unlike relationships found in many other industries, the interregional spread in average earnings was proportionately greater for higher paying occupations than for those in which lower earnings levels were recorded. For example, the difference by which the highest region average exceeded the lowest amounted to 8 percent for sewing-machine operators, compared with 34 percent for sewing-machine repairmen and 45 percent for machine cutters.
Data on occupational earnings also were developed by community size, establishment size, and
Separate earnings data were obtained for four office jobs and are presented in table 5.
Digitized for FRASER http://fraser.stlouisfed.org/ Federal Reserve Bank of St. Louis

6
labor-management contract coverage. Tables 6 and 7 present occupational averages for union and nonunion plants by size of community and size of establishment.
Nationwide, none of the major product branches enjoyed substantially higher occupational averages than any of the other branches (table 8). Regionally, however, differences were apparent. In the Southeast, for example, occupational averages in dunagree plants were generally higher than in plants manufacturing work pants; in the Border States, this relationship was reversed.
Earnings of individual workers varied considerably within the same job and general geographic location. In many instances, particularly for jobs paid on an incentive basis, hourly earnings of the highest paid worker exceeded those of the lowest paid in the same job and State by $1 or more. Thus, some workers in a relatively low paid job (as measured by the average for all workers) earned as much as some workers in jobs for which higher averages were recorded. This is illustrated in the following tabulation of the earnings of men machine cutters and women sewing-machine operators (overalls and industrial garments) in Tennessee, despite a 25-cent difference in the averages for the two jobs.
Machinecutters
Sewing-machine operators, over
alls and industrial garments
Item Men Women
Average hourly earnings---- $2.09 $1. 84
Total workers------------------- 97 1,352
$1. 60 and under $1. 80 ------ 8 790$1. 80 and under $2. 0 0 ------ 34 250$2.00 and under $2. 2 0 ------ 24 166$2. 20 and under $2. 40 ------ 24 82$2. 40 and under $2. 60------ 4 36$2. 60 and over------------------ 3 28
Establishment Practices and Supplementary Wage Provisions
Data also were obtained on work schedules, shift practices, and selected supplementary wage provisions, including paid holidays, vacations, and various health, insurance, and pension plans. 9
Scheduled Weekly Hours and Shift Practices. Work schedules of 40 hours a week were in effect in establishments employing virtually all production and office workers (table 22). Shorter work schedules were reported for small proportions of the workers in the Border States, Southeast, and Great Lakes regions. Workers employed on late shifts accounted for less than 1 percent of the workers at the time of the study.
Paid Holidays. Paid holidays were provided by establishments employing more than nine-tenths of the industry’ s production and office workers (table 23). Paid holiday provisions varied substantially within regions; most commonly, production workers were granted 6 days annually in the Southeast and Pacific regions and 7 days in all but one of the other regions. Provisions for 6 and 7 paid holidays were of equal importance in the Southwest. Excluding some exceptions, paid holiday provisions for office workers were similar to those for production workers.
Paid Vacations. Paid vacations, after qualifying periods of service, were provided by establishments employing nearly all of the production workers and office workers (table 24). Typically, production workers were provided 1 week of vacation pay after 1 year of service and 2 weeks after 5 years. Provisions for 3 weeks of paid vacation after 15 years of service applied to one-fourth of the production workers and were more prevalent in the Middle Atlantic, Middle West, and Pacific than in the other regions. Vacation provisions for office workers were generally similar to those for production workers.
Health, Insurance, and Pension Plans. Life, hospitalization, and surgical insurance, for which employers paid all or part of the cost, were available to approximately four-fifths of the production workers (table 25). Medical insurance applied to one-half of the production workers; accidental death and dismemberment insurance, to two-fifths; sickness and accident insurance, to about three-tenths; and catastrophe insurance, to about one-fifth. Regionally,
9Establishments employing an estimated 17 percent of the
workers contributed to union-administered health and welfare funds from which selected benefits were provided to the employees. These plans have been included in the tabulations.
Digitized for FRASER http://fraser.stlouisfed.org/ Federal Reserve Bank of St. Louis

7
the proportions of workers covered by these benefits varied considerably. Sickness and accident insurance, for example, was available to virtually all of the production workers in the Middle Atlantic region, compared with nearly one-fifth in the Southeast. In several instances, smaller proportions of office workers than production workers were provided the various health and insurance benefits. A notable exception, however, was paid sick leave, which applied to one-third of the office workers but was rarely reported for production workers.
Pension plans, providing regular payments on retirement for the remainder of the worker’ s life (in addition to Federal social security benefits), were provided by establishments employing three-tenths of the production workers and about two-fifths of the office workers. Almost all of the plans were employer financed. Regionally, the proportions of workers provided retirement pension benefits were higher in the Middle Atlantic than in the other regions. Plans providing lump-sum payments at retirement seldom were found in the industry.
Other Selected Benefits. Pay for jury duty was provided by establishments employing one-fourth of the production workers (table 26). This benefit applied to three-eighths of the workers in the Southwest; nearly three-tenths in the Pacific; nearly one- fourth in the Middle West; approximately one-fifth in the Southeast, Great Lakes, and Border States; and to 5 percent of the workers in the Middle Atlantic. Nearly one-third of the office workers in the industry were provided with this benefit.
Funeral leave pay was available to only slightly more than one-eighth of the industry’ s work force. Only in the Border States did this benefit appear with any frequency—about two-fifths of the production workers were covered. The proportion of workers covered by paid funeral leave provisions did not exceed one-sixth in any of the other four regions where they were recorded (Middle West, Southwest, Great Lakes, and Southeast).
Severance pay plans, providing payments to employees separated from the company through no fault of their own, were virtually nonexistent in the industry.
Digitized for FRASER http://fraser.stlouisfed.org/ Federal Reserve Bank of St. Louis

T able 1. A verage H o u r ly Earnings: By Selected C haracteristics 00
(Num ber and av e rag e s tra ig h t- tim e hourly earn ings 1 of production w o rk e rs in w ork clothing m anufacturing e s tab lish m en ts by se lected c h a ra c te r is t ic s , U nited S ta tes and se le c te d reg io n s , F e b ru a ry 1968)
U nited S tates 2 M iddle A tlantic B o rd er States S outheast Southw est G re a t L akes M iddle W est P ac ificItem N um ber
ofw o rk e rs
A veragehourlyearn ings
N um berof
w orkersA verage
hourlyearn ings
Numbe r of
w o rk e rsA verage
hourlyearn ings
N um berofw o rk e rs
A veragehourly
earn in g sNumbe r
ofw o rk e rs
A veragehourly
earn in gsN um ber
ofw o rk e rs
A veragehourly
earn in gsN um berofw o rk e rs
A veragehourly
earn in gsN um ber
ofw o rk e rs
A veragehourly
earn in gsA ll p roduction w o rk e rs3 — __ — ---- 62, 775 $ 1. 84 2,078 $1. 94 9, 003 $ 1. 82 23,011 $ 1. 84 15, 393 $ 1. 81 3, 846 $ 1. 90 6, 554 $ 1. 86 2, 225 $1. 94
M en ___ _________ — ______ 7, 946 2. 03 376 2. 27 1, 168 2. 01 3,028 1. 97 1, 817 1. 97 453 2. 29 775 2. 10 202 2. 47W om en---------------------------------------------- 54 ,829 1. 81 1, 702 1. 87 7, 835 1. 80 19, 983 1. 82 13, 576 1. 78 3, 393 1. 85 5, 779 1.83 2,023 1. 88
M ajo r product:D ungarees — — ___ — ----- - 15 ,067 1. 85 - - 4, 599 1. 83 4, 336 L 91 3, 844 1. 81 - - - - - -O v era lls and in d u s tr ia l g a rm e n ts___ 6, 578 1. 84 - - - - - - - - - - - - - -W ashable se rv ic e a p p are l _ __ __ __ 4, 314 1. 82 - - - - 1, 784 1. 74 - - - - - - - -W ork p a n t s ------ — — ___ 28,434 1. 83 - - 3, 194 1.82 9,615 1. 82 9, 575 1. 82 - - 2 ,480 1. 87 1,927 1. 93W ork s h i r t s __ -_____________________ 6, 642 1. 88 - - - - 4, 529 1. 85 - - - - - - - -
Size of com m unity:M etrop o litan a re a s 4 ------------------------- 17,785 1. 86 2,078 1. 94 - - 2,489 1. 90 7, 795 1. 78 2,069 1. 90 - - 1,613 1. 94N onm etropo litan a r e a s _____ - ---- 44 ,990 1. 84 - - 8, 378 1. 83 20,522 1. 83 7, 598 1. 83 1, 777 1. 90 5, 733 1. 84 - -
Size of e s tab lish m en t:20-249 w o r k e r s _____________________ 29, 293 1. 83 1,736 1. 96 3, 637 1.82 11, 224 1. 81 5, 181 1. 81 2, 350 1. 90 4 ,4 1 8 1. 81 342 1. 95250 w o rk e rs o r m o r e . __ _ — 33,482 1. 85 - - 5, 366 1. 82 11, 787 1. 86 10, 212 1. 81 1,496 1. 91 2, 136 1. 95 1, 883 1. 94
L ab or-m an agem en t c o n trac ts : E stab lish m en ts with—M ajo rity of w o rk e rs c o v e re d _____ 29, 771 1. 87 1, 923 1. 94 3, 785 1. 81 6, 182 1. 90 7, 040 1. 82 2,564 1. 89 5, 734 1. 87 2, 138 1. 93None or m in o rity of w o rk e rsc o v e re d -------------------------------------- 33,004 1. 82 " " 5, 218 1. 83 16, 829 1. 81 8, 353 1. 80 1, 282 1.93 ” ~ " ■
1 E xcludes p rem iu m pay for ov ertim e and for w ork on w eekends, holidays, and la te sh ifts .2 Includes data for reg ion s in add ition to those shown sepa ra te ly .3 Includes data fo r m a jo r p roduc t c la s s ific a tio n s in addition to those shown se p a ra te ly .4 S tandard M etropo litan S ta tis tic a l A re a s a s defined by the B ureau of the Budget th rough A p ril 1967.NOTE: D ashes ind icate no data rep o r ted o r data that do not m ee t publication c r i te r ia .
T a b le 2. A verage H ou rly E arnings and E m p loy m en t C haracteristics: S elected States
(A verage s tra ig h t- tim e hourly earnings 1 and percen t d is trib u tion of p roduction w o rk e rs in w ork clothing m anufactu ring e s ta b lish m e n ts by se lected c h a ra c te r is t ic s , 12 se le c te d S ta te s , F e b ru a ry 1968)
P e rc e n t of p roduction w o rk e rs em ployed in e stab lish m en ts acco rd ing to—
StatesNumber
ofworkers
Average hourly
earnings 1
M ajor products Community size Establishment size Labor -management contract coverage
DungareesOveralls
andindustrialgarments
Washableserviceapparel
- Work pants
Workshirts
Otherw ork
clothing
M etropolitanareas
Non-m etropolitanareas
20-249w orkers
250w orkers or m ore
M ajority o f w orkers
covered
None or m inority
o f w orkers covered
A labam a_____________________ 3,038 $ 1. 90 37 10 6 40 8 11 89 33 67 31 69C a liforn ia___________________ 1, 685 1. 94 - - 13 84 3 - 80 20 19 81 95 5G eorgia ________________ ____ 4, 618 1. 81 11 - 22 62 5 - 14 86 65 35 _ 100Indiana_____________________ 2, 163 1. 93 14 6 13 30 26 11 47 53 31 69 83 17K entucky-------------------- ---------- 4, 785 1. 81 54 14 - 27 5 - - 100 49 51 53 4 7M ississip pi ---- ------- 4, 937 1. 83 8 - 12 26 54 - 4 96 49 51 28 7 2M is s o u r i__________ ____ — 4, 923 1. 85 5 9 16 50 20 - 10 90 67 3 3 96 4North C a ro lin a _____________ 1, 616 1. 78 51 12 - 37 _ - 7 93 6 1 39 - 1 0 0Pennsylvania________________ 1, 608 1. 91 24 17 13 46 - - 100 - 79 21 92 8T e n n essee ---------------------------- 8, 334 1. 84 18 25 - 44 13 - 14 86 4 0 60 42 5 8Texas ____________ __________ 10,207 1. 83 14 7 _ 70 9 63 37 27 73 3 8 6 2Virginia __ ------- ------- __ 3,450 1. 86 58 1 - 3 3 ' 8 - 100 16 84 29 71
1 E xcludes p rem iu m pay fo r ov e rtim e and for w ork on w eekends, holidays, and la te sh ifts . NOTE: B ecause of rounding, sum s of ind ividual item s may not equal 100.
Digitized for FRASER http://fraser.stlouisfed.org/ Federal Reserve Bank of St. Louis

T a b le 3. E arnings D is tr ib u tion : A l l Establishm ents
(Percent distribution of production w orkers in w ork clothing manufacturing establishm ents by average straight-tim e hourly earnings, 1 United States and selected regions, February 1968)
A verag e hourly e arn in g s 1United S ta tes 2 M iddleA tlan tic
B o rd erS ta te s Southeast Southw est G rea t
L akesMiddleW est P ac ific
U nder $ 1 .6 0 _______________________________________ 1. 3 0 .9 2. 2 0. 8 1 .2 2 .7 1.6 0 .4$ 1. 60 and under $ 1 .6 5 ____________________________ 34. 5 19. 0 35 .0 34 .3 42 .0 26 ,2 35 .4 8 .0$ 1 .6 5 and under $ 1 .7 0 ____________________________ 9. 1 9. 1 9 .4 9 .9 6 .7 7. 5 5 .8 30. 3$ 1. 70 and under $ 1 .7 5 ____________________________ 7. 1 6. 3 7 .0 7. 3 7. 1 8 .7 7. 1 4 .6$ 1 .75 and under $ 1 .8 0 ____________________________ 7 .4 12. 5 7. 1 6 .8 7 .7 7 .0 7. 7 5 .0$ 1 .80 and under $ 1 .8 5 ________________________ 5.9 5. 1 6. 5 6 .0 5 .7 4 .7 6. 7 5. 1$ 1 .8 5 and under $ 1 .9 0 ____________________________ 4 .8 5 .2 5. 3 4 .9 4. 1 4. 3 5. 1 5 .7$ 1. 90 and under $ 1 .9 5 ____________________________ 4 .0 3.8 3 .8 3.9 3 .6 5. 1 4. 3 4 .8$ 1 .9 5 and under $ 2 .0 0 ___________________________ _ 3. 5 2 .9 3.8 3. 7 3 .0 4 .2 3. 1 4. 0$ 2 . 00 and under $2. 10 ____________________________ 6 .0 10. 8 5. 3 6. 1 5 .2 7. 7 5 .0 9 .4$2. 10 and under $2 . 20 ____________ ________________ 4 .2 5. 1 3. 7 4 .4 3 .9 4 .8 3. 6 5. 1$2. 20 and under $2 . 30 ___________________________ _ 3. 1 4. 1 2 .6 3.4 2 .4 3. 7 3. 1 3. 2$2. 30 and under $2. 40 ____________________________ 2. 5 4 .8 2 .4 2. 3 1 .8 2 .8 3 .4 3. 5$2. 40 and under $ 2 .5 0 ____________________________ 1.8 2. 5 1. 5 1.8 1.5 2 .5 1.9 2 .6$2. 50 and under $ 2 .6 0 ____________________________ 1. 3 1. 8 1 .4 1. 3 . 9 2 . 0 1,6 1. 5$2. 60 and under $2 . 70 ____________________________ .8 1.2 .8 . 7 . 6 1.4 1. 3 1.4$2. 70 and under $ 2 .8 0 ____________________________ . 7 1. 1 . 5 . 7 . 6 . 9 .8 1. 1$2. 80 and under $ 2 .9 0 ____________________________ .6 1. 0 . 5 .4 . 6 1. 1 . 6 .4$2. 90 and under $ 3 .0 0 ----------------------- ------------------------- .4 .6 .4 . 3 . 2 .5 . 5 . 8
$ 3. 00 and ov er ____________________________________ 1.2 2. 3 .8 .9 .9 2. 1 1 .4 3 .2T otal ________________________________________ 100. 0 100. 0 100. 0 100.0 100.0 100.0 100. 0 100.0
N um ber of w o r k e r s ________________________________ 62,775 2, 078 9,003 23,011 15,393 3,846 6,554 2.225M en_____________________________________________ 7,946 376 1, 168 3,028 1,817 453 775 202Women _________________________________________ 54,829 1,702 7,835 19,983 13,576 3, 393 5,779 2,023
A verage hourly e arn in g s 1__________________________ $1 .84 $ 1 .9 4 $ 1 .8 2 $ 1 .8 4 $18. 1 $ 1 .9 0 $ 1 .8 6 $1 .9 4Men _____________________________________________ 2. 03 2. 27 2.01 1.97 1.97 2 .29 i o 2 .4 7Women _____________________________________ __ 1. 81 1. 87 1.80 1.82 1.78 1.85 1.83 1 . 8 8
1 Excludes premium pay for overtim e and for work on weekends, holidays, and late shifts.2 Includes data for regions in addition to those shown separately.
NOTE: Because of rounding, sums of individual items may not equal 100.
(0
Digitized for FRASER http://fraser.stlouisfed.org/ Federal Reserve Bank of St. Louis

T a b le 4. E arnings D istr ib u tion : B y M a jo r P rod u ct O
(P e rc en t d is trib u tio n of production w orkers in w ork c loth ing m an ufac tu ring e s ta b lish m e n ts by a v e rag e s tra ig h t- tim e hourly e a rn in g s 1 and ijnajor product, U nited S ta te s and se le c te d reg io n s , F e b ru a ry 1968)
A verage hourly e arn in g s 1D ungarees
W ashablese rv ic ea p p a re l W ork pan ts W ork
s h ir tsUnited State s 2
B orderS tates
Southeas t
South- we st
United S ta te s 2
Southe as t U nited
S ta te s 2B o rd er S tate s Southe as t South- we st M iddleW est P ac ific U n ited ' S tate s 2 South
e as t
U nder $1 .6 0 __________________________________ 1.9 1.4 1.0 2 .2 1. 0 0 .4 1. 1 2. 5 1. 1 1.0 0. 2 0. 5 0 .9 0 .4$ 1. 60 and under $ 1. 65 33. 1 34. 7 31. 1 35 .4 42 .8 56 .9 35. 1 39.9 34. 1 41 .4 30. 3 8 .9 25 .9 27 .9$1. 65 and under $ 1 . 7 0 _______ __ 7.2 8 .5 6. 2 7 .4 6 .9 6. 0 10. 6 7. 0 12.6 6 .7 6 .4 30. 7 9 .9 11.4$ 1. 70 and under $ 1 .7 5 ________________________ 7 .9 7. 5 6 .5 9 .8 7 .5 6 .8 6. 3 6. 0 7. 1 5 .4 8. 1 4. 7 6. 3 6 .7$ 1. 75 and under $ 1 . 8 0 ____ 7.9 7 .2 7. 5 9. 1 6. 3 4 .8 7. 2 6 .6 6. 7 8. 1 7. 6 4 .9 8. 2 6. 5$ 1 .8 0 and under $ 1 .8 5 ________________________ 6 .0 7. 2 5. 1 6 .2 5. 0 4 .7 6 .2 5 .9 6. 2 5 .9 8. 6 5 .2 6 .9 7 .4$ 1.85 and under $1 .90 _ ____ 4. 7 5 .2 4 .0 4. 5 4 .4 3 .8 4 .6 4. 7 4 .9 4 .0 6 .2 4. 6 5. 7 6 .4$ 1 .9 0 and under $ 1. 9 5 ________________________ 3.9 4 .2 4 .4 3. 3 3 .8 1.8 4. 0 3. 6 3 .8 4. 0 5 .4 4. 7 4 .4 4. 5$ 1 .95 and under $2. 0 0 ________________________ 3.4 3. 5 3.4 3. 1 2 .2 2. 1 3. 6 3 .9 3. 5 3. 2 3 .9 4. 0 5. 1 5. 5$2. 00 and under $2. 1 0 ________________________ 6. 3 6. 5 6 .9 4 .9 5 .4 3.4 5 .7 4. 3 5 .6 5 .2 5 .8 9. 3 7. 5 6 .8$ 2 .1 0 and under $ 2 .2 0 ________________________ 4. 3 3. 5 5. 3 4 .0 4. 7 4. 3 4. 2 3 .9 4 .4 4. 3 3 .8 4. 3 4. 6 4 .5$2. 20 and under $2. 3 0 ________________________ 3 .4 2 .9 4. 5 2. 7 1. 6 .8 2 .8 2. 1 3. 1 2 .4 2 .9 3.7 4 .2 4 .0$2. 30 and under $2 .40 __ _ ___ 2 .6 2. 3 3 .4 2. 1 2 .4 1.4 2. 3 2 .4 2 .0 2. 0 3. 6 3. 5 3 .0 2 .4$2. 40 and under $ 2 . 5 0 ______ 2. 2 1. 5 3 .0 1. 7 1. 5 .4 1. 7 1 .4 1.5 1. 7 1 .6 2. 7 2 .4 2 .0$2. 50 and under $2. 6 0 ________________________ 1.4 1.2 2. 1 .8 1.0 .6 1. 1 1.8 1.0 .9 1.7 1. 5 1 .8 1. 3$2. 60 and under $2. 7 0 ________________________ 1. 0 .6 1. 2 . 7 .6 .4 .8 1. 1 . 7 . 7 1. 1 1. 5 .8 .4$2. 70 and under $2. 8 0 __________ ____________ _ .8 .4 1.6 .4 . 6 .4 .6 .6 .4 .8 .8 1. 1 .8 .6$2. 80 and under $2. 9 0 _________ ______________ .6 . 3 .4 .6 . 5 . 1 .6 1. 0 . 3 .8 . 5 . 5 .5 .4$2. 90 and under $ 3. 0 0 ________________________ .4 . 3 . 7 . 2 .3 - .4 . 3 . 3 . 3 .6 .6 . 3 . 2$ 3. 00 and o v e r ________________________________ 1.2 1.0 1.9 .8 1. 5 .8 1. 1 1.0 . 7 1. 1 1. 1 3. 3 .9 . 7
T o ta l______ ___ _______ ___ ___ _ __ 100. 0 100. 0 100. 0 100. 0 100. 0 100. 0 100. 0 100. 0 100.0 100. 0 100. 0 100. 0 100. 0 100. 0N um ber of w o rk e rs ___________________________ 15,067 4,599 4, 336 3,844 4, 314 1,784 28 ,434 3, 194 9,615 9, 575 2,480 1,927 6 ,642 4,529A verage hourly earn in g s i.______________________ $ 1 .8 5 $1 .83 $1 .91 $1 .81 $ 1 .8 2 $1. 74 $ 1 .8 3 $1 .8 2 $1 .8 2 $ 1 .8 2 $ 1 .8 7 $ 1 .9 3 $ 1 .8 8 $ 1 .8 5
1 E xcludes p rem iu m pay fo r ov e rtim e and fo r w ork on w eekends, ho lidays, and la te sh ifts .2 Includes data fo r reg ion s in add ition to those shown sep a ra te ly .NOTE: B ecause of rounding, stuns of individual item s m ay not equal 100.
Digitized for FRASER http://fraser.stlouisfed.org/ Federal Reserve Bank of St. Louis

T a b ic 5. O ccu p a t io n a l A verages: A ll E stablishm ents
(Num ber and average s tra ig h t- tim e hourly earn in g s 1 of w o rk e rs in se lec ted occupations in w ork cloth ing m anufactu ring e s tab lish m en ts , United S ta tes and se le c te d reg io n s, F e b ru a ry 1968)
O ccupation and sexUnited S ta tes 2 M iddle
A tlanticB o rd erS ta tes S outheast Southw est G rea tL akes M iddle
W est P ac ificNum ber
ofw orke rs
A veragehourlyearn ings
N um berofw o rk e rs
A verageho urlyearn in gs
N um berof
w o rk e rsA veragehourlyearn in gs
N um berof
w o rk e rsA verage
hourlye arn in g s
N um berof
w o rk e rsA verage
hourly earn ing 8
N um berof
w o rk e rsA verage
hourlye arn in g s
N um berofw o rk e rs
A veragehourly
earn ingsN um ber
ofw o rk e rs
A verageho urly
e arn in g sS e lected p roduction occupations
A sse m b le rs _ _ _ _ _ _ 267 $ 1. 85 _ _ 41 $ 1 .8 2 109 $1 .8 6 47 $1 .68 _ 15 $ 1 .8 7 9 $ 1 .7 5M en. ___________________________________________ 140 1. 91 - - 29 1.89 71 1.92 18 1.80 _ _ 12 1.90 _ _Women____________________________________ _____ 127 1. 78 _ _ _ _ 38 1. 73 - _ _ _ _ _ 9 1. 75C u tte rs , m achine (927 m en and 43 women) __ 970 2.42 62 $ 2 .8 7 182 2. 32 283 2 .2 3 149 2.42 99 $2 .62 128 2. 34 46 3.23F o ld e rs , ga rm en t _ __ .............. . ...... ........ 368 1.82 - _ 25 1. 77 188 1. 80 92 1. 82 21 1.84 34 1.95 _ _
Men __ _ ____ _ 39 1. 74 _ _ _ _ 17 1.72 18 1.63 _ _ » _ _ _W om en_______________________________________ 329 1.83 _ _ 23 1.75 171 1.80 74 1.87 19 1. 76 34 1.95 _ _
Hand (253 wom en and 28 m en) _ _ 281 1.81 _ - 12 1.92 143 1.78 71 1.78 19 1. 76 28 1.92 _Hand and m ach ine (all w om en)__________________ 28 1. 68 _ _ _ _ 16 1. 74 _ _ _ _ _ _ _ _M achine (48 wom en and 11 m e n ) ________________ 59 1.97 _ _ _ _ 29 1.90 21 1.97 _ _ _ _ _ _
G arm en t rep a irm e n (232 wom en and 6 m e n )__ _____ 238 1. 75 _ - 24 1. 74 71 1. 73 73 1. 72 23 1.91 10 1.66 31 1.80In sp e c to rs , fina l (2, 684 w om en and 46 m e n ) _______ 2,730 1.84 28 1. 73 462 1.81 989 1. 85 673 1.81 206 1.95 246 1. 81 98 1.93Ja n ito rs ___________________________________________ 624 1. 68 7 1.74 92 1.64 250 1.65 159 1.69 40 1.80 63 1. 72 12 1.86M e n _____________________________________________ 471 1. 70 _ _ 73 1.65 179 1.65 115 1. 71 28 1.85 58 1. 73 11 1.88W o m en__________________________________________ 153 1.64 _ _ 19 1. 61 71 1. 63 44 1. 64 12 1.69 _ _ _ _M ark e rs (197 m en and 115 women) 312 2.25 _ _ 42 2. 22 106 2. 10 68 2. 18 21 2. 79 19 2.42 _ _P r e s s e r s , f in ish , hand(157 wom en and 9 m e n )_____ 166 1.86 10 1.81 _ _ 115 1.92 _ _ _ _ 12 1.80 _ _P r e s s e r s , fin ish , hand and m achine (a ll women)___ 69 2.03 _ _ _ _ _ _ _ _ 69 2. 03 _ _ _ _P r e s s e r s , f in ish , m a c h in e _________________________ 1,582 1.92 44 2. 23 229 1.95 686 1.94 507 1.81 _ _ 63 2. 32 _ .
Men _ __ __ __ __ _ __ __ __ 546 2. 01 _ _ 115 1. 98 280 2. 06 118 1. 76 > _ 18 2.49 _ _W o m e n _________ ________________________________ 1,036 1.88 _ _ 114 1.92 406 1. 85 389 1.83 _ _ 45 2 .2 5 _ _
R epairm en , sewing m achine (all m en) 698 2. 57 13 2. 93 104 2. 38 266 2. 53 186 2. 63 44 2. 81 73 2. 54 12 3. 20Sew ing-m achine o p e ra to r s 3_________________________ 44,363 1. 82 1,356 1.87 6,431 1.80 15,997 1.82 11,177 1.79 2,686 1.84 4 ,8 15 1.83 1,503 1.93M e n ----------- ---------- ----------------------------------------- 361 1.92 - - 34 2. 06 100 1.96 164 1. 78 _ _ _ _ _ _W omen _ _ ___ .. _ 44,002 1.82 1,330 1.87 6, 397 1.80 15,897 1.82 11,013 1.79 2,682 1.84 4 ,7 84 1.83 1,503 1.93D ungarees (9, 657 wom en and 55 m en) __________ 9, 712 1. 84 _ _ 3, 159 1.80 2, 914 1.88 2, 362 1.84 260 1.80 648 1.76 _
O vera lls and in d u s tr ia l g a rm en ts(4, 963 w om en and 27 m e n )___ _ __________ 4,990 1.83 _ _ 743 1.77 2, 168 1.82 . _ 669 1.83 1,018 1.88 44 1.77W ashable se rv ic e a p p a re l (a ll women) _________ 2,837 1.77 324 1.85 - - 941 1.71 _ _ 622 1.85 670 1.66 188 1.93W ork pan ts (16, 923 w om en and 265 men) _______ 17,188 1.81 426 1.80 1,913 1.79 5,654 1.80 5,673 1.79 380 1.82 1,825 1.85 1, 150 1.93W ork s h ir ts (5, 255 w om en and 7 m en) ___ , 5,262 1.85 _ _ _ _ 3,291 1.84 805 1.84 _ _ 580 1.97 _ _
Shipping c le rk s (305 m en and 63 women) __________ 368 2. 00 _ _ 105 1.91 111 1.97 27 2.01 34 2. 32 58 1.80 16 2 .5 9S p re a d e rs (474 m en and 63 w o m en )________________ 537 1.96 - - 65 2 .03 197 1.90 115 1.99 53 1.95 39 2.06 _ _Stock c le rk s (302 m en and 47 w o m en )______________ 349 1. 82 _ - 33 1. 76 122 1.80 51 1.85 56 1.86 48 1.89 _ _T hread t r im m e r s (504 wom en and 25 m en) _______ _ 529 1.82 54 1. 73 59 1. 76 205 1.88 206 1. 79 _ _ _ _ _ _U n d e rp re s se rs , h a n d ___________________ ___________ 222 1. 88 - - 20 2. 13 69 1.81 112 1.84 _ - - _ _ _
Men _ __ _ _ _ _ 92 2.02 _ _ 17 2. 18 27 1.95 31 1.93 _ _ _ _ _ _W omen __________________________________________ 130 1. 78 _ - - _ 42 1. 71 81 1. 80 _ - - _ _ _
U n d e rp re s se rs , m achine 219 1.76 _ _ 63 1.82 77 1. 72 43 1. 74 _ _ 30 1.80 _ _M en _____________________ ________________ ____ ____ 47 1. 82 _ - 16 1.95 13 1. 78 _ _ _ - _ _ _ _Women _________________________________________ 172 1.75 _ _ 47 1. 78 64 1.71 41 1.75 _ _ 14 1. 83 _ _
W atchmen (all men) __________________________ ____ 88 1. 70 7 1.86 8 1.65 44 1. 68 22 1. 70 _ _ - _ _ _W ork d i s t r ib u to r s _________ _______________________ _ 1,345 1. 72 63 1. 70 192 1. 68 566 1. 71 289 1.69 107 1. 85 96 1.80 31 1.85
M en_____________________________________________ 1,027 1. 72 54 1. 70 170 1. 67 446 1. 71 225 1.69 36 1.87 68 1.82 27 1.85Women _ _ . . . _ __ _ _ ______ 318 1. 73 - - 22 1. 74 120 1.68 64 1.69 71 1.84 28 1.78 - -S elected office occupations
C le rk s , g en era l (773 wom en and 22 m en) _____ , 795 1. 88 36 2. 19 79 1. 79 231 1.89 178 1. 76 102 2 .09 121 1. 78 29 2 .2 0C le rk s , pay ro ll (354 women and 3 m e n ) ____________ 357 1.96 18 2. 34 65 1.90 114 1.93 98 1.92 13 2 .07 41 1.90 7 2 .4 3S ten o g rap h e rs , g e n e ra l (a ll women) ___ _ 49 2. 11 - - - - 21 2. 16 9 2.09 7 2 .02 - - - -T yp is ts , c la s s B (a ll w o m en )_____________________ 62 1.84 “ - 7 1.74 35 1. 75 13 1.91 " " ” “
1 E xcludes p rem iu m pay fo r o v ertim e and fo r w ork on w eekends, ho lidays, and la te sh ifts .2 Includes data fo r reg ion s in add ition to those shown separate ly .3 Includes data fo r o p e ra to rs in addition to those shown sepa rate ly .NOTE: D ashes ind icate no data rep o rted o r data that do not m eet publication c r i te r ia .
Digitized for FRASER http://fraser.stlouisfed.org/ Federal Reserve Bank of St. Louis

T a b le 6. O ccu p ation al A verages: B y L abor-M anagem ent C ontract C overa g e and C om m u n ity Size
(Num ber and averag e s tra ig h t- t im e hourly e a rn in g s1 of w orkers in se lected occupations in w ork clothing m anufac tu ring e s tab lisn m en ts by labo r-m an ag em en t c o n tra c t cov erageand size of com m unity, United S ta tes and se lec ted re g io n s , F e b ru a ry 1968)
Sex, occupation , and s ize of com m unity
MenC u tte rs , m a c h in e ----------------------------
M etropolitan a r e a s ---------------------N onm etropo litan a r e a s ---------------
J a n i to r s -------------------------------------------M etropolitan a r e a s ---------------------N onm etropo litan a r e a s ---------------
P r e s s e r s , f in ish , m achine -------------M etropolitan a r e a s ---------------------N onm etropo litan a r e a s ---------------R epa irm en , sewing m a c h in e -----------M etropolitan a r e a s ---------------------N onm etropo litan a r e a s ---------------
S p re a d e rs ----------------------------------------M etropo litan a r e a s ---------------------N onm etropo litan a r e a s ---------------W ork d is t r ib u to r s ----------------------------
M etropolitan a r e a s ---------------------N onm etropo litan a r e a s ----------:-----
WomenF o ld e rs , g a rm en t ----- -------
M etropolitan a r e a s ------N onm etropo litan a re a s ■
In sp ec to rs , final -------------M etropo litan a re aN onm etropo litan a re a s —
P r e s s e r s , f in ish , m achineM etropo litan a r e a s --------N onm etropo litan a re a s —
S ew ing-m achine o p e ra to rs 3 M etropo litan a re a sN onm etropo litan a r e a s -----
D u n g arees-M etropo litan a re a s ■N onm etropo litan a r e a s -----
W ashable se rv ic e a p p a r e l -----M etropolitan a r e a s -----------N onm etropo litan a r e a s -----
W ork p a n ts ----------------------------M etropo litan a r e a s -----------N onm etropo litan a r e a s -----Work s h i r t s -M etropo litan a re a s -N onm etropo litan a re a s ■
T hread t r i m m e r s -----------------M etropo litan a re a s -N onm etropo litan a re a s ■
United States 2 M iddle A tlantic B o rd er S ta tes S outheastE s tab lish m en ts with- All
E s ta b lish m en ts with— All
E stab lish m en tswith-— A ll E s tab lish m en ts
w ith—e s tab li shm ent s M ajority covered None o r
m in o rity cov erede s ta b lish
m en ts M ajo ritycovered
e s ta b lish m en ts M ajo ritycovered
None o r m in o rity covered
e s ta b lish m ents M ajo rity
cov eredNone o r m in o rity coveredN um ber
ofw o rk e rs
A veragehourly
earningsNum ber
ofw orkers
A veragehourly
earningsN um ber
ofw orke rs
A veragehourly
earn in gsA verage hourly earn in gs
927 $ 2 .45 473 $2. 56 454 $2. 33 $2 .87 $2. 89 $2. 33 $2. 25 $2. 39 $2. 25 $2. 50 $2 .19347 2. 65 218 2.73 129 2. 52 2.87 2.89 - - 2 .16 . 2 .1 6580 2. 33 255 2. 41 325 2. 26 - - 2. 27 2. 20 2. 33 2. 26 2.57 2. 20471 1.70 213 1.74 258 1. 66 _ _ 1.65 1.65 1.66 1.65 1.69 1 .6 4111 1.73 49 1.77 62 1.70 - - - , 1 ,62 1.62360 1.68 164 1.73 196 1.64 - - 1 .66 - 1 .66 1.66 1.69 1.65546 2.01 225 2.20 321 1.88 - - 1.98 - 1.85 2 .06 2 .1 4 1.96186 2.02 _ - 80 1.86 . - _ - - . .360 2.01 119 2. 25 241 1.88 _ - 2 .03 . 1 .89 2 .03 2.20 1 .9 4698 2. 57 291 2.63 407 2. 53 2 .93 3.05 2. 38 2.40 2. 36 2. 53 2. 59 2.51177 2. 76 83 2.86 94 2. 66 2 .9 3 3.05 _ . 2. 61 . 2. 36521 2. 51 208 2.54 313 2.49 _ - 2. 37 2. 39 2. 36 2. 52 2. 50 2 .5 3474 1.97 209 2.01 265 1 .9 4 - - 2 .0 3 - 2 .0 4 1.89 1 .84 1.91153 2.01 95 2.09 58 1.89 - - - - 1 .78 . 1 .82321 1.95 114 1.94 207 1 .95 - - 2. 09 - 2 .13 1.91 1.87 1.911,027 1.72 444 1.74 583 1.70 1.70 1. 70 1.67 - 1 .68 1.71 1 .7 4 1.71289 1.69 136 1.74 153 1 .65 1. 70 1.70 - _ - 1.69 _ 1.67738 1.73 308 1.74 430 1.72 " “ 1.69 " 1.70 1.72 1.75 1.71
329 1.83 149 1.89 180 1.78 1,75 1,80 1 .8 4 1.78131 1.79 61 1.90 70 1.70 - - - , _ .198 1.86 88 1.89 110 1 .83 - - 1.90 - r 1 .79 1.82 1.782 ,684 1.84 1,203 1.84 1,481 1 .84 1.69 1.69 1.81 1.82 1.79 1.85 1 .98 1.81704 1.82 398 1.82 306 1.80 1.69 1.69 - - r 1 .85 . 1 .721,980 1.85 805 1.85 1,175 1.85 - - 1. 82 1.82 1.82 1.85 1.97 1.81
1 ,036 1.88 375 1.94 661 1 .8 4 - - 1 .92 - 2 .07 1.85 1 .98 1.81358 1.89 110 2.03 248 1. 82 - - - - - • - •678 1.87 265 1.89 413 1.85 - - 1 .94 - 2 .13 1.83 1 .92 1,81
44 ,002 1.82 21,239 1.84 22,763 1.79 1.87 1.87 1.80 1.79 1.81 1.82 1.89 1.8012,025 1. 82 6,661 1.87 5,364 1 .76 1.87 1.87 . . 1 .92 * 1.8231,977 1.82 14,578 1.83 17,399 1.80 - - 1.81 1 .82 1.81 1 .86 1.799 ,657 1.84 4,962 1.85 4 ,695 1. 82 - - 1 .80 - 1 .83 1.88 2.00 1.81
1,637 1.92 1,326 1.97 311 1.69 _ - - - . , . .8 ,020 1.82 3,636 1.81 4,384 1 .83 - - 1 .80 - 1 .83 1.83 „ 1.822,837 1.77 1,563 1.80 1,274 1 ,7 4 1.85 1.85 . - 1.71 . 1.71
826 1.87 591 1.91 235 1. 78 1.85 1.85 , - - _ _ .2,011 1.73 972 1.73 1,039 1.73 - - - - - 1.71 - 1.71
16,923 1.81 8,966 1.83 7,957 1. 78 1.80 - 1.79 1,79 1.78 1.80 1.87 1.784 ,948 1.81 2,885 1.81 2,063 1. 80 1.80 - • - - . _
11,975 1.81 6,081 1. 84 5,894 1.77 - - 1.81 1 .84 1.80 1,79 1.87 1.775,255 1.85 1,895 1.87 3,360 1 .84 - - . - , 1. 84 1.83 1.841,582 1.86 609 1.95 973 1.80 - - - . . 1.77 - 1 .773,673 1.85 1,286 1.84 2,387 1.86 - - - - - 1 .84 1.83 1,85504 1.81 189 1.80 315 1.81 1.73 1.69 1.73 - 1. 70 1 .86 1 .8 6 1,87217 1.77 56 1.70 161 1.79 1 .73 1.69 - - .. _ . _287 1.84 133 1.85 154 1.83 1.73 1. 70 1 .86 1 .86 1.87
See footnotes a t end of tab le .
Digitized for FRASER http://fraser.stlouisfed.org/ Federal Reserve Bank of St. Louis

T a b le 6. O ccu p a tion al A verages: By L abor-M an agem en t C ontract C overage and C om m u n ity Size— C ontin ued
(Num ber and av e rag e s tra ig h t- tim e hourly earn ings 1 of w orke rs in se le c te d occupations in w ork cloth ing m an ufac tu ring e s ta b lish m e n ts by lab o r-m an ag em en t c o n tra c t coverageand size of com m unity, United S ta tes and se le c te d reg io n s , F e b ru a ry 1968)
Sex, occupation , and size of com m unity
MenC u tte rs , m a c h in e -
M etropo litan a re a s -N onm etropo litan a re a s -
J a n i to r s ----------------------------M etropo litan a reN onm etropp litan a re a s —
P r e s s e r s , f in ish , m ach ine ■M etropo litan a r e a s --------N onm etropo litan a re a s —
R epairm en , sewing m achine • M etropo litan a re a s - N onm etropo litan a re a s -
S p re a d e r s -------------------------M etropo litan a r e a s -----N onm etropo litan a re a s -
W ork d i s t r i b u t o r s ------------M etropo litan a r e a s --------N onm etropo litan a re a s —
F o ld e rs , g a rm e n t-------------M etropo litan a r e a s ------N onm etropo litan a re a s -
In sp e c to rs , finalM etropo litan a r e a s ---------N onm etropo litan a re a s — P r e s s e r s , fin ish , m achine -M etropo litan a r e a s ---------N onm etropo litan a re a s —
S ew ing-m achine o p e ra to rs 3 - M etropo litan a re a s - N onm etropo litan a re a s -
D un g a re e s-M etropo litan a r e a s ------N onm etropo litan a re a s -
W ashable se rv ic e a p p a re l -M etropo litan a r e a s ------N onm etropo litan a re a s -
W ork p a n ts -M etropo litan a re a s -N onm etropo litan a re a s - W ork sh ir ts -M etropo litan a r e a s ------
N onm etropo litan a re a s - T hread t r i m m e r s ------------------M etropo litan a r e a s ------N onm etropo litan a re a s -
Southwest G re a t L akes M iddle W est P a c ific
Alle s ta b lish
m ents
E stab lish m en ts with— A lle s ta b lis h m en ts
E stab lish m en ts with— A lle s ta b lish m en ts
E stab lish m en ts with— Alle s ta b lish m en ts
E stab lish m en ts with—M ajoritycovered
None o r m in o rity covered
M ajo ritycovered
None o r m in o rity covered
M ajo ritycovered
M ajo ritycovered
A verage ho u rly earn in gs 1
$2 .45 $2. 68 $2. 30 $2. 65 $2. 51 $ 2 .8 3 $2. 37 $2. 36 $3. 23 $3. 152.44 2. 67 2. 32 2.70 2.56 2. 86 - - 3. 23 3. 122.46 2. 69 2. 27 2. 53 2.41 2. 73 2. 32 2. 31 - -1.71 1,80 1.66 1 .85 1.81 2.00 1.73 1.76 1.88 1. 881.68 _ 1.69 2.01 1.92 - - _ - _1.75 1.88 1.61 1 .7 2 1.71 - 1 .72 1.74 - -1.76 - 1. 74 - - - 2 .49 2. 49 - -1.76 - _ - - - - _ _ -- - - - - - 2 .49 2.49 - -2. 63 2. 64 2. 62 2. 81 2. 66 3. 11 2. 54 2. 64 3. 20 3. 202.71 2. 68 2. 72 2 .9 2 2.82 - - - 3.42 3. 422. 55 2. 62 2.47 2 .7 3 2.48 3.05 2. 50 2. 61 - -1.98 2.08 1.91 1 .95 1.91 - 2 .06 2.09 - _2.03 _ 1.93 2 .03 2. 00 - - - - -1 .92 1 .96 1.89 - - - 2 .03 2. 06 - -1.69 1.71 1.68 1.87 1 .8 4 1 .94 1.82 1.82 1.85 1.851.65 - 1 .65 1.89 1.91 - - - 1 .85 1.851.74 1.73 1.75 “ “ - 1.81 1.81 " ■
1.87 1.90 1 .84 1 .76 1.63 1.93 1.951.75 _ 1.77 1 .63 _ 1.63 _ _ _ _2.03 _ - - - _ 1.87 1.87 _ _1.82 1. 69 1.93 1.95 1.95 1 .92 1.81 1 .82 1 .93 1.931.78 1. 64 1.89 1.99 2.07 1.65 - - 1 .85 1.851.85 1. 74 1.97 1.90 1.80 2 .06 1.81 1.82 _ _1.83 1. 83 1.83 - - - 2. 25 2. 34 - _1.83 - 1 .83 - - - - - - _1.84 1. 83 - - - - 2. 21 _ _ _1.79 1.81 1.77 1 .8 4 1.85 1 .8 4 1.83 1.83 1.93 1 .931.76 1. 77 1.75 1 .83 1.88 1.75 - _ 1.91 1.911.82 1. 83 1.80 1 .86 1.81 1 .94 1.82 1 .82 _ _1.84 1. 84 1 .84 1.80 1.81 - 1.76 1.78 - _1.71 - _ 1.78 - _ _ _ _ _1.85 1. 83 1.88 - - - 1.73 1.75 - _
- - - 1 .85 1.89 1.80 1 .66 1 .66 1 .93 -- _ _ 1 .8 6 - - - _ 1.93 _- - - - _ - 1 .66 1.66 _ _
1.79 1.79 1.77 1 .8 2 1.82 - 1 .84 1 .8 4 1.93 1.931.79 - 1.80 - - - - - 1.91 1.911.79 1. 81 - - - - 1 .84 1 .8 4 - -1 .84 - 1 .85 - - - 1.97 1.98 - -1.81 _ 1 .82 - - - - - - _
_ _ _ _ - 1.86 1.87 _ _1.79 _ 1.78 - - - - - - _1.78 - 1.78 - - - - - - -
” * " " ' " “
1 E xcludes p rem u im pay fo r ov e rtim e and for w ork on w eekends, ho lidays, and la te sh ifts .2 Includes da ta fo r reg ion s in addition to those shown sepa rate ly .3 Includes da ta fo r w o rk e rs in c lass ifica tio n s in addition to those shown se p a ra te ly .NOTE: D ashes ind icate no d a ta rep o rted o r data that do not m eet publication c r i te r ia .
Digitized for FRASER http://fraser.stlouisfed.org/ Federal Reserve Bank of St. Louis

T a b le 7. O ccu p a tion a l A verages: B y L abor-M anagem ent C on tract C overa g e and E stablishm ent Size
(Num ber and averag e s tra ig h t- t im e hourly earn ings 1 of w orkers in se lected occupations in w ork cloth ing m anufac tu ring e s tab lish m en ts by lab o r-m an ag em en t c o n tra c t coverageand s ize of e stab lish m en t, United S ta tes and se lec ted reg io n s , F e b ru a ry 1968)
Sex, occupation , and size of e s tab lish m en t
MenC u tte rs , m a c h in e ----------------
20—249 w o rk e rs ---------------250 w o rk e rs o r m o r e ------
J a n i to r s -------------------------------20—249 w o rk e rs ---------------250 w o rk e rs o r m o r e ------
P r e s s e r s , fin ish , m achine -20—249 w o rk e rs --------------250 w o rk e rs o r m o r e ------
R epa irm en , sew ing m achine '20—249 w o r k e r s --------------250 w o rk e rs o r m o r e ------
S p re a d e rs ----------------------------20—249 w o rk e rs ---------------250 w o rk e rs o r m o r e ------
W ork d i s t r i b u t o r s ---------------20—249 w o rk e rs ---------------250 w o rk e rs o r m o r e ------
WomenF o ld e rs , g a r m e n t -------------------
20—249 w o rk e rs -------------------250 w o rk e rs o r m o r e ---------In sp e c to rs , f in a l ---------------------
20—249 w o rk e rs -----------------250 w o rk e rs o r m o r e ---------P r e s s e r s , f in ish , m a c h in e -----
20—249 w o rk e rs -----------------250 w o rk e rs o r m o r e ---------Sew ing-m achine o p e ra to rs 3 —
20—249 w o rk e rs -------------250 w o rk e rs o r m o r e -----D u n g a re e s---------------------------
20—249 w o rk e rs --------------250 w o rk e rs o r m o r e -----W ashable se rv ic e a p p are l —
20~249 w o rk e rs --------------250 w o rk e rs o r m o r e -----W ork p a n t s ------------------------
20~249 w o r k e r s -------------250 w o rk e rs o r m o r e -----
W ork s h i r t s ------------------------20—249 w o rk e rs -------------250 w o rk e rs o r m o r e -----
T hread t r i m m e r s --------------------20—249 w o r k e r s ------------------250 w o rk e rs o r m o r e ---------
United States 2 M iddle A tlantic B o rd er S ta tes S outheastAll E stab lish m en ts with- A ll
E s ta b lish m en ts w ith— All E stab lish m ents w ith— All E stab lish m en ts with—
e s ta b lish m ents M ajority covered None o r
m in o rity coverede s ta b lish
m en ts M ajo ritycovered
e s ta b lish m en ts M ajo ritycovered
None o r m in o rity covered
e s ta b lish m ents M ajo rity
coveredNone o r m in o rity cov eredN um ber
ofw o rk e rsA veragehourlyearnings
N um berofw orkers
A veragehourlyearnings
N um berof
w orke rsA veragehourlyearn in gs A verage h o u rly earn ings
927 $2. 45 473 $2 .56 454 $2. 33 $2. 87 $2 .89 $2. 33 $2. 25 $2. 39 $2. 25 $2. 50 $2. 19575 2. 38 259 2.49 316 2. 30 2. 87 2. 89 2. 27 2. 25 2. 30 2. 13 2. 36 2. 12352 2. 55 214 2. 64 138 2 .4 2 _ - 2.41 2. 26 2. 58 2. 40 2. 52 2. 32471 1.70 213 1.74 258 1.66 - - 1.65 1.65 1.66 1. 65 1.69 1. 64234 1. 67 82 1.71 152 1. 65 - - 1 .66 1.63 1.70 1. 64 1 .64 1. 64237 1.72 131 1.76 106 1.67 _ - 1.65 1.65 1 .6 4 1. 67 1.71 1.65546 2.01 225 2. 20 321 1. 88 - - 1.98 - 1.85 2.06 2 .1 4 1.96168 2.07 43 2. 38 125 1 .9 6 _ - 1.81 - 1.81 2. 12 _ 2 .06378 1.98 182 2.16 196 1. 82 _ - 2. 18 - 1 .9 4 2 .04 2. 12 1.89698 2. 57 291 2.63 407 2. 53 2 .9 3 3.05 2. 38 2.40 2. 36 2. 53 2. 59 2. 51335 2. 59 104 2. 68 231 2. 56 2. 88 3.01 2.49 2. 55 2.45 2. 62 3.02 2. 57363 2. 55 187 2.61 176 2.49 - - 2. 28 2. 28 2. 29 2.45 2.49 2.43474 1.97 209 2.01 265 1 .94 _ - 2 .03 - 2 .0 4 1.89 1 .84 1.91246 1.88 88 1.96 158 1 .83 _ _ 1.79 - 1 .75 1.80 - 1. 82228 2.07 121 2.04 107 2. 10 _ - 2. 24 - 2. 38 1.98 1.90 2 .03
1,027 1.72 444 1.74 583 1.70 1. 70 1.70 1.67 - 1 .68 1.71 1 .7 4 1.71484 1. 72 164 1.73 320 1.71 1.70 1.70 1.69 - 1 .68 1. 71 1.72 1.71543 1.72 280 1.75 263 1. 68 " “ 1.66 1.68 1.72 1.75 1. 70
329 1.83 149 1.89 180 1. 78 1.75 1. 80 1 .84 1.78155 1.78 43 1.81 112 1.77 _ - _ - - 1. 77 1.76 1.78174 1.88 106 1.93 68 1.81 _ - _ - - 1. 83 1.88 1.782,684 1.84 1,203 1.81 1,481 1 .8 4 1.69 1.69 1.81 1. 82 1.79 1.85 1.98 1. 81
1,341 1.83 401 1.82 940 1 .84 1.69 1.69 1.82 1.99 1.76 1. 80 1.82 1.801,343 1.85 802 1.85 541 1. 84 _ - 1.80 1.77 1.83 1.91 2 .03 1 .8 31,036 1.88 375 1.94 661 1 .8 4 _ - 1 .92 - 2.07 1.85 1.98 1.81
343 1.85 70 2.15 273 1. 78 _ - 1.81 - 1 .85 1. 77 2.08 1.70693 1. 89 305 1.89 388 1. 89 - - 1 .94 - - 1.90 1.96 1.8744 ,002 1.82 21,239 1.84 22,763 1.79 1.87 1. 87 1.80 1.79 1.81 1.82 1.89 1. 8020,630 1.80 7,436 1.82 13,194 1.79 1.89 1.89 1.79 1.78 1.80 1.79 .1.84 1.7923 ,372 1.83 13,803 1.86 9,569 1. 80 _ - 1.81 - 1 .82 1.85 1.90 1. 81
9,657 1 .84 4,962 1.85 4, 695 1. 82 _ - 1 .80 - 1 .8 3 1. 88 2.00 1.814 ,774 1.81 1,825 1.82 2,949 1. 80 _ - 1.80 - 1 .83 1. 78 - 1 .774 ,883 1.87 3,137 1.87 1,746 1.86 _ - 1.80 _ 1.83 1.98 2.00 1 .9 22,837 1.77 1,563 1.80 1,274 1. 74 1 .85 1.85 - - - 1. 71 - 1.712,281 1.75 1,319 1.75 962 1 .7 6 1 .85 1.85 _ - - 1.71 - 1.71
556 1.84 _ - _ - - - - - - - - -16 ,923 1.81 8,966 1.83 7,957 1. 78 1.80 - 1 .79 1.79 1.78 1. 80 1.87 1.77
6,113 1.79 2,095 1.84 4,018 1.76 1 .83 - 1 .76 - 1.77 1.78 . 1.86 1. 7710,810 1.82 6,871 1.83 3,939 1.79 - - 1.81 - 1.79 1.81 1.87 1.79
5,255 1.85 1,895 1.87 3,360 1 .84 - - - - - 1. 84 1.83 1 .8 42,972 1.84 684 1.85 2,288 1. 83 _ - - - - 1 .84 1.87 1 .8 42,283 1.87 1,211 1.88 1,072 1. 86 - - - - - 1 .82 1.81 1 .8 4
504 1.81 189 1.80 315 1. 81 1 .7 3 1.69 1.73 - 1. 70 1.86 1.86 1. 87218 1. 72 80 1.75 138 1.70 1. 73 1.69 1.66 - 1 .66 1.73 - 1 .65286 1.87 109 1.84 177 1.89 “ " " " ” 1.94 “ 1.99
See footnotes a t end of table.
Digitized for FRASER http://fraser.stlouisfed.org/ Federal Reserve Bank of St. Louis

Table 7. Occupational Averages: By Labor-Management Contract Coverage and Establishment Size— Continued
(Number and average straight-time hourly earnings1 of workers in selected occupations in work clothing manufacturing establishments by labor-management contract coverageand size of establishment, United States and selected regions, February 1968)
Southwest Great Lakes Middle West Pacific
Sex, occupation, and size of establishment
Men
Cutters, machine-----------------------20—249 workers --------------------250 workers or m ore ------------
J anito r s ----------------- —20—249 w ork ers-----------------—250 workers or m ore -------------
Pressers, finish, m achine--------20—249 workers----------------------250 workers or m ore ------------ -
Repairmen, sewing m achine------20—249 w ork ers-----------------—250 workers or m ore-------------
Spreaders -----------------------------------20—249 workers ---------------------250 workers or m ore -------------
Work distributors-----------------------20-249 workers----------------------250 workers or m ore -------------
Women
Folders, garment-----------------------20—249 workers ---------------------
Inspectors, final------------------------20—249 workers----------------------250 workers or m ore -------------
Pressers, finish, m achine--------20—249 workers ---------------------250 workers or m ore -------------
Sewing-machine operators 3 -------20—249 workers------------------250 workers or m ore --------
Dungarees------------------------------20—249 workers------------------250 workers or m ore--------
Washable service apparel------20—249 workers------------------250 workers or more---------
Work pants -----------------------------20—249 workers------------------250 workers or m o re --------
Work shirts----------------------------20—249 workers------------------250 workers or m o re ------ —
Thread trim m ers------------------------20—249 workers ---------------------250 workers or m ore -------------
All E stab lish m en ts w ith— All E sta b lish m e n ts with— AllE stab lish m en ts with— All
E stab lish m en ts with—e s ta b lish
m en ts M ajoritycovered
None o r m in o rity covered
e stab lish *m en ts M ajo rity
coveredNone o r m in o rity covered
e s ta b lish m en ts M ajo rity
coverede s ta b lish
m en ts M ajo ritycovered
A verage h o u rly earn in gs 1
$2 .45 $ 2 . 6 8 $2. 30 $2. 65 $2 .51 $ 2 .8 3 $2. 37 $2. 36 $3. 23 $3. 152 . 2 9 _ 2 . 2 2 2 . 6 8 2 .4 6 2. 83 2 . 28 2 . 26 3. 37 3.072.62 2.70 2.50 _ - - 2 . 60 2 . 6 0 3. 17 3. 171.71 1.80 1 . 6 6 1.85 1.81 2 . 0 0 1.73 1 .76 1 . 8 8 1 . 8 81.64 - 1.63 1 .94 1.89 2 . 0 0 1.70 1 .7 3 - -
1.76 1.84 1.70 1.78 1 .78 _ 1.83 1 .83 1 . 8 8 1 . 8 81.76 _ 1 .74 _ - - 2 . 4 9 2.49 - -
- - _ - - - 2.49 2.49 - -1.75 - 1 .7 4 - - - - - - -2. 63 2.64 2 .62 2.81 2 . 6 6 3. 11 2. 54 2. 64 3. 20 3.202. 55 _ 2.55 2 .9 4 2 .7 4 3. 11 2 .43 2. 54 - -
2. 67 2 . 6 6 2 . 6 9 2 . 6 0 2 . 60 _ 2 .82 2 .82 3. 15 3. 151 . 9 8 2.08 1.91 1.95 1.91 - 2 .06 2.09 - -1 .82 _ 1.81 1 .92 1.85 - 2 . 0 2 2 .0 4 - -2 .09 2 . 1 0 2.06 _ - - - - - -1.69 1.71 1 . 6 8 1.87 1 .8 4 1.94 1.82 1.82 1.85 1.851.70 _ 1.70 1.95 _ 1 .94 1.80 1.80 _ -1.69 1.71 1 . 6 6 ■ “ " 1 .83 1.83 1 . 8 6 1 . 8 6
1.87 1 . 9 0 1 .8 4 1.76 1. 63 1 .95 1.951.85 _ 1.85 1.63 _ 1. 63 _ - - -1 . 82 1.69 1.93 1.95 1.95 1 . 9 2 1.81 1 .82 1 .93 1.931.93 - 1 .96 1.87 1.81 1 . 9 2 1.79 1.80 1.71 1.711.74 1.67 1.87 2.07 2.07 - 1 . 8 8 1 . 8 8 1 .9 4 1 .9 41.83 1.83 1.83 _ _ _ 2. 25 2. 34 _ _
1.82 . 1.82 _ _ - 2.17 2 . 28 _ _
1.84 1.83 1 .8 4 _ _ - - - _ _
1.79 1.81 1.77 1 .8 4 1 .85 1 .8 4 1.83 1.83 1.93 1 .931.79 - 1.77 1 .83 1 .82 1 .84 1.78 1.77 1 . 8 8 1 . 8 61.79 1.81 1.76 1.87 1.87 - 1.93 1.93 1 .9 4 1 .941.84 1.84 1 .8 4 1.80 1.81 - 1.76 1.78 . _
1.84 - 1 .8 4 1.80 1.81 - 1.72 - - -
1.84 1.84 _ - - - _ - - _
_ - - 1.85 1.89 1.80 1 . 6 6 1 . 6 6 1 .9 3 -
- - - 1.79 - 1.80 1 . 6 6 1 . 6 6 1.93 -- • - - - - - - _
1.79 1.79 1.77 1 .82 1 .82 - 1 .8 4 1 .8 4 1.93 1.931.77 - 1.73 - - - 1.85 1.85 - -
1.79 1.78 1 .83 1.82 1 .82 - - 1.94 1.941.84 - 1.85 - - - 1.97 1.98 - -
1.79 - 1.79 - - - 1 . 8 6 1.87 - -
1 . 8 8 - 1.90 - - - - - - -
1.79 - 1. 78 - - - - - - -
1. 72 - 1.72 - - - - - - -
1.83 " 1 .82 " “ - "’
"
1 Excludes premium pay for overtime and for work on weekends, holidays, and late shifts.2 Includes data for regions in addition to those shown separately.3 Includes data for workers in classifications in addition to those shown separately.
NOTE: Dashes indicate no data reported or data that do not meet publication criteria.
Digitized for FRASER http://fraser.stlouisfed.org/ Federal Reserve Bank of St. Louis

Table 8. Occupational Averages: By Major Product0 )
(N um ber and ave rag e s tra ig h t- t im e hourly earn ings 1 of w orkers in se lec ted occupations in w ork clothing m anufac tu ring e s tab lish m en ts by m a jo r p rod uc t,United States and se lec ted reg io n s , F e b ru a ry 1968)
United S ta tes 2 B o rd er States Southeast Southw est M iddle W est P ac ific United S ta tes 2 S outheastSex and occupation N um ber
ofw o rk e rsA veragehourly
earn in gsN um ber
ofw orke rs
A veragehourlyearnings
N um berof
w orke rsA veragehourly
earn ingsN um ber
ofw orke rs
A veragehourlyearn in gs
N um berof
w o rk e rsA veragehourly
earn in gsN um ber
ofw o rk e rs
A veragehourlyearn in gs
N um berof
w o rk e rsA veragehourlyearn in gs
N um berofw o rk e rs
A veragehourlyearn in gs
Men
W ork pan ts W ork sh ir ts
C u tte rs , m a c h in e ----------------J a n ito rs ------------------------------P r e s s e r s , f in ish , m achine - R epa irm en , sew ing m achineShipping c le rk s -------------------S p re a d e r s ---------------------------Stock c l e r k s ------------------------W ork d is t r ib u to r s ----------------
345 23880346 300 113 186 119 487
$2. 451.70 2. 35 2.01 2. 62 2.06 1.99 1.881.70
712912
100262922
$2. 40 1.68 2. 38 1.96 2. 33 2 .04 1.88
60 63
1029233
140106
327352
195
$2. 221. 652. 14 2.01 2.49 2.09 1 .95 1 .84 1.68
85742578118196333
141
$2. 501 .73 2. 58 1 . 822 .7 4 1 .98 2 .07 1.91 1. 68
38 $ 2 .2 420 1.717 2 .4 42316141441
2. 60 1 .7 6 2.02 1.99 1 .82
3511
1110
26
$3. 171.88
3. 15 2.71
1.85
635527
$2. 51 1.70 2. 38
37 $2 .3835 1 .661 6 2 .19
7128522384
2. 51 1 .95 1.87 1 .85 1 .79
492234863
2.461.901.75 1.701.76
WomenF o ld e rs , g a rm e n t--------- -----R epairw om en, g a r m e n t------In sp e c to rs , f in a l ----------------P r e s s e r s , f in ish , h a n d ------P r e s s e r s , fin ish , m achine ■ Sew ing-m achine o p e ra to rs 3
W ork p a n ts ---------------------W ork s h i r t s -------------------
U n d e rp re s se rs , m achine —
Men
143141
1,11056
79019,50815 ,674
1,52741
1.841.74 1.81 1.821.85 1.81 1.81 1.811.75
14143
752,1831,791
1. 77 1 .742.03 1.81 1.79
652937124
3396,3815,017736
20
1 .7 6 1. 74 1 .82 1 .93 1 .82 1 .80 1.80 1.80 1 .65
4062392301
6,6995,133551
21
1 .95 1. 71 1 .78 641 .8 4 1 .80 1.80 1 .821 .85
1,8671,679
1.873194
1 .85 1,2621.85 1,133
1.80 1 .9 4
1 .941.93
8414
3597565
4,731435
3,56135
1 .9 4 1 .72 1.90 1.97 2 . 28 1.86 1.83 1.88 1.80
5811
2167124
3,258302
2,46728
1. 85 1. 70 1.89 1.98 2.06 1.84 1.80 1. 85 1. 77
United S ta tes 2 B o rd er S ta tes Southeast Southw est U nited S ta tes S outheastD ungarees W ashable se rv ic e a p p are l
C u tte rs , m a c h in e ----------------J a n ito rs — —------------------------M a r k e r s -----------------------------R epa irm en , sew ing m a c h in eShipping c le rk s -------------------S p re a d e r s ----------------------------Stock c l e r k s ------------------------W ork d is t r ib u to r s ----------------
2341044718573
12995243
$2 .4 2 1. 68 2. 37 2. 50 1 .97 2 .07 1.81 1 .73
824017604635
$2. 311. 642. 23 2.40 1.88 2. 15
87 69
6023 14 59 2124 23 83
$2. 32 1. 63 2.31 2 .53 2.01 2 .07 1 .85 1. 74
4031845
$2. 521. 692 . 28 2 .43
40 1.9355 1. 73
11525104132472271
$ 2 . 62 1.81 2 .92 2 .65 2.00 1.79 1.99 1 .72
22 $2 .1510 1.71211127
936
2. 66 2.101.78 1 .941.79
WomenR epairw om en, g a rm e n t-------In sp ec to rs , f in a l- —--------------P r e s s e r s , f in ish , h a n d -------P r e s s e r s , fin ish , m achine — Sew ing-m achine o p e ra to rs 3 -
D ungarees ----------------------W ashable se rv ic e a p p are l
U n d e rp re s se rs , m a c h in e -----
46 1 .79751 1 .868
2601.71 1 .83
15187
12310,602
8,9591.861. 83 3, 3311 .8 4 2 ,994 1.80 3,0091.80 2,573
1.711 .9 4 206
601.90 2,7391.90 2,185
1. 871.81 1 .79 1 .82
1932116
3,0772,745
1.79 1.68 1 .94 1 .751. 76
901410
273
1 .741.69 1. 641.70
941 1.7178 1. 73 42 1. 78
1 E xcludes p rem iu m pay fo r ov e rtim e and fo r w ork on w eekends, ho lidays, and la te sh ifts .2 Includes data fo r reg ion s in add ition to those shown sep a ra te ly .3 Includes da ta fo r w o rk e rs in c la s s ific a tio n s in addition to those shown sep a ra te ly .NOTE: D ashes ind icate no da ta rep o rted o r da ta that do not m ee t publication c r i te r ia .
Digitized for FRASER http://fraser.stlouisfed.org/ Federal Reserve Bank of St. Louis

Table 9. Occupational Earnings: Alabama
(Number and a v e rag e s tra ig h t- tim e hourly earn ings of w o rk e rs in se le c te d occupations in w ork clo th ing m an ufac tu ring e s ta b lish m e n ts , F e b ru a ry 1968)N um - A ver- N um ber of w o rk e rs rece iv in g s t ra ig h t- t im e h o u rly earn in g s of—
O ccupation and sex of ho urly $1.60 $1.65 $1.70 $1.75' $1.80 $1.85 $ 1 . 9 0 $1.95 $2 . 0 0 $2 . 1 0 $2 . 2 0 $2.30 $2.40 $2.50 $2.60 $2.70 $2.80 $2 . 9 0 $3.00 $3.10 $3.20 $3.30 $3.40 $3.50 $37oO $3.70w ork- under ande i s $1.65 $1.70 $1.75 $1.80 $1.85 $1.90 $1.95 $2 . 0 0 $2 . 1 0 $2 . 2 0 $2.30 $2.40 $2.50 $2.60 $2.70 $2.80 $2.90 $3.00 $3.10 $3.20 $3.30 $3.40 $3.50 $3.60 $3.70 over
A ll production w o rk e rs ----- 3, 038 $1. 90 21043 235 2 0 2 156 136 124 1 1 2 n o 198 183 129 94 87 51 30 35 26 23 24 13 14 5 2 4 2M en - - - ----- 368 2 . 09 77 46 29 2 2 15 13 6 9 2 1 14 13 5 9 8 4 1 0 1 6 1 0 15 7 6 5 _ 2 4 2W om en----------------------- 2 ,670 1. 87 966 189 173 134 1 2 1 1 1 1 106 1 0 1 177 169 1 1 6 89 78 43 26 25 1 0 13 9 6 8 - - - - -S e lected p roduc tion
occupationsA sse m b le rs ( 3 w om en
and 3 m e n ) 3 a / . . . 6 2 . 18 2 - 1 - - - - 1 - - - - - _ . _ . 1 _ _ 1 . _ _ _ _C u tte rs , macTune (34 m en
and 1 wom an) — 35 2.67 1 1 - - - 1 - 1 6 2 _ 3 _ 1 2 2 _ 1 2 3 3 3 . _ 2 1T im e ------ 1 1 2 . 1 9 1 1 - - - 1 - 1 4 - - - - _ 1 - _ 2 _ - _ _ _ _24 7 8 8 2 2 3 1 2 1 2 1 3 3 2
F o ld e rs , g a rm e n t (11w om en and 1 m a n ) 3 b /__ 1 2 1 . 80 2 4 - 1 2 - 1 - - 1 1In sp ec to rs , final 105 2. 05 29 5 5 4 2 2 2 4 9 1 2 7 4 7 3 1 3 _ . - 1 2 1 _ 1 _ 1W om en----------------------- 1 0 1 2 . 0 0 29 5 5 4 2 2 2 4 9 1 2 7 4 7 3 1 3 _ _ _ - 2 _ _ . _
Incentive 8 8 2. 05 1 6 5 5 4 2 2 2 4 9 1 2 7 4 7 3 1 3 _ _ _ - 2 _ _ _ - _Ja n ito rs (all t im e -
w o rk e rs )— — — —______ 26 1 . 6 6 1 0 7 4 4 1W nm An 8 1. 67 2 2 3 118 1 1
1 . 6 6 81
5 1 3 1XA a rlre re a f 1 . 98 4 2 1 j 1 1
M en 3 b~7” - 6 2 . 2 2 1 _ _ _ _ 1 _ 1 1 _ 1 _ 1 _ _ _ _ _ _ _ _ .P r e s s e r s , f in ish ,
m achine (men) (all in cen tive w o rk e rs ) ---------- 8 2.49 1 - - - - 1 - - - - 1 - 1 - 1 - - 1 2 . - _ . - - -
R epairm en , sew ingm achine (all m en)(all t im e w o rk e rs )______ 37 2. 54 - - - - - - 3 - 3 5 4 - 2 3 ■ - 4 4 3 2 2 1 1 - _ _ -
S ew ing-m achine o p e ra to rs(all incentive w ork e r s ) 4 . - . 2 , 206 1 . 8 8 809 125 154 108 99 1 0 0 89 8 8 142 132 99 81 63 39 16 17 1 1 1 2 1 0 6 6 _ * _
W om en____________ 2, 172 1. 87 808 124 150 107 98 99 89 85 136 128 95 79 62 38 15 1 6 1 0 1 2 9 6 6 - _ . _ _D ungarees (allwom en)---- ---------------- 436 2 . 0 2 90 14 2 0 1 6 18 2 2 28 28 34 32 36 28 26 16 8 4 4 6 4 2 - - _ _ - _O v era lls and in
d u s tr ia l g a rm en ts(all wom en) . — 436 1.87 163 32 27 31 23 13 1 1 14 30 19 19 19 9 1 0 2 9 1 - - 4 - - _ - - -
W ork pan ts----------------- 750 1.84 294 43 64 31 28 32 33 35 57 45 29 19 1 6 8 4 2 3 4 3 _ _ . _ _ _ _Women 722 1.83 293 42 63 30 27 31 33 32 54 41 25 17 15 7 3 1 2 4 2 _ _ _ _
S p re a d e rs (all m e n )_____ 2 0 2 . 06 2 3 5 2 1 - - 1 1 - - - 1 - - - 1 - - 1 1 - - 1 - -
T im e ____ _____________ 1 2 1.72 2 1 5 2 1Incentive — _ 8 2. 57 - 2 _ - - - - - 1 . _ - 1 - - - 1 _ _ 1 1 . _ 1 _ _
Stock c le rk s (all m en)29 1.70 13 2 4 4 5
W ork d is tr ib u to rs (all73 1 . 6 8 29 17 6 1 1 4 3 16 6 1.67 29 17 5 7 3 2 1 1
S elected officeoccupationsC le rk s , g e n e ra l (all
w om en)— — _______ 2 0 1.75 1 7 2 4 2 1 - 1 2C le rk s , p a y ro ll (all
1 6 1.79 4 3 3 1 2
1 E xcludes p rem iu m pay fo r o v ertim e and fo r w ork on w eekends, ho lidays, and la te sh ifts . A pprox im ate ly 85 p e rc e n t of the p rod uc tion w o rk e rs cov ered by the study w ere paid on an incentive b a s is .2 Includes 44 w o rk e rs tinder $ 1 .60.3 Insu fficien t da ta to w a rra n t pub lication of se p a ra te averages by m ethod of wage paym ent; (a) p redo m inan tly tim e w o rk e rs , o r (b) p redo m inan tly incentive w o rk e rs .4 Includes da ta fo r w o rk e rs in c la ss ific a tio n in addition to those shown se p a ra te ly .
Digitized for FRASER http://fraser.stlouisfed.org/ Federal Reserve Bank of St. Louis

Table 10. Occupational Earnings: California
(Num ber and av e rag e s tra ig h t- tim e hourly earn in gs 1 of w o rk e rs in se le c te d occupations in w ork c loth ing m an ufac tu ring e s ta b lish m e n ts , F e b ru a ry 1968)00
N um - A v e r- N um ber of w o rk e rs rece iv in g s tra ig h t- t im e h o u rly e arn in g s of-—O ccupation and sex of
agehourly $1.60 $ L 5 5 $1.70 $1.75 $1.80 $1.85 $ 1 . 9 0 $1.95 $ 2 . 0 0 $ 2 . 1 0 $2 . 2 0 $2.30 $2.40 $2.50 $2.60 $2.70 $2.80 $2 .W $ 3 ^ F $i :to $1720 $3730 $3 .40 $3.50 $3.60 $3770w ork - under ande rs ings $1.65 $1.70 $1.75 $1.80 $1.85 $1.90 $1.95 $ 2 . 0 0 $2 . 1 0 $2 . 2 0 $2.30 $2.40 $2.50 $2.60 $2.70 $2.80 $2.90 $3.00 $3.10 $3.20 $3.30 $3.40 $3.50 $3.60 $3.70 over
A ll p roduction w o rk e rs _ 1,685 $1. 94 2 1 1 651 65 80 71 1 0 2 77 80 153 93 56 59 46 28 28 18 3 1 1 1 0 2 2 1 1 0 2 2 6Men 161 2. 48 3 13 2 1 2 3 5, 4 2 26 1 0 4 6 3 3 6 5 2 7 5 2 2 0 _ 9 1 2 6W om en 1,524 1. 94 8 638 63 6 8 6 8 97 73 78 127 83 52 53 43 25 2 2 13 1 4 5 - 1 - 1 1 - -
Selected p roductionoccupationsA sse m b le rs (a ll
n/nrin pn ) a ( 7 1. 72 3 1 1 1 1C u tte rs , m achine (all 37 3. 23 1 1 1 1 1 7 1 17 3 3
Tim e - - 26 3 . 28 _ _ _ . _ _ . . _ _ _ 1 5 _ 17 _ _ _ 2In sp e c to rs , final (allwomen) 3 a / 69 1. 94 - 2 0 2 1 2 4 3 2 19 6 4 5 - - - 1 - - - - - _ - . . _
R epairm en , sewingm achine (all m e n ) --------(all t im e w o rk e rs ) --------- 9 3. 32 - - - - - - - - - - - - - - - - - - 3 - 2 - 2 - - 4 2Sew ing-m achine o p e ra to rs (all w om en ) 5 -------- 1, 167 1. 93 - 392 56 60 50 89 68 74 98 74 48 45 42 24 2 2 1 2 1 4 5 - 1 - 1 1 - -
Incen tive _ 1, 114 1. 93 - 384 56 60 50 77 68 74 86 53 48 45 42 24 2 2 1 2 1 4 5 _ 1 _ 1 1 _ _W ashable se rv ic e
a ppa rp 1 a j/ 188 1.93 47 7 8 1 0 28 1 2 1 0 19 28 4 5 3 4 2W ork pan ts"la ll incen
tive w o r k e r s ) ----------- 941 1. 93 - 323 47 50 39 59 54 61 79 44 48 40 37 2 0 18 1 0 1 3 5 - 1 _ 1 1 - _Shipping c le rk s (a ll men)
(all t im e w o rk e rs ) --------- 1 1 2 . 39 - - - - - - - - 3 - - 4 - - 1 3W ork d is tr ib u to rs (all
men) (a ll t im e - 25 1. 85 4 1 7 1 4 1 1 4 2
S elected officeoccupationsC le rk s , g e n e ra l (all '
w o m en )-------------------------- 19 2 . 28 1 1 1 2 4 2 1 2 3
1 E xcludes p rem iu m pay fo r ov e rtim e and fo r w ork on w eekends, holidays, and la te sh ifts . A pproxim ately 82 p e rce n t of the production w o rk e rs c ov ered by the study w ere paid on an incen tive b a s is .2 Includes 5 w o rk e rs under $ 1. 60.3 Insu ffic ien t data to w a rra n t pub lication of se p a ra te av e rag es by m ethod of wage paym ent; (a) p redom inan tly tim e w o rk e rs , o r (b) p redo m inan tly incen tive w o rk e rs .4 A ll w o rk e rs a t $3 . 70 to $3. 80.5 Includes data fo r w o rk e rs in c la s s if ic a tio n in addition to those shown se p a ra te ly .
Digitized for FRASER http://fraser.stlouisfed.org/ Federal Reserve Bank of St. Louis

lum b e rofo rk -irs
, 618724, 894
2721553817464429
11249521*975621351612
1881246454
57984975
38937362358654636327320347
Table 11. Occupational Earnings: Georgia
age s tra ig h t- tim e hourly earn in gs of w o rk e rs in se le c te d occupations in w ork clo th ing m an ufac tu ring e sta b lish m e n ts , F e b ru a ry 1968)A ver- N um ber of w o rk e rs rece iv in g s tra ig h t- t im e h o u rly e arn in g s of—
Agehourly
ings 1
$176$and
under$1.65
$1.65
$ 1.70
$1.70
$1.75
J T U
$1.80
$175$
$1.85
$1.85
$1.90
$179$
$1.95
$ T 3$
$2.00
$27$$
$2.10
$2710
$2.20
$2720
$2.30
$230-
$2.40
$ O o
$2.50
$ 2 3 $
$2.60
$ 2 3 $
$2.70
$277$
$2.80
$275$
$2.90
$27$$
$3.00
$37$$
$3.10
$371$
$3.20
$372$
$3.30
$373$
$3.40
$3.40
$3.50
$ 3 3 $
$3.60
$375$andover
$1. 81 *1839 356 292 299 390 260 192 149 268 156 115 88 64 44 24 27 9 7 5 3 1 4 3 7 162. 00 127 86 6.7 28 70 41 31 17 52 41 34 19 20 19 13 13 5 4 3 3 1 4 3 7 161. 78 1712 270 225 271 320 219 161 132 216 115 81 69 44 25 11 14 4 3 2
'”
' ' '
1.86 6 4 4 1 2 4 2 1 1 j1. 93 2 2 4 _ 1 2 4 _ 2 1 _ _ 1 1 _ 1 _ _ _ _ _ _ *2. 24 - - _ 2 1 4 1 _ 8 11 7 2 8 6 52. 23 - - - 2 1 - 1 _ 7 11 2 8 1 52. 26 - ' ' - 4 " - 1 - 5 2 - 5
1. 77 15 1 12 2 9 1 3 2 1
1. 77 14 - 1 12 2 9 1 3 21. 77 10 " 11 1 1 1 3 2
1. 73 2 4 1 21. 78 121 18 16 12 15 7 3 10 18 9 6 2 5 3 1 2 _ 1 _ _ _ _ _ _1. 65 40 - - 4 4 41. 82 81 18 16 8 11 3 3 10 18 9 6 2 5 3 1 2 _ 1 _ _ _ _ _ _ _1. 64 31 15 6 1 31. 61 19 21. 66 12 13 6 1 32. 37 2 - _ _ 1 _ _ _ 1 _ 4 _ » _ 2 4 22. 27 2 - _ _ 1 _ _ _ 1 _ 4 _ _ _ _ 2 21. 84 67 14 10 12 6 10 16 11 14 4 8 5 9 1 11. 80 55 6 7 10 3 6 10 6 9 1 2 3 5 11.92 12 8 3 2 3 4 6 5 5 3 6 2 4 _ 1 . _ _ _ _ _ _1.96 12 " 3 2 3 4 6 5 3 3 6 2 4 1
2. 65 3 3 I 1 5 6 5 2 3 3 7 1 2 4 2 7 21. 78 1293 203 166 208 279 175 129 104 164 85 55 52 28 19 10 6 4 2 2 _ _ _ _ _ _1. 77 1293 201 166 208 279 174 127 104 162 85 55 52 28 17 10 6 4 2 2 _ _ _ _ _ _1. 74 - - 24 2 8 41. 78 1293 201 142 206 271 170 127 104 162 85 55 52 28 17 10 6 4 2 2 - - - - - -
1. 81 142 24 16 26 20 20 30 16 32 8 10 10 4 _ 2 21. 81 142 22 16 24 20 20 30 16 32 8 10 10 4 - 2 2
1. 70 412 36 36 38 36 20 10 16 10 24 4 6 _ 4 2 _ _ _ . _ . .1. 70 412 36 18 38 36 20 10 16 10 24 4 6 - 4 2
1. 80 548 65 71 78 162 73 59 39 80 47 35 30 18 10 4 2 2 2 2 . _ _ . .1. 80 548 65 71 78 162 72 57 39 78 47 35 30 18 8 4 2 2 2 2 - - “ - - -
1. 78 98 31 29 51 27 39 15 20 16 6 4 4 6 1
Digitized for FRASER http://fraser.stlouisfed.org/ Federal Reserve Bank of St. Louis

Table 11. Occupational Earnings: Georgia— Continued
(Number and average straight-time hourly earnings 1 of workers in selected occupations in work clothing manufacturing establishments, February 1968)8
Num- A v er- Number o f w orkers receiving straight -tim e hourly earnings of—
Occupation and sex ofage
hourly $1.60 $1.65 $1.70 $1775 $1.86 $ 0 5 ■$OoT $1.95 $2.00 $2.10 $2.20 $2.30 $2.40 $2.50 $2.60 $2770 $2.80 $2.90 $3.00 $37TO $3.20 ^ X 3 0 $3.40 $3.60w ork- earn- under - - - “ - - - - " - - " - “ *■ - - andeis ings $1.65 $1.70 $1.75 $1.80 $1.85 $1.90 $1.95 $2.00 $2.10 $2.20 $2.30 $2.40 $2.50 $2.60 $2.70 $2.80 $2.90 $3.00 $3.10 $3.20 $3.30 $3.40 $3.50 $3.60 over
Selected productionoccupations— Continued
Shipping clerks (all tim e-w orkers) _____ ______________ 26 $2. 11 - 2 - - 6 - 2 - 6 2 2 - 4 - - - - - 2 - - - - - -
M en __________________________ 22 2. 16 - 2 - - 4 - - - 6 2 2 - 4 - - - - - 2 - _ . _ _ _Spreaders (all m en )____________ 49 1. 95 7 1 4 8 4 3 5 2 1 6 1 2 2 1 1 - - - - 1 - - - -
T im e ________________________ 29 1. 84 7 1 - 6 4 3 2 - - 4 - 2In cen tiv e ------------------------------- 20 2. 12 - - 4 2 - - 3 2 1 2 1 - 2 1 - 1 - - _ - 1 _ - . _
Stock clerks (all tim e-w orkers) __ ___ __ — ____ 55 1. 83 9 6 4 1 16 2 4 1 4 6 1 - - 1
10 1. 66 6 2 2M en___________ — ------------ 45 1. 87 3 6 2 1 14 2 4 1 4 6 1 _ _ 1 _ _ _ _ _ _ _ . _ _ .
Thread trim m ers (28 women30 1. 68 18 4 1 1 1 2 2 1
TnronHvo 26 1*. 66 18 4 1 1 1 1U nderpressers, hand (all
14 1. 93 3 4 1 3 3"W n m a n 10 1. 81 3 4 1 1 1
U nderpressers, machine(all incentive w orkers)(6 women and 6 m e n )_________ 12 1. 72 8 4
Watchmen (all men) (alltim ew ork ers )-------------------------- 13 1. 68 5 5 - - 3
Work distributors (all tim e-141 1. 69 53 26 31 9 13 4 2 1 1
W om en______________________ 33 1. 65 12 11 6 4M en---------------------------------------- 108 1. 70 41 15 25 5 13 4 2 1 - 1 - 1
Selected officeoccupations
Plarlrc jtpnpra 1 81 1. 89 10 4 8 11 3 12 2 3 15 6 2 3 276 1. 88 8 4 8 11 3 12 2 3 13 6 2 2 _ 2
Clerks, payroll (all w om en)___ 25 2. 00 2 6 2 1 2 2 4 4 2
1 Excludes premium pay for overtime and for work on weekends, holidays, and late shifts. Approximately 85 percent of the production workers covered by the study were paid on an incentive basis.2 Includes 20 workers under $ 1. 60.3 Includes data for workers in classification in addition to those shown separately.4 Insufficient data to warrant publication of separate averages by method of wage payment; predominantly incentive workers.
Digitized for FRASER http://fraser.stlouisfed.org/ Federal Reserve Bank of St. Louis

Table 12. Occupational Earnings: Indiana
(Number and average straight-time hourly earnings 1 of w orkers in selected occupations in w ork clothing manufacturing establishm ents, February 1968)
Occupation and sex
All production w o rk e rs_____ __M en__________________________
Selected production occupations
Cutters, m ach ine.-------—-----------M en________________ _________
Incentive---- ------------- --------Inspectors, final (all
w om en )____________________ ___Incentive____________________
J anito r s___ - _______ __________Women (all tim ew orkers)-----Men (all tim ew orkers)---------
M arkers (13 men and 2w om en)2 —__________________
Repairm en, sewing machine (all men) (all tim ew orkers) —
Sewing-machine operators(all incentive w o rk e rs )3______
Women (all incentivew ork ers)________________
O veralls and industrial garments (all incentive
Women (all incentivew ork ers)_____________ —
Work pants (all women)(all incentive w o rk ers )____
Shipping clerks 2 ----------------------Men 2 _____________________ __
Spreaders (26 men and 3w om en)2 ---------------------------------
Stock clerks (33 men and 9
Time,_________________________Work distributors----------------------
M en ---------------------------------------T im e______________________
Selected o ffice occupations
C lerks, general (all women)-----C lerks, payroll (all women)
Num- A ver- Number o f w orkers receiving straight-tim e hourly earnings of—
ofage
hourly $ n so T T t t $1.70 $1.75 $T7$o $1785 $1.90 $1.95 $2.00 $2.10 $2.20 $2.30 $2.40 $2.50 $2.60 $2.70 $2.80 $2.90 $3.00 $3.10 $3.20 $1730 $3.40 $3.50w ork - earn- $1.60 under and
ers mgs $1.65 $1.70 $1.75 $1.80 $1.85 $1.90 $1.95 $2.00 $2.10 $2.20 $2.30 $2.40 $2.50 $2.60 $2.70 $2.80 $2.90 $3.00 $3.10 $3.20 $3.30 $3.40 $3.50 over
2, 163 $1 93 64 503 120 176 140 107 86 146 92 200 123 94 70 70 46 30 17 29 15 5 9 10 7 2 2242 2 20 - 14 9 22 15 25 15 11 6 15 11 12 9 13 8 7 1 19 7 2 6 9 5 _ 1
1,921 1 89 64 489 111 154 125 82 71 135 86 185 112 82 61 57 38 23 16 10 8 3 3 1 2 2 1
36 2 62 2 1 3 2 3 2 4 3 2 4 2 3 3 1 135 2 63 - - - _ 2 - _ - 1 3 2 3 1 4 3 2 _ 4 2 _ 3 3 1 _ 111 2 88 “ - - - 2 - - - - - 1 - - - - 1 - 1 - - 3 1 1 - 1
116 2 07 _ 17 4 7 5 6 3 2 5 21 6 5 12 3 8 7 3 2 . _ _ _ _ _ _
115 2 08 - 17 4 6 5 6 3 2 5 21 6 5 12 3 8 7 3 2 _ > _ _ _ _ _24 1 78 _ 6 6 4 2 1 . _ _ 1 2 2
6 1,,69 - 1 3 _ 218 !•, 81 - 5 3 4 - 1 - - 1 2 2
15 2.,78 - - - - - 1 1 - - - - 1 J - - 1 - 4 - - - 4 2 - -
26 2.,70 - - - - - - - 1 I - - - 1 3 4 1 1 7 3 1 3 - - - -
1,431 1.,£8 - 444 92 129 83 50 58 103 54 123 74 61 45 41 26 13 12 6 8 2 2 1 2 1 1
1,427 1., 88 - 443 92 128 83 49 58 103 54 122 74 61 45 41 26 13 12 6 8 2 2 1 2 1 1
260 1.,85 - 84 17 22 22 6 10 17 12 20 20 14 8 5 1 - - 1 1 - - - - - -
256 1.,85 - 83 17 21 22 5 10 17 12 19 20 14 8 5 1 - - 1 1 - - - - - -
380 1.,82 _ 163 29 22 18 16 18 16 13 30 11 17 8 4 4 3 2 2 1 2 1 _97
2.2.
, 19 13
" - - - - 1 33
“ 22
11
- - - “ “ 21
- - - - -
29 2., 00 - 1 - - 1 11 1 4 3 2 - - 1 - 1 3 - 1 - - - - - - -
42 1., 86 _ 1 _ 7 3 14 7 1 1 2 4 _ 1 141 1.,86 _ 1 _ 7 3 14 7 1 _ 2 4 _ 1 183 1., 83 _ 1 6 11 20 10 8 7 6 11 1 1 _ 126 1., 85 _ _ _ 4 5 6 6 1 _ 2 _ 1 _ 125 1., 82 “ " 4 5 6 6 1 ~ 2 1
45 2., 10 2 1 7 2 9 7 5 2 3 4 1 1 17 2., 04 2 2 2 1
‘ ' '
1 Excludes prem ium pay for overtim e and for work on weekends, holidays, and late shifts. Approxim ately 79 percent of the production w orkers covered by the study w ere paid on an incentive basis.
2 Insufficient data to warrant publication of separate averages by method of wage payment; predominantly tim ew orkers.3 Includes data for w orkers in classification in addition to those shown separately.
Digitized for FRASER http://fraser.stlouisfed.org/ Federal Reserve Bank of St. Louis

Tabic 13. Occupational Earnings: Kentucky
(Number and average straight-tim e hourly earnings1 of workers in selected occupations in work clothing manufacturing establishm ents, February 1968)
8
Occupation and sex
A ll production w o rk e rs --------------------------M e n --------------------------------------------------------
Selected production occupations
Cutters, machine (all m e n )-------------------T i m e -----------------------------------------------------In cen tive----------------------------------------------
F olders, garment (10 women and2 men) 2 ----— ----------------------------------------
Incentive---------— -----------------------------Hand (10 women and 1 man)
(all incentive w ork ers)-------------------Garment repairmen (all women) 3 --------Inspectors, final (all women)--------— —
Incentive------------------------------------------------Janitors-------------------------------------------------------
Women (all tim ew orkers)------------------Men (all tim ew orkers)-----------------------
M a rk e rs------------------------ *----------------------------Men 3-------------------------------------------------------
P re sse rs , finish, machine--------------------Women (all incentive w orkers)--------M e n --------------------------------------------------------
T im e-------------------------------------------------Repairmen, sewing machine (all men)-
T im e-------------------------------------------------------Sewing-machine operators 2-------------------
W om en ---------------------------------------------In cen tive------------------------------------
Dungarees (all women)(all incentive w ork ers)-------------------
Women (all incentive workers) —Shipping clerks -----------------------------------------
Men (all tim ew orkers)-----------------------Spreaders (all m e n )---------------------------------
In cen tive---------------------------- —---------------U nderpressers, m achine-----------------------
M e n --------------------------------------------------------Incentive-------------------------------------------
Work distributors-------------------------------------Women (all tim ew orkers)------------------Men (all tim ew orkers)-----------------------
Selected office occupations
C lerks, g e n eral----------------------------------------W om en ---------------------------------------------------
C lerks, payroll (all w om en)------------------
Num - A ver- Number of workers receiving straight-tim e hourly earnings of—
ofage
hourly $1 . 6o $1.65 $1.7(5 $1775“ $1 . to $T. 85 $1 .90 $1 .95 $2 . 0 0 $2 . 1 0 $2 . 20 $2. 30 $2. 40 $2 .50 $2 . 60 $277() $2 . 80 $2 .96 $3.6o $3. lo $3. 20 $3 . 3o
work- earn- (1 . 60 under and$1.65 $1.70 $1.75 $1 .80 $1 .85 $1.90 $ 1 .95 $2 . 0 0 $2 . 1 0 $2 . 20 $2. 30 $2 .40 $2. 50 $2 . 60 $2 .70 $2 .80 $2 .9 0 $3 .00 $3. 10 $3. 20 $3. 30 over
4 ,7 8 5 $ 1 .8 1 133 1471 459 347 389 384 321 209 220 2 9 2 175 125 95 58 35 31 n 1 2 4 7 4 2 1537 1.9 8 1 99 35 35 33 42 32 16 2 1 55 17 22 43 35 18 17 6 3 2 1 1 2 1
4 ,2 4 8 1 .7 8 132 1372 424 312 356 342 289 193 199 237 158 103 52 23 17 14 5 9 2 6 3 "
80 2 . 2 1 2 2 3 4 ! 3 3 1 0 1 5 26 8 4 86 1 2. 24 - - - 2 - 4 1 3 - 8 - 5 2 2 7 3 6 - - _ _ _ _ _19 2 .1 3 - 2 - - 3 - - - 3 2 1 - 4 1 1 2 - - - - - - -
1 2 1 .9 2 _ 4 _ _ 2 _ 1 _ 2 2 _ 1 _ _ _ _ _ _ _ _ _1 1 1 .9 3 - - 4 - - 1 - 1 2 2 - 1 - - - - - - - - - -
1 1 1 .9 3 _ _ 4 _ _ 1 _ l _ 2 2 _ 1 _ _ _ _ _ _ _ _ _ _9 1 .7 3 - 2 - 2 3 2
258 1.7 9 - 65 35 28 32 27 16 1 0 9 2 2 1 1 - 1 - - - - 2 - - - - -253 1 .7 9 - 65 34 26 31 27 16 1 0 9 2 2 1 0 - 1 - - - - 2 - - - - -
57 1 .6 4 _ 41 3 9 1 1 _ 1 . 1 - - _ _ - . _ _ _ _ _ . -8 1.61 - 6 2
49 1 .6 4 - 35 1 9 1 1 - 1 - 1 - - - - - - - - - - - . -20 2 . 2 1 _ _ _ - - 1 3 1 - 3 - 1 3 5 3 - - - - - - - -19 2. 23 _ _ _ _ _ 1 2 1 - 3 - 1 3 5 3
119 2 . 0 1 _ 32 9 6 3 3 8 3 5 1 0 5 4 8 4 4 6 2 4 - 2 . 1 _80 2 . 00 _ 22 9 6 2 1 4 3 2 5 1 3 6 2 3 4 1 4 _ 2 _ _ .39 2 .0 3 _ 10 - - 1 2 4 - 3 5 4 1 2 2 1 2 1 - - - _ 1 -24 1 .9 8 _ 9 _ _ 1 2 3 _ - 3 - - - 2 - 2 1 - - - - 1 _58 2 .4 7 _ _ _ _ _ 2 _ 1 - 3 2 7 3 15 8 5 5 3 1 _ 1 1 156 2. 44 _ _ _ _ _ 2 _ 1 - 3 2 7 3 15 8 5 5 3 1 - - _ 1
3,5 98 1.7 9 1 6 1225 355 256 295 296 243 170 187 205 148 99 44 20 14 1 0 4 3 2 3 3 - -3,581 1 .7 9 1 6 1225 355 256 295 293 243 167 184 20.2 143 99 44 20 14 1 0 4 3 2 3 3 _ _3 ,5 6 6 1 .7 9 1 6 1 2 1 0 355 256 295 293 243 167 184 2 0 2 143 99 44 20 14 1 0 4 3 2 3 3 - -
1 ,8 2 4 1 .7 8 1 2 666 168 118 151 184 119 81 75 105 67 53 1 0 4 5 4 2 _ _ _ _ _ _865 1 .8 3 2 275 57 56 74 57 50 54 59 72 55 15 18 6 3 3 - 3 _ 3 3 _ _848 1 .8 2 2 275 57 56 74 54 50 51 56 69 50 15 18 6 3 3 _ 3 _ 3 3 - _
48 1 . 9 2 _ 3 5 2 1 0 5 6 _ 1 9 _ 1 3 _ 1 _ _ - I 1 _ _ _44 1 .9 3 _ 3 4 1 1 0 5 5 - 1 8 _ 1 3 _ 1 _ _ _ 1 1 _ _ _40 2 . 0 1 _ 4 1 1 - - 4 - 4 1 6 _ 2 5 31 2 1 . 9 8 - 2 - - - - 3 - 4 - - 1 - 2 - - - - - - - - -31 1 .8 9 - 6 2 1 4 1 2 7 1 2 - 3 - 2 - - - - - - - - -1 1 2 .0 8 - - - - 2 - - 4 - - - 3 - 2 - - - - - - - - .
7 2 .1 9 - - - - 2 - - - - - - 3 - 2 - - - - - - - - -92 1 .7 0 - 38 20 7 9 5 9 1 1 - - - - - 1 - - - - 1 - - -
8 1.8 9 - 2 1 - 3 _ 1 _ - - - - - - - - - - - 1 - - -84 1 .6 9 " 36 19 7 6 5 8 1 1 - “ " “ 1
58 1 .7 4 1 1 6 13 16 2 5 2 354 1 .7 2 - 1 1 6 13 15 2 5 - 236 1 .8 4 2 2 8 7 5 “ 3 2 1 2 4
1 Excludes premium pay for overtim e and for work on weekends, holidays, and late shifts. Approximately 86 percent of the production workers covered by the study were paid on an incentive basis.
2 Includes data for workers in classification in addition to those shown separately.3 Insufficient data to warrant publication of separate averages by method of wage payment; predominantly tim ew orkers.
Digitized for FRASER http://fraser.stlouisfed.org/ Federal Reserve Bank of St. Louis

Table 14. Occupational Earnings: Mississippi
(Number and average straight-tim e hourly earnings1 of workers in selected occupations in work clothing manufacturing establishm ents, February 1968)
Occupation and sex
Numberof
workers
A v er- Number of workers receiving straight-tim e hourly earnings of-age
hourly$1.60 $175? $1770 $ 1 .7? $1 .80 $175? $T790 $ 1 .95
oo£
$2710 $2720 $2730 $2740 $2750 $2760 $2770 $2 .80 $2790 $3 .00 $3. 1 0 $572o $575o $3 .40 $57?? $3 .60
earn- under “ and$1 .65 $1.70 $1 .75 $1.80 $1 .85 $1 .90 $1 .95 $2 . 0 0 $2 . 1 0 $2 . 20 $2. 30 $2 .40 $2 .50 $2 . 6 0 $2. 70 $2 . 80 $2 .90 $3 .00 $3 .10 $3. 20 $3. 30 $3 .40 $3.50 $3. 60 over
$1 .83 21834 432 321 312 284 271 177 2 1 2 318 230 177 126 78 48 29 26 15 1 1 9 7 3 8 3 52 . 0 1 90 48 44 33 42 2 2 18 9 40 32 24 1 2 1 2 13 13 1 2 1 1 5 6 5 3 3 1 2 51.81 1744 384 277 279 242 249 159 203 278 1 9 8 153 114 66 35 16 14 4 6 3 2
‘
5‘
1
'
1 .8 2 9 3 4 2 2 2 1 1 11.9 9 1 2 - - 2 1 - - 2 1 - - - 1 - 1 - - - - - - - - -1 .7 9 1 2 - - 2 - - - 2 - - - - - - - - - - - - . - - -2 .2 6 1 4 2 6 8 1 3 . 3 4 7 1 1 3 2 3 4 3 1 2 - 1 1 - 12.41 1 - - 2 4 1 3 - 3 4 7 1 1 3 2 3 4 3 1 2 _ 1 1 _ 12 .1 6 1 - - 2 2 1 1 - 1 - 7 - - 1 2 - 22 .5 9 - - - - 2 - 2 - 2 4 - 1 1 2 - 3 2 3 1 2 - 1 1 “ 1
1 .7 5 15 1 6 1 _ 1 _ _ 5 2 _ _ _ _ 1 _ 1 _ _ _ - _ _ _ _
1.81 1 1 4 - - 1 - - 5 2 - - - 1 1 - - " “ - - - “ -
1.71 9 14 1 _ 1 _ _ 4 21.8 0 5 2 - 1 " - 4 2
1.7 0 1 2 3 5 7 31 .8 4 69 35 17 7 1 0 1 6 8 17 2 1 1 1 5 5 4 5 1 2 - 1 - 1 - - - - -1 .8 5 69 23 17 7 1 0 1 6 8 17 2 1 1 1 4 5 4 5 1 2 - 1 - 1 - - - - -1 . 8 6 66 23 9 7 1 0 1 6 8 17 2 1 1 1 2 5 4 5 1 2 - 1 _ 1 _ _ _ - -1 .6 5 30 1 2 6 11 .6 2 1 0 1 _ 11 . 6 6 20 - 2 5 1 22 . 1 2 - 3 - - 1 - 1 3 7 2 1 1 1 2
1 . 9 2 _ 3 _ _ _ 1 _ _ 2 2 12 .2 7 - - - - - - - 1 1 5 1 1 1 1 22. 25 5 “ 1 1 1
1 .9 8 13 5 3 7 1 5 2 3 1 1 1 8 8 4 . !
1 . 9 8 1 2 1 0 4 14 1 0 5 7 4 6 4 2 5 5 8 1 3 2
1 . 8 8 9 7 2 7 7 4 6 4 5 3 1 31
2
2. 54 1 1 3 7 7 5 5 4 2 4 3 4 2 5 3 3 2 21 .8 0 1475 297 2 2 1 231 183 195 137 153 235 145 123 83 48 24 14 1 1 4 5 3 1 - 5 - 1 _1 .8 0 1472 293 2 2 1 231 183 195 137 153 231 145 123 83 48 24 14 1 1 4 5 3 1 - 5 - 1 -1.81 1437 293 2 2 1 231 183 195 137 153 231 145 123 83 48 24 14 1 1 4 5 3 1 " 5 " 1 -
1 .7 8 523 88 63 59 42 66 37 38 67 44 30 24 8 6 4 1 - - 3 1 - - - - -
1 .8 4 536 130 1 0 2 93 95 85 72 86 109 72 67 42 31 13 4 1 0 4 1 _ - _ 5 _ 1 _
1 .8 4 519 130 1 0 2 93 95 85 72 86 109 72 67 42 31 13 4 1 0 4 1 5 1
A ll production w orkers- M e n ------------------------------
Selected production occupations
A ssem b lers——Men -— --------------
T im e-------------Cutters, m achine-
M e n --------------------T im e -In cen tive------------------- —
F olders, garment (41 women and 1 m an )3-
Incentive •Hand (30 women and*
m a n )-Incentive •
Garment repairmen (29 women and 1 man) (alltimewo rkers) ----------------
Inspectors, fin a l--------------W om en --------------------------
Incentive •Janitors (all tim eworkers) -
W om en-------------------------------M en ---------------------------------
Women (all tim e- w orkers)—
Men - T im e -
P r e sse r s , finish, hand (all women) (all incentive w orkers)-
P r e sse r s , finish, machine — Women (all incentive
w orkers)------------—-------------Repairmen, sewing machine
(all men) (all tim e-w orkers) -------------------------- ;—
Sewing-machine operators3— W om en ------- ---------- ---------
IncentiveWork pants (1 ,1 0 2 women
and 2 men) (all incentiveworkers) ---------------------------
Work shirts (1 ,5 5 7 women and 1 m a n )------------------------
4 ,9 37505
4 ,4 3 2
30235222209
42123022
913
72102
633 ,5 943,5 833,548
1 ,1 04
1 ,5 5 81,541
See footnotes at end of table.
Digitized for FRASER http://fraser.stlouisfed.org/ Federal Reserve Bank of St. Louis

Table 14. Occupational Earnings: Mississippi— Continued
(Number and average straight-tim e hourly earnings1 of workers in selected occupations in work clothing manufacturing establishm ents, February 1968)
Occupation and sex
Num - A v e r- Number of workers receiving straight-tim e hourly earnings o f -
of hourly $1 . 6o $1.70 $ 0 3 $1.80 $1.85 $1790 $ 1 .9 5 $2 . 0 0 $2 . 1 0 $2 . 20 $2. 30 $2 .40 $2750 $2 . 60 $2 .70 $2 .80 $2 . 9 0 $3 .00 $3. 10 $3. 20 $5730 $374(5' $5750 $ 5 .6owork- linH p r* and
ers mgs 1 $1.65 $1.70 $1.75 $1.80 $1.85 $1.90 $1 .95 $2 . 0 0 $2 . 10 $2 . 20 $2. 30 $2 .40 $2. 50 $2 .60 $2. 70 $2 .80 $2 . 9 0 $3.00 $3. 10 $3. 20 $3. 30 $3 .40 $3. 50 $3 .60 over
23 $1 .98 2 3 1 1 3 3 1 3 3 1 239 1 . 8 8 9 2 5 - 7 1 4 - 2 3 3 1 1 - _ - 131 1 .8 5 9 - 4 - 6 1 4 _ 2 1 3 - _ _ _ - 1 _ _ _ _ _ _ _ _22 1 .7 3 9 - 3 - 5 1 2 - 2.9 2 . 1 2 " - 1 - 1 - 2 - - 1 3 - - - - - 1 - - - - - - -
13 2 . 0 2 2 _ _ _ 1 _ _ _ 2 7 l
1 0 2 .0 5 2 7 1
73 1 .8 3 15 5 8 6 15 4 1 4 8 3 2 1 1
23 1 .7 9 7 4 1 5 _ _ _ 2 3 _ _ 1 _ _ _ _ _ _ _ _ _ _ _ _1 2 1 .7 2 7 2 “ - - “ 1 2
22 1 .6 9 13 2 3 - 1 1 i - - 1
17 1 .6 4 1 1 3 _ 31 0 2 1 .7 5 1 6 21 28 1 17 4 4 2 8 - 1
26 1 .7 2 5 9 3 _ 7 _ _ 2 _ _ _ _ _ _ _ _ _ _ _ _ _ _ _ _76 1 .7 6 1 1 1 2 25 1 10 4 4 _ 8 _ 1 _ _ _ _ _ _ _ _ _ _ _ _ _72 1 .7 4 1 1 1 2 25 10 4 4 4 1
34 1 .8 9 2 4 6 3 2 6 3 3 3
20 1 . 9 6 3 1
'
" 5 3 " 1 4 1 2
Selected production occupations— Continued
Shipping clerks (all men)(all tim ew ork ers)----------------
Spreaders --------------------------------M e n --------------------------------------
Tim e ■ Incentive ■
Stock clerks (all tim e- w orkers)—
Men -Thread trim m ers (all
women) 4 -U nderpressers, hand (all
incentive w orkers)---------------W om en ---------------------------------
U nderpressers, machine (20 women and 2 men) (allincentive w o rk e rs)--------------
Watchmen (all men) (alltimeworkers) -----------------------
Work distributors-------------------Women (all tim e-
w orkers)— M e n --------------------------------------
Selected office occupations
C lerks, general (33 womenand 1 m a n )-----------------------------
C lerks, payroll (all women)------------------------------------
1 Excludes premium pay for overtim e and for work on weekends, holidays, and late shifts. Approximately 85 percent of the production workers covered were paid on an incentive basis.2 Includes 28 workers under $ 1 .6 0 .3 Includes data for workers in classification in addition to those shown separately.4 Insufficient data to warrant presentation of separate averages by method of wage payment; predominantly incentive w orkers.
Digitized for FRASER http://fraser.stlouisfed.org/ Federal Reserve Bank of St. Louis

Table 15. Occupational Earnings: Missouri
(Number and average straight-time hourly earnings 1 of workers in selected occupations in work clothing manufacturing establishm ents, February 1968)
Number
A v e r- Number o f w orkers receiving straight-tim e hourly earnings of—
Occupation and sex of hourly Under$1.60 $1.65 $1.70 $T775 $T.80 $1.85 $ x o o ^r795 $2.0ff $2.10 $2.20 $2.30 $2.40 $2.50 $2.60 $2.70 $2.80 $2.90 $3.00 $TTTO $ X I0 $ X 30 $T 40 $3.50 3T3.60
w ork- earn- $1.60 under - andei s $1.65 $1.70 $1.75 $1.80 $1.85 $1.90 $1.95 $2.00 $2.10 $2.20 $2.30 $2.40 $2.50 $2.60 $2.70 $2.80 $2.90 $3.00 $3.10 $3.20 $3.30 $3.40 $3.50 $3.60 over
A ll production w ork ers_____ 4,921 $1 .85 35 1742 291 351 425 346 258 204 162 241 183 137 160 99 82 55 41 28 24 19 9 9 1 6 5 8M en........... ................... .......... 561 2. 10 - 58 11 36 36 65 31 21 19 50 32 30 48 23 27 22 11 9 6 9 4 5 _ 3 2 3Women ___________________ 4, 360 1.82 35 1684 280 315 389 281 227 183 143 191 151 107 112 76 55 33 30 19 18 10 5 4 1 3 3 5
Selected productionoccupations
Cutters, m ach ine___________ 98 2. 29 _ 2 2 3 5 3 1 2 2 1 6 11 37 7 8 _ 2 _ _ 2 l l _ 1 . jM en....................................... . 88 2. 32 - 2 2 3 3 2 . _ 2 1 4 11 35 7 8 _ 2 _ - 2 1 1 _ 1 _ 1
Incentive ......................... 36 2. 35 . 2 2 1 1 _ _ _ 2 1 * 4 7 3 3 2 _ 2 _ _ 2 1 1 1 1F olders, garment (all
women) (all incentivew orkers) 2__________________ 34 1.95 - 9 3 - 1 5 1 5 1 1 - - 3 - 2 2 - - - 1 - _ . . _ .
Hand 28 1. 92 8 3 5 4 1 1 2 2 2Inspectors, final _ ___ _ 172 1. 85 _ 44 14 21 29 5 11 6 4 11 4 6 3 5 4 1 _ 2 2 _ _ _ _ _ _ _
Women __________________ 171 1.85 - 43 14 21 29 5 11 6 4 11 4 6 3 5 4 1 _ 2 2 _ _ _ . _ _ _Incentive . __ 143 1. 88 - 41 12 11 15 5 11 6 4 11 4 6 3 5 4 1 _ 2 2 _ _ . _ * _
J a n ito rs____________ _______ 43 1.73 . 11 6 4 3 17 _ _ 1 1Men (all tim ew orkers)___ 42 1. 74 - 10 6 4 3 17 . _ 1 1
M arkers (all m en )__________ 16 2. 56 - - - - - - . - - - 3 - _ 3 - 7 _ - 2 1 _ - _ _ _13 2. 65 3 7 2 1
P ressers , finish, hand _ _ 12 1.78 _ 3 _ 2 2 2 2 1Women (all incentive
w orkers) ___ ___ __ 10 1.80 - 2 - - 2 2 2 2P ressers , finish, m achine.. 61 2. 34 _ - 4 6 _ 2 2 _ 4 8 6 _ 3 2 5 4 3 2 5 _ 1 _ _ 2 _ 2
Women (all incentivew ork ers)________________ 43 2. 28 - - 2 6 . 2 2 _ 2 4 4 _ 3 2 5 2 1 2 5 _ 1 _ _ _ _ _
Men (all incentivew orkers) ____ ____ . . 18 2.49 . - 2 . _ - _ _ 2 4 2 _ _ _ _ 2 2 _ _ _ _ _ _ 2 _ 3 2
Repairm en, sewing machine(all men) (all t im e-w orkers) 53 2. 55 - - - - 2 2 - 2 - - 4 2 2 11 6 3 3 3 3 5 2 3 _ _ _ _
Sewing -machineoperators 1_________________ 3,785 1. 82 - 1560 233 256 322 201 203 157 132 166 138 99 97 70 42 33 30 14 11 5 4 1 1 3 3 4
W om en________________ 3, 754 1.81 - 1558 233 254 322 199 201 154 132 164 138 98 96 68 36 27 29 14 10 5 4 1 1 3 3 4In cen tiv e__________ 3,642 1. 82 - 1542 225 234 254 199 201 154 132 164 138 98 96 68 36 27 29 14 10 5 4 1 1 3 3 4
W ork pants 1,825 1.85 - 647 118 129 126 118 113 89 80 90 78 57 59 33 29 18 15 6 9 4 2 _ _ 3 1 1W om en________________ 1,794 1.84 - 645 118 127 126 116 111 86 80 88 78 56 58 31 23 12 14 6 8 4 2 _ _ 3 1 1
Incentive _________ 1,792 1. 84 _ 645 118 127 124 116 111 86 80 88 78 56 58 31 23 12 14 6 8 4 2 _ _ 3 1 1Work shirts (all
women) __ _ 580 1.97 _ 133 31 35 55 29 32 38 24 38 33 25 29 22 11 15 12 6 2 1 2 1 1 _ 2 3In cen tiv e_____________ 576 1.97 - 133 31 35 51 29 32 38 24 38 33 25 29 22 11 15 12 6 2 1 2 1 1 _ 2 3
Shipping c lerks (all men)(all tim ew orkers) ________ 29 1.82 - 2 2 6 4 7 - - 2 2 4
Spreaders (all m en )4b / ____ 22 2. 13 - - - - - - 10 - - 4 2 - - 2 1 2 - - - - - 1 - . - _Stock clerks (a ll men]"______ 22 2. 11 - - - - - 2 8 - - 2 1 4 1 - 3 1
20 2. 08 2 8 1 11
4 3Work d is trib u tors_________ _ 79 1. 82 _ 4 3 4 18 26 5 7 3 8
Wftmftn j 25 1.78 2 6 16 1Men _ ___ 54 1.83 _ 4 1 4 12 10 5 6 3 8 1 _ _ _ _ _ _ # _ _ _ _ . _ _
T im e __________________ 44 1.82 - 3 1 4 8 10 5 6 - 6 1Selected o ffice occupations
47 1.85 7 7 6 3 6 4 3 2 3 5Women _ _ __ __ 45 1.85 _ 6 7 5 3 6 4 3 _ 2 3 5 _ 1 _ _ . _ _ _ _ _ _ _ _
C lerks, payroll (allwnm pn | 26 1.97 2 3 2 7 7 4 1
1 Excludes premium pay for overtime and for work on weekends, holidays, and late shifts. Approxim ately 86 percent of the production workers covered by the study were paid on an incentive basis.
2 Includes data for workers in classification in addition to those shown separately.3 A ll workers were at $ 3 .7 0 to $ 3 .8 0 .4 Insufficient data to warrant publication of separate averages by method of wage payment; (a) predominantly tim ew orkers, or (b) predominantly incentive workers.
Digitized for FRASER http://fraser.stlouisfed.org/ Federal Reserve Bank of St. Louis

Table 16. Occupational Earnings: North Carolina
(Number and average straight-tim e hourly earnings 1 of workers in selected occupations in w ork clothing manufacturing establishm ents, February 1968)
Occupation and sex
All production w o r k e r s ------------------M en ----------------------------------------------W om en-----------------------------------------
Selected production occupations
Cutters, machine (all m e n )------------T im e -------------------------------------------
Inspectors, f in a l-----------------------------W om en----------------------------------------
In cen tiv e --------------------------------Jan itors--------------------------------------------
Women (all tim ew orkers)----------Men (all t im e w o rk e rs )--------------
Repairmen, sewing machine (allmen) (all t im e w o rk e rs )---------------
Sewing-machine operators 2 ----------W om en-----------------------------------
In cen tiv e ---------------------------Dungarees (all w om en )--------------
In cen tiv e --------------------------------Shipping clerks --------------------------------
Men (all tim ew orkers)---------------Spreaders (all m en )------------------------
T im e -------------------------------------------Stock clerks (all men) (all tim e-
w ork ers)— -—Work d is tr ib u to rs ---------------------------
Women (all t im e w o rk e rs )---------Men (all t im e w o rk e rs )--------------
Selected o ffice occupations
Clerks, general (all women) ---- ——Clerks, payroll (all w om en )----------
Num- A v er- Number 'of w orkers receiving straight -tim e hourly earnings of—
ofw ork -
agehourlyearn- Under
$1.60
$1.60and
under
$1.65 $1.70 $1.75 $1.80 $1.85 $1.90 $1.95 $2. 00 $2.10 $2. 20 $2.30 $2740 $2.50 $2. 60 $2.70 $2.80 $2.90 $3. 001$3..10 $ O o l O o $3.40and
ings $1.65 $1.70 $1.75 $1.80 $1.85 $1.90 $1.95 $2.00 $2.10 $2. 20 $2. 30 $2. 40 $2.50 $2.60 $2. 70 $2.80 $2.90 $3.00 $3.10 $3,.20 $3. 30 $3.40 over
1,616 $1. 78 53 753 60 151 82 74 71 53 46 71 67 35 32 25 25 4 1 6 3 3226 1. 97 2 46 6 24 13 13 13 13 10 19 11 16 12 6 7 1 1 6 3 - - - 1 3
1,390 1. 74 51 707 54 127 69 61 58 40 36 52 56 19 20 19 18 3
32 2. 14 2 2 2 5 2 7 4 3 2 1 221 2. 29 - _ - - 2 - - 2 - 7 - 4 1 - 2 - - - ' - - - 1 280 1. 72 _ 46 6 4 6 3 2 1 4 4 1 - 1 - 2 - - - - - - - -79 1., 72 _ 46 6 4 6 3 2 - 4 4 1 - 1 - 2 - - - | - - - - -71 1.,73 _ 38 6 4 6 3 2 - 4 4 1 - 1 - 2 - - - i - - - - -26 1. 66 - 13 5 5 1 1 1
7 1. 68 _ 2 419 1. 65 - 11 1 5 1 1
25 2. 44 1 3 1 3 2 5 2 1 _ 5 2 _ _ _ _ _1,107 1. 75 _ 613 38 94 56 41 53 34 32 37 50 14 13 14 15 31.098 1. 75 _ 613 38 94 56 41 50 31 29 37 50 14 13 14 15 3 - - - - - - - -
900 1. 78 _ 415 38 94 56 41 50 31 29 37 50 14 13 14 15 3654 1. 69 _ 419 31 49 31 22 23 17 14 22 16 4 2 3 1456 1. 74 _ 221 31 49 31 22 23 17 14 22 16 4 2 3 1
41 1. 86 _ 4 1 12 2 3 8 _ 1 1 5 2 _ - 1 - 1 - - - - - - -30 1. 93 - 1 - 7 - 3 8 - 1 1 5 2 - - 1 - 1 - - - - - - -16 1. 99 - 5 _ - 4 1 _ - _ 1 1 - 3 1
8 2. 16 - - - 4 - - - - 1 1 - 1 1
10 1. 79 _ 3 _ 2 _ 2 _ 1 1 _ _ 1 _ _ _ _ _ _ _ _ _27 1. 79 - 2 3 11 1 - 1 4 2 1 1 1
8 1. 7019 X*83 " 2 3 3 1 “ 1
4 2 1 1 1
21 1.,75 9 3 1 1 j 3 2 116 1. 94 2 2 2 5 1 1 3
1 Excludes premium pay for overtim e and for work on weekends, holidays, and late shifts. Approxim ately 69 percent of the production workers covered by the study were paid on an incentive basis.
2 Includes data for w orkers in classification in addition to those shown separately.
Digitized for FRASER http://fraser.stlouisfed.org/ Federal Reserve Bank of St. Louis

Table 17. Occupational Earnings: Pennsylvania
(Number and average straight-tim e hourly earnings 1 of workers in selected occupations in work clothing manufacturing establishm ents, February 1968)
Occupation and sex
A ll production w orkers__M en ......................................Women r---------- ------ -----
Selected production occupations
Cutters, machine (allmen) _____ ___________ _____
Tim e—___ — ____ ______Inspectors, fin a l_________
W om en_______________ —Tima
P re sse rs , finish, hand(all women) 2 a / ----------------
P re sse rs , finish, machine (26 women and14 men) 2b / -----------------------
Repairmen, sewing machine (all men) (alltim ew orkers)------ ------------
Sewing-machine op-e r ator s —
W om en______________T im e.—. - - .— -__Inc entive_________
T h in garftfta---------------------------Women 2b /__________
Work p a n tsla llwomen) 2_b/------------------
Spreaders_________ : _______M en _____________________
Tim e....... ............— ..Thread trim m ers (all
women)— .................—-----Incentive________________
Watchmen (all men) (all tim ew orkers)— —— ..
Work distributors.— . . . . . Men (all tim e-
workers) — ---------------
Selected office occupations
C lerks, general (allwomen)...................... ...........
C lerks, payroll (5 women and 1 m an ). . . . . . .
Num- A ver- Number o f w orkers receiving straight*-time hourly earnings of—
ofw ork -
agehourlyearn- Under
$1.60
$i.6oand
under
$1.65 $1.70 $1.75 11780 $1.85 $1.90 $1.95 $2.00 $2.10 $2.20 $2.30 $2.40 $275(3 $2.60 $2.70 $2.80 $2.90 $3.00 $3.10 $3.20 $3.30 $3.40 $3.50' $3.60and
ings 1 $1.65 $1.70 $1.75 $1.80 $1.85 $1.90 $1.95 $2.00 $2.10 $2.20 $2.30 $2.40 $2.50 $2.60 $2.70 $2.80 $2.90 $3.00 $3.10 $3.20 $3.30 $3.40 $3.50 $3.60 over
1,608 $1 91 18 341 171 115 195 78 78 60 55 140 76 80 50 40 33 21 11 9 12 4 5 2 4 10248 2 25 . 17 10 3 29 6 11 3 7 44 16 9 14 5 15 15 5 5 10 4 4 2 - 4 . 10
1, 360 1 84 18 324 161 112 166 72 67 57 48 96 60 71 36 35 18 6 6 4 2 1
27 2 80 1 1 1 6 7 1 2 2 1 1 322 2 79 1 1 - - 6 6 - 2 - 2 - 1 - 2 . 128 1 73 - 10 - . 15 - - . - 3 _ - - - - _ - - - _ - _ _ - - -25 1. 69 - 10 1513 1. 70 - 4 9
8 1. 68 - 2 2 3 1
40 2. 19 - - 2 2 8 3 3 1 2 3 1 - 2 1 - 2 2 ‘ 6 1 - - - - - -
13 2. 93 - - - - - - 1 - - - - - - 2 - - 1 2 2 - 3 1 - - - 1
1, 168 1. 86 _ 279 145 95 117 62 49 55 40 99 59 66 30 31 24 5 6 4 2 _ _ . _ _1, 142 1. 86 . 273 145 95 117 62 49 53 40 87 59 66 30 31 18 5 6 4 2 - - - - - - -
156 1. 69 . 18 76 22 32 2 2 _ 2 - _ _ - - 2 _ - - - - - _ - - . _986 1. 89 _ 255 69 73 85 60 47 53 38 87 59 66 30 31 16 5 6 4 2 _ - _ _ - - -316 1. 96 . 78 24 10 34 8 4 14 8 42 18 22 8 16 16 4 4 4 2 _ - _ _ - - _292 1. 95 - 72 24 10 34 8 4 14 8 30 18 22 8 16 10 4 4 4 2 - - - - - - -
426 1. 80 _ 124 70 31 35 26 13 20 23 34 25 13 8 2 216 2. 19 _ _ _ . _ 1 1 . - 3 4 2 2 2 _ _ 1 - - - - _ - _ - -14 2. 18 _ - - _ - 1 1 _ - 3 4 2 _ 2 - _ 1 - - - - - - - - -12 2. 22 - “ - - - 1 - - 2 4 2 - 2 - - 1 - - " - - - - - -
47 1. 71 26 6 5 3 2 _ _ 2 _ _ 1 _ 1 1 _29 1. 75 - 14 2 5 1 2 - - 2 - - 1 - 1 - 1 - - - - - - - - - -
7 1. 86 _ 527 !• 77 - 2 5 1 13 - - 2 4
24 1. 78 - 2 5 1 10 - - - 2 4
15 1. 95 _ _ 4 1 _ _ 3 _ _ ! 2 4
6 2. 11 - - - 1 - - - 1 1 - 2 - 1 - - - - - - - - - - - -
1 Excludes premium pay for overtime and for work on weekends, holidays, and late shifts. Approxim ately 70 percent of the production workers covered by the study were paid on an incentive basis.
2 Insufficient data to warrant publication of separate averages by method of wage payment; (a) predominantly tim ew orkers, and (b) predominantly incentive w orkers.3 Includes data for workers in classification in addition to those shown separately.
Digitized for FRASER http://fraser.stlouisfed.org/ Federal Reserve Bank of St. Louis

Table 18. Occupational Earnings: Tennessee
(Number and average straight-tim e hourly earnings 1 of w orkers in selected occupations in w ork clothing manufacturing establishm ents, February 1968)
Occupation and sex
Numberof
w orkers
A verage
hourlyearnings1
Number of w orkers receiving straight-tim e hourly earnings of-$1.60and
under$1.65
$1.65
$1.70
$1.70
$1.75
$1.75
$1.80
$1.80
$1.85
$1.85
$1.90
$1.90
$1.95
$1.95
$2.00
$2.00
$2.10
$2.10
$2.20
$2720
$2.30
$2730
$2.40
$2.40
$2.50
$2.50
$2.60
$2.60
$2.70
$2770
$2.80
$2.80
$2.90
$X 90
$3.00
$3.00
$3.20
$372(5
$3.40
$3.40
$3.60
$3.66andover
A ll production w orkers ....................................... ......... 8, 334 $1.84 2414 1167 690 690 474 376 336 309 520 349 310 176 142 114 72 68 31 27 36 21 9 3Men ____________________________________________ 1, 161 1.90 258 103 134 103 78 66 47 47 62 64 58 30 34 19 14 14 3 2 13 7 3 2Women _________________________________________ 7, 173 1.83 22156 1064 556 587 396 310 289 262 458 285 252 146 108 95 58 54 28 25 23 14 6 1
Selected production occupations
A ssem blers _______________________________________ 46 1.81 10 7 6 2 7 2 5 2 _ 1 _ 1 1 _ 2 _ _ _ . _ _ _Women3a / _ _ ____ _ _ ___ __ 13 1.81 1 - 3 2 2 - 3 2 - _ - _ - _ - _ _ - - - _ _Men ......................................................................... 33 1.82 9 7 3 - 5 2 2 - - 1 - 1 1 - 2 - - - - - - -
Time ................................................................. ......... 27 1. 70 9 7 3 _ 5 1 2 _ - - - - - - - _ - - - - . _Incentive ______ _________ ___________________ 6 2. 34 - - - - - 1 - - - 1 - 1 1 - 2 - - - - - - -
Cutters, machine (all men) _______________________ 97 2. 09 3 - - 5 4 3 22 5 8 16 20 4 2 2 - - - - 2 - - 1Time ____________________________________________ 78 2. 03 3 - - 5 3 3 22 3 7 14 15 2 - - - - - - - - - 1Incentive _ _ _ _______________________ _ 19 2. 32 - - - - 1 - - 2 1 2 5 2 2 2 - - - - 2 - - -
F olders, garm ent4 _______________________________ 88 1.83 27 14 2 2 7 5 3 6 7 9 2 2 1 - 1 _ _ - - - _ _Women .......................... ........................................... 73 1.86 15 14 2 2 7 5 3 6 6 8 2 2 _ _ 1 _ _ - _ _ . _
Incentive ________________________________ 65 1.88 10 11 2 2 7 5 3 6 6 8 2 2 - - 1 - _ _ _ - - _Hand 3b / _________________________________________ 63 1. 84 23 6 2 _ 6 3 1 5 4 8 2 2 1 _ _ _ _ _ . • _ _
W om en____________________________ __________ 51 1.86 14 6 2 - 6 3 1 5 3 7 2 2 - - - - - - - - - -Garment repairmen (16 women and
17 1. 74 12 2 1Inspectors, final (307 women and
3 men) ___________________________________________ 310 1.89 89 49 10 31 8 7 17 15 16 15 17 6 11 8 3 2 - - - 6 - -T im e ____________________________________________ 12 1.67 7 - 3 - 2 - - - - - - - - - - _ _ - - - - .Incentive _______________________________________ 298 1. 90 82 49 7 31 6 7 17 15 16 15 17 6 11 8 3 2 _ _ . 6 . _
Janitors (all tim ew orkers) _____________________ _ 86 1.66 53 13 5 7 6 1 1 _ _ - - _ _ - . . . _ _ _ _ -Women _ _ ___ __ _____ __ ___ 15 1.66 10 2 1 - 1 - 1 - - - - - - - - - - - - - _ _M en____________________________________________ _ 71 1.65 43 11 4 7 5 1 - _ _ - - _ . _ - _ _ _ _ _ _ _
M arkers ___________________ ____ __________________ 51 2.05 2 _ 1 4 1 6 4 3 3 13 11 - 1 2 - _ _ - _ _ - _Women _________________________________________ 13 1.85 2 - - 4 _ 3 1 - 2 - 1 _ - - - _ _ - - - - _
T im e _________________________________________ 8 1.84 _ _ _ 4 _ 3 - _ 1 _ - . _ _ _ - _ _ _ _ _ _M en______________________________________________ 38 2. 12 _ - 1 - 1 3 3 3 1 13 10 - 1 2 - _ - - - - . _
Time ________________________________________ 32 2. 12 _ _ 1 _ 1 3 3 2 _ 11 8 _ 1 2 _ _ - _ _ _ _ _Incentive ____________________________________ 6 2. 13 - - - - - - - 1 1 2 2
P ressers , finish, machine(all incentive w orkers) ________________________ 305 1.96 82 28 20 17 9 25 7 6 14 19 22 9 11 10 10 6 2 2 4 2 _ .
Women _______________________________ _________ 143 1.82 44 22 14 12 4 12 7 4 2 1 10 3 3 1 2 _ _ 2 - - _ -Men _____________________________________________ 162 2. 08 38 6 6 5 5 13 - 2 12 18 12 6 8 9 8 6 2 - 4 2 - -
Repairm en, sewing machine (all men)(all tim ew orkers) _______________________________ 80 2.44 - - 3 - 1 5 - - 10 9 5 10 11 3 - 7 1 1 6 5 3 -
Sewing-machine op era tors4 ___ ______________ 5, 754 1.84 1651 873 458 450 301 250 233 203 386 245 214 134 94 85 42 50 28 22 21 8 5 1Women ................. ............. ...................... .................. 5,725 1.84 1641 871 458 448 301 248 233 202 380 245 212 132 92 85 42 50 28 22 21 8 5 1
Incentive ________________________________ 5,626 1.85 1635 850 440 406 298 248 227 202 380 242 212 132 92 85 42 50 28 22 21 8 5 1Dungarees (all women) ________________________ 1, 122 1.95 243 101 86 106 47 36 59 41 92 58 59 35 46 26 19 30 9 9 10 8 2 -
Incentive _______________________________ 1,023 1.98 237 80 68 64 44 36 53 41 92 55 59 35 46 26 19 30 9 9 10 8 2 -O veralls and industrial garments
(all incentive w orkers) _____________________ 1, 374 1.84 479 66 131 122 57 75 60 60 119 53 50 36 8 30 6 6 8 4 4 _ _ _Women ___________________________________ . 1,352 1.84 473 64 131 122 57 73 60 60 113 53 48 34 6 30 6 6 8 4 4 . - -
Work pants (2, 087 women and4 men) (all incentive w orkers) ______________ 2,091 1. 78 682 483 159 155 123 72 50 60 78 69 51 36 23 14 13 8 6 6 2 _ 1 _
Work shirts (all women)(all incentive w orkers) _______________________ 976 1.85 229 191 65 61 59 50 53 38 70 56 39 24 14 11 3 2 3 1 5 • 1 1
See footnotes at end of table.
Digitized for FRASER http://fraser.stlouisfed.org/ Federal Reserve Bank of St. Louis

Table 18. Occupational Earnings: Tennessee— Continued
(N um ber and a v e ra g e stra igh t-t im e h ou rly earn ings o f w o rk e r s in s e le c te d o ccu p a tio n s in w ork clo th in g m a n u fa ctu rin g e s ta b lish m e n ts , F e b ru a ry 1968)
Occupation and sex
Numberof
workers
A v erage
hourly earnings 1
Number of workers receiving straight-tim e hourly earnings of—$ 1.60 and
under $1.65
$ 1 . 6 6
$1 .70
$1 .70
$1 .75
$ 1.75
$1.80
$ 1 . 8 0
$1 .85
$1785
$1 .90
$T790
$ 1 .95
$1 .95
$ 2 .0 0
$ 2 .0 0
$ 2 . 1 0
$27TO
$ 2 . 2 0 $2 .30 $2 .40
$2 .40
$2 .50
$2 .50
$2 .60
$2.60
$2.70 $2 .80
$ 2 .8 0
$ 2 .9 0
$ 2 .9 0
$3 .00
$3 .00
$3 .20
$3 .20
$3 .40
^ 3.40
$3.60
$3 .60
and
over
Selected production occupations— Continued
Spreaders ________________________________________ 66 $ 1 .8 4 5 _ 1 2 13 16 5 3 1 4 4 „ : 2 _ _ _ 1 _ . _ . . _M e n __________________________________ __________ 61 1.82 5 _ 10 13 16 5 3 1 4 2 _ 2 _ _ _ _ _ _ _ _ _
Tim e __________________________________________ 47 1.79 5 - 9 10 13 4 1 - 3 2 _ > _ _ _ _ _ _ _ _Incentive _________ _____________ _____ 14 1.91 _ - 1 3 3 1 2 1 1 _ _ 2 _ _ _ _ _ _ _ _ _ _
fitn rlt r lA r k o (a l l H m ftw fir lr e r f i) 13 1.71 3 10Men ________________________________________________ 9 1. 70 _ 3 6 _ _ _ _ _ _ _ _ _ _ _ _ _ _ _ _ _
U nderpressers, hand (17 women and1 2 men) (all incentive workers) _ . 29 1.79 6 15 1 - 1 2 1 - _ - 1 - - _ _ 1 _ _ 1 _ _
U nderpressers, machine (27 womenand 2 men) ________________ _________________________ 29 1.65 15 5 6 3 _ _ _ _ _ _ _ _ _ _ _ _ _ _ _ _ _
Incentive _ ___ _ ___ _ __ _ 26 1.64 15 5 3 3 _ _ _ _ _ _ _ _ _ _ _ _ _ _ > _Watchmen (all men) (all tim ew ork ers)___________ 1 1 1.71 3 5 _ _ 1 1 _ 1Work distributors (all tim eworkers) ........................ 2 1 1 1.70 54 49 39 39 16 9 3 1 1
Women .................................... ............................................. 34 1 .64 1 1 19 3 . 1 - - - _ . _ - _ _ - _ _ _ _ _ _Men __________________________________________________ _ 177 1.71 43 30 36 39 15 9 3 1 1 - - - - - - - - - - - -
Selected office occupations
C lerks, general (all women) ______________________ 71 1.95 _ 4 5 4 7 13 10 5 1 2 4 4 _ _ _ _ _ _ 3 _ _ _ _C l e r k s p a y r o l l ( a l l w o m e n ) 37 1. 93 3 3 4 5 5 14 2 1Stenographers, general (all w om en )______________ 8 2 . 20 - - - 4 2 1 - - 1 - - - - -
1 E x clu d e s p re m iu m pay fo r o v e rt im e and fo r w ork on w eekend s, h o lid a y s , and la te sh ifts . A p p ro x im a te ly 80 p e rce n t o f the p ro d u ctio n w o rk e r s c o v e r e d by the study w e re paid on an in cen tiv e b a s is .
2 In clu des 28 w o r k e r s under $ 1 .6 0 .3 In su ffic ien t data to w arran t pu b lica tion o f sep arate a v e ra g e s by m eth od o f w age paym ent; (a ) p red om in an tly t im e w o r k e r s , and (b ) p redom in an tly in cen tiv e w o rk e r s .4 In clu des data fo r w o rk e r s in c la s s if ic a t io n in addition to th ose show n se p a ra te ly .
Digitized for FRASER http://fraser.stlouisfed.org/ Federal Reserve Bank of St. Louis

Table 19. Occupational Earnings: Texas
(N um ber and a v e ra g e s tra ig h t -t im e h ou rly ea rn in gs 1 o f w o rk e rs in s e le c te d occu p a tio n s in w o rk c lo th in g m a n u fa ctu rin g e s ta b lis h m e n ts , F e b r u a r y 1968)
8
Num - A v e r- Number of workers receiving s traight-tim e hourly earnings of—
Occupation and sex ofage
hourly $ 1 . 6 0 $1755 $1.70 $1.75 $1780 $1.85 $1.90 $1.95 $2 . 0 0 $2 . 1 0 $2 . 2 0 $2.30 $2.40 $2.50 $2.60 $2.70 $2.80 $2.90 $3.00 $3.10 $3.20 $3.30 $3.40 $ 3 .5 0 $ 3 .6 0 $3.70
w ork- earn - unde i andings 1 $1.65 $1.70 $1.75 $1.80 $1.85 $1.90 $1.95 $2 . 0 0 $2 . 1 0 $2 . 2 0 $2.30 $2.40 $2.50 $2.60 $2.70 $2.80 $2.90 $3.00 $3.10 $3.20 $3.30 $3.40 $3.50 $3.60 $3.70 over
A ll production workers— 10,207 $1..83 242 1 0 576 719 705 653 446 436 313 569 473 2 6 1 2 1 2 176 106 6 1 78 77 26 27 15 18 9 14 3 9 15Men 1, 378 1 .9 4 475 76 133 77 97 50 54 27 52 46 35 2 2 24 42 28 30 34 7 15 13 13 7 4 3 3 1 1Women 8 , 829 1.81 3735 500 586 628 556 396 382 286 517 427 226 190 152 64 33 48 43 19 1 2 2 5 2 10 - 6 4
Selected productionoccupations
A ssem blers — 27 1 .7 4 2 1 _ _ 1 . 1 _ _ _ _ 2 _ _ _ 2 _ _ _ _ _ _ _ _ _ _ _1 AO L3 1 2 2
Cutters, machine 1 1 1 2 .3 9 5 _ _ 13 4 3 2 16 4 1 0 6 7 12 8 5 3 2 2 4 2 _ 1 _ 2Men 104 2 .4 3 _ _ - - 13 4 3 2 16 4 - 8 6 7 1 2 8 5 3 2 2 4 2 _ 1 _ 2
Time 36 2. 04 _ _ _ _ 13 4 2 1 10 _ . 1 _ 2 _ _ _ 1 _ 2 _ _ _ _ _ _
Inc e nti ve____________ 68 2 .6 4 _ - - _ - _ 1 1 6 4 _ 7 6 5 1 2 8 5 2 2 _ 4 2 _ 1 _ 2Folders, garment4 __—__ 63 1.79 29 10 2 - 3 4 3 - 3 3 1 2 1 - - - 2 - - - - - - - _ _
54 1.81 28 4 3 4 3 3 3 1 2 1 2Incentive— — 46 1. 85 20 4 . _ 3 4 3 _ 3 3 1 2 _ _ _ 2 _ _ _ _ _ _ _ _ _
6 2Hand 58 l! 80 29 7 . 3 4 3 _ 3 3 1 2 1 _ _ _ 2 _ _ _ _ _ _ _ _
W nwi on 54 1 . 81 28 4 3 4 3 3 3 1 2 2Incentive 46 1.85 20 4 _ _ 3 4 3 _ 3 3 1 2 1 _ _ _ 2 _ _ _ _ _ _ _ _ _
Garment repairmen (allwomen) (all tim e-
45 1 .69 32 3 4 5 1Inspectors, final 437 l ! 81 178 35 23 10 39 18 28 1 2 29 38 8 6 5 _ _ 4 2 _ 2 _ _ _ _ _ _ _
Women 421 1.8 2 164 33 23 10 39 18 28 1 2 29 38 8 6 5 - _ 4 2 _ 2 _ _ _ _ . _ _49 1 .7 0 16 9 5 1 18
Incentive 372 l ! 83 148 24 18 9 2 1 18 28 1 2 29 38 8 6 5 _ _ 4 2 _ 2 _ _ _ _ _ _ _
Janitors (all t im e-w orkers) 1 1 1 1 .7 0 62 5 18 8 8 3 1 2 _ _ - _ . 2 _ _ 2 _ _ - _ _ _ _ _
Men 84 1.7 2 46 5 1 2 4 7 3 1 2 _ - - _ _ 2 _ _ 2 _ _ _ _ _ _ _ _ _27 1. 65 16 5 4 1
M a r l rA r s 62 2. 15 16 4 3 4 2 11
1 2 1 5 j 1 4 6 1 133 2 .4 6 3 2 1 2 1 1 4 6 1 1
Tirv.® 25 2. 45 3 1 2 2 11
2 2 1 1W n m A n 29 1 . 80 13 3 1 3 2 1 2 1 3
P re sse rs , finish,machine 338 1.85 129 15 26 22 14 15 1 1 13 24 35 10 5 3 4 3 2 1 3 3 _ _ _ _ _ _ _
Women 22 0 1 . 9 0 82 2 15 7 9 9 8 6 19 34 8 5 2 4 3 1 1 3 2 _ _ _ _ _ _ _Incentive 203 1.9 3 70 2 10 7 9 9 8 6 19 34 8 5 2 4 3 1 1 3 2 _ _ _ _ _ _ _
M en _____________________ 118 1.76 47 13 1 1 15 5 6 3 7 5 1 2 _ 1 _ _ 1 _ _ 1 _ _ _ . _ _ _Incentive 84 1 .8 2 14 13 10 15 5 6 3 7 5 1 2 _ 1 _ _ 1 _ _ 1 _
Repairmen, sewingmachine (all men) (alltim eworkers) 133 2 .5 9 - - 3 3 6 8 2 2 7 5 1 2 1 9 18 1 8 7 3 1 0 5 8 4 2 2 3 4
Sewing-machine operators 4 7 ,4 5 3 1.81 3296 373 478 561 448 322 326 233 411 314 192 157 115 65 30 41 36 15 8 2 4 2 10 _ 2 4Wom«n 7 ,2 8 9 1.81 3184 373 470 553 448 322 318 233 407 306 192 157 115 57 30 41 36 15 8 2 4 2 10 2 4
7 ,2 8 7 1.81 3182 373 470 553 448 322 318 233 407 306 192 157 115 57 30 41 36 15 8 2 4 2 10 2 4Dungarees (all in
centive w orkers)— 1,085 1.88 342 47 59 100 83 61 48 48 93 59 35 36 19 14 6 13 12 2 2 _ _ 2 2 2Women 1, 073 1 .8 9 334 47 59 100 83 61 48 48 89 59 35 36 19 14 6 13 12 2 2 _ 2 2 2
Work pants (all incentive w ork ers)— __ 3 ,7 0 4 1. 83 1496 209 204 344 223 153 174 134 190 194 113 80 60 35 26 16 18 13 6 2 4 _ 8 2
Womepi__________________ 3 ,5 5 2 1.8 3 1392 209 196 336 223 153 166 134 190 186 113 80 60 27 18 16 18 13 6 2 4 8 2Work shirts (all
women) (all incentive w orkers) — 455 1. 86 134 21 19 47 31 35 40 16 37 18 19 14 14 2 6 2
See fo o tn o te s at end o f table,
Digitized for FRASER http://fraser.stlouisfed.org/ Federal Reserve Bank of St. Louis

Table 19. Occupational Earnings: Texas— Continued
(N um ber and a vera g e stra ig h t-t im e h ou rly earn in gs 1 o f w o rk e r s in s e le c te d occu p a tio n s in w o rk c lo th in g m a n u fa ctu rin g e s ta b lis h m e n ts , F e b r u a r y 1968)
Num- A v er- Number o f w orkers receiving straight-tim e hourly earnings of—
Occupation and sex ofage
hourly $1.60 $1765" $1.70 $1.75 $1.80 $1.85 $1.90 $1.95 $2 . 0 0 $2 . 1 0 $2 . 2 0 $2.30 $2.40 $2.50 $2.60 $2.70 $2.80 $2.90 $3.00 $3.10 $3.20 $3730 $3740 $3750 $375o $3.70w ork - under and
ings $1.65 $1.70 $1.75 $1.80 $1.85 $1.90 $1.95 $2 . 0 0 $2 . 1 0 $2 . 2 0 $2.30 $2.40 $2.50 $2 . 6 0 $2.70 $2.80 $2.90 $3.00 $3.10 $3.20 $3.30 $3.40 $3.50 $3.60 $3.70 over
Selected productionoccupations— Continued
Shipping clerks (alltim ew orkers) 2 0 $ 1 . 9 6 6 - - - 1 2 2 - 2 3 3 - - - - - _ _ 1 - - _ _ _ _ _
M en___________________ 18 1.97 6 _ _ _ 1 _ 2 _ 2 3 3 _ _ _ _ _ _ 1 _ _ _ _ _ _ >Spreaders 97 1.96 29 4 4 - 9 2 8 4 2 1 0 8 7 3 2 - 2 1 - 1 - - - 1 - _ -
M en___________________ 94 1 . 9 6 29 4 4 _ 9 2 8 3 2 8 8 7 3 2 _ 2 1 _ 1 - _ _ 1 _ _ _Time 32 1.65 25 _ 2 _ 3 _ 2 _ _ _ _ _ _ _ _ _ _ _ _ _ _ _ _ _ _Incentive 62 2 . 1 1 4 4 2 _ 6 2 6 3 2 8 8 7 3 2 - 2 1 _ 1 _ _ _ 1 _ _ _
Stock clerks (all tim e-w ork ers)________________ 41 1 . 8 6 2 - 17 3 4 2 3 3 - 3 2 - - 1 - - - 1 - - _ _ _ . _ _
Men 36 1 . 8 8 2 - 15 - 4 2 3 3 _ 3 2 _ _ 1 _ - _ 1 _ _ _ _ _ _ _ _Thread trim m ers (all
women) 128 1 . 82 63 3 9 3 4 8 5 2 7 1 1 7 2 1 _ _ _ 1 1 _ _ 1 _ _ _ _ _Incentive 93 1. 89 34 3 3 3 4 8 5 2 7 1 1 7 2 1 - _ _ 1 1 _ - 1 _ _ - _ _
U nderpressers, hand(all incentive w ork -
52 1. 93 1 0 3 3 3 5 1 8 8 1 0 3W nmen 33 1. 97 2 1 3 3 5 1 4 6 7
19 1. 87 8 2 2 2 3 2U nderpressers,
m arbiTiA 17 . 1-91 6 1 1 1 4 2 2Women (all incentive
w ork ers)_____________ 15 1.95 4 - - 1 - 1 1 - 4 2 - 2Watchmen (all men) (all
tim ew orkers) 1 0 1.72 4 2 1 _ - 1 2W ork distributors (all
tim ew orkers)—— ___——. 2 2 2 1.67 1 0 2 29 42 2 2 18 - 9Mon 172 1.67 90 13 27 2 0 18 - 4W AmAn 50 1 . 6 8 1 2 16 15 2 5
Selected o fficeoccupations
C lerks, general (allwomen) 146 1.75 46 1 1 29 28 6 1 0 2 2 6 3 - - - - 3 - - - - - - _ - _ _ _
C lerks, payroll (all67 1.91 4 5 5 3 7 7 6 1 6 1 6 3 2 2
Typists, c la ss B (till31 1.72 7 g 4 2 8
1 E x c lu d e s p re m iu m pa y fo r o v e rt im e and fo r w o rk on w eeken d s, h o lid a y s , and la te sh ifts . A p p ro x im a te ly 85 p e r ce n t o f the p ro d u c tio n w o rk e r s sin in cen tiv e b a s is .
2 In clu des 50 w o rk e r s under $ 1 .6 0 .3 In su ffic ie n t data to w a rra n t pu b lica tion o f sep arate a verag es b y m eth od o f w age pa ym en t; (a) p red o m in a n tly t im e w o r k e r s , and (b) p red om in a n tly4 In clu des data fo r w o rk e r s in c la s s i f ic a t io n in addition to th ose show n se p a ra te ly .
c o v e r e d b y the study w ere p a id on
in cen tiv e w o r k e r s .
Digitized for FRASER http://fraser.stlouisfed.org/ Federal Reserve Bank of St. Louis

Table 20. Occupational Earnings: Virginia
(Number and average straight-time hourly earnings 1 of workers in selected occupations in work clothing manufacturing establishments, February 1968)
Occupation and sex
A ll p rod u ction w o r k e r s__M e n _____________________W o m e n __________-______
S e le c te d p rod u ction o ccu p a tion s
C u tte rs , m a c h in e ________W om en 2 ________________M e n ___ __________________
I n c e n t iv e ___________In s p e c to rs , f in a l_________
W om en (a ll in cen tiv ew o r k e r s ) _____________
J a n i t o r s -----—---------------------W om en (a ll t im e -
w o r k e r s )______________M en (a ll t im e -
w o rk e r s ) —M a r k e r s ___________________
M e n __________________ l —
P r e s s e r s , fin ish ,m a c h in e _________________
M en (a ll in ce n tiv ew o r k e r s ) --------------------
R e p a irm e n , sew ing m ach in e (a ll m en ) (a llt im e w o r k e r s )___________
S ew in g -m a ch in eo p e r a to r s 3 ______________
W om en ------------------------In c e n t iv e _________
D u n garees (a ll w om en) (a ll in ce n tive w o r k e r s ) ________
W ork pants ____________W om en (a ll in ce n
tive w o r k e r s ) ____Shipping c l e r k s -----------------
M e n _____________________T i m e ________________
S p re a d e rs (a ll m e n )______I n c e n t iv e -----------------------
S tock c l e r k s _______________W o m e n ___ ______________
T i m e ________________W ork d i s t r ib u t o r s ------------
M e n _____________________T i m e ________________
S e le c te d o ff ic e o ccu p a tion s
C le rk s , g e n e ra l (a llw o m e n )----------------------------
C le rk s , p a y ro ll (a ll w o m e n )----------------------------
Num- A ver- Number of workers receiving straight-time hourly earnings of—
ofw orkers
dgchourly earnings 1
Under$1.60
$1.60and
onder$1.65
$1.65
$1.70
$1.70
$1.75
$1.75
$1.80
$1.80
$1.85
$1.85
$1.90
$1.90
$1.95
$1.95
$2 . 0 0
$ 2 . 0 0
$2 . 1 0
$2 . 1 0
$2 . 2 0
$ 2 . 2 0
$2.30
$2.30
$2.40
$2.40
$2.50
$2.50
$2.60
$2.60
$2.70
$2.70
$2.80
$2.80
$2.90
$2 . 9 0
$3.00
$ M
$3.10
$3.10
$3.20
$3720"
$3.30
$3.10
$3.40
$3.40
$3.50
$3.50
$3.60
$37So
andover
3,450 $ 1 . 8 6 51 1223 323 227 229 181 123 118 114 180 145 109 119 69 74 34 28 20 28 17 6 1 1 6 6 2 7460 2. 04 - 91 39 42 43 20 9 9 13 28 31 14 27 13 18 1 2 7 5 5 9 6 4 4 5 _ 6
2,990 1. 83 51 1132 284 185 186 161 114 109 1 0 1 152 114 95 92 56 56 2 2 2 1 15 23 ■ 8'
7 2 1 2 1
63 2. 35 3 4 2 4 5 16 1 5 6 5 1 1 1 2 1 1 1 1 37 2 . 1 2 - - - - - 2 - _ . _ 3 1 _ _ 1 _ _ _ _ _ _ _ _ _ _ _
56 2. 38 - - - 3 - 2 2 - 4 5 13 _ 5 6 4 1 1 1 _ 2 1 1 1 1 _ 323 2 . 1 1 - - - 1 _ _ - _ 3 4 1 2 _ _ 3 _ _ _ _ _ _ _ _ _ _ _ _33 2. 57 _ - _ 2 - 2 2 _ 1 1 1 _ 5 3 4 1 1 1 _ 2 1 1 1 1 _ 3
160 1. 89 - 67 3 15 3 9 8 6 2 7 1 1 8 3 5 3 1 - 2 6 - - - - 1 - -
158 1. 89 _ 67 3 15 3 9 8 6 2 7 10 8 3 5 3 _ _ 2 6 . 132 1 . 6 6 - 19 3 3 4 2 - - 1
1 1 1 . 60 - 10 1
2 1 1. 69 _ 9 2 3 4 2 _ _ 117 2 . 06 - 1 3 1 - 1 - 1 1 _ _ 5 2 _ 1 114 2 . 08 _ _ 3 1 _ 1 - _ 1 _ _ 5 1 _ 1 113 2 . 06 - - 3 1 - 1 - - 1 - - 5 - - 1 1
8 1 1. 98 - 27 8 5 5 4 2 - 1 2 5 2 3 5 1 3 1 1 4 1 - 1 - - - k
55 2. 07 - 16 3 2 3 2 2 - 1 2 4 2 3 5 1 2 1 1 3 1 - 1 - - - -
41 2. 27 - - 1 - 3 - - - - 8 6 1 10 - 5 5 1 - 1 - - - - - - -
2, 353 1. 84 _ 966 2 1 0 116 142 124 81 90 85 1 2 1 91 77 77 43 43 18 18 13 15 9 1 7 2 _ 2 22 , 339 1. 84 _ 961 209 116 142 123 81 90 85 1 2 0 91 76 77 43 42 18 17 13 15 8 _ 7 2 _ 2 12, 315 1. 84 - 939 209 115 142 1 2 2 81 90 85 1 2 0 91 76 77 43 42 18 17 13 15 8 - 7 2 - 2 1
1,335 1. 83 548 91 75 93 75 53 67 48 72 50 43 31 26 19 8 8 6 1 0 4 6 2603 1 . 81 - 303 49 2 2 23 26 17 16 2 0 23 25 19 16 6 18 5 7 4 3 1 - - - - - -
591 1 . 81 _ 298 48 2 2 23 25 17 16 2 0 2 2 25 18 16 6 17 5 6 4 3 . _ _ _ . . _49 1 . 82 - 5 4 1 1 5 8 3 3 1 7 _ _ 1 _ 1 - _ _ _ _ _ _ _ _ _33 1. 85 _ 3 4 3 5 4 2 2 1 7 _ _ 1 _ 126 1 . 8 6 - 3 4 1 4 2 1 1 1 7 _ _ 1 _ 1 _ _ _ . _ _ _ _ _ _ _15 2. 35 - 1 2 1 _ 1 . 1 1 2 _ _ _ _ 1 _ _ _ _ 1 _ 1 3 _ _ _1 1 2. 52 _ - 2 1 - 1 - _ - 1 _ _ _ _ 1 _ _ _ _ 1 _ 1 3 _ _ _27 1. 78 _ 2 7 6 4 1 4 _ _ 1 1 116 1. 72 _ 2 7 2 1 1 31 0 1 . 6 6 _ 2 7 169 1 . 69 _ 25 9 13 15 5 - 258 1 . 69 _ 2 0 6 13 13 4 - 250 1. 69 18 3 1 1 1 2 4 2
n
16 1. 98 . 1 2 1 2 1 5 4
25 1. 92 - 1 2 3 3 4 1 1 1 1 2 6
1 Excludes premium pay for overtime and for work on weekends, holidays, and late shifts. Approximately 84 percent of the production workers covered by the study were paid on an incentive basis.
2 Insufficient data to warrant publication of separate averages by method of wage payment; predominantly incentive workers.3 Includes data for workers in classification in addition to those shown separately.
Digitized for FRASER http://fraser.stlouisfed.org/ Federal Reserve Bank of St. Louis

Table 21. Method o f W age Payment
(Percent of production w orkers in work clothing manufacturing establishments by method of wage payment, United States and selected regions, February 1968)
M eth od o f w age p a y m e n t1 United States 2
M idd leA tla n tic
B o r d e rStates Southeast Southw est G re a t
L ^k esM idd le
W est P a c if ic
A 11 100 100 100 100 100 100 100 100
In cen tive w o rk e r s _ .------- _ ---------------- 82 62 85 81 87 69 85 81In dividua l p ie c e w o r k ___ — 76 62 63 74 96. 65 81 81G rou p p ie ce w o rk ___ ___ — __ 1 - 1 2 ( 3) - 1 ( » )Individual bonus — . . ___ — ,5 X _ 21 4 3 3G rou p b o n u s ------------------------------------------------------------------ ( 3) ( 3) ( 3) ( 3) ( 3) ( 3) -
T im e -r a te d w o r k e r s -------- - — - - — 18 f t 15 19 13 31 15 19F o rm a l plans _ ----- — — 6 ( 3) 5 3 6 13 11 16
S in gle ra te — __ _ 2 ( 3) 1 2 2 1 3 8Range o f ra te s — -- 4 - 4 1 3 12 8 8
Individua l ra te s ___ 13 37 10 16 8 19 5___________________ 1
2
1 For definition of methods of wage payment, see appendix A.2 Includes data for regions in addition to those shown separately.3 L ess than 0. 5 percent.
NOTE: Because of rounding, sums o f individual items may not equal totals.
Table 22. Scheduled W eekly Hours
(Percent o f production and office w orkers in work clothing manufacturing establishm ents by scheduled weekly hours, United States and selected regions, February 1968)
Weekly hours 1 United States 2
MiddleAtlantic
BorderStates Southeast Southwest Great
LakesMiddle
West Pacific
Production workers
All workers ~ _ __ _ __ 100 100 100 100 100 100 100 100
32 hours— ----------- — — - — — — — .1. 2 335 hours-------------------- --------- — ------ — — ------ ( 3) - - - - 4 - -37 V2 hours —— — — — — — — — — — ( 3) - - - - 7 - -40 hours ------ „ „ — — ------ ------- 98 100 100 98 100 87 100 100
Office workers
All workers _ __ — ------ — _ ——— 100 100 100 100 100 100 100 100
35 hours— „ — „ — — — — — — --------- — — 1 _ ( 3) _ . 3 _ _3 7 V2 hours...................— — ------- — ............. 1 - - - 7 - -38V2 hours--------------- --------- ---- ---- ----------- — 1 - 9 - - - * -40 hours------------------------------------------------------------------- 97 100 90 100 100 90 100 100
1 Data relate to the predominant w ork schedule for full-tim e day-shift w orkers in each establishment.2 Includes data for regions in addition to those shown separately.3 L ess than 0. 5 percent.
NOTE: Because of rounding, sums o f individual items may not equal totals.
Digitized for FRASER http://fraser.stlouisfed.org/ Federal Reserve Bank of St. Louis

Table 23. Paid Holidays g(P e rc e n t o f p ro d u ctio n and o ff ic e w o rk e r s in w ork clo th in g m anufacturing esta b lish m e n ts having fo r m a l p r o v is io n s fo r paid h o lid a y s ,
United States and se le c te d r e g io n s , F e b ru a ry 1968)
Number of paid holidays United States 1
MiddleAtlantic
BorderStates Southeast Southwest Great
LakesMiddle
West P acific
Production w orkers
A ll w orkers _ 100 100 100 100 100 100 100 100
W orkers in establishments providingpaid holidays _ 92 100 99 87 88 97 100 100
3 half days ---- (2) 2 - - - - - -1 day 3 - - 8 - - - -2 days . . . . . . . . . . 1 - 2 3 - - - -3 days- 8 - 9 12 8 1 - -4 days . 8 - 12 15 4 - - -5 days- . . . . 9 - 15 11 11 6 - -5 days plus 1 half day (2) - 3 - - - - -A flays _ . . 27 18 20 27 32 21 20 466 days plus 1 half day. — — . . 1 - - 3 - - - -6 days plus 2 half days . 2 - - - - 28 - -7 days _ . — 29 60 35 9 32 41 68 268 days _ 3 5 3 - - - 12 2911 d a y s __— ________ ___ — __ . . ---- (2) 15 - - - - - -
W orkers in establishments providingno paid holidays _. ---------------------- — ------- — 8 (2) 13 12 3 ■ ■
O ffice w orkers
A ll w orkers _ __ ____ __ — — — 100 100 100 100 100 100 100 100
W orkers in establishments providingpaid holidays __ ---- 97 100 99 88 99 100 100 100
1 day__ — ---- ---------- — — — 2 - - 8 - - - -2 days _ — ._ ___ 1 - - 3 - - - -3 days - __ - — _ — - - 7 - 4 11 11 3 - -4 days----------------------------------------------------------------------- 5 - 8 13 3 - - -5 days--- ---- — — ____ ____ — — — — — - 9 - 11 18 8 12 - -5 days plus 1 half d a y _____________________________ (2) - 4 - - - - -6 days - — . . . . . 39 7 31 27 61 30 51 316 days plus 1 half day - ._ — 1 - - 3 - - - -6 days plus 2 half days . . . — — ---- 1 - - - 2 3 - -7 days . . . _ ------- — 26 66 40 6 14 21 47 637 days plus 1 half day - . . . 3 - - - - 31 - -8 d a y s . . — — 1 1 1 - - - 1 711 days . - ............................ 2 26 - - - - - -
W orkers in establishments providingno paid holidays . . . . . . . . 3 (2) 12 1
1 Includes data fo r re g io n s in a dd ition to th ose shown sep arate ly .2 L e s s than 0. 5 p e rce n t.
N O TE: B ecau se o f roun din g , su m s o f in d iv idu a l item s m ay not equal totals.
Digitized for FRASER http://fraser.stlouisfed.org/ Federal Reserve Bank of St. Louis

Table 24. Paid Vacations
(P e rc e n t o f p rod u ction and o ff ic e w o rk e rs in w o rk c lo th in g m a n u fa ctu rin g esta b lish m e n ts having fo r m a l p r o v is io n s fo r pa id v a cation s a fter lon ger p e r io d s o f s e r v i c e , U nited States and s e le c te d re g io n s , F e b r u a r y 1968)
Vacation policy United States 1
MiddleAtlantic
BorderStates
Southeast
Southwest
GreatLakes
MiddleWest P acific United
StatesMiddle
AtlanticB orderStates
Southeast
Southwest
GreatLakes
MiddleWest P acific
Production w orkers O ffice w orkers
All w orkers — 100 100 100 100 100 100 100 100 100 100 100 100 100 100 100 100
Method of payment
W orkers in establishm ents providing paidvacations 97 88 99 94 99 96 100 100 98 96 99 95 100 100 100 100
Length -of-tim e paym ent____________ _________ ____ 37 66 26 31 42 70 34 33 78 96 48 54 90 85 99 100Percentage payment-__. . . _____ _______ ____________ 57 23 71 64 49 27 66 67 20 - 49 41 9 15 1 _Flat-sum payment 1 - - - 5 - - - (2 ) - - - 1 _ _ .Other 1 - 2 - 3 - - - (2) _ 2 _ _ _ _ _
W orkers in establishm ents providing nopaid vacations 3 12 (2) 6 1 4 “ - 2 4 1 5 - - - -
Amount o f vacation p a y3
After 1 year serv ice :Under 1 week____ — 3 - - 8 - - - - (2 ) - _ (2 ) _ _ _ _1 week - — — 81 13 89 79 81 85 90 100 76 4 79 83 90 82 74 63Over 1 and under 2 weeks . 1 _ - _ 5 - _ _ (2) _ _ - 1 _ _ _2 weeks _______________________________________________ 10 57 9 8 9 11 10 _ 21 84 18 13 9 18 26 37Over 2 and under 3 weeks (2) 6 - - - - _ - 1 8 - _ - - _ _3 weeks 1 12 - _ _ - - - - _ _ - _ _ _ -
After 2 years o f serv ice :Under 1 w eek — 2 - - 6 - - - - (2) - - (2 ) - - _ _1 week 75 13 90 76 65 68 90 96 61 4 77 73 69 37 65 59Over 1 and under 2 weeks __ 4 - - 4 8 - - - 2 - - 4 3 _ _ _2 weeks 12 42 9 8 19 20 10 4 31 58 22 18 22 61 35 413 weeks 3 33 - - 3 8 - - 4 34 - - 5 2 - _
After 3 years o f serv ice :2 - - 6 - - - - (2 ) - - (2 ) - _ . .
1 week — 46 8 43 57 46 52 36 9 42 3 32 57 54 24 46 77 - 23 4 8 - - -• 5 - 26 4 3 - _ _
2 weeks 35 48 33 27 31 37 54 91 46 59 40 34 35 74 50 933 weeks 6 33 - - 13 8 10 - 5 34 - - 8 2 4 _
After 5 years o f serv ice :1 week 25 8 29 33 28 1 11 - 17 3 18 30 9 3 46 -Over 1 and under 2 weeks 4 _ 3 3 8 - - - 1 - 1 - 3 - _ _2 weeks — 60 27 68 56 46 80 80 100 72 49 79 64 79 91 50 1003 weeks — 9 54 - 2 16 15 10 - 8 44 - 2 9 6 4 -
After 10 years of serv ice :1 week — 25 8 29 33 28 1 11 - 17 3' 18 30 9 3 46 -Over 1 and under 2 weeks — — 3 - 3 3 5 - - - (2 ) - 1 - 1 - - _2 weeks — 47 27 35 44 39 70 63 95 62 49 40 57 75 79 38 92Over 2 and under 3 weeks 7 - 23 6 3 - 4 - 4 - 26 4 2 _ _ -3 weeks 16 54 9 8 23 25 22 5 14 44 13 5 13 18 16 8
After 15 years of se rv ice :41 week 25 8 29 33 28 1 11 _ 17 3 18 30 9 3 46 _Over 1 and under 2 weeks — 3 _ 3 3 5 - - - (2 ) - 1 . - - _ _2 weeks - - 40 27 34 40 36 66 45 55 58 49 39 51 74 74 34 40Over 2 and under 3 weeks 5 - 23 3 - - - - 3 - 26 2 - - _ _3 weeks 25 54 11 15 30 29 44 45 20 44 14 12 17 23 20 60
1 In clu des data fo r re g io n s in addition to those shown se p a ra te ly .2 L e s s than 0. 5 p e r ce n t .3 P e r io d s o f s e r v ic e w e re a r b it ra r ily ch o se n and do not n e c e s s a r i ly r e f le c t the in div idua l esta b lish m e n t p r o v is io n s fo r p r o g r e s s io n . F o r e x a m p le , ch a n g es in p ro p o r tio n s in d ica ted
at 10 y e a r s m a y in clu de ch a n g es o c c u r r in g betw een 5 and 10 y e a rs .* V a ca tio n p r o v is io n s w e re v ir tu a lly the sam e a fter lon ger p e r io d s o f s e r v ic e .
N O T E : B e ca u se o f roun din g, sum s o f in d iv idual item s m ay not equal to ta ls .
Digitized for FRASER http://fraser.stlouisfed.org/ Federal Reserve Bank of St. Louis

T a b le 25. H ea lth , Insurance, and R etirem en t Plans
(Percent of production and office w orkers in work clothing manufacturing establishm ents having specified health, insurance, and retirem ent plans.United States and selected regions, February 1968)
Type o f plan 1 United State s 2
MiddleAtlantic
BorderStates
Southeast
South- we st
GreatL akesM iddle
W est P ac ific U nited S ta te s 2
M iddleA tlantic
B o rd erS ta te s
Southe a s t
South- we st
G rea tL ak es MiddleW est P ac ific
Production w orkers Office w o rk e rsAll w orkers ___ - 1 0 0 1 0 0 1 0 0 1 0 0 1 0 0 1 0 0 1 0 0 1 0 0 1 0 0 1 0 0 1 0 0 1 0 0 1 0 0 1 0 0 1 0 0 1 0 0
W orkers in establishments providing:
Life insurance 78 98 60 79 85 77 73 82 73 53 51 8 6 89 85 42 44Em ployer financed __ _ 43 94 28 37 58 63 1 0 54 42 53 30 36 59 62 4 38Jointly financed ........................................................... 35 5 32 42 27 13 63 29 31 _ 2 1 50 30 23 37 7
Accidental death and dism emberm entin su ran ce_____________________________________ ___ 40 _ 25 55 44 51 - 37 43 - 24 55 65 58 _ 14
Em ployer fin a n ced .................................. ................... 2 0 _ 14 2 2 25 41 - 8 26 _ 15 19 48 42 7Jointly financed 2 0 - 1 2 33 19 1 0 - 29 17 _ 9 36 17 16 - 7
Sickness and accident insurance or sickleave or both 3_____________________________________ 31 98 16 2 0 30 67 32 57 53 92 19 33 71 6 8 36 8 8
Sickness and accident insurance _______________ 30 98 16 19 30 6 6 29 57 31 92 19 1 2 U 65 25 83Em ployer financed___________________________ 2 0 94 5 13 18 56 1 0 47 18 92 9 8 5 49 4 31Jointly fin a n ced_______________________ ,____ 1 0 5 1 2 6 1 2 1 0 19 1 1 13 - 1 0 4 16 16 2 0 52
Sick leave (full pay, no waiting period) _ _ 1 - - 1 - - 3 - 32 39 13 19 59 31 1 1 5Sick leave (partial pay or waiting period) (5) - - - - 1 - - 1 - , 2 - 3 - -
H ospitalization insurance 84 87 72 95 85 64 64 96 77 49 71 90 90 54 52 97Em ployer financed _____ 46 82 24 46 54 53 27 8 6 41 49 39 36 55 35 23 37Jointly fin a n ced_________________________________ 37 5 48 49 30 1 1 38 1 1 35 - 32 54 35 19 29 59
Surgical in su ra n ce________________________________ 82 87 70 92 85 64 64 96 76 49 70 87 90 54 52 97Em ployer fin a n ced _____________________________ 45 82 2 0 43 54 53 27 8 6 40 49 36 33 55 35 23 38Jointly fin a n ced ________________________________ 38 5 50 49 30 1 1 38 1 1 36 - 34 54 35 19 29 59
M edical insurance_________________________________ 50 29 29 52 53 30 38 51 45 3 63 49 50 32 45 6 6Em ployer financed _ _____ _ _ _ 22 24 24 2 0 33 2 1 _ 40 18 3 36 19 19 16 16 7Jointly financed ............................... ............................ 27 5 5 33 2 0 1 0 38 1 1 27 - 27 30 31 17 29 59
Catastrophe insurance ....................... ............................ 22 - 1 0 25 27 16 27 41 28 2 16 27 33 19 42 59Em ployer financed 8 - 2 6 16 6 - 31 9 2 9 7 1 2 3 2 0 -Jointly fin a n ced_________________________________ 15 - 9 19 11 1 0 27 11 19 - 7 19 2 1 16 2 2 59
Retirem ent plans 4_________________________________ 30 87 2 2 2 1 32 17 43 74 45 90 15 2 1 57 36 82 38Retirement pen sion ____________________________ 29 87 2 1 2 0 28 15 43 74 42 90 15 15 54 34 82 38
Em ployer financed _____ 29 87 2 1 2 0 28 15 43 74 42 90 15 15 54 34 82 38Jointly fin a n ced_____ __________ _____________ - - - - - - - - - - - - - - - -
Lump-sum payments .................................. ............... 3 6 7 1 4 1 - - 4 - 9 6 3 2 - -No p lans____________________________________________ 1 0 2 26 2 1 2 1 2 1 0 4 9 7 29 2 8 8 3
1 Includes only those plans for which at least part of the cost is borne by the em ployer and excludes legally required plans, such as w orkm en 's com pensation and socia l security; how ever, plans required by State tem porary disability laws are included if the em ployer contributes m ore than is legally required or the em ployees receive benefits in excess of the legal requirem ents.
2 Includes data for regions in addition to those shown separately.3 Unduplicated total of w orkers receiving sick leave or sickness and accident insurance shown separately.4 Unduplicated total of w orkers in plants having provisions for pension plans or lum p-sum payments shown separately.5 Less than 0. 5 percent.
NOTE: Because of rounding, sums of individual items may not equal totals.
Digitized for FRASER http://fraser.stlouisfed.org/ Federal Reserve Bank of St. Louis

T a b le 26. O th e r S elected B enefits
(P e rc en t of production and office w o rk e rs in w ork cloth ing m an ufac tu ring e s ta b lish m e n ts having fo rm a l p rov ision s for fu n e ra l leave pay, ju ry duty pay,and severan ce pay, U nited S ta te s and se lec ted reg io n s , F e b ru a ry 1968)
United States 1
MiddleAtlantic
Border State s
Southeast
South - we st
GreatLakes
MiddleWest Pacific
Production w orkers
W orkers in establishm ents withprovisions for :
Funeral leave p a y ______________ _______________ 12 - 42 3 9 8 17 _Jury duty p a y ___________________________________ 25 5 19 21 37 18 24 29Severance p a y2 _ ___ __ _ _ _______ (3) " " " - - -
O ffice w orkers
W orkers in establishments withprovisions for:
Funeral leave p a y ____ _ .. ..... . 14 - 51 2 22 3 10 -Jury duty p a y __________________________________ 32 - 16 21 67 18 25 7Severance pay 2_______________________________ _ (3)
1 Includes data fo r reg ion s in add ition to those shown sepa rate ly .2 Pay to em ployees p erm anen tly sep a ra ted from the company because of a tech no log ica l change o r closing of the plan t.3 L ess than 0. 5 p e rce n t.
SI
Digitized for FRASER http://fraser.stlouisfed.org/ Federal Reserve Bank of St. Louis

Digitized for FRASER http://fraser.stlouisfed.org/ Federal Reserve Bank of St. Louis

Appendix A. Scope and Method o f Survey
S cop e o f S u rvey
T he su rv e y in c lu d ed e s ta b lish m e n ts p r im a r ily en gaged in m a n u fa ctu rin g m e n ’ s and b o y s 1 w o rk s h ir ts , pants, and o th er w o rk c lo th in g and w ash ab le s e r v ic e a p p a re l (in d u stry 2328 as d e fin ed in the 1967 ed it ion o f the Standard In d u stria l C la s s if ic a t io n M an ual, p re p a re d by the U .S . B ureau o f the B udget). S ep ara te a u x ilia ry un its, su ch as c e n tra l o f f i c e s , w e r e e x c lu d e d .
T he esta b lish m e n ts stu d ied w e r e s e le c te d fr o m th ose em p loy in g 20 w o r k e r s o r m o r e at the tim e o f r e fe r e n c e o f the data u sed in co m p ilin g the u n iv e rse l is t s .
The n um ber o f e s ta b lish m en ts and w o r k e r s a ctu a lly stu d ied by the B ureau , as w e ll as the n u m ber e s t im a te d to be w ith in s co p e o f the su rv e y during the p a y r o ll p e r io d stu d ied , a re show n in the fo llo w in g ta b le :
Estimated Number of Establishments and Workers Within Scope of Survey and Number Studied, Work Clothing, February 1968
Region * and State
Number of establishments2 Workers in establishments
Within scope of
studyStudied
Within scope of study Studied
Total 3Nonsupervisory
TotalProductionworkers
Officeworkers
United States4-------------------------- 382 209 67,453 62.775 2. 138 46,562
Middle Atlantic--------------------------------- 31 12 2,368 2, 078 153 1,423Pennsylvania--------------------------------- 18 9 1,742 1,608 54 1,149
Border States-------------------------------------- 51 32 9,556 9, 003 214 7,674Kentucky-------------------------------------- 26 18 5,108 4,785 18 4, 206Virginia---------------------------------------- 14 10 3,613 3,450 78 3,107
Southeast------------------------------------------- 124 70 24,216 23,011 549 17,672Alabama-------------------------------------- 14 11 3,209 3, 038 71 2, 992Georgia---------------------------------------- 31 16 4,926 4, 618 159 3,186Mississippi------------------------------------ 25 16 5,167 4, 937 70 4,085North Carolina------------------------------ 12 7 1,704 1,616 59 1,314Tennessee------------------------------------ 34 18 8,720 8,334 186 5,896
Southwest------------------------------------------ 69 31 16, 804 15, 393 661 9, 139T exas------------------------------------------- 44 20 11,232 10, 207 500 6, 535
Great Lakes-------------------------------------- 41 24 4, 282 3, 846 204 3,226Indiana ---------------------------------------- 13 12 2,404 2, 163 120 2,339
Middle West-------------------------------------- 41 23 7, 048 6, 554 224 4, 473Missouri -------------------------------------- 28 18 5,224 4, 921 99 3,717
P a c ific --------------------------------------------- 15 12 2,407 2, 225 88 2,347California------------------------------------- 12 9 1,785 1, 685 34 1,725
1 The regions used in this study included: Middle Atlantic—New Jersey, New York, and Pennsylvania; BorderStates—Delaware, District of Columbia, Kentucky, Maryland, Virginia, and West Virginia; Southeast—Alabama, Florida, Georgia, Mississippi, North Carolina, South Carolina, and Tennessee; Southwest—Arkansas, Louisiana, Oklahoma, and Texas; Great Lakes—Illinois, Indiana, Michigan, Minnesota, Ohio, and Wisconsin; Middle West—Iowa, Kansas, Missouri, Nebraska, North Dakota, and South Dakota; and Pacific--California. Nevada, Oregon, and Washington.
2 Includes only establishments with 20 workers or more at the time of reference of the universe data.3 Includes executive, professional, and other workers excluded form the production and office worker categories
shown separately.4 Includes data for regions in addition to those shown separately. Alaska and Hawaii were not included in the study.
3 8
Digitized for FRASER http://fraser.stlouisfed.org/ Federal Reserve Bank of St. Louis

4 0
M a jo r P ro d u c t B ra n ch e s
The c la s s i f ic a t io n o f e s ta b lish m e n ts by m a jo r p ro d u ct b ra n ch w as d e te rm in e d on the b a s is o f the p r in c ip a l type o f w o rk c lo th in g m a n u fa ctu red . F o r e x a m p le , i f the va lue o f an e s ta b l is h m e n ts p ro d u ct w as 40 p e r c e n t w o rk pan ts, 20 p e r c e n t d u n g a re e s , 10 p e r ce n t w o rk s h ir ts , and 30 p e r c e n t sp o r t s h ir ts , a ll w o r k e r s in that e s ta b lish m e n t w e r e in c lu d ed in the w o rk pants b ra n ch .
M eth od o f Study
Data w e re ob ta in ed by p e r s o n a l v is its o f B ureau f ie ld s ta ff u n der the d ir e c t io n o f the B u r e a u s A s s is ta n t R e g io n a l D ir e c t o r s f o r O p e ra t io n s . T he su rv e y w as con d u cted on a sa m p le b a s is . T o ob ta in a p p ro p r ia te a c c u r a c y at m in im u m c o s t , a g r e a te r p r o p o r t io n o f la rg e ra th er than sm a ll e s ta b lish m e n ts w as stu d ied . In com b in in g the data, h o w e v e r , a ll e s ta b lish m e n ts w e r e g iv en th e ir a p p ro p r ia te w eigh t. A ll e s t im a te s a re p re se n te d , th e r e fo r e , as re la tin g to a ll e s ta b lish m e n ts in the in d u stry , ex c lu d in g on ly th ose b e low the m in im u m s iz e at the tim e o f r e fe r e n c e o f the u n iv e rse data.
E sta b lish m e n t D e fin it ion
A n es ta b lish m e n t, f o r p u rp o se s o f th is study, is d e fin ed as a s in g le p h y s ica l lo c a t io n w h e re in d u s tr ia l o p e ra t io n s a re p e r fo r m e d . An e s ta b lish m e n t is n ot n e c e s s a r i ly id e n tica l w ith the com p a n y , w h ich m ay c o n s is t o f one o r m o r e e s ta b lish m e n ts . T he te r m s " e s t a b lis h - m e n t" and "p la n t" have b een u sed in te rch a n g ea b ly in th is r e p o r t .
E m p loy m en t
T he e s t im a te s o f the n u m ber o f w o r k e r s w ith in s co p e o f the study a re in ten ded as a g e n e ra l gu ide to the s iz e and c o m p o s it io n o f the la b o r f o r c e in c lu d ed in the su rv e y . The advan ce planning n e c e s s a r y to m ake a w age su rv e y r e q u ir e s the u se o f l is t s o f e s ta b l is h m en ts a s s e m b le d c o n s id e r a b ly in advan ce o f the p a y r o ll p e r io d stu d ied .
P ro d u c t io n W o rk e rs
T he te rm "p ro d u c t io n w o r k e r s , " as u se d in th is b u lle tin , in c lu d e s w ork in g fo r e m e n and a ll n o n s u p e r v is o r y w o r k e r s en gaged in n o n o ffic e fu n ctio n s . A d m in is tra t iv e , e x e cu t iv e , p r o fe s s io n a l , and te ch n ica l p e rs o n n e l, and fo r c e -a c c o u n t c o n s tr u c t io n e m p lo y e e s w ho w e r e u t il iz e d as a sep a ra te w o rk f o r c e on the f i r m f s ow n p r o p e r t ie s , w e r e e x c lu d e d .
O ffic e W o rk e rs
T he te r m " o f f i c e w o r k e r s , " as u sed in th is b u lle tin , in c lu d es a ll n o n s u p e r v is o r y o f f ic e w o r k e r s and e x c lu d e s a d m in is tra tiv e , e x e cu t iv e , p r o fe s s io n a l , and te ch n ica l e m p lo y e e s .
O ccu p a tion s S e le c te d fo r Study
O ccu p a tion a l c la s s i f ic a t io n w as b a se d on a u n ifo rm se t o f jo b d e s c r ip t io n s d es ig n ed to take a ccou n t o f in te r e s ta b lish m e n t and in te r a r e a v a r ia t io n s in du ties w ith in the sa m e jo b . (See append ix B fo r th ese jo b d e s c r ip t io n s . ) T he o ccu p a tio n s w e r e ch o s e n fo r th e ir n u m e rc ia l im p o r ta n ce , th e ir u se fu ln e ss in c o l le c t iv e b a rg a in in g , o r th e ir r e p r e s e n ta t iv e n e s s o f the e n tire jo b s c a le in the in d u stry . W ork in g s u p e r v is o r s , a p p re n t ice s , le a r n e r s , b e g in n e rs , t r a in e e s , h an d icap ped , p a r t -t im e , te m p o r a r y , and p ro b a tio n a ry w o r k e r s w e r e not r e p o r te d in the data fo r s e le c te d o c cu p a tio n s , but w e r e in c lu d ed in the data f o r a ll p ro d u ctio n w o r k e r s .
W age D ata
T he w age in fo rm a tio n r e la te s to a v e ra g e s tra ig h t -t im e h o u r ly e a rn in g s , ex c lu d in g p r e m iu m pay fo r o v e r t im e and fo r w o rk on w eek en d s , h o lid a y s , and la te s h ifts . In cen tive p a ym en ts , su ch as th ose re su lt in g fr o m p ie c e w o r k o r p ro d u ctio n bon us s y s te m s and c o s t - o f - l iv in g b o n u s e s , w e r e in c lu d ed as p a rt o f the w ork ers* re g u la r pay ; but n on p rod u ction bonus p a ym en ts , su ch as C h r is tm a s o r y e a re n d b o n u s e s , w e r e e x c lu d e d .
Digitized for FRASER http://fraser.stlouisfed.org/ Federal Reserve Bank of St. Louis
4 1
A v e r a g e (m ean) h ou rly ra te s o r ea rn in g s fo r ea ch o ccu p a tio n o r o th er g rou p o f w o r k e r s , su ch as m en , w om en , o r p ro d u ctio n w o r k e r s w e re ca lcu la te d by w eigh tin g e a ch ra te (o r h o u r ly e a rn in g s ) by the n um ber o f w o r k e r s r e c e iv in g the ra te , to ta lin g , and d iv id in g by the n u m ber o f in d iv id u a ls . The h o u r ly ea rn in g s o f s a la r ie d w o r k e r s w e re ob ta in ed by d iv id in g th e ir s tr a ig h t -t im e s a la ry by n o r m a l ra th er than a ctu a l h o u rs .
S ize o f C om m u n ity
T abu la tion s by s iz e o f com m u n ity p erta in to m e tro p o lita n and n on m etrop o lita n a r e a s . The te rm ’ ’m e tro p o lita n a re a , " as u se d in th is b u lle tin , r e fe r s to the Standard M e tro p o lita n S ta tis t ica l A r e a s , as d e fin ed by the U. S. B ureau o f the B udget th rou gh A p r i l 1967.
E x ce p t in New E ngland, a Standard M etrop o lita n S ta tis t ica l A r e a is d e fin ed as a cou nty o r g rou p o f con tigu ou s cou n tie s w h ich con ta in s at le a s t one c ity o f 50, 000 inhabitants o r m o r e . C ontigu ous cou n ties to the one con ta in ing su ch a c ity a re in c lu d ed in a Standard M e tro p o lita n S ta tis t ica l A re a i f , a c c o r d in g to c e r ta in c r i t e r ia , they a re e s s e n t ia lly m e t r o p o lita n in ch a r a c te r and a re s o c ia l ly and e c o n o m ic a l ly in te g ra te d w ith the ce n tra l c ity . In New E ngland, w h ere the c ity and tow n a re a d m in is tra tiv e ly m o r e im p orta n t than the cou nty , th ey a re the units u sed in d e fin in g Standard M e trop o lita n S ta tis t ica l A r e a s .
L a b o r -M a n a g e m e n t A g re e m e n ts
S epara te w age data a re p re se n te d , w h ere p o s s ib le , fo r e sta b lish m e n ts w ith (1) a m a jo r ity o f the p ro d u ctio n w o r k e r s c o v e r e d by la b o r -m a n a g e m e n t c o n tr a c ts , and (2) none o r a m in o r ity o f the p ro d u ctio n w o r k e r s c o v e r e d by la b o r -m a n a g e m e n t c o n tr a c ts .
M eth od o f W age P aym en t
T abu la tion s by m eth od o f w age paym ent re la te to the n u m ber o f w o r k e r s pa id under the v a r io u s tim e and in cen tive w age s y s te m s . F o r m a l ra te s tru c tu re s fo r t im e -r a te d w o r k e r s p ro v id e s in g le ra te s o r a ran ge o f ra te s f o r in d iv idua l jo b c a te g o r ie s . In the a b se n ce o f a fo r m a l ra te s tru c tu re , pay ra te s a re d e te rm in e d p r im a r ily w ith r e fe r e n c e to the q u a lif ic a tion s o f the in d iv id u a l w o r k e r . A s in g le ra te s tru ctu re is one in w h ich the sa m e ra te is pa id to a ll e x p e r ie n c e d w o r k e r s in the sam e jo b c la s s i f ic a t io n . L e a r n e r s , a p p re n t ice s , o r p ro b a tio n a ry w o rk e rs m ay be p a id a c c o r d in g to ra te sch e d u le s w h ich s ta rt b e low the s in g le ra te and p e rm it the w o r k e r s to a ch ie v e the fu ll jo b ra te o v e r a p e r io d o f t im e . Individual e x p e r ie n c e d w o r k e r s m ay o c c a s io n a l ly be pa id a bove o r b e low the s in g le ra te f o r s p e c ia l r e a s o n s , but su ch paym en ts a re r e g a rd e d as e x ce p t io n s . R a n g e -o f -r a te p lan s a re th ose in w h ich the m in im u m a n d /o r m a x im u m ra te s pa id e x p e r ie n c e d w o r k e r s fo r the sa m e jo b a re s p e c if ie d . S p e c if ic ra te s o f in d iv id u a l w o r k e r s w ith in the range m ay be d e te rm in e d by m e r it , length o f s e r v ic e , o r a com b in a tion o f v a r io u s co n ce p ts o f m e r it and length o f s e r v ic e . In cen tiv e w o r k e r s a re c la s s i f ie d u nder p ie c e w o r k o r bonus p la n s . P ie c e w o r k is w o rk fo r w h ich a p re d e te rm in e d rate is pa id fo r ea ch unit o f output. P ro d u c t io n b on u ses a re b a se d on p ro d u ctio n in e x c e s s o f a quota o r fo r co m p le t io n o f a jo b in le s s than stan dard t im e .
S ch edu led W eek ly H ou rs
D ata on w eek ly h ou rs r e fe r to the p red om in a n t w o rk sch ed u le fo r fu l l - t im e p ro d u ctio n w o r k e r s (o r o f f ic e w o r k e r s ) e m p lo y e d on the day sh ift .
S u pp lem en tary W age P r o v is io n s
S u pp lem en tary b e n e fits w e re tre a te d s ta t is t ica lly on the b a s is that i f fo r m a l p r o v is io n s f o r su p p lem en ta ry b e n e fits w e r e a p p lica b le to o n e -h a lf o r m o r e o f the p ro d u ctio n w o r k e r s (o r o f f ic e w o r k e r s ) in an e s ta b lish m e n t, the b en e fits w e re c o n s id e r e d a p p lica b le to a ll su ch w o r k e r s . S im ila r ly , if fe w e r than o n e -h a lf o f the w o r k e r s w e re c o v e r e d , the b e n e fit w as c o n s id e r e d n on ex is ten t in the e s ta b lish m e n t. B e ca u se o f le n g t h -o f - s e r v ic e and o th er e l i g i b ility re q u ire m e n ts , the p ro p o r t io n o f w o r k e r s r e c e iv in g the b en e fits m a y be s m a lle r than e s tim a te d .
P a id H o lid a y s . P a id h o lid a y p r o v is io n s re la te to fu ll -d a y and h a lf-d a y h o lid a y s p r o v id ed annually .
Digitized for FRASER http://fraser.stlouisfed.org/ Federal Reserve Bank of St. Louis

42
P a id V a c a t io n s . T he s u m m a rie s o f v a ca tio n p lans a re lim ite d to fo r m a l a rra n g e m e n ts , ex c lu d in g in fo r m a l p lans w h ereb y tim e o f f w ith pay is gran ted at the d is c r e t io n o f the e m p lo y e r o r the s u p e r v is o r . P a ym en ts not on a tim e b a s is w e re c o n v e r te d ; fo r e x a m p le , a paym en t o f 2 p e r ce n t o f annual ea rn in g s w as c o n s id e r e d the equ iva len t o f 1 w eek*s pay. The p e r io d s o f s e r v ic e fo r w h ich data a re p re s e n te d w e re s e le c te d as re p re s e n ta t iv e o f the m o s t co m m o n p r a c t i c e s , but they do not n e c e s s a r i ly r e f le c t in d iv id u a l e s ta b lish m e n t p r o v is io n s fo r p r o g r e s s io n . F o r e x a m p le , the ch an ges in p ro p o r t io n s in d ica ted at 10 y e a r s o f s e r v ic e m a y in clu d e ch an ges w h ich o c c u r r e d betw een 5 and 10 y e a r s .
H ealth , In su ra n ce , and R e t ire m e n t P la n s . D ata a re p re s e n te d fo r a ll health , in su ra n ce , and r e t ir e m e n t p lans fo r w h ich a ll o r p a rt o f the c o s t is b o rn e by the e m p lo y e r , ex clu d in g on ly p r o g r a m s r e q u ir e d by law , su ch as w o rk m e n ’ s co m p e n sa tio n and s o c ia l s e c u r ity . A m on g the p lans in c lu d ed a re th ose u n d erw ritten by a c o m m e r c ia l in su ra n ce com p a n y , and th ose pa id d ir e c t ly by the e m p lo y e r fr o m h is cu rre n t op era tin g funds o r fr o m a fund se t a s id e fo r th is p u rp o se .
D eath b e n e fits a re in c lu d ed as a fo r m o f li fe in su ra n ce . S ick n e ss and a cc id e n t in s u r an ce is l im ite d to that type o f in su ra n ce u nder w h ich p re d e te rm in e d ca sh paym en ts a re m ade d ir e c t ly to the in su re d on a w eek ly o r m on th ly b a s is du rin g il ln e s s o r a cc id e n t d isa b ility . In fo rm a tion is p re se n te d fo r a ll such p lans to w h ich the e m p lo y e r co n tr ib u te s at le a s t a p a rt o f the c o s t . H o w e v e r , in New J e r s e y and New Y o rk , w h ere te m p o r a r y d isa b ility in su ra n ce law s re q u ire e m p lo y e r co n tr ib u tio n s , 10 p lans a re in c lu d ed on ly i f the e m p lo y e r ( l ) co n tr ib u te s m o r e than is le g a lly re q u ire d , o r (2) p ro v id e s the e m p lo y e e s w ith b e n e fits w h ich e x c e e d the re q u ire m e n ts o f the law .
T a b u la tion s o f p a id s ic k lea v e p lans a re lim ite d to fo r m a l p lans w h ich p ro v id e fu ll pay o r a p r o p o r t io n o f the w o rk e r* s pay du rin g a b se n ce fr o m w o rk b e ca u s e o f i l ln e s s ; in fo rm a l a rra n g e m e n ts have b een o m itted . S eparate tabu la tion s a re p ro v id e d a c c o r d in g to ( l ) p lans w h ich p ro v id e fu ll pay and no w aitin g p e r io d , and (2) p lans p ro v id in g e ith e r p a r t ia l pay o r a w a itin g p e r io d .
M e d ica l in su ra n ce r e fe r s to p lans p rov id in g f o r c o m p le te o r p a r t ia l paym en t o f d octo rs* fe e s . T h ese p lan s m a y be u n d erw ritten by a c o m m e r c ia l in su ra n ce com p a n y o r a n on p ro fit o rg a n iz a t io n , o r they m a y be s e l f - in s u r e d .
C a ta strop h e in su ra n ce , s o m e t im e s r e fe r r e d to as ex ten ded m e d ic a l in su ra n ce , in c lu d es p lans d e s ig n e d to c o v e r e m p lo y e e s in ca s e o f s ick n e s s o r in ju ry in v o lv in g an ex p en se w h ich g o e s beyon d the n o rm a l c o v e r a g e o f h o sp ita liz a tio n , m e d ic a l, and s u r g ic a l p la n s .
T a b u la tion s o f r e t ir e m e n t p en s ion s a re lim ite d to p lans w h ich p ro v id e , upon r e t ir e m e n t , re g u la r paym en ts fo r the re m a in d e r o f the w ork er*s l i fe . D ata a re p re se n te d se p a ra te ly fo r lu m p -su m r e t ir e m e n t pay (one paym en t o r a s p e c if ie d n u m ber o v e r a p e r io d o f t im e ) m ad e to e m p lo y e e s upon r e t ir e m e n t . E sta b lish m en ts p ro v id in g both lu m p -s u m paym en ts and p en s ion s to e m p lo y e e s upon re t ir e m e n t w e re c o n s id e r e d as having both r e t ir e m e n t p en s ion and lu m p -su m r e t ir e m e n t pay . E sta b lish m en ts having op tion a l p lans p ro v id in g e m p lo y e e s a c h o ic e o f e ith e r lu m p -su m r e t ir e m e n t paym en ts o r p en s ion s w e r e c o n s id e r e d as having on ly r e t ir e m e n t p en s ion b e n e fits .
P a id F u n e ra l and J u ry Duty L e a v e . D ata f o r p a id fu n e ra l and ju r y duty le a v e a re lim ite d to fo r m a l p lans w h ich p ro v id e at le a s t p a r t ia l paym en t fo r t im e lo s t as a r e s u lt o f attending fu n era ls o f s p e c if ie d fa m ily m e m b e r s o± s e rv in g as a ju r o r .
S e v e ra n ce P a y . D ata re la te to fo r m a l p lans p ro v id in g fo r paym en ts to e m p lo y e e s p erm a n en tly se p a ra te d fr o m the com p a n y th rough no fau lt o f th e ir ow n.
10 The temporary disability insurance laws in California and Rhode Island do not require employer contributions.
Digitized for FRASER http://fraser.stlouisfed.org/ Federal Reserve Bank of St. Louis

Appendix B. Occupational Descriptions
The prim ary purpose of preparing job descriptions for the Bureau’ s wage surveys is to assist its field staff in classifying into appropriate occupations workers who are employed under a variety of payroll titles and different work arrangements from establishment to establishment and from area to area. This perm its the grouping of o ccu pational wage rates representing comparable job content. Because of this emphasis on interestablishment and inter - area com parability of occupational content, the Bureau’ s job descriptions may differ significantly from those in use in individual establishments or those prepared for other purposes. In applying these job descriptions, the Bureau’ s field staff is instructed to exclude working supervisors, apprentices, learners, beginners, trainees, handicapped, part-tim e, tem porary, and probationary w orkers.
Plant Jobs
ASSEMBLER
(Garment bundle r, as sorter)
Gathers garment parts after they are cut and assem bles or groups them into bundles or batches for distribution to sewing units. May match pieces by co lor, size, and design and place an identifying ticket or number in each bundle or on each piece. W orkers, a s sembling cloth before it is cut, and folders, assembling com pleted pieces at the end of the production process before packaging, are excluded.
CUTTER, MACHINE
Operates or guides the moving knife or blade of a powered cutting machine along a pattern outline to cut out articles from single or multiple layers or fabric. In addition, may spread or lay up layers of cloth, or may arrange pattern on m aterial and outline with chalk.
FOLDER, GARMENTFolds com pleted garments for shipment either by hand or by a folding machine. May
fold garments around cardboard form s or insert tissue paper between folds; and may also pin folds in garments. For wage survey purposes, garment folders are classified as follow s:
Folder, garment, handFolder, garment, machineFolder, garment, hand and machine
GARMENT REPAIRMAN (Match-up g irl, mender)
Operates sewing machine to repair damaged or defective garments. Examines repair tags and matchings on garments to locate defects or damage, such as irregular stitches and torn or snagged parts. Cuts and pulls seam threads to rem ove defective or damaged parts, using sc issors or knife. Joins replacement parts to finished garments or resews d efective seams.
4 3
Digitized for FRASER http://fraser.stlouisfed.org/ Federal Reserve Bank of St. Louis

4 4
INSPECTOR, FINAL,
Prim arily responsible for inspection of com pleted garments prior to pressing or shipping but also may trim threads incidental to inspection operation. Work involves prim arily whether the garments conform to shop standards o f quality and marking defects such as dropped stitches, bad seam s, etc.
JANITOR
(Sweeper, charwoman, janitress)
Cleans and keeps in an orderly condition factory working areas and w ashroom s, or prem ises o f an o ffice , apartment house, or com m ercia l or other establishment. Duties volve a combination of the follow ing: Sweeping, mopping or scrubbing, and polishing floors ; removing chips, trash, and other refuse; dusting equipment, furniture, or fixtures; polishing metal fixtures or trim m ings; providing supplies and minor maintenance serv ices ; and cleaning lavatories, showers, and restroom s. W orkers specializing in window washing are excluded.
MARKER
Arranges garment patterns on cloth in such a manner as to m inim ize waste when m aterial is cut. Work includes tracing outline of pattern on m aterial with chalk, soap, or crayon, and marking design number and size within outline. May arrange pattern on paper to produce m arker which serves as a cutting outline.
W orkers engaged in simple tracing (tracers) around patterns laid out on the m aterial by others and those who lay out patterns according to prepared diagrams are excluded.
PRESSER, FINISH(O ff-p resser , over p resser , top presser)
P erform s final pressing operations on garments or garment parts by means of a hand pressing iron and/or powered press, mangle, or power press equipped with steam jets .
F or wage study purposes, p ressers are classified by type of pressing equipment, as follow s:
P resser , finish, hand P resser , finish, machine P resser , finish, hand and machine
W orkers are classified as "p ressers , hand and m achine" when sizable proportions of their work are perform ed by each of the two methods. Otherwise, the predominant type of pressing is the determining factor in classification .
REPAIRMAN, SEWING MACHINEAdjusts and repairs sewing machines used in the establishment. Work involves m ost
o f the follow ing: Examining machines faulty in operation to diagnose source of trouble; d is mantling or partly dismantling machines, replacing broken or worn out parts or perform ing other repairs, and reassem bling machines; adjusting machines to function efficiently by turning adjustment screw s and nuts; regulating length of stroke of needle, and horizontal movement feeding mechanism under needle; replacing or repairing transm ission belts; p re paring specifications for m ajor repairs and initiating orders for replacem ent parts; and using a variety o f handtools in fitting and replacing parts.
SEWING-MACHINE OPERATOR
Uses a standard or special-purpose sewing machine to perform the sewing operations required in making parts of garments, in joining various sections together, in attaching previously completed parts to partially completed garments, or in sewing on buttons or sewing button holes. May make a complete garment.
Digitized for FRASER http://fraser.stlouisfed.org/ Federal Reserve Bank of St. Louis

4 5
SEWING -MACHINE OPERATOR— Continued
For wage study purposes, operators are classified according to the principal garment on which they work:
Sewing-machine operator, work shirts Sewing-machine operator, work pantsSewing-machine operator, overalls and industrial garments Sewing-machine operator, washable service apparel Sewing-machine operator, dungarees Sewing-machine operator, otherSewing-machine operators prim arily engaged in repairing garments are excludedfrom
the classifications listed above (see garment repairman).
SHIPPING CLERKPrepares m erchandise for shipment. Duties usually involve a knowledge of shipping
procedures and practices, routes, rates, and available means of transportation. Prepares records of goods shipped, makes up bills of lading, and posts weight and shipping charges. Keeps a file of shipping records. May direct or assist in preparing merchandise for shipment.
SPREADERSpreads (lays-up) multiple layers of cloth smoothly and evenly, one upon the other,
on a cutting table by hand or with the aid of a spreading machine. Cuts each ply to length from the bolt o f m aterial.
STOCK CLERKR eceives, stores, and issues equipment, m aterial, m erchandise, or tools in a stockroom
or storeroom . Work involves: Checking incoming order against items as listed on requisitions or invoices, and counting, grading, or weighing the articles .
Excluded are stockroom laborers and em ployees who supervise stock clerks andlaborers.
THREAD TRIMMER (Cleaner)
Trim s loose thread ends, basting threads, and seam edges of garments with scissors or machines prior to pressing or packing. W orkers whose prim ary responsibility is the inspection of garments but who also trim threads incidental to the inspection operation are to be classified as inspector, final.
UNDERPRESSER(F orep resser , parts presser)
Uses a hand iron, machine iron, or a powered press to press garment parts, such as pockets, seam s, shoulders, etc. , during the fabricating p rocess .
W orkers should be classified according to the type o f pressing equipment used:U nderpresser, hand U nderpresser, machine
WATCHMANMakes round of prem ises periodically to protect property against fire , theft, and
illegal entry.
WORK DISTRIBUTORC arries or trucks garments in various stages o f completion to the w orker who is to
perform the next operation on garment. May exercise some discretion in distribution of work, but has no supervisory responsib lities.
Digitized for FRASER http://fraser.stlouisfed.org/ Federal Reserve Bank of St. Louis

4 6
Office Jobs
CLERK, GENERAL.
Typically perform s a variety of office operations, usually because of im practicability of specialization in a sm all office or because versatility is essential in meeting peak r e quirements in larger o ffices . The work generally involves the use of independent judgment in tending to a pattern of office work from day to day, as well as knowledge relating to phases of office work that occur only occasionally. For example, the range of operations perform ed may entail all or some combination of the follow ing: Answering correspondence,preparing bills and invoices, posting to various records, preparing payrolls, filing, etc. May operate various office machines and type as the work requires.
CLERK, PAYROLL
Computes wages of company em ployees and enters the necessary data on the payroll sheets. Duties involve: Calculating w orkers ' earnings based on time or production records; and posting calculated data on payroll sheets, showing inform ation such as w orkers ' name, working days, time, rate, deductions for insurance, and total wages due. May make out pay- checks and assist paymaster in making up and distributing pay envelopes. May use a ca lculating machine.
STENOGRAPHER, GENERAL
Prim ary duty is to take dictation, involving a norm al routine vocabulary, from one or m ore persons either in shorthand or by Stenotype or sim ilar machine; and transcribe d ic tation. May also type from written copy. May maintain files , keep simple records or p er form other relatively routine c le rica l tasks. May operate from a stenographic pool. Does not include transcribing-m achine work.
TYPIST
Uses a typewriter to make copies of various m aterial or to make out bills after ca lculations have been made by another person. May include typing of stencils, m ats, or sim ilar m aterials for use in duplicating p rocesses . May do c le rica l work involving little special training, such as keeping simple records, filing records and reports, or sorting and distributing incoming m ail.
Class A. Perform s one or m ore of the follow ing: Typing m aterial in final form when it involves combining m aterial from several sources or responsibility for correct spelling, syllabication, punctuation, etc. , of technical or unusual words or foreign language m aterial; and planning layout and typing of com plicated statistical tables to maintain uniformity and balance in spacing. May type routine form letters varying details to suit circum stances.
Class B. Perform s one of m ore of the follow ing: Copy typing from rough orclear drafts; routine typing of form s, insurance po lic ies , e t c .; and setting up simple standard tabulations, or copying m ore com plex tables already set up and spaced properly .
Digitized for FRASER http://fraser.stlouisfed.org/ Federal Reserve Bank of St. Louis

I n d u s t r y W a g e S t u d ie s
The m ost recent reports for industries included in the Bureau's program of industry- wage surveys since January I960 are listed below. Those for which a price is shown are available from the Superintendent of Documents, U. S0 Government Printing O ffice, Washington, D. C. , 20402, or any of its regional sales o ffices . Those for which a price is not shown may be obtained free as long as a supply is available, from the Bureau o f Labor Statistics, Washington, D. C. , 20212, or from any of the regional offices shown on the inside back cover.
I. Occupational Wage StudiesManufacturing
Basic Iron and Steel, 1967. BLS Bulletin 1602 (55 cents).Candy and Other Confectionery Products, 1965. BLS Bulletin 1520 (30 cents).
^Canning and Freezing, 1957. BLS Report 136.Cigar Manufacturing, 1967. BLS Bulletin 1581 (25 cents).Cigarette Manufacturing, 1965. BLS Bulletin 1472 (20 cents).Cotton Textiles, 1965. BLS Bulletin 1506 (40 cents).Distilled Liquors, 1952. Series 2, No. 88.
Fabricated Structural Steel, 1964. BLS Bulletin 1463 (30 cents).F ertilizer Manufacturing, 1966. BLS Bulletin 1531 (30 cents).Flour and Other Grain Mill Products, 1967. BLS Bulletin 1576 (25 cents).Fluid Milk Industry, 1964. BLS Bulletin 1464 (30 cents).Footwear, 1965. BLS Bulletin 1503 (50 cents).H osiery, 1967. BLS Bulletin 1562 (70 cents).
Industrial Chem icals, 1965. BLS Bulletin 1529 (40 cents).Iron and Steel Foundries, 1962. BLS Bulletin 1386 (40 cents).Leather Tanning and Finishing, 1963. BLS Bulletin 1378 (40 cents).M achinery Manufacturing, 1966. BLS Bulletin 15 63 (70 cents).Meat Products, 1963. BLS Bulletin 1415 (75 cents).Men's and Boys* Shirts (Except Work Shirts) and Nightwear, 1964. BLS Bulletin 1457 (40 cents). M en's and B oys' Suits and Coats, 1967. BLS Bulletin 1594 (75 cents).M iscellaneous Plastics Products, 1964. BLS Bulletin 1439 (35 cents).M iscellaneous Textiles, 1953. BLS Report 56.M otor V eh ic les and M otor V ehicle P a rts , 1963. BLS Bulletin 1393 (45 cents).
Nonferrous Foundries, 1965. BLS Bulletin 1498 (40 cents).Paints and Varnishes, 1965. BLS Bulletin 1524 (40 cents).Paperboard Containers and Boxes, 1964. BLS Bulletin 1478 (70 cents).Petroleum Refining, 1965. BLS Bulletin 1526 (30 cents).P ressed or Blown Glass and Glassware, 1964. BLS Bulletin 1424 (30 cents).
^Processed Waste, 1957. BLS Report 124.Pulp, Paper, and Paperboard M ills, 1967. BLS Bulletin 1608 (60 cents).Radio, Television, and Related P roducts, 1951. Series 2, No. 84.Railroad Cars, 1952. Series 2, No. 86.
*Raw Sugar, 1957. BLS Report 136.
Southern Sawmills and Planing M ills, 1965. BLS Bulletin 1519 (30 cents).Structural Clay Products, 1964. BLS Bulletin 1459 (45 cents).Synthetic F ibers, 1966. BLS Bulletin 1540 (30 cents).Synthetic Textiles, 1965. BLS Bulletin 1509 (40 cents).Textile Dyeing and Finishing, 1965—66. BLS Bulletin 1527 (45 cents).
^Tobacco Stemming and Redrying, 1957. BLS Report 136.
* Studies of the effects of the $1 minimum wage.
Digitized for FRASER http://fraser.stlouisfed.org/ Federal Reserve Bank of St. Louis

I. Occupational Wage Studies— Continued
Manufacturing— C ont inu ed
West Coast Sawmilling, 1964, BLS Bulletin 1455 (30 cents).Women's and M isses* Coats and Suits, 1965. BLS Bulletin 1508 (25 cents).W omen's and M isses ' D resses, 1966. BLS Bulletin 1538 (30 cents).Wood Household Furniture, Except Upholstered, 1965. BLS Bulletin 1496 (40 cents).
♦Wooden Containers, 1957. BLS Report 126.Wool Textiles, 1966. BLS Bulletin 1551 (45 cents).Work Clothing, 1964. BLS Bulletin 1440 (35 cents).
Nonmanufacturing
Auto Dealer Repair Shops, 1964. BLS Bulletin 1452 (30 cents).Banking, 1964. BLS Bulletin 1466 (30 cents).Bituminous Coal Mining, 1967. BLS Bulletin 1583 (50 cents).Communications, 1967. BLS Bulletin 1615 (30 cents).Contract Cleaning Serv ices, 1965. BLS Bulletin 1507 (30 cents).Crude Petroleum and Natural Gas Production, 1967. BLS Bulletin 1566 (30 cents). Department and Women’ s R eady-to-W ear Stores, 1950. Series 2, No. 78.Eating and Drinking P laces, 1966—67. BLS Bulletin 1588 (40 cents).E lectric and Gas Utilities, 1962. BLS Bulletin 1374 (50 cents).Hospitals, 1966. BLS Bulletin 1553 (70 cents).Hotels and M otels, 1966—67. BLS Bulletin 1587 (40 cents).Laundry and Cleaning Services, 1966. BLS Bulletin 1544 (60 cents).Life Insurance, 1966. BLS Bulletin 1569 (30 cents).Motion Picture Theaters, 1966. BLS Bulletin 1542 (35 cents).Nursing Homes and Related F acilities, 1965. BLS Bulletin 1492 (45 cents).
II. Other Industry Wage Studies
Factory W orkers' Earnings— Distribution by Straight-Tim e Hourly Earnings, 1968.BLS Bulletin 1252 (40 cents).
Factory W orkers' Earnings— Selected Manufacturing Industries, 1959.BLS Bulletin 1275 (35 cents).
Employee Earnings and Hours in Nonmetropolitan Areas of the South and North Central Regions, 1965. BLS Bulletin 1552 (50 cents).
Employee Earnings and Hours in Eight Metropolitan A reas of the South, 1965.BLS Bulletin 1533 (40 cents).
Employee Earnings and Hours in Retail Trade, June 1966—Retail Trade (Overall Summary). BLS Bulletin 1584 ($1).Building M aterials, Hardware, and Farm Equipment D ealers. BLS Bulletin 1584-1
(30 cents).General Merchandise Stores. BLS Bulletin 1584-2 (55 cents).Food Stores. BLS Bulletin 1584-3 (60 cents).Automotive Dealers and Gasoline Service Stations. BLS Bulletin 1584-4 (50 cents). Apparel and A ccessory Stores. BLS Bulletin 1584-5 (55 cents).Furniture, Home Furnishings, and Household Appliance Stores. BLS Bulletin 1584-6
(50 cents).M iscellaneous Retail Stores. BLS Bulletin 1584-7 (65 cents).
♦ Studies of the effects of the $1 minimum wage.
☆ U. S. GOVERNMENT PRINTING OFFICE : 1969 O - 351-144
Digitized for FRASER http://fraser.stlouisfed.org/ Federal Reserve Bank of St. Louis
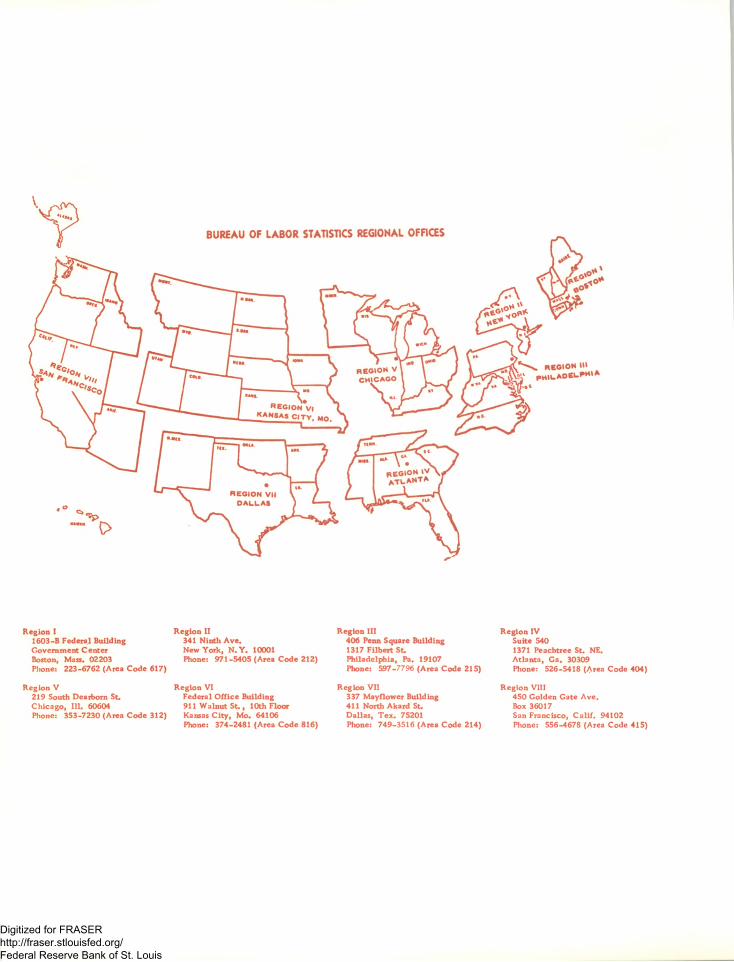
Region I1603-B Federal Building Government Center Boston, Mass. 02203 Phone: 223-6762 (Area Code 617)
Region II341 Ninth Ave.New York, N .Y . 10001Phone: 971-5405 (Area Code 212)
Region V219 South Deaiborn St.Chicago, 111. 60604Phone: 353-7230 (Area Code 312)
Region VIFederal Office Building 911 Walnut St., 10th Floor Kansas City, Mo. 64106 Phone: 374-2481 (Area Code 816)
Region III406 Penn Square Building 1317 Filbert St.Philadelphia, Pa. 19107 Phone: 597-7796 (Area Code 215)
Region VII337 Mayflower Building 411 North Akard St.Dallas, Tex. 75201Phone: 749-3516 (Area Code 214)
Region IV Suite 5401371 Peachtree St. NE.Atlanta, Ga. 30309Phone: 526-5418 (Area Code 404)
Region VIII450 Golden Gate Ave.Box 36017San Francisco, Calif. 94102 Phone: 556-4678 (Area Code 415)
Digitized for FRASER http://fraser.stlouisfed.org/ Federal Reserve Bank of St. Louis

U.S. DEPARTMENT OF LABORB U R E A U O F L A B O R S T A T IS T IC S
W ASHINGTON, D .C . 20212
O F F I C I A L B U S I N E S S
P O S T A G E A N D F E E S P A I D U . S . D E P A R T M E N T O F L A B O R
I THIRD CLASS MAIL I L — — — — — — — —J
Digitized for FRASER http://fraser.stlouisfed.org/ Federal Reserve Bank of St. Louis
Recommended


