Biomechanics of Head Impacts in Soccer
Jaclyn Nicole Press
Thesis submitted to the faculty of the Virginia Polytechnic Institute and State University in partial fulfillment of the requirements for the degree of
Master of Science
In Biomedical Engineering
Steven Rowson, Committee Chair Stefan M. Duma
P. Gunnar Brolinson
April 29th, 2016 Blacksburg, VA
Keywords: Concussion, acceleration, sensor, headgear, soccer, football
Copyright © 2016, Jaclyn N. Press

Biomechanics of Head Impacts in Soccer Jaclyn Nicole Press
SCHOLARLY ABSTRACT
An estimated 3.8 million sports-related concussions occur every year. Little research has
been collected on soccer players, despite women’s soccer having the third highest rate
of concussion among all popular collegiate sports. The objective of this work was to
evaluate multiple interventions that have been introduced to address the high rate of
concussions in this population. Wearable head impact sensors were evaluated on their
ability to accurately count and measure head impacts during a collegiate women’s soccer
season. Head impact exposure was quantified using video analysis of this season as well.
Sensors were unable to accurately count impacts and reported nonsensical head
acceleration measurements, indicating that data reported from head impact sensors
should be interpreted with caution. The ability of soccer headgear to reduce linear and
rotational head accelerations during common soccer impacts was examined in the
laboratory. Ball-to-head and head-to-head impacts were performed at a range of speeds
and impact orientations. Headgear resulted in small reductions during ball-to-head tests,
which are not likely to be clinically relevant. In head-to-head tests, use of headgear on
the struck head provided an overall 35% reduction in linear head acceleration, and a 53%
reduction when another headgear was added to the striking head. The ten headgear
tested varied greatly in performance. These data suggest that the use of protective
headgear could reduce concussion incidence significantly in this population. Research
presented in this thesis will inform soccer organizations on best practices for player safety
with regard to head impacts.
Word Count: 245

Biomechanics of Head Impacts in Soccer Jaclyn Nicole Press
GENERAL AUDIENCE ABSTRACT
Concussions in sports are an increasing concern for coaches, parents, and players. An
estimated 3.8 million sports-related concussions occur every year. Little research has
been collected on soccer players, despite women's soccer having the third highest rate
of concussion among all popular collegiate sports. Various interventions have been
proposed to address this high rate of concussion. The objective of this work was to
evaluate some of these interventions. Wearable head impact sensors were evaluated on
their ability to accurately count and measure all types of head impacts during a collegiate
women's soccer season. The number and nature of head impacts was also gathered
using video analysis. Results indicate that head impact sensors struggled with producing
reliable data and thus we advise that data gathered using these types of sensors should
be interpreted with caution. The ability of soccer headgear to reduce head impact severity
during common soccer impacts was examined in the laboratory. Ball-to-head and head-
to-head impacts were performed to evaluate headgear performance. Headgear resulted
in only small reductions during ball-to-head tests. In head-to-head tests, use of headgear
on the struck head provided an overall 35% reduction, and a 53% reduction when another
headgear was added to the striking head. The ten headgear tested varied greatly in
performance. These data suggest that the use of protective headgear could reduce
concussion incidence significantly in this female soccer players. Research presented in
this thesis will inform soccer organizations on best practices for player safety with regard
to head impacts.
Word Count: 247

iv
DEDICATION
I would like to dedicate this thesis to my mom, for her undying love and support, and my
dad, for his constant guidance and inspiration. Thank you for always making me feel
special and pushing me to strive for greatness in everything that I do. I love you.
~
I would like to first acknowledge my advisor, Dr. Steve Rowson. Thank you for
encouraging me to grow as a student, researcher, and individual. Your mentorship and
direction have meant so much to me, and I am so lucky to have had your guidance over
the past two years. I would also like to thank my other committee members, Dr. Stefan
Duma and Dr. Gunnar Brolinson.
I would also like to thank all of my fellow graduate students: Jake Smith, Davy Sproule,
Megan Bland, and Eamon Campolettano. Your friendship made it easy to come to work
every day. Shout out to Jake for putting up with me all this time; I am so happy that we’ve
become so close and know we will stay that way as long as my house is near a decent
golf course. Finally, a special thanks to Davy for the happiness and laughter you bring me
every day. Your love and support has helped me more than you know.
Last, but certainly not least, I would like to thank my friends back in Philadelphia and
Richmond. I am so lucky to have forever friends in you all. Thank you for being such bright
lights in my life.

v
TABLE OF CONTENTS DEDICATION ............................................................................................ iv
LIST OF FIGURES .................................................................................... vi
LIST OF TABLES .................................................................................... viii
CHAPTER 1: INTERVENTIONS ASSOCIATED WITH CONCUSSIONS IN SOCCER .................................................................................................... 1
Opening Remarks ........................................................................................................ 1
Wearable Head Impact Sensors .................................................................................. 1
Soccer Headgear ......................................................................................................... 2
CHAPTER 2: QUANTIFYING HEAD IMPACT EXPOSURE IN COLLEGIATE WOMEN’S SOCCER .......................................................... 3
Abstract ........................................................................................................................ 3
Introduction .................................................................................................................. 5
Materials and Methods ................................................................................................. 7
Results ....................................................................................................................... 10
Discussion.................................................................................................................. 16
References ................................................................................................................. 20
CHAPTER 3: BIOMECHANICAL PERFORMANCE OF HEADGEAR USED IN SOCCER .............................................................................................. 23
Abstract ...................................................................................................................... 23
Introduction ................................................................................................................ 25
Materials and Methods ............................................................................................... 27
Results ....................................................................................................................... 33
Discussion.................................................................................................................. 45
References ................................................................................................................. 51
CHAPTER 4: CLOSING REMARKS ........................................................ 57
Research Summary ................................................................................................... 57
Publication Outline ..................................................................................................... 58

vi
LIST OF FIGURES
Chapter 1
Figure 1. A head impact sensor containing three linear accelerometers and three angular rate sensors placed behind the ear of a player ............................................................... 8 Figure 2. Average number of impacts sustained per player over the course of a season divided into player positions. Midfielders sustained the highest average number of impacts per player while goalkeepers sustained the lowest. Forwards and defenders saw similar average number of impacts per player. .............................................................. 11 Figure 3. Distribution of impact type by player position. Headers represented the majority of impacts for forwards, midfielders, and defenders. Goalkeepers only sustained head impacts from falling. ...................................................................................................... 11 Figure 4. Probability density function and cumulative distribution function for total impacts across all instrumented players throughout the season. A logistic distribution with µ = 60.01 AND σ = 25.45 was used to fit the data. .............................................................. 13 Figure 5. Positive predictive value (PPV) of a head impact being correctly identified across a span of linear acceleration thresholds. PPV was maximized at a threshold of 34g, where 65.8% of positive recorded impacts were true positive results. ..................................... 14 Figure 6. ROC plot indicating sensor accuracy. An area under the curve of 1.0 would indicate perfect classification, while an area of 0.5 would indicate random guessing. Sensors are 18% more accurate with games than with practices. ................................ 15
Chapter 2
Figure 1. A JUGS Soccer Shooter was mounted to shoot soccer balls horizontally towards a medium NOCSAE headform mounted on a Hybrid III 50th percentile neck. .............. 28 Figure 2. A custom impactor was designed and built to simulate head-to-head impacts in soccer. The system consists of two head and neck assemblies mounted onto sliding masses which are free to translate. One sliding mass is accelerated to a target velocity and impacts another, stationary sliding mass with free travel. The impacted mass is instrumented to measure impact kinematics. ................................................................ 31 Figure 3. Box plots denote the first, second, and third quartiles for head acceleration values with the use of protective headgear for all ball-to-head tests. Whiskers extend to minimum and maximum recorded values. Solid red boxes above the box plots indicate mean control accelerations ± one standard deviation. In some cases, the red control box overlaps the box plot. Small differences are observed between head accelerations with and without the use of protective headgear. .................................................................. 33

vii
Figure 4. Concussion risk for all ball-to-head impacts was below 1%, with or without the use of protective headgear.34 ........................................................................................ 36 Figure 5. Concussion risk for all head-to-head impacts ranged from less than 1% to greater than 90% risk. ................................................................................................... 37 Figure 6. Box plots denote the first, second, and third quartiles for head acceleration values with the use of protective headgear for all bare head to headgear tests. Whiskers extend to minimum and maximum recorded values. Solid red boxes above the box plots indicate mean control accelerations ± one standard deviation. Headgear were able to reduce linear and rotational accelerations significantly from the control condition. ....... 40 Figure 7. Box plots denote the first, second, and third quartiles for head acceleration values with the use of protective headgear for all headgear to headgear tests. Whiskers extend to minimum and maximum recorded values. Solid red boxes above the box plots indicate mean control accelerations ± one standard deviation. Headgear were able to reduce linear and rotational accelerations significantly from the control condition, even more-so than in the bare head to headgear tests. ......................................................... 43 Figure 8. Two individual headgear performances with respect to concussion risk compared to control (bare headform) performance. Mean risk ± one standard deviation is shown for each condition. Results for both impact orientations (side and back) were combined. The Storelli ExoShield resulted in the smallest overall incidence metric, while the ForceField Regular resulted in the largest (least different from control). ................. 49

viii
LIST OF TABLES
Chapter 1
Table 1. Impact types with descriptions. .......................................................................... 9 Table 2. Classification of true positive, false positive, true negative, and false negative impacts for the purpose of this study. .............................................................................. 9 Table 3. Impact incidence breakdown across all players for all games and practices throughout the season (# G/P = # games/practices). The vast majority of impacts sustained throughout the season were headers, representing 90% of all 1,703 total impacts. ......................................................................................................................... 12 Table 4. Sensor-recorded impact classifications for the duration of the season. ........... 14 Table 5. Impact measurement breakdown by type across all players for games and practices throughout the season. .................................................................................. 16
Chapter 2
Table 1. Ten commercially available soccer headgear were purchased for this study. . 29 Table 2. Two head-to-head impact locations were tested. These conditions are described for potential replication. All measurements are in relation to a “zero” condition where midsagittal plane and transverse plane markings on the NOCSAE headform were aligned with headforms facing each other. Directions are in relation to a global coordinate system (Figure 2). ...................................................................................................................... 32 Table 3. Average values ± one standard deviation for peak linear and rotational accelerations, as well as for concussion risk. At a ball velocity of 15 m/s, all headgear significantly reduced concussion risk from the control condition (bare headform). When the ball velocity was increased to 25 m/s, no headgear were able to significantly reduce concussion risk. ............................................................................................................. 35 Table 4. Almost all headgear were able to reduce linear and rotational head accelerations, and consequently concussion risk, significantly in bare head to headgear tests. Use of the Storelli ExoShield resulted in the greatest reduction in concussion risk at the side location, while the ForceField Regular provided the smallest reduction. At the back location, the Unequal Halo 10mm provided the greatest reduction in concussion risk, whereas the Head Blast provided the smallest reduction. ............................................. 41 Table 5. Almost all headgear were able to reduce linear and rotational head accelerations, and consequently concussion risk, significantly in headgear to matched headgear tests. Use of the Storelli ExoShield resulted in the greatest reduction in concussion risk at the
ix
side location, while the ForceField Regular provided the smallest reduction. At the back location, the Unequal Halo 10mm provided the greatest reduction in concussion risk, whereas the Head Blast provided the smallest reduction. ............................................. 44 Table 6. The Storelli ExoShield resulted in the smallest overall incidence metric, while the ForceField Regular resulted in the largest (yet still less than the control condition). ..... 48
Chapter 4
Table 1. Publication plan for research presented in this thesis. .................................... 58

1
CHAPTER 1: INTERVENTIONS ASSOCIATED WITH CONCUSSIONS IN SOCCER
Opening Remarks
Little concussion research has been collected on soccer players, despite women’s soccer
having the third highest rate of concussion among all popular collegiate sports. The
objective of this work was to evaluate multiple interventions that have been introduced to
address the high rate of concussions in soccer players. Wearable head impact sensors
have recently become available, and are being used to collect data in nonhelmeted sport
populations such as soccer players. Soccer headgear has also become popular as a
method of attenuating head accelerations during play. The research presented in this
thesis addresses the relative accuracies of each of these interventions.
Wearable Head Impact Sensors
For over a decade, football players have been instrumented with helmet-mounted
accelerometers to record and measure head impacts. This provides valuable information
regarding exposure and tolerance to head impacts in this population. Until recently,
collecting this data for soccer players was not possible due to the lack of helmet use in
this sport. Wearable head impact sensors have since become available, but have not yet
been examined in their ability to accurately count and measure head impacts during
regular play. The research presented in this thesis collects exposure data in women’s
soccer players through video analysis, and also compares these data with sensor output
to evaluate wearable head impact sensor accuracy on the field. The exposure metrics

2
gathered will contribute towards a better understanding concussion incidence in this
population, and sensor evaluation will provide information for consumers regarding the
efficacy of a new technology.
Soccer Headgear
Many manufacturers are now creating headgear to attenuate head accelerations for
soccer players. It has been shown that player-to-player contact, specifically head-to-head
impact, during aerial challenges is the most likely activity to result in concussion. Soccer
is unique in that it is the only sport that involves the intentional redirection of the ball with
one’s head, and therefore protection from headers is also of interest. The ability of
currently available headgear to reduce concussion risk in common soccer head impact
scenarios is presented in this study. These data have applications towards headgear
design, performance regulation of headgear, and recommendations to athletes with
regards to relative performance.

3
CHAPTER 2: QUANTIFYING HEAD IMPACT EXPOSURE IN COLLEGIATE WOMEN’S SOCCER
Abstract
Objective: The aim of this study was to quantify head impact exposure for a collegiate
women’s soccer team over the course of the 2014 season.
Design: Observational and prospective study.
Setting: Virginia Tech women’s soccer games and practices.
Participants: Twenty-six collegiate level women’s soccer players with a mean player age
of 19 ± 1 years old.
Interventions: Participating players were instrumented with head impact sensors for
biomechanical analysis. Video recordings of each event were used to manually verify
each impact sustained.
Main Outcome Measurements: Head impact counts by player position and impact
situation.
Results: The sensors collected data from a total of 17,865 accelerative events, 8,999 of
which were classified as head impacts. Of these, a total of 1,703 impacts were positively
identified (19% of total real impacts recorded by sensor), 90% of which were associated
with heading the ball. The average number of impacts per player per practice or game
was 1.86 ± 1.42. Exposure to head impact varied by player position.
Conclusions: Head impact exposure was quantified through two different methods, which
illustrated the challenges associated with autonomously collecting acceleration data with
head impact sensors. Users of head impact data must exercise caution when interpreting
on-field head impact sensor data.

4
Key Words: concussion, gender, frequency, sensor, acceleration, football Authors: J. N. Press and S. Rowson Affiliation: Virginia Tech, Department of Biomedical Engineering and Mechanics
Word Count: 210

5
Introduction
Over 265 million people worldwide are actively involved in the game of soccer and there
is ongoing growth in the sport’s popularity.1 This consistent increase in the sport’s
prominence has led to higher awareness of potential injuries, including brain injuries. This
is especially true considering the intentional redirection of the ball with one’s head that is
imperative in soccer, but not in any other sport. In a retrospective study, it was found that
62.7% of soccer players had suffered concussion symptoms in a given year.2 Fuller et al.
performed a case-control study of players sustaining head and neck injuries during FIFA
tournaments and found the incidence of concussion in women to be 2.4 times higher than
that in men.3
While the potential negative effects of repetitive concussions have been well studied, the
effects of chronic exposure to subconcussive impacts are not yet understood. In order to
investigate this, researchers have performed neurocognitive tests on soccer players and
compared the results to those of control subjects.2, 4-8 Some studies have noted deficits
in attention, concentration, memory, and judgment in soccer players when compared with
controls.2, 4, 7 Electroencephalograph (EEG) tracings of the brain have also been shown
to exhibit increased abnormalities in soccer players compared to nonsoccer players.7
Other research, however, disputes these findings and criticizes the earlier studies for
methodological flaws such as inadequate control groups and inability to account for
subject variables including alcohol intake and previous concussion history.5, 6, 8
Furthermore, it is unclear whether the observed neurological deficits are from repeated
6
subconcussive head impacts or associated with a history of concussion. These studies
highlight the need for further research on head impacts in soccer.
While there have been studies in the past that have examined women’s soccer head
impacts, most have been restricted to recreating impact situations in a laboratory setting
in order to estimate head accelerations.9-11 Naunheim et al. fitted elite level high school
soccer players with a football helmet that was instrumented with a triaxial
accelerometer.12 Subjects were instructed to head a regulation size soccer ball kicked
from a distance of approximately 30 yards while ball velocity was measured using a hand-
held radar gun. Funk et al. subjected 20 volunteers to a soccer ball impact to the forehead
to examine head and neck loading.9 Participants were struck by a regulation adult size
soccer ball traveling horizontally toward his/her forehead at four different speeds (5, 8.5,
10, and 11.5 m/s). The participants remained stationary and did not attempt to actively
head the soccer ball. Bite blocks made from dental impressions of each subject were
instrumented with two triaxial accelerometers and one angular rate sensor. Subjects were
found able to tolerate head accelerations well over 20g and 2000 rad/s2 without injury.
Hanlon and Bir have reported on-field head acceleration data collected from 24 girls’
youth soccer players that were instrumented with a wireless head acceleration
measurement system implanted into a soccer headband. The girls were then asked to
participate in a single scrimmage and head acceleration measurements were recorded.13
While providing valuable data about on-field head accelerations, this study only
7
investigated scrimmages due to the challenge of getting players to wear non-required
impact measurement equipment during competitive games.
Recent technological advancements in head impact sensors have now made more
widespread on-field measurements possible. In order to better understand exposure to
head impact in female soccer players, we aimed to quantify the head impact exposure in
collegiate women’s soccer through on-field study of head impacts. With this in mind, this
work uses both video analysis and sensor-recorded measurements.
Materials and Methods
A total of 26 players from the Virginia Tech Women’s Soccer Team consented to
participate in this IRB approved study. A total of 26 practices and 20 games were
analyzed, however, not every player participated in each of these events. Three
goalkeepers, nine midfielders, five forwards, and nine defensive players were
instrumented. The subjects had an average height of 5’7” ± 2”and an average weight of
142.2 ± 14.7 lbs. Player age ranged from 18 to 22 with a mean age of 19 ± 1 years old.
Forty two percent of instrumented players had experienced a soccer-related concussion
at some point prior to the beginning of this study, while 15% had experienced two or more.
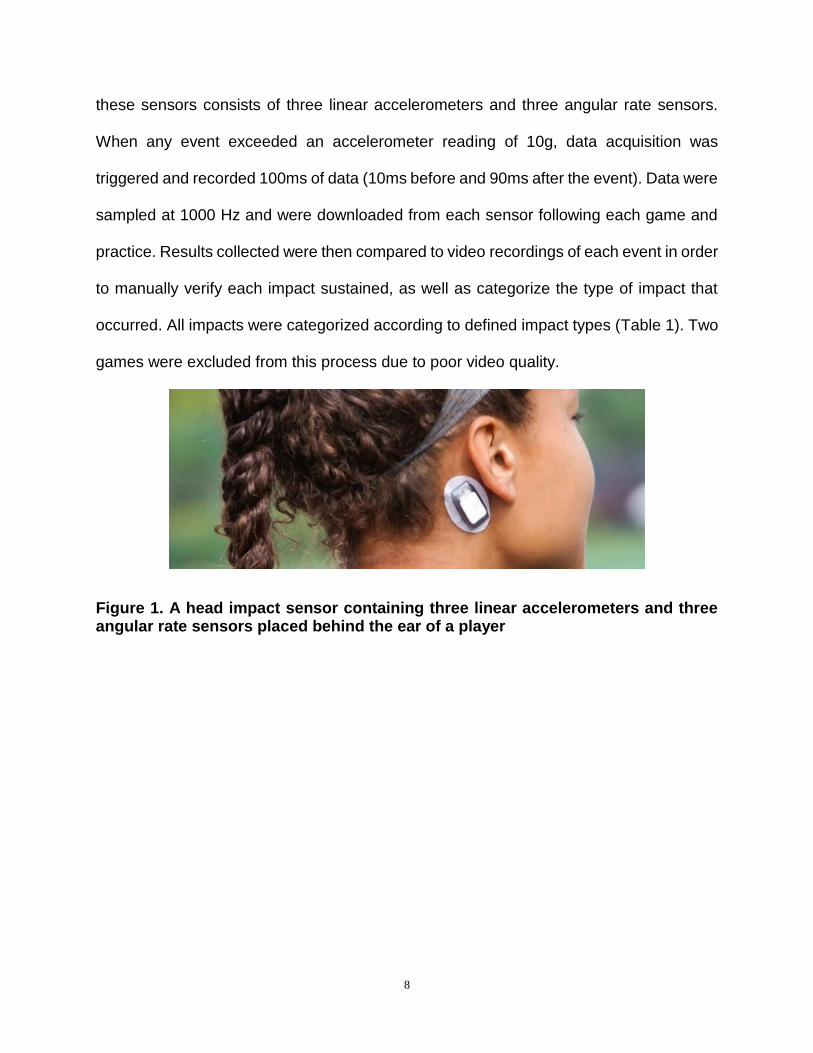
Head impact sensors (XPatch, X2 Biosystems, Seattle, WA) were placed on the mastoid
process behind the ear of every participating player using an adhesive patch before each
game and practice to record linear and rotational head accelerations (Figure 1). Each of
8
these sensors consists of three linear accelerometers and three angular rate sensors.
When any event exceeded an accelerometer reading of 10g, data acquisition was
triggered and recorded 100ms of data (10ms before and 90ms after the event). Data were
sampled at 1000 Hz and were downloaded from each sensor following each game and
practice. Results collected were then compared to video recordings of each event in order
to manually verify each impact sustained, as well as categorize the type of impact that
occurred. All impacts were categorized according to defined impact types (Table 1). Two
games were excluded from this process due to poor video quality.
Figure 1. A head impact sensor containing three linear accelerometers and three angular rate sensors placed behind the ear of a player

9
Table 1. Impact types with descriptions.
Abbreviation Meaning Description
H Header Player intentionally headed the ball
UFH Up for Header Player attempted to head the ball but exact contact is unclear (i.e. player to
player or ball to player)
Fall Fell Down Player fell down and head struck the
ground
PPC Player to Player
Contact Player's head was struck by another
player's body
UBPC Unintentional Ball to
Player Contact Player's head was unintentionally struck
by the ball
The head impact sensors used come equipped with a filter used to determine the validity
of each impact recorded. The filter identifies each impact as either a real or false impact.
For the purpose of this study, impacts were classified as shown in Table 2.
Table 2. Classification of true positive, false positive, true negative, and false negative impacts for the purpose of this study.
Visually
identified Sensor filter marked as
real impact
True Positive (TP) Yes Yes
False Positive (FP) No Yes
True Negative (TN) No No
False Negative (FN) Yes No
While this study used a 10g trigger to initiate data collection, we also investigated if a
different trigger threshold would improve automated data collection in the field. Impact
classifications were identified at various imposed linear acceleration thresholds and used
to construct a positive predictive value (PPV) curve which indicated the percentage of
10
positive recorded impacts that are true positive results (Equation 1). Furthermore,
sensitivity and specificity were computed at each threshold. Receiver operating
characteristic (ROC) curves were then generated to investigate the accuracy of the
sensors. Separate curves were produced for the following three scenarios: games alone,
practices alone, and games and practices combined.
𝑷𝑷𝑽 =𝑻𝒓𝒖𝒆 𝑷𝒐𝒔𝒊𝒕𝒊𝒗𝒆𝒔
𝑻𝒓𝒖𝒆 𝑷𝒐𝒔𝒊𝒕𝒊𝒗𝒆𝒔 + 𝑭𝒂𝒍𝒔𝒆 𝑷𝒐𝒔𝒊𝒕𝒊𝒗𝒆𝒔 (1)
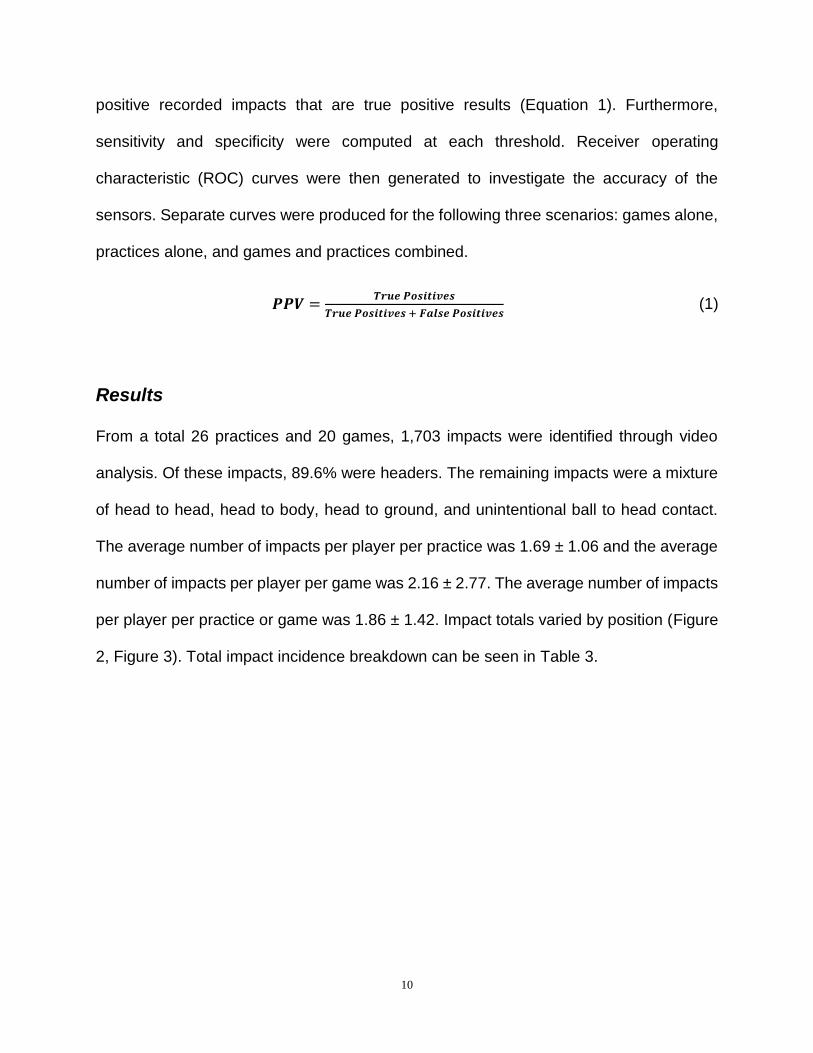
Results
From a total 26 practices and 20 games, 1,703 impacts were identified through video
analysis. Of these impacts, 89.6% were headers. The remaining impacts were a mixture
of head to head, head to body, head to ground, and unintentional ball to head contact.
The average number of impacts per player per practice was 1.69 ± 1.06 and the average
number of impacts per player per game was 2.16 ± 2.77. The average number of impacts
per player per practice or game was 1.86 ± 1.42. Impact totals varied by position (Figure
2, Figure 3). Total impact incidence breakdown can be seen in Table 3.

11
Figure 2. Average number of impacts sustained per player over the course of a season divided into player positions. Midfielders sustained the highest average number of impacts per player while goalkeepers sustained the lowest. Forwards and defenders saw similar average number of impacts per player.
Figure 3. Distribution of impact type by player position. Headers represented the majority of impacts for forwards, midfielders, and defenders. Goalkeepers only sustained head impacts from falling.
12
Table 3. Impact incidence breakdown across all players for all games and practices throughout the season (# G/P = # games/practices). The vast majority of impacts sustained throughout the season were headers, representing 90% of all 1,703 total impacts.
Player #
Position #
G/P Total
Impacts Impacts/Practice
Impacts/Game
H UFH Fall PPC UBPC
1 GK 17 1 0.06 0.00 0 0 1 0 0
2 D 33 57 1.75 1.67 56 1 0 0 0
3 M 44 137 3.54 2.50 124 3 5 4 1
4 F 43 98 1.39 3.30 72 5 12 9 0
6 D 44 103 2.16 2.58 102 1 0 0 0
7 M 40 69 2.00 1.21 62 4 3 0 0
8 D 44 54 0.85 1.78 47 3 1 2 1
9 M 40 70 1.54 2.06 67 3 0 0 0
10 D 22 40 2.24 0.40 40 0 0 0 0
11 D 36 26 0.96 0.18 26 0 0 0 0
12 F 27 24 1.00 0.25 24 0 0 0 0
13 F 37 44 1.70 0.59 40 3 0 1 0
14 D 37 111 3.64 1.67 107 2 0 0 2
15 M 43 113 1.74 3.65 94 10 5 2 2
16 M 30 49 2.13 0.00 47 1 0 0 1
17 F 31 41 1.81 0.30 41 0 0 0 0
18 M 43 236 3.00 8.94 204 22 5 2 3
19 D 43 78 0.72 3.33 70 4 3 1 0
21 M 44 107 2.56 2.26 100 5 0 1 1
22 M 45 68 1.20 1.90 63 3 1 0 1
23 F 44 56 1.15 1.44 51 2 2 0 1
24 D 9 15 1.88 0.00 14 0 0 0 1
27 M 25 19 1.00 0.54 18 0 1 0 0
29 D 26 58 2.33 1.00 57 1 0 0 0
30 GK 38 12 0.21 0.50 0 0 12 0 0
31 GK 31 17 0.58 0.43 0 0 17 0 0
TOTAL: 916 1703 1526 73 68 22 14
AVERAGE: 35.2 65.5 1.69 2.16 58.7 2.8 2.6 0.8 0.5
STD. DEVIATION: 9.6 50.0 1.06 2.77 45.0 4.6 4.5 1.9 0.8
Head impact exposure varied by position due to the different nature of play experienced
by each individual. Midfielders saw the greatest average number of impacts (94 ± 63.3),
followed by defenders (60.2 ± 32.4), forwards (52.6 ± 27.8), and goalkeepers (10.0 ± 8.2).

13
While goalkeepers exclusively experienced head impacts from diving/falling, all other
positions primarily sustained head impacts associated with head to ball contact. Full
impact mechanism breakdown by position can be seen in Figure 3. These findings are
consistent with the observed nature of play: headers seemed to be fairly evenly
distributed across all positions excluding goalkeepers, with defenders experiencing a
slightly elevated percentage of headers expectedly due to their role of clearing the ball
from the opposing team’s side of the field.
A probability density function and cumulative distribution function characterizing head
impacts per season between players were computed (Figure 4). There was a median of
56.5 total impacts per player and the interquartile range of the data was 63.5 impacts per
player (Q1=29.5, Q3=93). A logistic fit was imposed on the data.
Figure 4. Probability density function and cumulative distribution function for total impacts across all instrumented players throughout the season. A logistic distribution with µ = 60.01 AND σ = 25.45 was used to fit the data.
Each impact recorded by the sensors was categorized according to the sensor
performance classifications outlined in Table 2. A breakdown of these values for practices
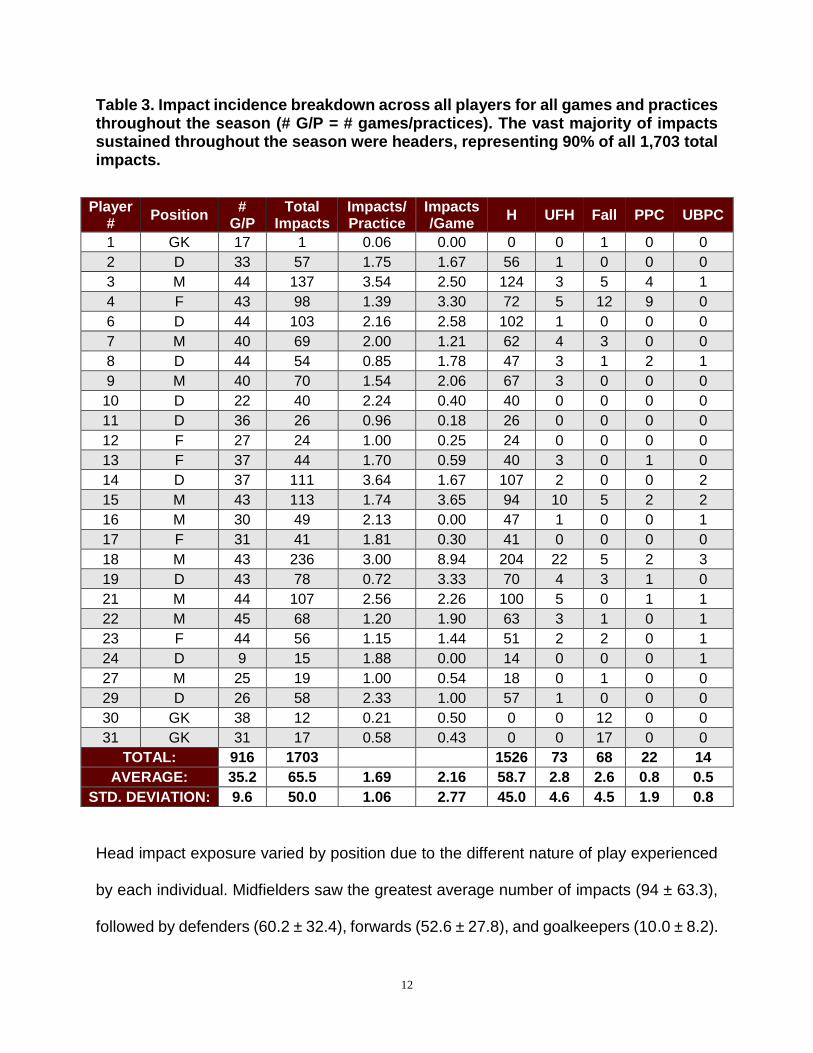
and games can be seen in Table 4. These impact classifications were used to construct
14
a PPV curve (Figure 5). At a linear acceleration threshold of 10g, 16.3% of positive
recorded impacts were true positive results. This value was maximized at 34g, where
65.8% of positive recorded impacts were true positive results. At this threshold there were
383 true positive impacts, 199 false positives, 15,963 true negatives, and 1,320 false
negatives.
Table 4. Sensor-recorded impact classifications for the duration of the season.
True Positives
False Positives
True Negatives
False Negatives
Total Impacts Recorded
Practices Only 780 3863 3664 208 8515
Games Only 683 3673 4962 32 9350
Practices and Games
1463 7536 8626 240 17865
Figure 5. Positive predictive value (PPV) of a head impact being correctly identified across a span of linear acceleration thresholds. PPV was maximized at a threshold of 34g, where 65.8% of positive recorded impacts were true positive results.

15
The relationship between sensitivity and specificity for both practices and games,
practices alone, and games alone was characterized with ROC curves (Figure 6). The
area under the curve is 0.865 when combining practices and games, 0.797 for practices
alone, and 0.938 for games alone. A case of random guessing would be indicated by an
area of 0.500, while perfect classification would be indicated by an area of 1.000.
Figure 6. ROC plot indicating sensor accuracy. An area under the curve of 1.0 would indicate perfect classification, while an area of 0.5 would indicate random guessing. Sensors are 18% more accurate with games than with practices.
The linear acceleration values for all impacts ranged from 6g to 113g with an average of
25 ± 16g (Table 5). Rotational acceleration spanned from 380 rad/s2 to 26,222 rad/s2 and
had an average of 5626 ± 4223 rad/s2. Linear acceleration measurements for practices
alone ranged from 6g to 113g with an average of 20 ± 13g. For games alone,
measurements ranged from 7g to 94g with an average of 32 ± 18g. Rotational
acceleration during practices ranged from 380 rad/s2 to 26,222 rad/s2 and averaged 4541
± 3597 rad/s2. For games, rotational acceleration ranged from 703 rad/s2 to 24467 rad/s2

16
with an average of 7126 ± 4555 rad/s2. Caution must be exercised in interpreting these
values, as they are much higher than one would expect and are likely prone to
measurement error.
Table 5. Impact measurement breakdown by type across all players for games and practices throughout the season.
Linear Accel. (g) Rotational Accel. (rad/s2)
Min Max Avg Std Dev Min Max Avg Std Dev
H 6 113 25 17 380 26222 5709 4281
UFH 7 89 27 17 699 17614 5785 3953
Fall 10 76 18 11 1042 13533 3507 2064
PPC 9 40 20 9 1330 13154 4177 3082
UBPC 10 84 35 22 3079 19017 8310 5039
All Impacts 6 113 25 16 380 26222 5626 4223
Discussion
The sensor’s algorithm reported a total number of impacts that was much greater than
the number of impacts identified through video analysis (8,999 recorded compared to
1,703 confirmed). This difference illustrates some of the challenges associated with
automated data collection using head impact sensors in sports. Not every accelerative
event that a sensor identifies as being a head impact results from one. If the sensor alone
was used to quantify head impact exposure, over 7,000 accelerative events not
associated with impact would have been reported as head impacts resulting in inaccurate
exposure counts. Jumping, running, and instances of players touching their sensors
resulted in false positive accelerative events. The opposite also applies, in that a head
impact can occur and the sensor does not recognize the accelerative event as being a
head impact. When capturing head impact data with automated sensors in the field, it is
vital that the accelerative events captured by the sensors are confirmed as actually
17
occurring. This is true for all currently available head impact sensors, not just the sensor
used in this study. For instance, we have used video analysis to confirm impacts
throughout our football studies using the HIT System (Simbex, Lebanon, NH) for the past
decade.14-17
While a threshold of 10g was used for this study, the positive predictive value (PPV)
analysis enabled observation of sensor performance at higher thresholds. This analysis
indicated that PPV would be maximized at 34g. However, this would still only result in
65.8% of positive recorded impacts being true positive results. Furthermore, previous
research suggests that soccer headers typically only produce head accelerations less
than 30g.9, 10, 12, 13, 18-20 Therefore it would be impractical to use this optimal threshold for
a soccer head impact study, seeing that the majority of the impacts would still be missed
by the sensors. The ROC curves generated for these data actually look fairly good, which
is mainly because the sensors did a good job of filtering out non-impact events. It should
be noted, however, that this does not suggest that the sensor was good at identifying
impact events.
Recorded head accelerations for confirmed impacts were also higher than expected, most
notable for rotational acceleration. The kinetic parameters of linear and rotational head
acceleration are commonly used to assess brain injury risk because they are thought to
be indicative of the inertial response of the brain.21, 22 Using a previously published risk
curve which takes into account both linear and rotational head accelerations, it was
estimated that 260 of the sensor’s visually confirmed impacts were above 50% risk of
18
concussion and 153 were above 90% risk.21 Furthermore, some head acceleration values
were in the range of events associated with severe brain injury, not just concussion.23
Despite this, there were no head injuries (concussions or otherwise) identified over the
course of the season. Given this context, it is unlikely that head acceleration was
accurately measured for these confirmed head impacts. At first glance, one might think
that acceleration magnitude must not be related to injury given that these values are so
high. However, this is more a reflection of the high values being inaccurate. Over 60 years
of biomechanical research has linked head kinematics to risk of brain injury.24-27 It is
unlikely that any player actually experienced the head accelerations measured by the
sensor, which likely explains why no concussions were observed. Measurement error
resulting from relative motion between the skin at the mastoid process and skull likely
amplified computed head acceleration magnitudes. Modifying sensor placement to better
couple the head impact sensor to skull motion will likely produce more accurate head
acceleration data.
It should be noted that two games were excluded from this study due to poor video quality.
In addition, we suspect that the sensor did not measure the biomechanics of the head
impacts accurately and the results of this study should be interpreted accordingly. These
errors are likely a result of relative motion between the skin and skull during head impact.
The head impact sensors consist of hardware and software that can be upgraded to
improve accuracy. Future iterations of the software and hardware could improve the
accuracy of the sensor, and the version used in this study may not be the most up-to-date

19
by the time of publication. Additional research will be necessary as on-field head impact
sensors become more accurate.
This study has quantified head impact exposure for women’s soccer players through
video analysis of a collegiate women’s soccer season. On average, players saw 65.5 ±
50.0 head impacts per season. Impact totals and types varied by position; which is
consistent with the diverse nature of play experienced at different player positions.
Headers represented the vast majority of total impacts sustained (89.6%). Furthermore,
this study illustrated the challenges of using head impact sensors on the field, which are
likely not specific to the sensor used. Data collected from head impact sensors should be
interpreted with caution when used in an automated setting.
20
References
1. Kunz M. Big Count. FIFA Magazine; 2007:6.
2. Delany JSL, V. J.; Leclerc, S.; Johnston, K. M. Concussions Among University
Football and Soccer Players. Clin J Sport Med. 2002;12:8.
3. Fuller CW, Junge A, Dvorak J. A six year prospective study of the incidence and
causes of head and neck injuries in international football. Br J Sports Med. 2005;39
Suppl 1:i3-9.
4. Matser JT, Kessels AG, Jordan BD, Lezak MD, Troost J. Chronic traumatic brain injury
in professional soccer players. Neurology. 1998;51(3):791-796.
5. Janda DH, Bir CA, Cheney AL. An evaluation of the cumulative concussive effect of
soccer heading in the youth population. Inj Control Saf Promot. 2002;9(1):25-31.
6. Putukian M, Echemendia RJ, Mackin S. The acute neuropsychological effects of
heading in soccer: a pilot study. Clin J Sport Med. 2000;10(2):104-109.
7. Tysvaer AT. Head and neck injuries in soccer. Impact of minor trauma. Sports Med.
1992;14(3):200-213.
8. Guskiewicz KM. No evidence of impaired neurocognitive performance in collegiate
soccer players. Am J Sports Med. 2002;30(4):630.
9. Funk JR, Cormier JM, Bain CE, Guzman H, Bonugli E, Manoogian SJ. Head and neck
loading in everyday and vigorous activities. Ann Biomed Eng. 2011;39(2):766-776.
10. Tierney RT, Higgins M, Caswell SV, et al. Sex differences in head acceleration during
heading while wearing soccer headgear. J Athl Train. 2008;43(6):578-584.

21
11. Queen RM, Weinhold PS, Kirkendall DT, Yu B. Theoretical study of the effect of ball
properties on impact force in soccer heading. Med Sci Sports Exerc.
2003;35(12):2069-2076.
12. Naunheim RS, Standeven J, Richter C, Lewis LM. Comparison of impact data in
hockey, football, and soccer. J Trauma. 2000;48(5):938-941.
13. Hanlon EM, Bir CA. Real-time head acceleration measurement in girls' youth soccer.
Med Sci Sports Exerc. 2012;44(6):1102-1108.
14. Cobb BR, Urban JE, Davenport EM, et al. Head impact exposure in youth football:
elementary school ages 9-12 years and the effect of practice structure. Ann
Biomed Eng. 2013;41(12):2463-2473.
15. Daniel RW, Rowson S, Duma SM. Head impact exposure in youth football: middle
school ages 12-14 years. J Biomech Eng. 2014;136(9):094501.
16. Young TJ, Daniel RW, Rowson S, Duma SM. Head impact exposure in youth football:
elementary school ages 7-8 years and the effect of returning players. Clin J Sport
Med. 2014;24(5):416-421.
17. Duma SM, Rowson S. Every Newton Hertz: a macro to micro approach to
investigating brain injury. Conf Proc IEEE Eng Med Biol Soc. 2009;2009:1123-
1126.
18. Naunheim RS, Ryden A, Standeven J, et al. Does soccer headgear attenuate the
impact when heading a soccer ball? Acad Emerg Med. 2003;10(1):85-90.
19. Naunheim RS, Bayly PV, Standeven J, Neubauer JS, Lewis LM, Genin GM. Linear
and angular head accelerations during heading of a soccer ball. Med Sci Sports
Exerc. 2003;35(8):1406-1412.

22
20. Hanlon E, Bir C. Validation of a wireless head acceleration measurement system for
use in soccer play. J Appl Biomech. 2010;26(4):424-431.
21. Rowson S, Duma SM. Brain injury prediction: assessing the combined probability of
concussion using linear and rotational head acceleration. Ann Biomed Eng.
2013;41(5):873-882.
22. Rowson B, Rowson S, Duma SM. Hockey STAR: A Methodology for Assessing the
Biomechanical Performance of Hockey Helmets. Annals of Biomedical
Engineering. 2015;43(10):2429-2443.
23. Margulies SS, Thibault LE. A proposed tolerance criterion for diffuse axonal injury in
man. J Biomech. 1992;25(8):917-923.
24. Duma S, Rowson S. The Biomechanics of Concussion: 60 Years of Experimental
Research. In: Slobounov SM, Sebastianelli WJ, eds. Concussions in Athletics:
Springer New York; 2014:115-137.
25. Rowson S, Duma SM. The Virginia Tech Response. Annals of Biomedical
Engineering. 2012;40(12):2512-2518.
26. Rowson S, Duma SM, Greenwald RM, et al. Can helmet design reduce the risk of
concussion in football? Journal of Neurosurgery. 2014;120(4):919-922.
27. Rowson S, Duma SM, Beckwith JG, et al. Rotational Head Kinematics in Football
Impacts: An Injury Risk Function for Concussion. Annals of Biomedical
Engineering. 2012;40(1):1-13.
23
CHAPTER 3: BIOMECHANICAL PERFORMANCE OF HEADGEAR USED IN SOCCER
Abstract
High incidence of concussion in soccer players has provoked increased efforts to reduce
exposure to high magnitude head impacts in this population. Many manufacturers are
now creating soccer headgear to attenuate head accelerations. However, no data are
available that quantify their effectiveness. This study aimed to evaluate the ability of ten
commercially available headgears to reduce concussion risk for soccer players in ball-to-
head and head-to-head impacts. Ball-to-head impacts were recreated using a mounted
soccer ball shooter to shoot balls at a NOCSAE headform, while head-to-head impacts
were performed by accelerating one headform into another. Results from a total of 724
tests indicated that headgear did not meaningfully reduce head acceleration in ball-to-
head impacts, but did result in large reductions in head acceleration during head-to-head
impacts. Overall reductions in linear head accelerations compared to the control condition
averaged about 35%. With the addition of another, matched headgear being worn on the
striking headform, reductions increase to an average of about 53%. The ten headgear
tested varied greatly in construction and composition, and thus exhibited diverse
performance. Data will have applications towards headgear design, performance
regulation of headgear, and recommendations to athletes with regards to relative
performance.

24
Authors: J. N. Press, K. C. Farkas, C. McNally, and S. Rowson Affiliation: 1Virginia Tech, Department of Biomedical Engineering and Mechanics, 2Michigan Technological University
Word Count: 195

25
Introduction
Sport-related concussions and their short- and long-term effects are a growing concern
for athletes, coaches, and parents alike. Evidence suggests that these injuries can be
detrimental to the mental health of athletes into the later years of life, causing deficits in
memory, attention, concentration, and other functions.1-11 A 2001 survey of retired
professional football players found that players who self-reported concussions were at a
greater risk for having depressive episodes later in life compared with those who self-
reported no concussions.10 Other researchers have examined motor cortex integrity in
former collegiate athletes and reported that sports-related concussion incidence was
positively correlated with long-term motor system dysfunctions.11 A series of studies on
professional soccer players reported that the number of concussions incurred was
correlated to poorer results on many different neurocognitive tests.1-3 These discoveries,
among others, have inspired a movement to make sports safer for the brain by changing
practice techniques, modifying game rules, and improving protective headgear.12-14
Soccer is well-known as the world’s most popular and fastest-growing sport.15 It is also
the contact sport with the highest rate of concussion that does not require the use of
protective headgear.16 Recently, manufacturers have attempted to address this by
creating various forms of protective headgear to dissipate head impact forces for soccer
players. It has been shown that player-to-player contact, specifically head-to-head impact,
during aerial challenges is the most likely activity to result in concussion.17-21 Soccer is
unique in that it is the only sport that includes the intentional redirection of the ball with
one’s head, therefore there is also concern associated with headers leading to

26
neurocognitive changes.15 Although headers typically do not generate the accelerations
necessary to cause concussion, the effects of cumulative sub-concussive head impacts
are not yet well-understood. Many studies have compared neurocognitive test
performance between soccer players and control groups, with the majority reporting no
significant differences.22-27 There is a small subset of studies, however, which have
reported inverse relationships between the number of ball impacts and certain
neurocognitive performance scores in categories such as verbal learning, attention,
strategic planning, and visual processing.28-30
Most currently available headgears claim to reduce the risk of concussion, however little
research has been done to quantify the effectiveness of each headgear during various
impact scenarios. In 2003, researchers propelled soccer balls at a standard magnesium
headform and compared peak linear head accelerations with and without the use of
protective headgear finding no measurable protection.31 In 2005, Withnall et al. performed
a combination of head-to-head dummy impacts, ball-to-head dummy impacts, and
volunteer ball heading with and without the use of protective headgear.32 This study also
found that headgear provided no measurable protection during ball impacts. However, in
head-to-head impacts, headgear was found to provide an overall 33% reduction in impact
response. Both of these studies tested a very limited sample of headgear, and many of
the models tested are no longer on the market today. This study aimed to evaluate the
ability of ten commercially available headgears to reduce concussion risk for soccer
players. Data will have applications towards headgear design, performance regulation of
headgear, and recommendations to athletes with regards to relative performance.
27
Materials and Methods
Efficacy of soccer headgear was evaluated during common impact scenarios identified
by previous research. Individual headgear performance was evaluated in comparison to
a control condition (bare headform) during ball-to-head and head-to-head impacts.
Ball-to-Head Impacts
A JUGS Soccer Machine (JUGS Sports, Tualatin, OR) was used to shoot official NCAA
Wilson Forte Size 5 soccer balls at a medium NOCSAE headform mounted on a Hybrid
III 50th percentile neck.33, 34 A ball pressure of 10 psi and wheel pressures of 17 psi were
maintained throughout testing. The soccer machine was modified to shoot balls in a
horizontal path through an aluminum tube to ensure constant and repeatable impact
conditions. A NOCSAE headform was used for this testing to provide a realistic fit
between the headgear and the headform.33 A custom adaptor plate was constructed to
improve anatomic positioning of the neck relative to the head.34 The head and neck
assembly was contained in a cage and mounted onto a sliding mass intended to simulate
the effective mass of the torso during impact (Biokinetics, Ottawa, Ontario, Canada)
(Figure 1). The headform was instrumented with 3 linear accelerometers and 3 angular
rate sensors to measure impact kinematics (Endevco 7264B-2000, Meggitt Sensing
Systems, Irvine, CA)(ARS3 PRO-18K, DTS, Seal Beach, CA). Data were sampled at
20,000 Hz and filtered using a 4-pole Butterworth low pass filter with a cutoff frequency
of 297 Hz (CFC 180) for accelerometer data and 256 Hz (CFC 155) for angular rate
sensor data. Filters were chosen after preliminary testing. CFC 1000 was not used for

28
linear acceleration due to noise (500 – 1000 Hz) associated with high rate impacts on the
NOCSAE headform.
Figure 1. A JUGS Soccer Shooter was mounted to shoot soccer balls horizontally towards a medium NOCSAE headform mounted on a Hybrid III 50th percentile neck.
All headgear available to the public at the time of the study’s onset were included in
testing. Ten soccer headgears were purchased and tested along with a control condition
(bare headform) (Table 1). Each headgear was fitted onto the headform and carefully
positioned according to the instructions supplied by the manufacturer. The soccer ball is
most commonly contacted by the player using the middle upper portion of the forehead.35
To achieve this impact orientation, the headform was rotated forward 25 degrees about
the y-axis. A total of 220 ball-to-head impact tests were performed; 10 trials for each of 2
ball velocities (15 m/s and 25 m/s) on each of 10 headgear as well as the control. A high

29
speed video camera was used to calculate ball velocity for each trial using a frame rate
of 2600 fps (Phantom v9.1, Vision Research, Inc., Wayne, New Jersey).
Table 1. Ten commercially available soccer headgear were purchased for this study.
Headgear Name (Abbreviation)
Company Company Location
Headgear Name (Abbreviation)
Company Company Location
Don Joy Hat Trick (DJ)
DJO, LLC Vista, CA
Full90 Select (F90S)
Full90 Sports, Inc.
San Diego, CA
ForceField Regular (FFR)
ForceField FF (NA) Ltd.
Great Neck, NY
Head Blast (HB)
Head Blast Soccer Band
Company
St. Louis, MO
ForceField Ultra (FFU)
ForceField FF (NA) Ltd.
Great Neck, NY
Storelli ExoShield (STOR)
Storelli Sports
Brooklyn, NY
Full90 FN1 (FN1)
Full90 Sports, Inc.
San Diego, CA
Unequal Halo 10mm (UN10)
Unequal Technologies
Company
Glen Mills, PA
Full90 Premier (F90P)
Full90 Sports, Inc.
San Diego, CA
Unequal Halo 6mm (UN6)
Unequal Technologies
Company
Glen Mills, PA
At each of the two ball speeds, peak linear and angular head accelerations were averaged
over the 10 trials performed for each headgear to determine average peak head
accelerations. Concussion risk was calculated using a bivariate risk function (Equation 1)
where 𝑎 is peak linear acceleration, and 𝛼 is peak rotational acceleration.36 These values
were compared using statistical software (JMP, Version 11, SAS Institute Inc., Cary, NC)

30
to identify any significant differences from the control condition using Dunnett’s method
(p < 0.05).
𝐶𝑜𝑛𝑐𝑢𝑠𝑠𝑖𝑜𝑛 𝑅𝑖𝑠𝑘 = 1
1+𝑒−(−10.2+0.0433∙𝑎+0.000873∙𝛼−0.000000920∙𝑎𝛼) (1)
Head-to-Head Impacts
To observe how these headgear perform in head impact conditions most commonly
associated with concussion, a custom head-to-head impactor system was designed and
built (Figure 2). The system consists of two head and neck assemblies each mounted
onto sliding masses intended to simulate the effective mass of the torso during impact.
Both torso masses are free to translate along their respective rail segments, one of which
is extended to allow for about 70 inches of travel. An additional sliding platform is located
behind one of the sliding torso masses, providing two functions: 1) accelerating the sliding
torso mass, and 2) preventing extension of the neck during translation through its support
bar attachment. The sliding platform is accelerated down the rail segment by its
attachment to a cable and pulley system connected to a falling mass. The sliding torso
mass is pushed by the platform, until the platform is stopped by the cable attachment 5
inches before the end of the rails. This allows the sliding torso mass free travel until
impact. The impacted sliding torso mass was instrumented with 3 accelerometers and 3
angular rate sensors to measure impact kinematics. Data were sampled at 20,000 Hz
and filtered using a 4-pole Butterworth low pass filter with a cutoff frequency of 1650 Hz
(CFC 1000) for accelerometer data and 256 Hz (CFC 155) for angular rate sensor data.

31
Figure 2. A custom impactor was designed and built to simulate head-to-head impacts in soccer. The system consists of two head and neck assemblies mounted onto sliding masses which are free to translate. One sliding mass is accelerated to a target velocity and impacts another, stationary sliding mass with free travel. The impacted mass is instrumented to measure impact kinematics.
Two of the most prevalent soccer head impact scenarios described by Withnall et al. were
investigated during this study: front boss of the striking head to the side of the struck
head, and front boss of the striking head to the rear of the struck head.32, 37 These
conditions were replicated and described according to a global coordinate system (Table
2, Figure 2). All measurements are in relation to a “zero” condition where midsagittal plane
and transverse plane markings on the NOCSAE headform were aligned with headforms
facing each other. Both impact scenarios were performed under the following headgear
conditions: a) bare head to bare head, b) bare head to headgear, and c) headgear to
matched headgear. The same ten headgears used in the ball-to-head tests were used for
x
y
z

32
this portion of the study. Each of the aforementioned conditions was repeated four times
at three different impact velocities (2, 3, and 4 m/s), resulting in a total of 504 tests.
Table 2. Two head-to-head impact locations were tested. These conditions are described for potential replication. All measurements are in relation to a “zero” condition where midsagittal plane and transverse plane markings on the NOCSAE headform were aligned with headforms facing each other. Directions are in relation to a global coordinate system (Figure ).
Side Impact Location Back Impact Location
Struck Head Striking Head Struck Head Striking Head
Linear X Y Z X Y Z X Y Z X Y Z
0 cm +1 cm +3.5 cm -- -- -- 0 cm +3.8 cm +5 cm -- -- --
Rotation X Y Z X Y Z X Y Z X Y Z
0° 0° +90° -- +20° -50° 0° 0° +180° -- +20° -50°
Peak linear and angular head accelerations were averaged over the four trials performed
for each location/speed/headgear combination to determine average peak head
accelerations. Concussion risk was calculated using a bivariate risk function (Equation
1). Values were compared using statistical software to identify any significant differences
from the control condition using Dunnett’s method (p < 0.05).

33
Results
Ball-to-Head Impacts
Ball-to-head impacts were performed at two ball impact velocities: 15 and 25 m/s. High
speed video analysis indicated that the average speed for the 15 m/s condition was 15.5
± 0.3 m/s, and 25.1 ± 0.7 m/s for the 25 m/s condition. Overall linear and rotational head
acceleration distributions with the use of protective headgear were generated (Figure 3).
Figure 3. Box plots denote the first, second, and third quartiles for head acceleration values with the use of protective headgear for all ball-to-head tests. Whiskers extend to minimum and maximum recorded values. Solid red boxes above the box plots indicate mean control accelerations ± one standard deviation. In some cases, the red control box overlaps the box plot. Small differences are observed between head accelerations with and without the use of protective headgear.
At a ball velocity of 15 m/s, five of the ten headgear tested provided significant decreases
in average peak linear head acceleration from the control condition (DonJoy, Full90
Premier, ForceField Ultra, Storelli ExoShield, and Unequal Halo 10mm). The greatest
decrease was achieved with the use of the Unequal Halo 10mm headgear, which reduced
average peak linear head acceleration by 2.4 g (Table 3). With respect to peak rotational
acceleration, all headgears except the Full90 FN1 provided significant decreases from
the control condition. The greatest decrease was achieved with the use of the Storelli

34
ExoShield, which reduced average peak rotational head acceleration by 982 rad/s2.
Concussion risk for all impacts was less than 1% (Figure 4, Equation 1).36 Average
concussion risk for all tests with the use of protective headgear conducted at the 15 m/s
speed was 0.1 ± 0.0%, with all headgears providing a small, but significant decrease in
concussion risk from the control.
When the ball velocity was increased to 25 m/s, three of the ten headgear tested provided
significant decreases in average peak linear head acceleration from the control (DonJoy,
Head Blast, and Storelli ExoShield) (Table 3). The greatest decrease was achieved with
the use of the DonJoy, which reduced average peak linear head acceleration by 4.7 g.
However, no headgears were able to significantly reduce peak rotational acceleration or
concussion risk at this impact velocity. Average concussion risk for all tests conducted at
the 25 m/s speed was 0.7 ± 0.3%. Concussion risk for all ball-to-head impacts was very
low, with and without the use of protective headgear.

35
Table 3. Average values ± one standard deviation for peak linear and rotational accelerations, as well as for concussion risk. At a ball velocity of 15 m/s, all headgear significantly reduced concussion risk from the control condition (bare headform). When the ball velocity was increased to 25 m/s, no headgear were able to significantly reduce concussion risk.
15 m/s 25 m/s
Headgear Peak Linear
Accel. (g)
Peak Rotational
Accel. (rad/s2)
Concussion Risk (%)
Peak Linear Accel. (g)
Peak Rotational
Accel. (rad/s2)
Concussion Risk (%)
CTRL 26.5 ± 0.7 3254 ± 359 0.2 ± 0.1 52.7 ± 2.7 3696 ± 399 0.8 ± 0.4
DJ 24.9 ± 1.3* 2392 ± 274* 0.1 ± 0.0* 48.0 ± 4.0* 3387 ± 199 0.5 ± 0.2
F90P 24.9 ± 1.1* 2549 ± 206* 0.1 ± 0.0* 51.7 ± 3.2 3257 ± 652 0.5 ± 0.1
F90S 25.2 ± 1.2 2521 ± 178* 0.1 ± 0.0* 52.4 ± 2.4 3519 ± 508 0.8 ± 0.7
FFR 25.1 ± 1.0 2573 ± 293* 0.1 ± 0.0* 49.9 ± 0.9 3637 ± 495 0.7 ± 0.4
FFU 24.6 ± 1.2* 2557 ± 290* 0.1 ± 0.0* 50.2 ± 1.8 3730 ± 648 0.8 ± 0.3
FN1 26.1 ± 1.1 2898 ± 5223 0.1 ± 0.0* 54.5 ± 2.6 3230 ± 360 0.7 ± 0.5
HB 26.2 ± 1.1 2475 ± 291* 0.1 ± 0.0* 49.4 ± 2.7* 3313 ± 172 0.5 ± 0.2
STOR 24.4 ± 0.8* 2272 ± 161* 0.1 ± 0.0* 49.1 ± 1.9* 3465 ± 789 0.7 ± 0.4
UN10 24.1 ± 1.2* 2490 ± 257* 0.1 ± 0.0* 52.3 ± 2.3 3412 ± 251 0.6 ± 0.1
UN6 25.3 ± 1.6 2633 ± 407* 0.1 ± 0.0* 50.7 ± 1.7 3485 ± 651 0.7 ± 0.4

36
Figure 4. Concussion risk for all ball-to-head impacts was below 1%, with or without the use of protective headgear.
Head-to-Head Impacts
Head-to-head impact tests were performed at three target impact velocities: 2, 3, and 4
m/s. Five additional control tests were completed prior to the start of data collection to
confirm that the desired impact velocities were accurate and repeatable. High speed
video analysis of these tests indicated that the average velocity was 2.0 ± 0.0 m/s for the
2 m/s condition, 3.0 ± 0.0 m/s for the 3 m/s condition, 3.9 ± 0.0 m/s for the 4 m/s condition.
As a whole, the head-to-head tests produced head accelerations ranging from well below
1% risk to well above 90% risk, thus providing information about headgear performance
across the entire spectrum of potential head impacts in soccer (Figure 5). Linear and
rotational acceleration were correlated for these impacts, decreasing proportionally
1%
5%
10%
25%
50%
75%
90%

37
between headgear. Two trends can be observed, each representative of a specific head
impact location.
Figure 5. Concussion risk for all head-to-head impacts ranged from less than 1% to greater than 90% risk.
Bare Head to Headgear
Overall linear and rotational head acceleration distributions with the use of protective
headgear were generated for each impact velocity and head orientation (Figure 6). At
side location, all of the headgear tested were able to reduce peak linear and rotational
head accelerations significantly from the control condition at the low (2 m/s) and
(3 m/s) impact velocities. At the low impact velocity, the average reduction in linear
acceleration across all headgear was 28 ± 9 g, whereas the average reduction in
rotational acceleration was 2426 ± 792 rad/s2. The greatest reductions in both linear and
rotational head accelerations from the control condition were achieved using the Storelli
1%
5%
10%
25%
50%
75%
90%

38
ExoShield (40 g and 3560 rad/s2). At the medium impact velocity, the average reduction
in linear acceleration across all headgear was 35 ± 16 g, whereas the average reduction
in rotational acceleration was 2533 ± 1323 rad/s2. The greatest reductions in both linear
and rotational head accelerations from the control condition were again achieved using
the Storelli ExoShield (66 g and 5312 rad/s2). Concussion risk was also reduced
significantly for all tests at the low and medium impact velocities. At the maximum
velocity (4 m/s), the average reduction in linear acceleration across all headgear was 39
± 21 g, and the average reduction in rotational acceleration was 2164 ± 1634 rad/s2.
greatest reductions in linear and rotational acceleration were achieved using the Storelli
ExoShield (81 g and 5129 rad/s2). Only the ForceField Regular failed to significantly
reduce peak linear or rotational head accelerations from the control at this impact
In addition, five of the headgear tested did not significantly reduce concussion risk in the
4 m/s tests (Full90 Select, ForceField Regular, ForceField Ultra, Full90 FN1, and Head
Blast). The Storelli ExoShield provided the greatest reduction in concussion risk at all
impact velocities tested for this location (

39
Table 4).
At the back location, all of the headgear tested were able to reduce peak linear and
rotational head accelerations significantly from the control condition at the lowest impact
velocity. The average reduction in linear acceleration across all headgear was 29 ± 10
and the average reduction in rotational acceleration was 1734 ± 615 rad/s2. The
reductions in linear and rotational acceleration from the control were achieved using the
Unequal Halo 10mm (47 g and 2807 rad/s2). Concussion risk was also reduced
significantly for these tests. At the medium impact velocity, the average reduction in
acceleration across all headgear was 36 ± 21 g, whereas the average reduction in
rotational acceleration was 1926 ± 1177 rad/s2. The greatest reductions in linear and
rotational accelerations from the control were achieved using the Unequal Halo 10mm
(74 g and 4185 rad/s2). The Head Blast failed to reduce rotational acceleration
significantly at the medium impact velocity, although concussion risk was still
reduced. When the impact velocity was increased to 4 m/s, the average reduction in
acceleration across all headgear increased to 40 ± 28 g, and the average reduction in
rotational acceleration was 2164 ± 1634 rad/s2. The greatest reductions in linear and
rotational acceleration were achieved using the Unequal Halo 10mm (97 g and 5512
rad/s2). At the 4 m/s impact velocity, three headgear were unable to reduce rotational
acceleration significantly (Full90 Select, ForceField Regular, and Head Blast), and five
headgear were unable to reduce concussion risk significantly (Full90 Premier, Full90
Select, ForceField Regular, Full90 FN1, and Head Blast). The Unequal Halo 10mm

40
provided the greatest reduction in concussion risk at all impact velocities tested for this
location (

41
Table 4).
Figure 6. Box plots denote the first, second, and third quartiles for head acceleration values with the use of protective headgear for all bare head to headgear tests. Whiskers extend to minimum and maximum recorded values. Solid red boxes above the box plots indicate mean control accelerations ± one standard deviation. Headgear were able to reduce linear and rotational accelerations significantly from the control condition.

42
Table 4. Almost all headgear were able to reduce linear and rotational head accelerations, and consequently concussion risk, significantly in bare head to headgear tests. Use of the Storelli ExoShield resulted in the greatest reduction in concussion risk at the side location, while the ForceField Regular provided the smallest reduction. At the back location, the Unequal Halo 10mm provided the greatest reduction in concussion risk, whereas the Head Blast provided the smallest reduction.
Side Location
Headgear
2 m/s 3 m/s 4 m/s
Peak Linear
Accel. (g)
Peak Rotational
Accel. (rad/s2)
Concussion Risk (%)
Peak Linear
Accel. (g)
Peak Rotational
Accel. (rad/s2)
Concussion Risk (%)
Peak Linear
Accel. (g)
Peak Rotational
Accel. (rad/s2)
Concussion Risk (%)
CTRL 63.1 ± 0.9 5266 ± 198 4.1 ± 0.7 105.6 ± 0.5 8360 ± 94 70.2 ± 1.7 161.8 ± 0.9 11728 ± 89 99.5 ± 0.0
DJ 30.4 ± 2.3* 2631 ± 150* 0.1 ± 0.0* 66.0 ± 1.8* 5496 ± 171 5.4 ± 1.0* 115.5 ± 3.4* 9522 ± 267* 88.8 ± 3.3*
F90P 30.8 ± 1.9* 2434 ± 128* 0.1 ± 0.0* 68.0 ± 1.7* 5642 ± 117 6.4 ± 0.9* 122.0 ± 2.6* 9700 ± 244* 92.0 ± 2.1*
F90S 31.9 ± 2.6* 2692 ± 242* 0.1 ± 0.0* 74.6 ± 1.4* 6273 ± 286 13.0 ± 3.0* 132.7 ± 1.5* 10220 ± 135* 96.1 ± 0.5
FFR 56.4 ± 1.3* 4647 ± 208* 1.9 ± 0.4* 97.2 ± 1.8* 7892 ± 73 54.8 ± 2.1* 156.4 ± 1.4 11518 ± 129 99.3 ± 0.1
FFU 38.2 ± 4.1* 2926 ± 261* 0.2 ± 0.1* 82.1 ± 2.9* 6856 ± 199 23.8 ± 4.4* 140.4 ± 2.5* 10420 ± 107* 97.4 ± 0.4
FN1 30.4 ± 3.6* 2543 ± 433* 0.1 ± 0.1* 72.0 ± 2.9* 6278 ± 278 12.0 ± 3.2* 126.2 ± 3.4* 10227 ± 323* 95.1 ± 1.8
HB 38.3 ± 1.4* 3017 ± 70* 0.2 ± 0.0* 77.4 ± 2.0* 6292 ± 104 14.2 ± 1.9* 134.3 ± 2.8* 10172 ± 145* 96.2 ± 0.8
STOR 22.8 ± 0.8* 1707 ± 71* 0.0 ± 0.0* 39.6 ± 1.6* 3048 ± 208 0.3 ± 0.1* 81.0 ± 4.5* 6599 ± 289* 19.9 ± 6.0*
UN10 28.5 ± 1.5* 2302 ± 172* 0.1 ± 0.0* 54.2 ± 2.2* 4447 ± 81 1.5 ± 0.2* 98.1 ± 3.2* 8174 ± 267* 60.8 ± 7.8*
UN6 41.8 ± 0.8* 3507 ± 178* 0.4 ± 0.1* 71.6 ± 0.9* 6041 ± 204 9.8 ± 1.5* 118.1 ± 0.9* 9741 ± 195* 91.3 ± 1.4*
Back Location
Headgear
2 m/s 3 m/s 4 m/s
Peak Linear
Accel. (g)
Peak Rotational
Accel. (rad/s2)
Concussion Risk (%)
Peak Linear
Accel. (g)
Peak Rotational
Accel. (rad/s2)
Concussion Risk (%)
Peak Linear
Accel. (g)
Peak Rotational
Accel. (rad/s2)
Concussion Risk (%)
CTRL 62.5 ± 0.2 4077 ± 34 1.5 ± 0.0 104.3 ± 0.5 6463 ± 86 34.1 ± 1.7 154.6 ± 0.5 9322 ± 241 96.4 ± 0.7
DJ 38.7 ± 3.0* 2622 ± 214* 0.2 ± 0.7* 72.7 ± 4.1* 4839 ± 340* 4.3 ± 1.6* 122.0 ± 10.6* 7274 ± 1556* 63.7 ± 32.7*
F90P 35.9 ± 2.8* 2620 ± 239* 0.2 ± 0.0* 76.8 ± 3.5* 5016 ± 255* 5.6 ± 1.6* 124.5 ± 3.3* 7954 ± 289* 76.9 ± 6.3
F90S 34.5 ± 2.9* 2465 ± 221* 0.1 ± 0.0* 79.8 ± 2.1* 5409 ± 168* 8.3 ± 1.5* 130.8 ± 1.8* 8374 ± 173 85.3 ± 2.3
FFR 43.3 ± 2.7* 2846 ± 111* 0.3 ± 0.0* 84.6 ± 4.0* 5449 ± 321* 10.4 ± 3.7* 135.7 ± 2.7* 8574 ± 348 88.6 ± 3.9
FFU 27.0 ± 3.3* 2055 ± 295* 0.1 ± 0.0* 67.1 ± 4.3* 4669 ± 345* 3.1 ± 1.2* 117.8 ± 4.1* 7620 ± 183* 67.2 ± 6.2*
FN1 41.3 ± 1.8* 2630 ± 154* 0.2 ± 0.0* 79.6 ± 1.5* 4734 ± 163* 4.9 ± 0.7* 136.3 ± 1.8* 7669 ± 234* 80.5 ± 3.4
HB 50.5 ± 0.3* 3356 ± 133* 0.5 ± 0.1* 96.6 ± 0.7* 6195 ± 96 23.9 ± 1.7* 145.7 ± 1.4* 9029 ± 42 94.2 ± 0.1
STOR 23.9 ± 0.9* 1770 ± 100* 0.0 ± 0.0* 47.2 ± 1.0* 3477 ± 144* 0.5 ± 0.1* 90.3 ± 4.0* 5848 ± 241* 16.2 ± 4.2*
UN10 15.8 ± 0.4* 1270 ± 47* 0.0 ± 0.0* 30.3 ± 1.0* 2277 ± 89* 0.1 ± 0.0* 57.4 ± 2.4* 3810 ± 170* 1.0 ± 0.2*
UN6 26.2 ± 0.6* 1787 ± 155* 0.1 ± 0.0* 46.6 ± 1.5* 3304 ± 191* 0.4 ± 0.1* 85.3 ± 2.1* 5428 ± 44* 10.1 ± 0.9*
43
Headgear to Matched Headgear
Overall linear and rotational head acceleration distributions with the use of protective
headgear were generated for each impact velocity and head orientation (Figure). At both
locations and all three impact velocities, all headgear tested were able to reduce peak
linear and rotational head accelerations significantly from the control condition. At the side
location, the average reductions in linear acceleration across all headgear were 38 ± 7 g
at the low impact velocity, 54 ± 14 g at the medium impact velocity, and 72 ± 24 g at the
high impact velocity. The average reductions in rotational acceleration across all
headgear were 3290 ± 512 rad/s2 at the low impact velocity, 4157 ± 1200 rad/s2 at the
medium impact velocity, and 4521 ± 1700 rad/s2 at the high impact velocity. At the low
impact velocity, the greatest reductions in linear and rotational acceleration from the
control were achieved using the Full90 FN1 (48 g and 4030 rad/s2). However, at the
medium and high impact velocities, the greatest reductions in linear and rotational
acceleration were achieved using the Storelli ExoShield (74 g and 6043 rad/s2 at the
medium impact velocity, and 113 g and 7847 rad/s2 at the high impact velocity). Every
headgear tested significantly reduced concussion risk from the control condition at the
low and medium impact velocities. At the highest impact velocity, the ForceField Regular
failed to significantly reduce concussion risk (Table 5).
At the back location, the average reductions in linear acceleration across all headgear
were 43 ± 9 g at the low impact velocity, 56 ± 17 g at the medium impact velocity, and 62
± 29 g at the high impact velocity. The average reductions in rotational acceleration across
all headgear were 2544 ± 552 rad/s2 at the low impact velocity, 3067 ± 1081 rad/s2 at the

44
medium impact velocity, and 3288 ± 1785 rad/s2 at the high impact velocity. At the low
impact velocity, the greatest reduction in linear acceleration was achieved using the
Unequal Halo 10mm (49 g), while the greatest reduction in rotational acceleration was
achieved using the ForceField Ultra (3030 rad/s2). At the medium and high impact
velocities, the greatest reductions in both linear and rotational accelerations were
achieved using the Unequal Halo 10mm (79 g and 4549 rad/s2 for the medium impact
velocity, and 110 g and 6180 rad/s2 for the high impact velocity). Every headgear tested
significantly reduced concussion risk from the control condition at the low and medium
impact velocities. At the highest impact velocity, the Head Blast failed to significantly
reduce concussion risk (Table 5).
Figure 7. Box plots denote the first, second, and third quartiles for head acceleration values with the use of protective headgear for all headgear to headgear tests. Whiskers extend to minimum and maximum recorded values. Solid red boxes above the box plots indicate mean control accelerations ± one standard deviation. Headgear were able to reduce linear and rotational accelerations significantly from the control condition, even more-so than in the bare head to headgear tests.

45
Table 5. Almost all headgear were able to reduce linear and rotational head accelerations, and consequently concussion risk, significantly in headgear to matched headgear tests. Use of the Storelli ExoShield resulted in the greatest reduction in concussion risk at the side location, while the ForceField Regular provided the smallest reduction. At the back location, the Unequal Halo 10mm provided the greatest reduction in concussion risk, whereas the Head Blast provided the smallest reduction.
Side Location
Headgear
2 m/s 3 m/s 4 m/s
Peak Linear
Accel. (g)
Peak Rotational
Accel. (rad/s2)
Concussion Risk (%)
Peak Linear
Accel. (g)
Peak Rotational
Accel. (rad/s2)
Concussion Risk (%)
Peak Linear
Accel. (g)
Peak Rotational
Accel. (rad/s2)
Concussion Risk (%)
CTRL 63.1 ± 0.9 5266 ± 198 4.1 ± 0.7 105.6 ± 0.5 8360 ± 94 70.2 ± 1.7 161.8 ± 0.9 11728 ± 89 99.5 ± 0.0
DJ 21.7 ± 1.3* 1725 ± 169* 0.0 ± 0.0* 52.9 ± 2.6* 4321 ± 273* 0.3 ± 0.4* 90.5 ± 2.1* 7434 ± 430* 40.2 ± 9.6*
F90P 19.9 ± 1.0* 1609 ± 128* 0.0 ± 0.0* 49.6 ± 1.8* 3994 ± 205* 0.9 ± 0.2* 89.0 ± 3.5* 7452 ± 382* 39.2 ± 10.1*
F90S 22.2 ± 2.0* 1778 ± 144* 0.0 ± 0.0* 50.8 ± 4.9* 3950 ± 355* 0.9 ± 0.4* 102.9 ± 4.2* 8042 ± 287* 62.3 ± 8.7*
FFR 35.7 ± 3.8* 2779 ± 282* 0.2 ± 0.1* 75.0 ± 3.9* 6134 ± 120* 11.9 ± 2.4* 126.7 ± 2.7* 9456 ± 74* 91.9 ± 1.1
FFU 28.5 ± 2.3* 2263 ± 85* 0.1 ± 0.0* 65.4 ± 2.3* 5298 ± 214* 4.6 ± 1.0* 113.1 ± 3.8* 8956 ± 251* 82.6 ± 5.0*
FN1 14.7 ± 1.3* 1236 ± 97* 0.0 ± 0.0* 35.7 ± 2.5* 2925 ± 197* 0.2 ± 0.0* 75.3 ± 4.0* 6165 ± 405* 12.7 ± 4.5*
HB 32.3 ± 1.8* 2462 ± 173* 0.1 ± 0.0* 66.2 ± 1.9* 5274 ± 228* 4.6 ± 1.1* 104.8 ± 3.4* 8250 ± 88* 67.7 ± 3.9*
STOR 19.0 ± 0.6* 1498 ± 98* 0.0 ± 0.0* 31.9 ± 1.0* 2317 ± 122* 0.1 ± 0.0* 48.4 ± 2.3* 3882 ± 364* 0.8 ± 0.3*
UN10 22.6 ± 0.4* 1831 ± 46* 0.0 ± 0.0* 38.4 ± 0.2* 3071 ± 96* 0.3 ± 0.0* 61.8 ± 0.7* 5243 ± 44* 3.7 ± 0.2*
UN6 30.4 ± 0.4* 2580 ± 147* 0.1 ± 0.0* 54.8 ± 0.3* 4740 ± 79* 1.9 ± 0.1* 85.2 ± 0.7* 7198 ± 140* 31.3 ± 2.8*
Back Location
Headgear
2 m/s 3 m/s 4 m/s
Peak Linear
Accel. (g)
Peak Rotational
Accel. (rad/s2)
Concussion Risk (%)
Peak Linear
Accel. (g)
Peak Rotational
Accel. (rad/s2)
Concussion Risk (%)
Peak Linear
Accel. (g)
Peak Rotational
Accel. (rad/s2)
Concussion Risk (%)
CTRL 62.5 ± 0.2 4077 ± 34 1.5 ± 0.0 104.3 ± 0.5 6463 ± 86 34.1 ± 1.7 154.6 ± 0.5 9322 ± 241 96.4 ± 0.7
DJ 16.3 ± 1.5* 1319 ± 121* 0.0 ± 0.0* 47.7 ± 4.1* 3500 ± 275* 0.6 ± 0.2* 103.6 ± 5.5* 6940 ± 320* 42.5 ± 10.6*
F90P 14.8 ± 0.9* 1131 ± 105* 0.0 ± 0.0* 44.9 ± 2.9* 3344 ± 249* 0.4 ± 0.1* 97.2 ± 5.7* 6637 ± 193* 31.6 ± 7.4*
F90S 17.4 ± 1.4* 1367 ± 119* 0.0 ± 0.0* 58.2 ± 3.2* 3955 ± 215* 1.2 ± 0.3* 110.5 ± 3.3* 7101 ± 231* 51.5 ± 7.2*
FFR 19.4 ± 2.5* 1483 ± 275* 0.0 ± 0.0* 55.6 ± 4.2* 3993 ± 279* 1.1 ± 0.4* 112.0 ± 4.8* 7310 ± 244* 56.7 ± 8.7*
FFU 14.1 ± 1.6* 1046 ± 123* 0.0 ± 0.0* 39.4 ± 4.2* 2893 ± 263* 0.2 ± 0.1* 90.5 ± 5.5* 6127 ± 367* 20.0 ± 7.1*
FN1 19.9 ± 1.4* 1600 ± 92* 0.0 ± 0.0* 54.7 ± 3.1* 3655 ± 67* 0.8 ± 0.1* 103.9 ± 2.3* 6377 ± 322* 32.6 ± 6.7*
HB 42.9 ± 1.5* 3005 ± 208* 0.3 ± 0.1* 88.2 ± 1.3* 5759 ± 82* 13.9 ± 0.2* 141.4 ± 1.9* 8782 ± 96* 92.0 ± 1.0
STOR 17.8 ± 0.6* 1496 ± 32* 0.0 ± 0.0* 31.2 ± 1.7* 2313 ± 82* 0.1 ± 0.0* 53.5 ± 3.5* 3757 ± 147* 0.8 ± 0.2*
UN10 13.9 ± 0.4* 1243 ± 100* 0.0 ± 0.0* 25.6 ± 0.8* 1914 ± 131* 0.1 ± 0.0* 44.9 ± 1.0* 3142 ± 129* 0.4 ± 0.1*
UN6 23.1 ± 0.4* 1627 ± 178* 0.0 ± 0.0* 41.2 ± 0.2* 2636 ± 60* 0.2 ± 0.0* 67.8 ± 0.8* 4163 ± 131* 2.0 ± 0.3*
46
Discussion
A total of 724 tests were conducted to evaluate the ability of ten headgear to reduce head
accelerations in common soccer head impacts. From these tests, it was determined that
headgear did not provide substantial protection in ball-to-head impacts, but did result in
large reductions in head acceleration during head-to-head impacts. The ten headgear
tested varied greatly in construction and composition, and thus exhibited diverse
performance.
Ball-to-Head Impacts
Concussion risk for all tests in ball-to-head impacts were below 1%. This finding is
consistent with current literature, which also indicates that heading a soccer ball is a very
low-risk activity. From the few studies that have measured head accelerations during
active heading of a soccer ball, peak linear accelerations range from 12 to 55 g with an
average of 27 ± 12 g.31, 38-40 Peak rotational accelerations range from 732 to 3003 rad/s2
with an average of 1966 ± 879 rad/s2.38 These values are comparable to those measured
in the current study, in which peak linear accelerations ranged from 24 to 55 g with an
average of 38 ± 13 g, and peak rotational accelerations ranged from 2272 to 3730 rad/s2
with an average of 3034 ± 493 rad/s2. For context, the average concussion in football
occurs around 100g and 5000 rad/s2.41, 42
From a mechanical standpoint, the ball is a low mass, highly compliant object. This results
in the ball deforming greatly upon impact and managing most of the energy transfer.
47
Therefore, when the player strikes the ball, resulting accelerations are low and acute
injury from this activity is unlikely. The greatest reductions in linear and rotational head
accelerations that were achieved during all ball-to-head impacts were 4.7g and 982
rad/s2. Although these were statistically different from the bare headform head
accelerations, the reduction of already minimal risk (<1%) by 0.1 – 0.3 % is not likely to
be clinically relevant.
Head-to-Head Impacts
Head-to-head impacts are generally associated with higher concussion risk than ball-to-
head impacts. Withnall et al. tested head-to-head impacts with similar impact conditions
to those found in this study, at impact velocities of 2, 3, 4, and 5 m/s.32, 37 Three soccer
headgear were examined in the aforementioned study, one of which is no longer available
for purchase. Withnall et al. recorded average peak linear accelerations with and without
protective headgear ranging from 10 to 169 g with an average of 80 ± 49 g. Rotational
head accelerations were not reported. The current study had comparable findings with
respect to peak linear head accelerations, which ranged from 14 to 162 g with an average
of 68 ± 40 g.
Most headgear tested in this study were able to provide a substantial and meaningful
reduction in peak linear and rotational head accelerations from the control condition at all
impact velocities and orientations. In the Withnall et al. study, it was found that across all
headgear, overall reductions in linear head accelerations averaged about 33%. This is in

48
close agreement with the present study, which finds that overall reductions averaged
about 35%. With the addition of another, matched headgear being worn on the striking
headform, reductions increase to an average of about 53%.
There were substantial differences in performance across the ten headgears tested
(Table 6). These differences are most likely due to differences in headgear padding
composition, thickness, and coverage. In general, thicker padding led to greater
reductions in head accelerations and concussion risk. An overall metric was developed
to compare headgear performance based on the six impact scenarios conducted in the
bare head to headgear tests (one 2 m/s side impact, one 2 m/s back impact, one 3 m/s
side impact, one 3 m/s back impact, one 4 m/s side impact, and one 4 m/s back impact).
If a player experienced each of these impacts once, we could create a theoretical
prediction of concussion incidence for that player by adding risks together to summarize
overall performance.36, 43

49
Table 6. The Storelli ExoShield resulted in the smallest overall incidence metric, while the ForceField Regular resulted in the largest (yet still less than the control condition).
Headgear Overall Metric
CTRL 3.06
STOR 0.37
UN10 0.64
UN6 1.12
DJ 1.63
F90P 1.81
FFU 1.92
FN1 1.93
F90S 2.03
HB 2.29
FFR 2.55
If a player were to experience the six previously mentioned head impacts without wearing
any protective headgear, that player would theoretically sustain about three concussions,
on average. The ForceField Regular and the Head Blast provided small reductions in this
theoretical incidence, while the top performing headgear, the Storelli ExoShield, was able
to reduce the metric by a factor of 10. The Unequal Halo 10mm also provided very
substantial reductions. To illustrate the variable performance in headgear, two extreme
cases were examined in greater detail (Figure 8).

50
Figure 8. Two individual headgear performances with respect to concussion risk compared to control (bare headform) performance. Mean risk ± one standard deviation is shown for each condition. Results for both impact orientations (side and back) were combined. The Storelli ExoShield resulted in the smallest overall incidence metric, while the ForceField Regular resulted in the largest (least different from control).
This study was limited in several ways, the first of which is its restriction to laboratory
recreations as opposed to on-field research. Several institutions have been instrumenting
football players with head impact sensors to collect head acceleration data for the past
13 years.44 These measurements are taken using helmet-mounted accelerometer arrays,
making them unsuitable to measure impacts in unhelmeted sports such as soccer. Other
head impact sensors have been developed for unhelmeted sports, however it has been
shown that these devices struggle with both impact counting and acceleration
measurements.45 Future iterations of both software and hardware are needed before
these sensors can be used reliably. This study is also limited due to the finite amount of
impact locations examined. Furthermore, headgear were carefully positioned to ensure

51
direct contact with the padding in an effort to evaluate the design of each headgear. In
reality, any point on the head could be impacted during soccer play and soccer headgear
would ideally provide protection in all impact scenarios, not just those tested in this study.
Finally, the calculation of risk in this study was performed using a previously published
risk equation developed to model concussion risk in football players (Equation 1).
However, soccer players may not exhibit the same tolerance due to population-based
differences.
This study comprehensively tested and evaluated currently available soccer headgear.
Results indicate that the use of protective headgear could greatly reduce concussion
incidence for athletes exposed to high level player-to-player contact, specifically head-to-
head contact. If soccer leagues were to implement the use of protective headgear on a
large scale, we could potentially see huge reductions in concussion incidence rates in this
population.
52
References
1. Matser EJ, Kessels AG, Lezak MD, Jordan BD, Troost J. Neuropsychological
impairment in amateur soccer players. JAMA. 1999;282(10):971-973.
2. Matser JT, Kessels AG, Jordan BD, Lezak MD, Troost J. Chronic traumatic brain injury
in professional soccer players. Neurology. 1998;51(3):791-796.
3. Matser JT, Kessels AG, Lezak MD, Troost J. A dose-response relation of headers and
concussions with cognitive impairment in professional soccer players. J Clin Exp
Neuropsychol. 2001;23(6):770-774.
4. Downs DS, Abwender D. Neuropsychological impairment in soccer athletes. J Sports
Med Phys Fitness. 2002;42(1):103-107.
5. Witol AD, Webbe FM. Soccer heading frequency predicts neuropsychological deficits.
Arch Clin Neuropsychol. 2003;18(4):397-417.
6. Tysvaer AT, Storli OV, Bachen NI. Soccer injuries to the brain. A neurologic and
electroencephalographic study of former players. Acta Neurol Scand.
1989;80(2):151-156.
7. Tysvaer AT, Lochen EA. Soccer injuries to the brain. A neuropsychologic study of
former soccer players. Am J Sports Med. 1991;19(1):56-60.
8. Ellemberg D, Leclerc S, Couture S, Daigle C. Prolonged neuropsychological
impairments following a first concussion in female university soccer athletes. Clin
J Sport Med. 2007;17(5):369-374.
9. Barnes BC, Cooper L, Kirkendall DT, McDermott TP, Jordan BD, Garrett WE, Jr.
Concussion history in elite male and female soccer players. Am J Sports Med.
1998;26(3):433-438.
53
10. Kerr ZY, Marshall SW, Harding HP, Jr., Guskiewicz KM. Nine-year risk of depression
diagnosis increases with increasing self-reported concussions in retired
professional football players. Am J Sports Med. 2012;40(10):2206-2212.
11. De Beaumont L, Lassonde M, Leclerc S, Theoret H. Long-term and cumulative effects
of sports concussion on motor cortex inhibition. Neurosurgery. 2007;61(2):329-
336; discussion 336-327.
12. Crisco JJ, Greenwald RM. Let's Get the Head Further Out of the Game: A Proposal
for Reducing Brain Injuries in Helmeted Contact Sports. Curr Sports Med Rep.
2011;10(1):7-9.
13. Rowson B, Rowson S, Duma SM. Hockey STAR: A Methodology for Assessing the
Biomechanical Performance of Hockey Helmets. Ann Biomed Eng.
2015;43(10):2429-2443.
14. Cobb BR, Urban JE, Davenport EM, et al. Head impact exposure in youth football:
elementary school ages 9-12 years and the effect of practice structure. Ann
Biomed Eng. 2013;41(12):2463-2473.
15. Maher ME, Hutchison M, Cusimano M, Comper P, Schweizer TA. Concussions and
heading in soccer: a review of the evidence of incidence, mechanisms, biomarkers
and neurocognitive outcomes. Brain Inj. 2014;28(3):271-285.
16. Guskiewicz KM. No evidence of impaired neurocognitive performance in collegiate
soccer players. Am J Sports Med. 2002;30(4):630.
17. Dick RW. Is there a gender difference in concussion incidence and outcomes? Br J
Sports Med. 2009;43 Suppl 1:i46-50.
54
18. Powell JW, Barber-Foss KD. Traumatic brain injury in high school athletes. JAMA.
1999;282(10):958-963.
19. Comstock RD, Currie DW, Pierpoint LA, Grubenhoff JA, Fields SK. An Evidence-
Based Discussion of Heading the Ball and Concussions in High School Soccer.
JAMA Pediatr. 2015;169(9):830-837.
20. Boden BP, Kirkendall DT, Garrett WE, Jr. Concussion incidence in elite college soccer
players. Am J Sports Med. 1998;26(2):238-241.
21. Andersen TE, Arnason A, Engebretsen L, Bahr R. Mechanisms of head injuries in elite
football. Br J Sports Med. 2004;38(6):690-696.
22. Jordan SE, Green GA, Galanty HL, Mandelbaum BR, Jabour BA. Acute and chronic
brain injury in United States National Team soccer players. Am J Sports Med.
1996;24(2):205-210.
23. Kaminski TW, Cousino ES, Glutting JJ. Examining the relationship between
purposeful heading in soccer and computerized neuropsychological test
performance. Res Q Exerc Sport. 2008;79(2):235-244.
24. Kaminski TW, Wikstrom AM, Gutierrez GM, Glutting JJ. Purposeful heading during a
season does not influence cognitive function or balance in female soccer players.
J Clin Exp Neuropsychol. 2007;29(7):742-751.
25. Kontos AP, Dolese A, Elbin RJ, Covassin T, Warren BL. Relationship of soccer
heading to computerized neurocognitive performance and symptoms among
female and male youth soccer players. Brain Inj. 2011;25(12):1234-1241.
26. Putukian M, Echemendia RJ, Mackin S. The acute neuropsychological effects of
heading in soccer: a pilot study. Clin J Sport Med. 2000;10(2):104-109.

55
27. Rutherford A, Stephens R, Fernie G, Potter D. Do UK university football club players
suffer neuropsychological impairment as a consequence of their football (soccer)
play? J Clin Exp Neuropsychol. 2009;31(6):664-681.
28. Janda DH, Bir CA, Cheney AL. An evaluation of the cumulative concussive effect of
soccer heading in the youth population. Inj Control Saf Promot. 2002;9(1):25-31.
29. Lipton ML, Kim N, Zimmerman ME, et al. Soccer heading is associated with white
matter microstructural and cognitive abnormalities. Radiology. 2013;268(3):850-
857.
30. Rutherford A, Stephens R, Potter D, Fernie G. Neuropsychological impairment as a
consequence of football (soccer) play and football heading: preliminary analyses
and report on university footballers. J Clin Exp Neuropsychol. 2005;27(3):299-319.
31. Naunheim RS, Ryden A, Standeven J, et al. Does soccer headgear attenuate the
impact when heading a soccer ball? Acad Emerg Med. 2003;10(1):85-90.
32. Withnall C, Shewchenko N, Wonnacott M, Dvorak J. Effectiveness of headgear in
football. Br J Sports Med. 2005;39 Suppl 1:i40-48; discussion i48.
33. Cobb BR, MacAlister A, Young TJ, Kemper AR, Rowson S, Duma SM. Quantitative
comparison of hybrid iii and national operating committee on standards for athletic
equipment headform shape characteristics and implications on football helmet fit.
Paper presented at: Proceedings of the Institution of Mechanical Engineers, Part
P: Journal of Sports Engineering and Technology, 2014.
34. Cobb BR, Zadnik AM, Rowson S. Comparative analysis of helmeted impact response
of hybrid iii and national operating committee on standards for athletic equipment

56
headforms. Paper presented at: Proceedings of the Institution of Mechanical
Engineers, Part P: Journal of Sports Engineering and Technology, 2015.
35. Shewchenko N, Withnall C, Keown M, Gittens R, Dvorak J. Heading in football. Part
2: biomechanics of ball heading and head response. Br J Sports Med. 2005;39
Suppl 1:i26-32.
36. Rowson S, Duma SM. Brain injury prediction: assessing the combined probability of
concussion using linear and rotational head acceleration. Ann Biomed Eng.
2013;41(5):873-882.
37. Withnall C, Shewchenko N, Gittens R, Dvorak J. Biomechanical investigation of head
impacts in football. Br J Sports Med. 2005;39 Suppl 1:i49-57.
38. Hanlon EM, Bir CA. Real-time head acceleration measurement in girls' youth soccer.
Med Sci Sports Exerc. 2012;44(6):1102-1108.
39. Naunheim RS, Standeven J, Richter C, Lewis LM. Comparison of impact data in
hockey, football, and soccer. J Trauma. 2000;48(5):938-941.
40. Self B.P. BJ, Schill D, Eames C, Knox T, and Plaga J. Head Accelerations During
Soccer Heading. Vol 2. New York: Springer; 2006.
41. Rowson S, Duma SM, Beckwith JG, et al. Rotational head kinematics in football
impacts: an injury risk function for concussion. Ann Biomed Eng. 2012;40(1):1-13.
42. Rowson S, Duma SM. Development of the STAR evaluation system for football
helmets: integrating player head impact exposure and risk of concussion. Ann
Biomed Eng. 2011;39(8):2130-2140.

57
43. Funk JR, Rowson S, Daniel RW, Duma SM. Validation of concussion risk curves for
collegiate football players derived from HITS data. Ann Biomed Eng.
2012;40(1):79-89.
44. Duma SM, Rowson S. The Biomechanics of Concussion: 60 Years of Experimental
Research. In: Slobounov SM, Sebastianelli WJ, eds. Concussion in Athletics: From
Brain to Behavior. New York: Springer Science+Business Media; 2014:115-137.
45. Press JN, Rowson S. Quantifying Head Impact Exposure in Collegiate Women's
Soccer. Clin J Sport Med. 2016.

58
CHAPTER 4: CLOSING REMARKS
Research Summary
The research presented in this thesis evaluates multiple interventions that have been
introduced to address the high rate of concussion in soccer players. By utilizing video
analysis, head impact exposure for a collegiate women’s soccer team was quantified and
wearable head impact sensor performance was investigated. Exposure data will provide
insight into understanding concussions in an understudied population. Sensor
performance analysis illustrated the challenges associated with autonomously collecting
head acceleration data with head impact sensors, and will inform consumers and
researchers on the capabilities of currently available technology.
This study evaluated the ability of all currently available soccer headgear to reduce linear
and rotational head accelerations through ball-to-head and head-to-head laboratory
testing. The data presented will have applications towards headgear design, performance
regulation of headgear, and recommendations to athletes with regards to relative
performance. Results indicate that, while reductions in head accelerations in ball-to-head
impacts were small, the adoption of protective headgear on in head-to-head impacts
could reduce concussion risk significantly for soccer players. As a whole, the research
presented in this thesis will inform soccer organizations on best practices for player
safety.
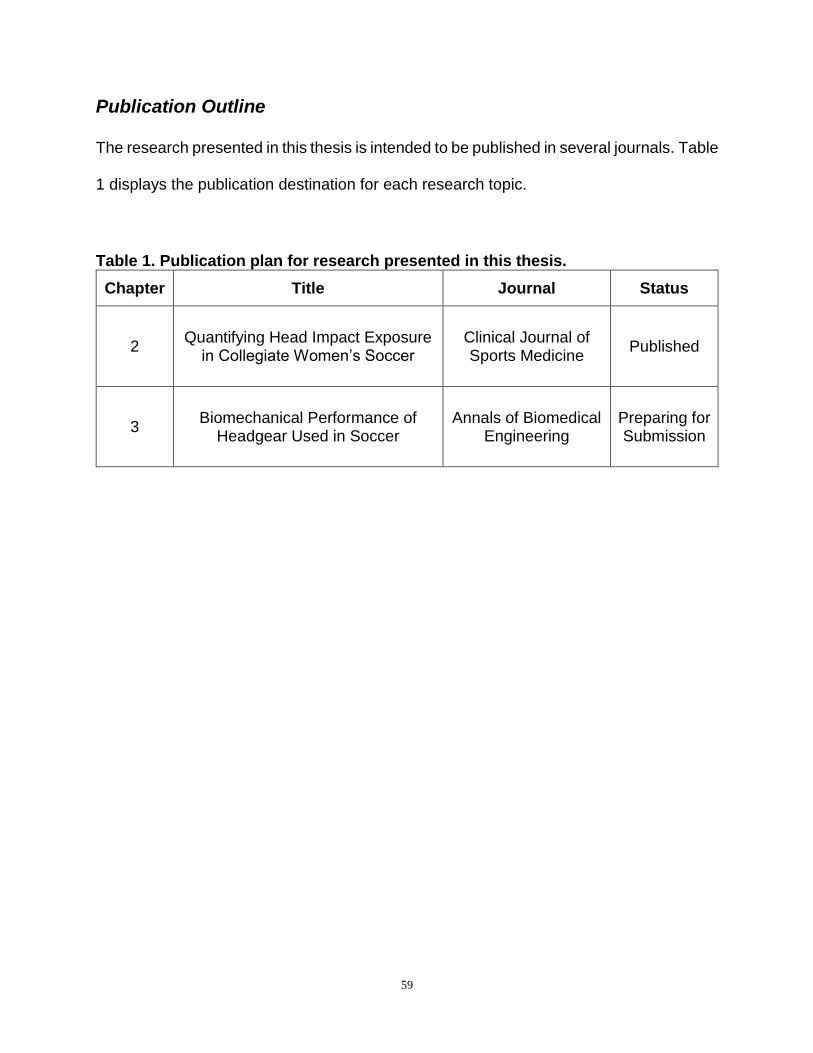
59
Publication Outline
The research presented in this thesis is intended to be published in several journals. Table
1 displays the publication destination for each research topic.
Table 1. Publication plan for research presented in this thesis.
Chapter Title Journal Status
2 Quantifying Head Impact Exposure
in Collegiate Women’s Soccer Clinical Journal of Sports Medicine
Published
3 Biomechanical Performance of
Headgear Used in Soccer Annals of Biomedical
Engineering Preparing for Submission
Recommended