1
BIOLOGICAL INDICATORS IN RELATION TO COASTAL POLLUTION ALONG KARNATAKA COAST, INDIA
XIVANAND N. VERLECAR, SOMSHEKHAR R. DESAI, ANUPAM SARKAR AND
S. G. DALAL
National Institute of Oceanography, Dona Paula-403 004, Goa, India.
Abstract: Marine pollutants in relation to planktonic and benthic organisms were examined at
two locations along Karnataka coast, one at Kulai (740 47.74” E and 120 55.16” N)
receiving huge amount of industrial effluents from fertilizer, petroleum and
chemical plants along with the sewage discharges. The other site Padubidri (740
45” E and 130 10” N) is located 20 kms away, which is a typically agricultural and
fishing village having no stress of industrial discharges. Although the
concentrations of dissolved oxygen (DO), nutrients and trace metals in water and
sediment showed marginal differences at these two locations, the concentration of
petroleum hydrocarbon (PHC) remained exceptionally high with a maximum of
1523 µg/l at Kulai which is 10 times higher than that at Padubidri (144 µg/l).
Biomass and population of phytoplankton and zooplankton showed that the
seasonal differences were more conspicuous rather than the regional changes.
Macro and meiobenthic population remained high at both the locations during the
two seasons. Phytoplankton species indicated that centric diatoms such as
Rhizosolenia, Leptocylindricus, Chaetoceros, Thalassiosira and Coscinodiscus
contributed to >90% of population in May and >70% in January at Kulai. While
mixed population of centric, pennate, cyanophycean and dinoflagellates prevailed
at Padubidri in January. Lower species diversity and richness accompanied with
2
dominance of fast growing centric diatoms over pennates observed at Kulai act as
an index for detection of organic pollution and nutrient enrichment. Similarly
proliferation of benthic bivalves >54% at Kulai relative to Padubidri suggests that
these organisms could sustain organic and industrial pollutants. The results
suggest that although Kulai receives large quantities of industrial and sewage
effluents responsible for alteration of the ecosystem structure, the excellent wind
driven mixing and tidal flushing keep the waters well aerated thus reducing the
severe pollution stress by dispersing the organic and other pollutants. Direct
relationship of PHC with Cd and Pb as contaminants, NO3 and PO4 as oxidants of
excess PHC and species diversity as promoters of phytoplankton (centric diatoms)
and benthic bivalves shown by multiple regression analysis further suggest that
these biological parameters could serve as indicators for detecting moderately high
environmental stress at Kulai, compared to Padubidri
Key words: Coastal pollution, Petroleum hydrocarbon, Trace metals, Nutrients, Bio-indicators, Plankton, Benthic organisms.
*Corresponding Author: E-mail: [email protected] Tel: 91-832-2450218

3
INTRODUCTION
Indian coast is continuously being threatened by effluent discharges from
metropolis and industrial towns. This gives rise to immense environmental
problems leading to deterioration of water quality. The extent of damage caused
by indiscriminate discharges of wastes could be perceived from some of the
published reports. Zingde and Govindan (2000) indicated that the coastal waters
of Mumbai receives industrial discharges up to 230 million litres per day (MLD)
and domestic wastes of around 2,200 MLD of which, 1800 MLD are untreated.
This has affected the water and sediment quality, with consequent effect on
aquatic communities. Similarly rapid industrial growth of the Gujarat State, has
given rise to waste discharges in some major rivers such as Kolak, Damanganga,
Amba and others, which is responsible to degrade the estuarine and coastal
waters (Zingde and Desai, 1987). In the east coast, increased metal concentration
in the coastal waters of Pondichery as reported by Govindasamy and Azariah
(1999) was as a result of the effluent discharges of nearly 16 major and minor
industries. Similarly Cheevaporn and Menasveta (2003) reported BOD loads of
659 to 34,376 tons/year from municipal and industrial waters in Gulf of the
Thailand which was responsible to starve aquatic life and alter the ecosystem
structure of the region. In the gulf of Trieste (Italy) Hg mining is responsible to
discharge about 1.5 tons of Hg / year which has increased the levels in marine
organisms exceeding 0.5 mg/kg (Sirca and Rajar, 1997).
In order to keep a check on coastal pollution Government. of India initiated
surveillance programme “Coastal Ocean Monitoring and Prediction System

4
(COMAPS)” in which, 26 sites along Indian coast have been identified as hot spots
which are either ecologically sensitive or severely affected by pollution. Kulai
along the Karnataka coast near Mangalore harbour, is one such location, wherein
recent years a number of industries have sprung up, which discharge industrial
and domestic effluents in nearby coastal waters. In this study, distribution of the
flora and fauna at the two sites Kulai and Padubidri, is examined in relation to
concentration of contaminants in water and sediments in order to understand
whether biological responses could be used as an indicator of pollution in
environmental monitoring programmes.
MATERIALS AND METHODS
Study area:
Two locations selected for the study include industrial town of Kulai (740 47’
7400 E and 120 55’ 1600 N), close to northern part of the New Mangalore harbour,
and another location which is an agricultural and fishery based village Padubdri
(740 45’ 0300 E and 130 10’ 1200 N), situated 20 km further north of Kulai along
the Karnataka coast (Fig 1). Coastal waters of Kulai were subjected to discharge of
effluents from various major and minor industries as well as contaminants arising
from harbour operations. The daily discharges of effluents of some industries near
Kulai, include KIOCL (Kuduremukh Iron Ore Corporation Ltd.) 40,000 m3, MCF
(Mangalore Chemical Fertilizers) 13,000 m3, MRPL (Mangalore Refineries and
petroleum Ltd.) 7,200m3 and BASF 3,600m3 in addition to Municipal waste water.

5
Padubidri, a typical agriculture and fishing village was selected as pollution free
area which do not contain any industry.
Sample collection and analysis
Vertical profiles of salinity and temperature were obtained, using a portable
CTD (Conductivity-Temperature-Depth) sensor (Seabird Electronics Inc USA). For
current measurement, a self-recording current meter (RCM-7, Aanderaa
Instruments Inc., Norway) was used. Water and sediment samples for chemical
and biological studies were collected from 9 stations spread over 25 km2 area at
each of the two locations Kulai and Padubidri. Three stations each were located at
5, 10 and 15 m depth contour, to get the proper representative samples from coast
to offshore. Water samples from surface and bottom were collected on fishing
trawler using 5 L Niskin sampler. Samples were sealed in plastic bottles and frozen
till analysis in shore laboratory. The sediment samples were collected using van-
Veen grab with an area of 0.04 m2. Those for chemical analysis were sealed in
plastic bags and frozen. For biological analysis sediment was washed through 0.5
mm mesh sieve and retained samples were preserved in 10% seawater formalin
containing Rose Bengal stain, for macrofauna studies. A core of 4 cm diameter
from the grab was obtained for meofauna studies.
Primary productivity in the water column was estimated by C14 method using
deck incubation. For Chla, water samples were filtered by GF/F filter papers,
extracted in 90% acetone and analysed using Turner Designs Fluorometer. For
phytoplankton cells, 500 ml water samples were fixed in Lugol iodine and formalin
and cells enumerated and identified using Sedgwick rafter counting chamber, on

6
inverse microscope. Zooplankton was collected using modified Heron Tranter net,
330 µm and mouth of 0.25 m2, attached with calibrated flowmeter, to record the
water filtered. Samples were preserved in 5% neutral formaldehyde.
Water quality parameters such as pH was analysed immediately after
collection, dissolved oxygen (DO) and BOD was measured using Winkler method.
Nutrients such as nitrate, nitrite, ammonia, total nitrogen, phosphate and total
phosphorus were measured as per procedures described by Grasshoff et al.
(1983). Petroleum hydrocarbons in seawater were extracted in double distilled
hexane and quantified using Shimadzu RF-1501 spectrofluorometer, at
excitation-emission wavelengths of 310 and 360nm. Cadmium (Cd) and lead (Pb)
in water samples were analysed by filtering water samples with 0.45 µmillipore
filter and pre-concentrating the water by chelating agent, ammonium pyrolidine
dithiocarbonate (APDC), followed by extraction of metal chelate into methyl
isobutyl ketone and analyzing on Atomic Absorption spectrophotometer (AAS). For
mercury analysis pre-concentration from sea water was done by complexing with
dithizone at pH<2. The complex was extracted in acid and back-titrated in 5 M HCl
and brought to aqueous phase and measured by cold vapor AAS.
The frozen sediments were thawed in laboratory and dried in oven at 400C,
then finely powdered and digested in HF in pre-cleaned acid washed tephlon
beaker followed by treatment with HNO3 and HClO4 to remove organic matter.
After evaporation of acid the residue was dissolved in dilute HCl and metal
determined using furnace AAS.
7
Prior to statistical analysis, all variables were tested for homogeneity by
comparing means and variances. After asserting the normality of data for all
variables ANOVA was performed for these parameters.
RESULTS AND DISCUSSION
Physical features
Physical features indicated that the surface temperature in May varied from
30.32oC to 31.27oC at Padubidri and 29.28oC to 30.87 0C at Kulai, with warm
waters near the coast. The bottom waters showed a reverse trend, with
temperature increasing from coast to offshore in premonsoon (May). Temperature
in postmonsoon (February) remained lower than May, the spatial variation was
only 30C and vertical temperature gradient was practically negligible at Padubidri
with similar condition prevailing at Kulai. The salinity also showed high values near
the coast propagating offshore in May at both locations. Salinity remained much
lower in February with practically no vertical gradient.
Water quality:
Seasonal changes in mean and SD values of various chemical and biological
parameters at the two locations are shown in Fig 2(a to h). It can be seen that
mean values of pH in May’97 remained higher at Padubidri (8.01 ± 0.02) than at
Kulai (7.83 ± 0.03), but in January ’98 they were almost similar at both the
locations (7.92 ± 0.02). The mean DO was more than 3 ml/l at both the locations
indicating sufficient aeration of the study area. BOD, which generally remained
below 2 mg/l, suggested low levels of organic load. Such low BOD values have
also been reported for highly polluted waters of Mumbai coast by Zingde and Desai

8
(1987), where high BOD load flows from Thana, Mahim and Versova creeks.
Constant renewal of waters by semidiurnal tides as reported by Swamy et al.
(2000) for Mumbai coast, may also be applicable to Mangalore which maintains
high DO and low BOD values in the study area. Although nutrients showed
fluctuations in relation to stations and seasons, their mean values at Padubidri and
Kulai remained low except for TN which were much higher at Kulai during 1998
observations. The highest concentration of NO2, NO3, NH4, TN and PO4, observed
were 1.57, 0.86 , 4, 143 and 1.73 ?mol/l, respectively.
As observed with nutrients the trace metals dissolved in water and in
sediments remained sufficiently low with variations during the seasons and
between the two locations. Seasonal mean of Cd, Pb and Hg in water at each of
the two locations did not exceed 0.59 ± 0.48?g/l, 1.62 ± 1.09µg/l and 53 ± 19ng/l,
respectively. Similarly, the mean Cd and Pb in sediments did not exceed 0.019 ±
0.01 and 12.03 ± 3.26 µg/g, respectively. These values are much lower than those
reported for some other coastal regions such as Pondichery and Mahabalipuram
along the east coast with seasonal mean concentration of Cd, 25.6µg/l and Hg,
60ng/l and Thane-Mumbai coast with mean concentration of Pb, 7µg/l in water and
28µg/g in sediments (Govindasamy and Azariah, 1999 and Krishnamurthy and
Nair, 1999).
While nutrients and trace metals remained low dissolved/dispersed petroleum
hydrocarbons showed abnormally high values at Kulai varying from 895 to
1493µg/l in May and 765 to 1523µg/l in January as compared to very low values
ranging from 0.5 to 129µg/l in May and 0.7 to 144µg/l at Padubidri respectively

9
(Fig. 3). A thick film of petroleum was visibly evident covering the entire stretch of
Kulai waters. Although, petroleum hydrocarbon was not estimated in bottom
sediment, chunks of tar residues were collected in grab samples, which indicated
continuous input of petroleum residues from the petrochemical industry located
near, by the Kulai coast. Petroleum hydrocarbons at Kulai were much higher than
those reported for Gujarat and Maharashtra coast (<100µg/l; Mehta et al., 1994)
and during oil spill near Madras Harbour (11 to 139µg/l; Selvaraj et al., 1999).
Monitoring studies at Mangalore Harbour (near Kulai), under COMAPS, during 29
February to 1 March 1992, before the MRPL went into the production showed low
PHC values ranging from 1.45 to 10.8µg/l. An increase in PHC values was
observed as soon as the factory was commissioned in March 1996, with values
ranging from 12.2 to 158.54µg/l whereas a further increase up to 725.45µg/l was
recorded in December. 1996 (NIO, 1998).
Community structure:
Although the regional changes in phytoplankton biomass and population in
between Padubidri and Kulai was clearly evident, their seasonal difference
appears to be equally conspicuous with Chl a and phytoplankton cell numbers
remaining high in May ’97 and low in Jan ’98 (Fig 2e to h). However, the
zooplankton showed a reverse trend with increased biomass and population in
Jan’98 than in May ’97. The population and biomass of macro and meiobenthos
although varied independently, their values remained high at Kulai than at
Padubidri. Thus the mean values of certain chemical as well as biological
parameters showed sufficiently large seasonal as well as regional differences at
10
these two locatios. In order to test whether the values differed significantly in
relation to depth, stations, locations, seasons, etc, a two way nested ANOVA was
carried out . The results given in fig 4 show that some of the parameters such as
PHC, Pb, PO4, NH4, TN, Chla, phytoplankton and zooplankton differed significantly
between the two locations, while others did not show major changes. This is the
clear indication of the effects of industrial effluents at Kulai region. For waters
receiving complex effluents, the role of strong physical forces becomes highly
important, because of which adequate mixing is brought about by prevalent wind
and tidal currents. This process is seen at Kulai where the effluents have shown
tendency to mix and travel southwards. But the current reversal phenomenon
prevailing occasionally in the region is also responsible to permit some of the
effluents to travel in the northerly direction (NIO, 1995). This is responsible to
maintain increased concentrations of parameters such as PHCs, NO3, NH4, PO4,
dissolved Cd and Pb at Padubidri during Jan’98 as compared to the other locations
along the coast (NIO, 1996). One of the surprising features of these analysis is
that although Kulai receives large quantities of PAH and other industrial inputs,
most of the biological parameters remain high at this location compared to
Padubidri. This perhaps could support the argument that effluents can favourably
induce growth biological communities at Kulai. In order to understand this, detailed
analysis of species composition of phytoplankton and group distribution of
zooplankton and benthos was carried out.
Phytoplankton was represented by a maximum of 36 genera in May’97and 32
in January’98 dominated by diatom species at both the locations. Station wise

11
Shanon Weaver’s diversity index (H’) and Margalef’s species richness (d) showed
that (H’) ranged from 1.16 to 3.52 at Padubidri and 1.42 to 2.99 at Kulai and (d)
from 4 to 11.6 at Padubidri and 3 to 9.4 at Kulai during the two observations. The
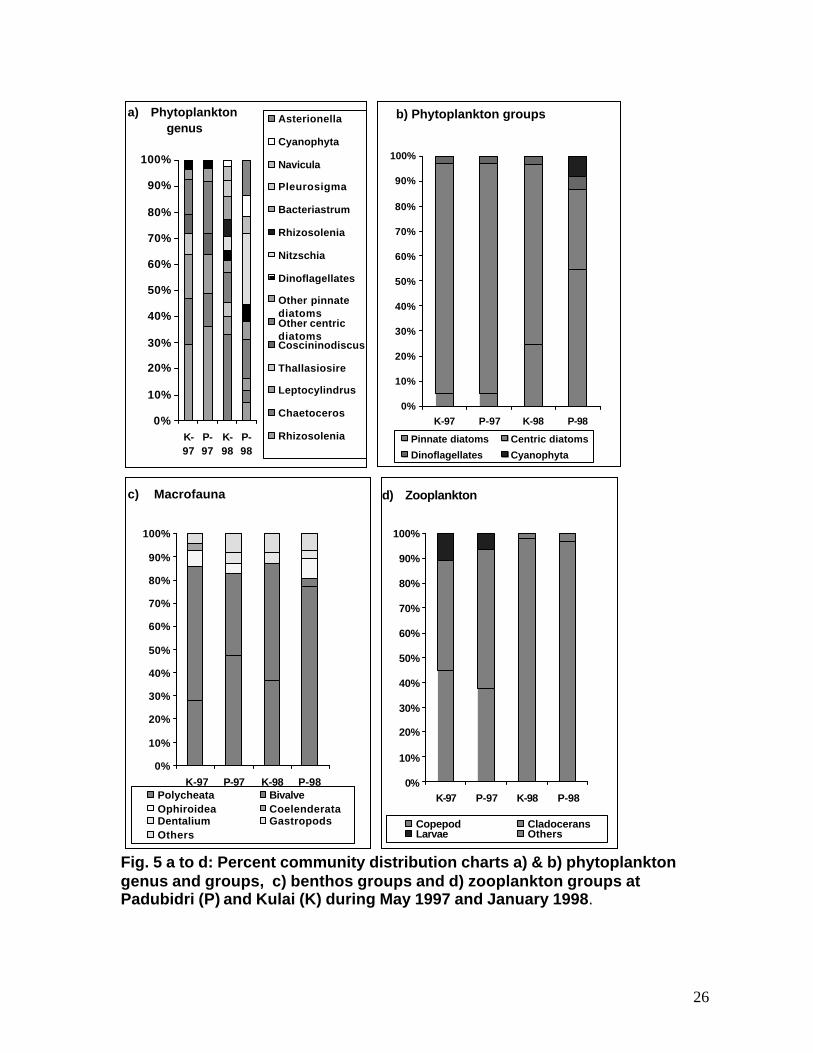
lower diversity was clearly seen at Kulai in May ‘97. Species distribution chart
shown in fig 5a&b indicates that Rhizosolenia dominated at both the locations in
May contributing to >27% of the population followed by Leptocylindrus 15%,
Chaetoceros 15%, Thalassiosira <13%, Coscinodiscus < 8%, Nitzschia <3% and
dinoflagellates such as Peridinium, Prorocentrum, Ceratium and Dyniphysis
together contributing to <6%. Going shape wise centric diatoms constituted > 90%
of the population at both the locations in May, the balance being pinnate diatoms
and dinoflagellates. However, the seasonal shift in population was clearly
observed in January’98 with Chaetoceros 30% constituting a bulk at Kulai,
followed by Rhizosolenia 9%, Bacteriostratum 8%, Nitzschia 8% and
dinoflagellates Peridinium, Prorocentrum, and Dyniphysis <2.5%. A pattern of
distribution grossly differed at Padubidri with Nitzschia seriate and N. clostatum
together constituting about 22%, followed by Asterionella 14% Navicula 7%,
Rhizosolenia 5%, Chaetoceros 5%, Leptocylindrus 5%, Thalassiosira 4%, blue
green algae Trichodesmium 8.5%, and dinoflagellates Peridinium and
Prorocentrum <4%. Common feature of January observation at Kulai was that as
seen in May centric diatoms occurred in overwhelming numbers with >70%
population, reducing the pinnates to 24%, dinoflagellates 3% and blue green
Triochodesmium 2.5%. At the same the most distinguishing character in January
was that pennates dominated at Padubidri with 54% occurrence while reducing the

12
centric to 32%, balance being blue green Trichodesmium 8.5% and dinoflagellates
5%. Thus dominance of centric diatoms over pinnates at Kulai suggests greater
tolerance of centric diatoms to high PHC content.
In support of the above, Mumbai Harbour-Thana estuarine system, which
receives sewage as well as industrial wastes was reported to principally suatain
centric diatoms such as Thalassiosira and Coscinodiscus and partly pinnate
Nitzschia from among 37 genera (Neelam Ramaiah et al., 1998). Similarly, in the
sewage polluted Hooghly estuary of the 29 species, Coscinodiscus constituted the
34 to 71% as major phytoplankton followed by other centric diatoms such as
Trichodesmium, Rhizosolenia, Chaetoceros, pinnates Asterionella japionica,
Skeletonema costatum and still lesser dinoflagellates Ceratium tripos and
Sillicoflagellate species, during the annual cycle (De et al., 1994). The above
observations suggest that lower species diversity accompanied by the dominance
of fast growing centric diatom species (such as Chaetoceros, Thalassiosira,
Rhizosolenia, etc) over pinnates as seen in Kulai can be identified as indices for
detection of high organic loads and nutrient enrichment in a water body (Harrison
et al., 1991 and Smyada, 1963). On the other hand high species diversity and the
succession of species observed during the two seasons at Padubidri may
represent less stressed environment for phytoplankton survival. Kimor 1992
reported shift of phytoplankton population from diatoms to dinoflagellates and
down shift of in size towards a dominance of small size nonoplankton (i.e
microflagellates and coccoids) as the effect of eutrophication. But such condition
13
was not observed in the study area indicating that impact of nutrient enrichment
were not drastically high.
Spacio-temporal variation in benthic communities indicated that population
and biomass at, Kulai is higher than Padubidri. Numerical abundance showed that
polychaetes and bivalves dominated at Padubidri in May contributing to about 47
and 36% population respectively., the other minor groups being opheroidea,
dentaleum, amphipoda and coelindrata (Fig 5c). Whereas, bivalves 60% formed a
major bulk at Kulai and polychaetes reduced to 28% while other groups
contributing to only 12%. A complete reverse pattern could be witnessed in
January, 98 with polychaetes forming a majority of 78% at Padubidri and bivalves
reducing to just 2.5% while opheroidea and amphipoda being minor groups. But at
Kulai bivalves 53% continued to be an important group, polychetes 37%, being the
next with other minor groups in balance. Meiofauna at both the locations was
however represented by a single group of nematod population remaining higher at
Kulai than Padubidri. Gopalakrishnan and Nair (1998) in their seasonal studies in
1998 at Kulai and south up to old Mangalore Port have also reported dominance of
bivalves to >62% followed by gastropods <20%, scaphapoda <8.5% and
polychaetes <7%, with minor fluctuation in population and biomass as compared to
the present observations. An invasive bivalve species, Mytilopsis sallei (Recluz)
has been reported to be successfully colonized in the Visakhapatnam Harbour in
spite of high PHC content (Chandra Mohan and Raghu Prakash, 1998). These
observations suggest that bivalves could be the most tolerant group to sustain
organic and other industrial pollution at Kulai. But in Jan’98 some of the stress
14
tolerant species of polychaetes might also have colonized Kulai waters. In case of
meiofauna, higher nematode population at Kulai suggest that are tolerant to the
industrial stresses.
Zooplankton distribution showed no specific trend at the two locations, with
copepods and cladocerons together contributing to > 80% of the population, while
fish and other invertebrate eggs and larvae constituting the rest in May ’97. During
Jan ’98, copepods was the only major group constituting > 97% population at both
the locations (Fig 5c). Higher zooplankon biomass and density during January’98
dominated by single group may be the result of enrichment of organic matter in
these waters. In the Mumbai harbour – Thane creek region also, copepods were
reported to be the major group with lower species diversity indicating stress of
sewage and other effluents on communities (Ramaiah Neelam, 1997).
Observations during oil spill at Murud (Maharashtra coast) reported that although
few of the phytoplankton such as Nitzschia were damaged by coating of black PHC
layer, the zooplankton were not severely affected (Gajbiye et al., 1993).
It is clear from the results that petroleum hydrocarbon remains to be the major
source of pollution in Kulai while the nutrients and trace metals showing indirect
fluctuations at the two locations. To understand the statistical relation of petroleum
hydrocarbon to biological and chemical constituents, a stepwise multiple
regression analysis was carried out which is given in Table 1. The results indicate
that except for mercury most of the parameters show significant relation to PHC
either at Kulai or Padubidri for pre-monsoon and post-monsoon observations.
Overall influence of all the parameters indicate significant relation during Jan 98

15
observation with R2 > 0.6. From the positive relation it can be concluded that Cd
and Pb could be mainly derived as contaminant from petroleum hydrocarbon
discharges but the input of Hg could be from the other industrial effluents. Also the
relation of nitrate and phosphate to PHC suggest the use of these nutrients as a
source of oxygen for oxidation of excess hydrocarbons, under aerobic conditions,
during bacterial degradation of oil (Zobell, 1962 cited by Selvaraj et al., 1999). This
ultimately keeps the nutrient values low in Kulai waters (Selvaraj et al., 1999).
Similarly, Chla along with phytoplankton diversity and species richness has
positive relation to the petroleum hydrocarbon. In support of our earlier argument,
that the effluents are favourable to selected biological communities, it is evident
that very few species proliferate at Kulai while retaining high biomass, while mixed
population prevails at Padubidri. This suggests that the contaminants at Kulai may
be inhibitory to the other diverse species prevailing at Padubidri. This leads to a
conclusion that only centric diatoms such as Chaetoceros, Rhizosolenia,
Thalassiosira and Leptocylindrus, benthic bivalves and copepods among
zooplankton are able to survive well at Kulai. Thus dominance of these organisms
in a coastal water body receiving effluent discharges could serve as indicators of
environmental stress. (De et al., 1994 and Neelam Ramaiah et al., 1998).
The phytoplankton diversity in the entire study area fluctuated between 1.16 to
3.52, which as per Hendy’s classification relates to moderately or slightly polluted
waters (Hendy, 1977). Phytoplankton growth studies at our laboratory have
reported that the toxicity of oil increases with the elevated amounts of aromatic
hydrocarbons which have tendency to get solubilised in water more than alkanes

16
(Phaterpeker and Ansari, 2000). It could be concluded therefore that the petroleum
wastes discharges may contain less quantities of refined products, thereby
producing limited stress to organisms, which are found proliferating in larger
number at Kulai. Laboratory studies on Chaetoceros tenuissimus have shown that
low Cd concentrations as prevailing at Kulai may not be stressful to phytoplankton
species as their tolerance is much higher (Desai et al., 2006). Although Kulai
receives large quantities of industrial and sewage effluents excellent mixing and
flushing conditions due to tide and wind induced coastal currents keep these
waters well aerated retaining sufficiently high oxygen and low BOD. These
conditions are helpful in bringing dispersion of organics and other pollutants
thereby reducing the severe pollution stress. However, as seen in multiple
regression analysis petroleum hydrocarbons have direct relation with biological
and chemical components. Hence lower species diversity and proliferation of
certain species of centric diatoms and benthic organism could be used as a
measure to detect moderately high environmental disturbances prevailing at Kulai
(Smyada, 1963). Whereas higher diversity of diatoms and benthic organisms at
Padubidri suggests stress free conditions which is favourable for healthy
community growth.
CONCLUSION
* Concentration of contaminants in water and sediments is examined at Kulai, a
site receiving industrial pollutants and Padubidri, an undisturbed location along
the Karnatake coast, to understand whether biological responses could be
indicative of environmental pollution.
17
* Loading of organic material is evidently seen at Kulai from high TN values in
January ’98, although other nutrients and BOD remained low with high DO.
Similarly while the trace metals were low, more than 20 fold increase in
dissolved petroleum hydrocarbons at Kulai, with a visible sheen of oil on water
surface, suggests that petroleum inputs are derived from external source such
as petrochemical industry.
* Sharp differences in populations of phytoplankton, zooplankton and benthos
observed at the two sites suggest the changes could be due to difference in
organic loadings at the two locations.
* Population studies indicate dominance in centric diatoms among phytoplankton
and copepods among zooplankton, in water column and bivalves in benthic
fauna at Kulai, while mixed population of phytoplankton with higher biodiversity
prevails at Padubidri along with other pelagic and benthic organisms.
* Current patterns have indicated their vital role at Kulai, in dissipation of
contaminants, as intense mixing of waters by winds and southward flow of
water mass have reduced the pollution stress for living communities.
* A stepwise multiple regression tests for the data have confirmed that statistical
relation exists between petroleum hydrocarbon and other biological and
chemical constituents.
* Accordingly it is seen that only centric diatoms such as Chaetoceros,
Rhizosolenia, Thalassiosira and Leptocylindrus, benthic bivalves and copepods
among zooplankton are able to survive well at Kulai. Thus dominance of these

18
organisms in a coastal water body receiving effluent discharges could serve as
indicators of environmental stress.
Acknowledgements The authors are grateful to the Director NIO for
encouragement. Thanks are also due to all the colleagues who assisted in
collection and analysis of samples.
REFERENCES
Chandramohan P. and Raghuprakash R. (1998) Concentration of petroleum
hydrocarbons in bivalve Mytilopsis sallei and in the harbour waters of
visakpatnam, east coast of India. Indian J. Mar. Sci. 27, 496-498.
Cheevaporn V. and Menasveta P. (2003) Water pollution and habitat degradation
in the gulf of Thailand. Marine pollution Bulletin 47 (1-6), 43-51.
De T. K., Choudhury A. and Jana T. K. (1994) Phytoplankton community
organization and species diversity in the Hugli estuary, north east coast of
India. Indian J. Mar. Sci. 23, 152-156.
Desai SR, Verlecar XN, Nagarajappa, Goswami U (2006) Genotoxicity of
Cadmium in Marine Diatom Chaetoceros tenuissimus using the Alkaline Comet
Assay. Ecotoxicology 15(4), 359-363.
Gajbhiye S. N., Mustafa S., Mehta P. and Nair V.R. (1993) Assessment of
biological characteristics on coastal environment of Murud (Maharashtra)
during the oil spill. Indian J. Mar. Sci. 24 (4), 196-202.
19
Gopal Krishnan T.C. and Chandrasekharan Nair K.K. (1998) Subtidal benthic
macrofuana of the Mangalore coast, West cosat of India. Indian J. Mar. Sci.27,
351-355.
Govindasamy C. and Azariah J. (1999) Seasonal variation of heavy metals in the
coastal waters of Koromandal coast, Bay of Bengal India. Indian J. Mar. Sci.
28, 249-256.
Grasshoff K., Ehrhardt M. and Kremling K. (1983) eds. Methods of seawater
analysis. Second revised and extended edition. Verlag Chemie, Weinheim,
German. 419pp.
Hendy N.I. (1977) In Proc. 4th Symposium. Recent and Fossil Marine Diatoms
(University of Oslo, Nova Hedwig), 355, cited by Tiwari, L.R. and Nair, V.R.
(1998) Ecology of phytoplankton from Dharmar creek, west coast of India.
Indian J. Mar. Sci. 27, 302-309.
Harrison P.J., Clifford P. J., Cochlan W. P., Yin, K., St. John M.A., Thompson P.A.,
Sibbald, M.J. and Albright, L. J. (1991) Nutrient and plankton dynamics in the
Fraser River plume, Strait of Georgia, British Columbia. Mar. Ecol. Prog. Ser.
70(3), 291-304.
Kimor B. (1992) Impact of eutrophication on phytoplankton composition. In:
Vollnweider R. A, Marchetti R, Vicviani R. (Eds.), Marine coastal
Eutrophication. Elsevier, Amsterdam:871-878.
Krishnamurti A. J. and Nair V. R. (1999) Concentration of metals in shrimps and
crabs from Thane-Bassein creek system, Maharashtra. Indian J. Mar. Sci. 28,
92-95.

20
Mehta P., Kadam A. N., Gajbhiye S. N. and Desai B. N. (1994) Petroleum
hydrocarbon concentration in selected species of fish and prawn form
northwest coast of India. Indian J. Mar. Sci. 23(2), 123-125.
NIO (1995) Oceanographic and environmental impact assessment studies for the
disposal of effluent for BASF India Ltd., Mangalore. NIO technical report No.
NIO/SP-17/1995, 1-58.
NIO (1996) technical report. Coastal Ocean Monitoring And Prediction System
(COMAPS). NIO technical report No. NIO/SP-24/1996, 1-147.
NIO, (1998) technical report. Comparative environmental impact assessment for
proposed facilities for Mangalore power plant at Padubidri, Karnataka.NIO
technical report No. NIO/SP-17/1998, 1-141.
Phatapekar P.V. and Ansari Z. A. (2000) Comparative toxicity of water soluble
fractions of four oils on the growth of a microalga. Botanica Marina 43, 367-375.
Ramaiah Neelam. (1997) Distribution and abundance of copepods in the pollution
gradient zones of Bombay Harbour-Thana creek-Bassein Creek, West Coast of
India. Indian J. Mar. Sci. 26(1), 20-25.
Ramaiah Neelam., Ramaiah N. and Nair V.R. (1998) Phytoplankton characteristics
in a polluted Bombay harbour-Thana-Bassein creek esturine complex. Indian J.
Mar. Sci. 27, 281-285.
Selvaraj K., Jonatham M. P., Rammohan V., Thangraj G. S., Pugalendhi M. and
Jayaraman V. (1999) Observations on petroleum hydrocarbons and some
water quality parameters during oil spills near Madras harbour. Indian J. Mar.
Sci. 28, 245-248.
21
Sirca A. and Rajar R. (1997)Calibration of a 2D mercury transport and fate model
of the Gulf of Trieste. In: Rajar R, Brebbia M. editors. Proceedings of the 4th
International Conference on Water Pollution 97. Southampton: Computational
Me-chanics Publication, 503-512.
Smayda T. J. (1963) Bull iner-am trop Tuna Comm, 7 191 cited by Tiwari L. R.,
Nair, V. R. (1998) Ecology of phytoplankton from Dharmar creek, west coast of
India. Indian J. Mar. Sci., 27, 302-309.
Swamy B. S., Suryawanshi, U. G. and Karande A. A. (2000) Water quality status of
Mumbai harbour- an update, Indian J. Mar. Sci. 29, 111-115.
Zingde M. D. and Desai B. N. (1987) Pollution status of estuaries in Gujarat-An
overview. Contribution in Marine Science-Dr. Qasim, S.Z. Fel S. Vol. ed.: Rao,
T. S. S., Natarajan R., Desai B. N., Narayanswamy G., Bhat S. R. NIO publ.
245-268.
Zingde M. D. and Govindan K. (2000) Health status of Coastal waters of Mumbai
and regions around. In : Environmental problems of coastal areas in India. ed. :
Sharma V. K. Bookwell publ. New Delhi India, 119-132.
Zobell C. E. (1962) Adv. Wat. Poll, 3, 85, cited by Selvaraj K., Jonatham M. P.,
Rammohan V., Thangraj G.S., Pugalendhi M., Jayaraman V. (1999)
Observations on petroleum hydrocarbons and some water quality parameters
during oil spills near Madras harbour. Indian J. Mar. Sci. 28, 245-248.

22
Fig.1: Study areas (Padubidri and Kulai) along the Karnataka coast
Table 1: Stepwise multiple regression analysis of phytoplankton species diversity at the two locations of Padubidri (P) and Kulai (K) during May 1997 and January 1998. R2-Coefficient of determination
P-97 P-98 K-97 K-98 Diversity -0.04 0.42 -0.58 Species richness -0.26 0.71 Chl -0.42 0.5 Cd -0.49 Pb 0.84 0.25 0.53 Hg
NO2-N+NO3-N+NH4-N -0.34 0.07 NO3 0.34 NH4 0.29 PO4 0.5 -0.27 -0.52 0.19 Intercept 10.81 52.22 1343 35.43 R2 0.326 0.62 0.26 0.68 Standard Error 5.33 42.47 155.68 32.32

23
Fig. 2 a to h: Mean and SD values of different chemical and biological parameters in water column and sediments at Padubidri and Kulai during May 1997 and January 1998. Units on Y axis constitute, pH-units, DO ml/l, BOD mg/l, NO2, NO3, NH4 & total nitrogen (TN) in µmol/l, Cd & Pb (in water) µg/l, Hg (in water) ng/l, C d-s & Pb-s (in sediments) µg/g, Chl (chlorophyll) mg/m3, PHY-phytoplankton (n x 104/l) & ZooB-Zooplankton biomass ml/100m3, MAB-Macrobenthos biomass, g/m2. Some of the values are the multiples as given in x axis. [MAP-Macrobenthos population n/m2, MEP- meiobenthic population n/10cm2].
p-97 (a)
-2
2
6
10
14
18
22
pHDO
BODNO2
NO3NH4
TNCd
PbHg
Cd-SPb-S
Chl
±1.96*Std. Dev.±1.00*Std. Dev.Mean
UN
ITS
p-97 (e)
-60
-40
-20
0
20
40
60
80
100
120
PHY MAB MAPx100 MEPx10 Zoo-B
±1.96*Std. Dev.±1.00*Std. Dev.Mean
UN
ITS
p-98 (b)
-4
0
4
8
12
16
20
pHDO
BODNO2
NO3NH4
TNCd
PbHg
Cd-SPb-S
Chl
±1.96*Std. Dev.±1.00*Std. Dev.Mean
UN
ITS
p-98 (f)
-40
0
40
80
120
160
PHY MAB MAPx100MEPx10 Zoo-B
±1.96*Std. Dev.±1.00*Std. Dev.Mean
UN
ITS
k-97 (c)
-20
2
46
8
1012
14
16
pHDO
BODNO2
NO3NH4
TNCd
PbHg
Cd-SPb-S
Chl
±1.96*Std. Dev.±1.00*Std. Dev.Mean
UN
ITS
k-97 (g)
-60
-20
20
60
100
140
180
PHY MAB MAPx100MEPx10 Zoo-B
±1.96*Std. Dev.±1.00*Std. Dev.Mean
UN
ITS
k-98 (d)
-2
2
6
10
14
18
22
pHDO
BODNO2
NO3NH4
TNx10PO4
CdPb
HgCd-s
Pb-SChl
±1.96*Std. Dev.±1.00*Std. Dev.Mean
UN
ITS
k-98 (h)
-150
-50
50
150
250
350
450
PHYMAB
MAPx100MEPx10
Zoo-B
±1.96*Std. Dev.±1.00*Std. Dev.Mean
UN
ITS

24
Fig. 3: Mean and SD of PHC ? g/l during May 1997 and January 1998 (PS & PB – Surface and Bottom waters at Padubidri, KS & KB –Surface and Bottom waters at Kulai).
-200
200
600
1000
1400
1800
2200
PS-97PB-97
PS-98PB-98
KS-97KB-97
KS-98KB-98
±1.96*Std. Dev.±1.00*Std. Dev.Mean
ug
/L

25
pH PO4 NO3 NH4 TN Chl Phy ZB ZP MAB MAP ME Cd Pb Hg PHC Cd-S Pb-S Sites S B Time S B Depth S B Station S B Sites*Time S B Time*Depth S B Depth*Station S B Sites *Depth S B Significant Non-significant No data Fig 4: A two way ANOVA for various parameters in water and sediment in surface (S) and bottom (B) waters. (Phy-phytoplankton, ZB-zooplankton biomass, ZP-Zooplankton population, MAB-Macrobenthos biomass, MAP-Macrobenthos population, ME-Meiobenthos, Cd-s- Cadmium in sediment, Pb-s- Lead in sediment)
26
a) Phytoplankton genus
0%
10%
20%
30%
40%
50%
60%
70%
80%
90%
100%
K-97
P-97
K-98
P-98
Asterionella
Cyanophyta
Navicula
Pleurosigma
Bacteriastrum
Rhizosolenia
Nitzschia
Dinoflagellates
Other pinnate diatomsOther centric diatomsCoscininodiscus
Thallasiosire
Leptocylindrus
Chaetoceros
Rhizosolenia
b) Phytoplankton groups
0%
10%
20%
30%
40%
50%
60%
70%
80%
90%
100%
K-97 P-97 K-98 P-98
Pinnate diatoms Centric diatoms
Dinoflagellates Cyanophyta
c) Macrofauna
0%
10%
20%
30%
40%
50%
60%
70%
80%
90%
100%
K-97 P-97 K-98 P-98Polycheata BivalveOphiroidea CoelenderataDentalium GastropodsOthers
d) Zooplankton
0%
10%
20%
30%
40%
50%
60%
70%
80%
90%
100%
K-97 P-97 K-98 P-98
Copepod CladoceransLarvae Others
Fig. 5 a to d: Percent community distribution charts a) & b) phytoplankton genus and groups, c) benthos groups and d) zooplankton groups at Padubidri (P) and Kulai (K) during May 1997 and January 1998.
Recommended