ENVIRONMENTAL RESEARCH ADVANCE
PLANTATIONS
BIODIVERSITY, CARBON SEQUESTRATION,
AND RESTORATION
Nova S
cienc
e Pub
lishe
rs, In
c.

ENVIRONMENTAL RESEARCH ADVANCE
Additional books in this series can be found on Nova‟s website
under the Series tab.
Additional E-books in this series can be found on Nova‟s website
under the E-book tab.
Nova S
cienc
e Pub
lishe
rs, In
c.

ENVIRONMENTAL RESEARCH ADVANCE
PLANTATIONS
BIODIVERSITY, CARBON SEQUESTRATION,
AND RESTORATION
REN HAI
EDITOR
New York
Nova S
cienc
e Pub
lishe
rs, In
c.
Copyright © 2013 by Nova Science Publishers, Inc.
All rights reserved. No part of this book may be reproduced, stored in a retrieval system or
transmitted in any form or by any means: electronic, electrostatic, magnetic, tape, mechanical
photocopying, recording or otherwise without the written permission of the Publisher.
For permission to use material from this book please contact us:
Telephone 631-231-7269; Fax 631-231-8175
Web Site: http://www.novapublishers.com
NOTICE TO THE READER
The Publisher has taken reasonable care in the preparation of this book, but makes no expressed or
implied warranty of any kind and assumes no responsibility for any errors or omissions. No
liability is assumed for incidental or consequential damages in connection with or arising out of
information contained in this book. The Publisher shall not be liable for any special,
consequential, or exemplary damages resulting, in whole or in part, from the readers‟ use of, or
reliance upon, this material. Any parts of this book based on government reports are so indicated
and copyright is claimed for those parts to the extent applicable to compilations of such works.
Independent verification should be sought for any data, advice or recommendations contained in
this book. In addition, no responsibility is assumed by the publisher for any injury and/or damage
to persons or property arising from any methods, products, instructions, ideas or otherwise
contained in this publication.
This publication is designed to provide accurate and authoritative information with regard to the
subject matter covered herein. It is sold with the clear understanding that the Publisher is not
engaged in rendering legal or any other professional services. If legal or any other expert
assistance is required, the services of a competent person should be sought. FROM A
DECLARATION OF PARTICIPANTS JOINTLY ADOPTED BY A COMMITTEE OF THE
AMERICAN BAR ASSOCIATION AND A COMMITTEE OF PUBLISHERS.
Additional color graphics may be available in the e-book version of this book.
Library of Congress Cataloging-in-Publication Data
ISBN: 978-1-62808-090-2
Published by Nova Science Publishers, Inc. † New York
Nova S
cienc
e Pub
lishe
rs, In
c.

CONTENTS
Preface vii
Chapter 1 Plantation and Non-Plantation Biodiversity Values: Distinctions of
Economic Theories and Market-Based Mechanisms to Value
Ecosystems and Utilization within an Australian Context 1 Mark P. McHenry and Katinka X. Ruthrof
Chapter 2 Mushrooms and Woodlands: Ecological Nexus 15 Osarekhoe Omorefosa Osemwegie, John Aroye Okhuoya
and Theophilus A. Dania
Chapter 3 The Use of Forest Plantations in the Semiarid Sahel Regions:
Impacts on the Abundance and Diversity of Soil
Legume-Nodulating Rhizobia and Arbuscular Mycorrhizal
Fungal Communities 33 Godar Sene, Mansour Thiao, Anicet Manga, Seynabou Sene,
Damase Khasa, Aboubacry Kane, Mame Samba Mbaye,
Ramatoulaye Samba-Mbaye and Samba Ndao Sylla
Chapter 4 Indigenous-owned Pastoral Land Forestry Carbon
Biosequestration and Bioenergy Options in Arid, Salt-affected
Western Australian Regions 53 Mark P. McHenry and Julia Anwar McHenry
Chapter 5 Harnessing Landholder‟s Knowledge for Environmental Monitoring
and Management for New Environmental Markets: Lessons from
Plantation Forestry Carbon Sequestration in Western Australia 77 Mark P. McHenry
Chapter 6 Sedimentary Organic Carbon Dynamics in a Native and an Exotic
Mangrove Plantation Based on Dual Carbon Isotopic Analyses 99 Qianmei Zhang, Jinping Zhang, Lianlian Yuan, Chengde Shen
and Hai Ren
Chapter 7 The Potential for Carbon Sequestration in Carbon Depleted Areas of
the Boreal Forest Ecozone through Agroforestry- Block Plantation 113 Silvia Lac and Manuel Esteban Lucas-Borja Nov
a Scie
nce P
ublis
hers,
Inc.

Contents vi
Chapter 8 Roles of Arbuscular Mycorrhizal Association in Plant Nutrition
and Growth of Tropical Forestry and Agroforestry in Degraded
Soil Reclamation 127 Nelson W. Osorio and Juan D. León
Chapter 9 Alluvial Gold-Mining Degraded Soils Reclamation Using Acacia
Mangium Plantations: An Evaluation from Biogeochemistry 155 Juan D. León, Jeiner Castellanos, Maria Casamitjana, Nelson W. Osorio and Juan C. Loaiza
Chapter 10 Effects of Incorporating Furcraea Species Biomass into
Acidic Andisols 177 Adriana M. Quinchía Figueroa, Juliana Uribe Castrillón
and Carolina Mesa Muñoz
Chapter 11 Effects of Forest Practices on Tortoises Wild Population in a
Forest Area 189 Maria Casamitjana-Causa, Juan C. Loaiza
and Pere Frigola Vidal
Chapter 12 Ecohydrology of Amazonian Rainforest Ecosystems 203 Conrado Tobón and Jan Sevink
Index 225
Nova S
cienc
e Pub
lishe
rs, In
c.

PREFACE
Food and Agriculture Organization of the United Nations (FAO, 2011) reported that the
estimated loss of global forest area declined from 16 million hectares per year in the 1990s to
an estimated 13 million hectares per year between 2000 and 2010. At the same time, large
areas of plantations had been established worldwide because of timber, tree crop production,
or restoration projects. It was estimated that there were currently about 230 million hectares
of total plantations in the world, or about 6.7% of the total forest area. Planted species in
plantations are primarily selected to produce timber and tree crops with high yield and
productivity. As a novel ecosystem, plantations provide numerous ecosystem services to
humans. However, plantations also have some undesirable characteristics, including low
biodiversity, loss of original endemic, rare, and endangered species, poor structure due to
extensive planting of fast-growing coniferous and exotic species, low ecosystem
heterogeneity, an overuse of ornamental species rather than functional species, a lack of
mature trees, frequent outbreaks of insect pests and diseases, and maintaining low soil
fertility. Fortunately, many of these issues are being recognized to a greater extent, and efforts
to manage their forests and plantations on the premise of multi-usability and sustainability has
begun.
Today, the challenges of plantations are even greater than in the past because of
accelerated climate change, changes in land use and land cover, changes in biogeochemical
cycles, population growth, urbanization, as well as the loss of traditional knowledge and
cultural diversity. Responding to these challenges and reversing the decline in plantation
ecosystem quality will require more detailed knowledge and experience in plantation ecology
and management.
This book focuses on plantations: biodiversity, carbon sequestration, and restoration. The
primary content explores plantation and non-plantation biodiversity values, mushrooms and
woodlands, the roles of arbuscular mycorrhizal in tropical forestry and agro-forestry, the
impacts on the abundance and diversity of soil legume-nodulating rhizobia and arbuscular
mycorrhizal fungal communities in semiarid regional plantations. The book also investigates
carbon biosequestration and bioenergy options of plantations, lessons from plantation forestry
carbon sequestration, carbon sequestration in agro forestry-block plantation or mangrove
plantations. The book includes targeted chapters on forest restoration and management of
plantations for restoring degraded landscapes, alluvial-gold-mining soil reclamation using
Acacia mangium plantations, effects of forest practices on wild populations of Testudo
hermanni, effects of incorporation of native species biomass in an acidic andisol to control Nova S
cienc
e Pub
lishe
rs, In
c.
Ren Hai, Mark P. McHenry and J. C. Loaiza-Usuga viii
water contamination from plant residues,and ecohydrology of Amazonian rain forest
ecosystems.
As the book developed, we were consistently astounded at the remarkable insights and
contributions of the authors of the chapters in this book. The international list of authors were
carefully selected, and through a rigorous peer review process, this edited book aims to fill
some of the information gaps in vegetation restoration and nutrient mobilization, particularly
in plantation ecosystems around the world. Our intended audience includes planners of
projects to restore and manage forests or plantations; practitioners who implement those
plans; forest resource managers who oversee the sites; forestry consultants; tree farms;
environmental authorities; conservationists and students of forestry. We also hope that
researchers and the public can find valued information for their future use and efforts. We
hope that our work can bring scientists and policy-makers together to envision a sustainable
future for woodlands‟ health and productivity management.
The reality of this book was facilitated by many people who worked tirelessly to edit and
select contributors. We express our thanks to the President Nadya Gotsiridze-Columbus,
Carra Feagaiga, Jennifer Ramirez and the staff of Nova Science Publishers, Inc. for their
encouragement and commitment to excellence in publishing. We also thank our reviewers:
Bruce Jaffee, Qinfeng Guo, Osemwegie Osarekhoe Omorefosa, Miguel Taboada, Ryszard
Mazurek, Walter Osorio, Juan Carlos Loaiza, J. C. Loaiza-Usuga, Mark P McHenry, Hai Ren
and contributors (authors) who were generous with their time, ideas, and comments which
improved each of the chapters and helped broaden the scope of the book.
Prof. Hai Ren, Ph.D.
South China Botanical Garden, Chinese Academy of Sciences, China
Mark P McHenry, Ph.D.
Faculty of Minerals and Energy, Murdoch University, Western Australia
Prof. J. C. Loaiza-Usuga, Ph.D.
National University of Colombia - Medellin Campus, Colombia
Forest Sciences Center of Catalonia (CTFC), Spain
Nova S
cienc
e Pub
lishe
rs, In
c.
In: Plantations ISBN: 978-1-60876-576-8
Editor: Ren Hai © 2013 Nova Science Publishers, Inc.
Chapter 1
PLANTATION AND NON-PLANTATION BIODIVERSITY
VALUES: DISTINCTIONS OF ECONOMIC THEORIES
AND MARKET-BASED MECHANISMS
TO VALUE ECOSYSTEMS AND UTILIZATION
WITHIN AN AUSTRALIAN CONTEXT
Mark P. McHenry1* and Katinka X. Ruthrof
2
1Faculty of Minerals and Energy, Murdoch University, Western Australia 2Centre of Excellence for Climate Change Woodland and Forest Health,
School of Biological Sciences and Biotechnology,
Murdoch University, Western Australia
ABSTRACT
Decisions regarding plantation development, either implicitly or explicitly, assign a
value to ecosystems. Whilst implicit valuation simply ignores biodiversity values in
plantation decision-making, explicit valuation introduces a representative value of
biodiversity losses or gains. This work explores the functional components of
biodiversity, the existing economic theory of biodiversity, and both advantages and
disadvantages of various mechanisms that drive ecosystem valuation to further the
development of market-based biodiversity policy and markets. This theoretical
refinement enables both public and private decisionmakers to clarify the data
requirements that underpin uncertainties in what values of biodiversity exist, to whom,
and discuss options to develop a comprehensive market-based mechanism that
internalises biodiversity values into everyday plantation investment decisions in the
Australian context. This work suggests a hybridisation of existing valuation methods are
a bridge towards functional biodiversity valuation in both plantation and non-plantation
land use, These new „non-commodity‟ markets may close the economic and market
„externality gap‟ between ecosystem conservation and exploitation, achieving
conservation objectives at little cost with thoughtful land use planning.
* Corresponding Author address Murdoch University, 90 South St Murdoch, Western Australia, 6150. Email:
[email protected]. Nova S
cienc
e Pub
lishe
rs, In
c.
Mark P. McHenry and Katinka X. Ruthrof 2
Keywords: Biodiversity; markets; ecosystems; plantations; native vegetation
INTRODUCTION
Article 2 in the United Nations Convention on Biological Diversity defines biological
diversity as “the variability among living organisms from all sources including, inter alia,
terrestrial, marine and other aquatic ecosystems and the ecological complexes of which they
are part; this includes diversity within species, between species and of ecosystems” (United
Nations, 1992, p3). The single biggest cause of biodiversity loss in Australia is the removal,
fragmentation, and degradation of native vegetation (Lockwood et al., 2000). Such land-use
change is also the single biggest driver of dryland salinity and rate among the largest sources
of domestic greenhouse gas emissions in Australia (Lockwood et al., 2000; John et al., 2005).
Nonetheless, how best to redress biodiversity loss has become much more complex than
simply halting or slowing the rate of vegetative removal. While explicit economic ecosystem
biodiversity valuation is uncertain and difficult, we choose to value it implicitly every day
(Costanza et al., 1997), and regrettably, the implicit value is often very close to zero.
Compounding the complexity of biodiversity valuation and decision-making is the lack of
distinction between the public and private good, and a rigorous scientific understanding of the
consequences of removal, protection, or planting of an ecosystem over time.
Economic valuation is purely anthropocentric in nature as it only considers benefits and
costs relevant to human well-being. Humans benefit from natural ecosystems culturally,
aesthetically, agriculturally, pharmaceutically etc., and also via the provision of such diverse
services as climate regulation, soil formation, nutrient cycling, materials, fuels, quality water,
etc. (Fromm, 2000). Ecosystems at the landscape level such as natural or plantation forests
can yield substantial flows of economic goods and services, both before and after
conversion/harvest (Balmford et al., 2002), and displacing native ecosystems with non-native
ecosystems and species (e.g. the introduction of beef, wool, wheat, plantation timber
production systems) can bring significant benefits to the community as whole (Bennett,
1999). These benefits ensure that there remains considerable social demand for landholders to
clear or modify native vegetation for agricultural, housing, fuel, timber, plantation, or
infrastructure development (Gibbons et al., 2009). On the other hand, such ecosystem
modifications also result in some undesirable opportunity costs to private individuals and the
general public (Bennett, 1999). At present these opportunity costs are currently ignored or
undervalued in policy circles because their values are largely external to private operators
(Costanza et al., 1997). Furthermore, a detrimental change in the net flow of benefits from the
ecosystem (whether natural or created) eventually occurs when productive ecosystems are not
managed sustainably, or the functional components are removed (Pagiola et al., 2004).
A quantification of the difference between the economic and market values of the net
ecosystem goods and service flows can provide a practical means to develop a mechanism
that enables outcomes that can maximize the net benefits of the ecosystem over time
(Balmford et al., 2002; McHenry, 2009a). Using economic techniques to incorporate
biodiversity values into decision-making processes allows a more meaningful comparison of
alternative land use options of retaining, removing, modifying, or establishing ecosystems in
theory (Department of the Environment and Heritage, 2005). However, in practice these Nova S
cienc
e Pub
lishe
rs, In
c.
Plantation and Non-Plantation Biodiversity Values 3
economic biodiversity valuation techniques require subjective quantification and qualification
of both benefits and costs (Bennett, 1999), and monetization is often difficult and irrelevant to
a market-based system at the level of the private decision-maker. However, not all net
ecosystem good and service flows are external to market-based decision-making, as land
values are a function of both productivity and visual amenity variables (Bastian et al., 2002).
The fundamental aim of this work is to refine biodiversity value theory to increase the
number of the currently few examples of plantation ecosystem values that are internalized
into the market price of land (for example dryland salinity, water resources, presence of
nitrogen fixing organisms in soils, etc.). These examples in many regions (not all) are
insufficient to facilitate first-class land use and management priorities, and new mechanisms
to internalize the various biodiversity values will be required to underpin fundamental land
use change from the „bottom up‟ in a market economy.
LINKS BETWEEN BIODIVERSITY AND ECOSYSTEM VALUE
The economic value of each ecosystem arises from the interdependent relationships
between species, habitat components, and their organization that contribute to ecological
functions, and the human welfare that can be derived from them over time (Fromm, 2000;
Balmford et al., 2002). Thus the fundamental primary value of the dynamic evolutionary
processes of the ecosystem‟s biodiversity, and the capability of the system to maintain
stability gives rise to the secondary value of exported ecosystem goods and services (Fromm,
2000). For example, soil biodiversity research by Griffiths et al. (2000) explored the
relationship between soil microbe biodiversity and agricultural pasture ecological function
stability. The research found that while biodiversity does not confer ecological function
stability directly, it does result in improved resilience and recovery from disturbance, and
thus, continuous provision of exported services to maintain the pasture system over time.
Whilst ecosystem secondary values rely on the primary ecosystem value, the primary value of
one ecosystem also relies on the exported secondary values of other ecosystems (Fromm,
2000; European Communities, 2008). Therefore, the economic value to humans of exported
services, or even the consumption of the primary ecosystem itself, can theoretically be traced
back to the ecological biodiversity structures and functions, which in turn is derived from the
ecological role of species as carriers of ecological functions (Fromm, 2000).
„Ecosystem biodiversity‟ refers to the variety of communities of organisms within
particular habitats, and also the physical conditions under which they live, while „functional
biodiversity‟ refers to the existence of some redundancy in functional populations which
underpin the capacity of ecosystems to absorb some disturbance without changing to a new
equilibrium (Griffiths et al., 2000; Nunes and van den Bergh, 2001). As an example, the
aforementioned pasture soil experimental results suggested that while the number of
functional groups were important, the level of soil animal species biodiversity did not impact
primary productivity as much as the value of species-specific, process-specific, and system-
specific behavior of functional groups (Bengtsson et al., 1997; Griffiths et al., 2000).
Therefore, from a human welfare perspective, economic valuations should ideally focus on
the relative changes in the value of ecosystem benefits from land use changes rather than the
level of change in benefits flowing from the ecosystem (Nunes and van den Bergh, 2001). Nova S
cienc
e Pub
lishe
rs, In
c.
Mark P. McHenry and Katinka X. Ruthrof 4
This is because the change in value of exported ecosystem goods and services has more of a
direct impact on human welfare than changes in the level of goods and services.
As the ecological function gives rise to the ability of ecosystems to generate and export
services, such as groundwater recharge, water nutrient removal, to generate economic value
in theory only a limited number of physical and biological processes are required which vary
in importance in different environmental conditions (Fromm, 2000; Nunes and van den
Bergh, 2001). This line of logic at the first instance may seem to imply that plantation
biodiversity is not a fundamental element for ecosystems in terms of economic or market
value. This leads to the possibility of seriously considering the substitutability of species and
their functional production values, although at present our level of knowledge of ecological
interdependencies and species substitutability is far from perfect (Fromm, 2000; Farber et al.,
2002). However, whilst the level of ecosystem biodiversity does not necessarily confer
ecological function, it does result in a higher resilience, that is, an ability to recover quickly
from disturbances (Tobor-Kaplon et al., 2005; Brussaard et al., 2007). This ability is the
essence of the primary ecosystem value derived from biodiversity that has no direct economic
or market value, yet is still valuable as a indirect contributor to maintaining the resilience of
ecological functions and the provision of ecosystem goods and services over time (Bengtsson
et al., 1997; Fromm, 2000).
Clearly, plantation biodiversity and ecological structures and functions will largely
continue to be external to market economic decision-making if their value remains
unquantified in a monetary sense, and clarifying the difference between total economic value
of ecosystem biodiversity and the apparent market value to both private and policy decision-
makers is essential. Unfortunately at present, even in theory, it is almost meaningless to ask:
“What is the value of ecological support systems in total?”, as their value to humans is
theoretically infinite (Costanza et al., 1997). However, it is economically meaningful to ask
“How value changes in the quantity or quality of ecosystem services may impact human
welfare directly and indirectly?”, to be able to represent a total economic value (Costanza et
al., 1997; Farber et al., 2002). Nonetheless, this work argues that it is more practical in a
market economy to also ask: “How value changes in the quantity and quality of ecosystem
services from a particular area of land impacts the welfare of individual decision-makers in
financial terms?” Attempting to answer this question provides a real market value,
sidestepping the uncertainties of economic values, and/or enabling comparisons between the
plantation ecosystem‟s economic and market value.
INDIRECT AND DIRECT BIODIVERSITY VALUE THEORY
Clarification of existing theory enables a clearer theoretical basis to integrate both
positive and negative externalities of activities that influence the level of change in benefits
flowing from forestry ecosystems. The identification of total economic value generated by
natural assets recognizes the anthropocentric, instrumental, and utilitarian values that are
gained or lost by segments of the environment that affect the welfare of at least one private
individual directly. This includes the biodiversity value gained or lost by segments of the
environment that affect the prices of agricultural and forestry inputs and products, in addition
to the productive use of species and genetics in these industries. Separate from direct Nova S
cienc
e Pub
lishe
rs, In
c.
Plantation and Non-Plantation Biodiversity Values 5
productive value, ecosystem biodiversity also has direct value for individuals in terms of
aesthetics, recreation, or simply for it to exist, whether or not it is utilized now, in the future,
or at all. However, the inclusion of ecological structures and function is necessary for total
economic value assessments, as individual and production values of biodiversity do not
recognize often indirect and complimentary relationships between humans and ecosystems
(Fromm, 2000).
Indirect use values of biodiversity are associated with ecosystem infrastructure that
supports economic activity (Nunes and van den Bergh, 2001). Indirect uses include functional
benefits for life-support ecological functions through the provision of soil formation, climatic
stability, clean air and water etc. Indirect ecological functions such as regulation of climatic
processes, the hydrological cycle, processing of human induced pollution, (etc.) can be
viewed as avoided health and material possession damages, and can be calculated as indirect
benefits which can be quantified probabilistically using aggregated data akin to a form of
insurance. The value in this case arises from the ecosystem protecting human capital, human-
made capital, and natural capital against disturbances. These indirect values of ecological
structure and function transcend the simple value of inputs for production (such as plantation
timber) and the value of an individual ecosystem itself (Fromm, 2000). Some indirect use
values manifest themselves as direct use values (Gilespie, 2000), especially in plantation and
agricultural production systems, such as improved stock water quality and storm protection.
Indirect use values can even include biological resources used to produce goods and services
such as pharmaceuticals (Nunes and van den Bergh, 2001). In contrast, direct use values of
biodiversity often refer to human uses of biodiversity in production and consumption, which
can also include tourism, research, and other activities (Gilespie, 2000; Nunes and van den
Bergh, 2001). A market analogy for direct and indirect use values are human-made assets for
direct individual use (i.e. timber, furniture, houses) and productive assets (i.e. tools,
plantations, farms), which are protected by security assets that support activities indirectly
(i.e. private liability insurance and social welfare systems) (Fromm, 2000).
The reductionist approach of determining total economic value disaggregates biodiversity
into more categories to calculate the total economic value as the sum of various use and non-
use values with a bottom up approach (Nunes and van den Bergh, 2001; Hecht, 2005). See
Equations 1 and 2. Indirect use values include vicarious values which relate to the benefits of
indirect consumption through books, documentaries, and other media. Non-use values relate
to benefits individuals obtain from the resource without directly or indirectly using them, and
include existence values, option values, quasi-option values, and bequest values (Gilespie,
2000). Existence value is simply the benefits from knowing that certain things remain
conserved and certain species and ecosystems survive (Bennett, 1999; Gilespie, 2000). Option
values relate to the maintenance of the right to use a resource, without necessarily doing so,
while quasi-option values refer to the benefits obtained from the opportunity to delay
decisions to make the most of improved information about the resource over time. Finally,
bequest values refer to the maintenance of environmental attributes for future generations
(Gilespie, 2000). These non-use values have the capacity to reflect human, moral,
philanthropic, or policy considerations of biodiversity protection intergenerationally (Nunes
and van den Bergh, 2001). Whilst these values are all valid, they pose significant difficulty to
market-based mechanisms and policymakers who may rely on balancing both development
and conservation pressures.
Nova S
cienc
e Pub
lishe
rs, In
c.
Mark P. McHenry and Katinka X. Ruthrof 6
Equation 1. Total economic value. Source: (Hecht, 2005).
Total economic value = use value + non-use value
Where, use value = direct use value + indirect use value, and; non-use value = existence
value + option value + quasi-option value + bequest value.
Equation 2. Total economic value simplified. Source: (Hecht, 2005).
Total economic value = direct use value + indirect use value + existence value + option
value + quasi-option value + bequest value.
Formal valuations of ecosystem goods and services provide insights into decision-making
trade-offs for or against ecosystem conservation, modification, or establishment (Howarth and
Farber, 2002). The aim of valuations are to clarify the value of the trade-offs between the
productive benefits and environmental benefits when land is utilized for, or taken out of
production (Bennett, 1999). The assessment of trade-offs require specialist knowledge of the
ecosystem, and the economic decision-making regarding conservation and production to
consider all potential benefits and costs generated by the natural resource (Fromm, 2000). A
simple and practical example is from the perspective of administration and monitoring, where
the benefits of environmental monitoring to underpin biodiversity indicators and markets
should exceed the costs by the greatest absolute amount (Pannell and Glenn, 2000). Yet, an
expansion of quantifying benefits and costs in terms of the economic value of the actual
biodiversity goods and services are more complex, as it attempts to apply worth to ecological
structure and function (Fromm, 2000). This is required to give policymakers options, and also
a rationale to protect non-plantation forestry assets, as conservation planning never occurs in
isolation from politics and economics (Fromm, 2000; Polasky et al., 2005).
THE MONETARY VALUE OF BIODIVERSITY
Economic valuation of biodiversity strives to overcome the current economic causes of
biodiversity loss and to ensure economic incentives are established to encourage biodiversity
conservation (Emerton, 2001). Economists consider that particular choices are desirable if the
benefits to the community exceed the costs from a community perspective (Gilespie, 2000).
Ecological economists are involved specifically with the relationships between property rights
and resource management, and model the interactions between the economy and the
environment, and use new instruments of environmental policy (Martinez-Alier, 1990). These
new instruments have been developed to correct many existing market failures that do not
account for the costs of biodiversity or ecosystem loss (Pagiola et al., 2004). These land use
planning market failures drive biodiversity and habitat loss by discounting or excluding non-
market benefits in market-based plantation decision-making (Balmford et al., 2002).
Market mechanisms such as carbon prices, biodiversity credits, or premium pricing for
sustainably produced goods and services, capture ecosystem values at a private level for
producers to allow them to have an incentive to generate positive outcomes (Balmford et al.,
2002; McHenry, 2009a, 2009b, 2010, 2011b, 2011a, 2012a). When these market-based Nova S
cienc
e Pub
lishe
rs, In
c.

Plantation and Non-Plantation Biodiversity Values 7
measures have been developed and implemented well, they enable sustainably-produced
goods and services to compete with conventional products that are effectively subsidized
through depreciating natural ecosystems (McHenry, 2011a, 2011c). Many ecosystem services
do not qualify for market trading as they are not private in nature (Farber et al., 2002).
Conserving relatively intact habitats on private land alongside timber plantation and other
production systems will often require compensatory mechanisms to mitigate the negative
private impact (Balmford et al., 2002). This is because some of the economic value of native
vegetation accrue to the broader community, while the associated costs of maintenance fall on
the landholder (Gilespie, 2000). Even when compensatory mechanisms do exist, smaller
incentives to landholders may be regarded as a waste of time, or even a direct insult to the
private owner (Lockwood et al., 2000; McHenry, 2012b), and the high level of work involved
in actively maintaining conservation areas is often underestimated by the broader community,
including decision-makers.
Options amenable to landholders, such as tax reductions, or exempt status, low-interest
loans, grant schemes, and other associated financial mechanisms could assist non-plantation
vegetation management on private lands (Gilespie, 2000). In reality, there are a number of
reasons why landholders remove, degrade, retain, improve or plant vegetation, which may or
may not be related to financial benefits, or optimal for the wider society (Gilespie, 2000).
Therefore, the use of both economic and informative mechanisms may have an improved
chance of assisting landholders to compare their available options, while including the real
value of the vegetation (both non-plantation and plantation) to the society.
The existence of land use externalities, (for example submerged ecosystems and altered
river flow regimes from the construction of very large water supply dams) form of market
failure, and a committed government can minimize their distortionary impact on the
community and the environment (Gregory Mankiw et al., 2000; Foxon et al., 2005; Jaffe et
al., 2005; McHenry, 2009a). While private businesses understandably do not invest in goods
and services such as clean air and water that are often free, market mechanisms can reimburse
entities for protecting the quality of goods and services while at the same time regulating
unacceptable outcomes (Longo and Markandya, 2005). This has developed in the energy
efficiency market with the introduction of regulatory minimum performance standards to
exclude inferior appliances, while information instruments allow consumers to choose to pay
a premium to obtain products exhibiting high energy and water use efficiencies. Therefore, a
neat distinction cannot be made between market and regulatory measures, as all market-based
measures require a regulatory and institutional setting (Diesendorf, 2007).
Establishing formally protected lands through regulation-only mechanisms may conserve
habitat, but socio-economic and political constraints limit this form of ecosystem
conservation (Polasky et al., 2005). The economic foundation of a decision for, or against, the
protection of biodiversity requires the inclusion of all costs and benefits relating to it.
However, there is an „externality gap‟ between the market and economic value of
biodiversity. Filling this valuation gap requires the identification of, and where possible, the
monetization of the services that vegetative asset provides (Fromm, 2000). Economically
biodiversity must be seen as an asset, and biodiversity conservation as an investment (Fromm,
2000; Farber et al., 2002). Neglecting conservation can be interpreted as de-investment in
assets, which leads to a reduction in ecosystem service provision, which in turn leads to an
economic cost (Fromm, 2000). Ensuring the continued provision of ecosystem services Nova S
cienc
e Pub
lishe
rs, In
c.
Mark P. McHenry and Katinka X. Ruthrof 8
requires conservation of natural systems, which also in turn calls for economic valuation
(Balmford et al., 2002).
Using monetary indicators for economic valuation of biodiversity enables comparisons of
alternative market-based ecosystem management options, while non-economic assessments of
biodiversity values do not (Nunes and van den Bergh, 2001; Pagiola et al., 2004). Monetary
indicators offer the flexibility to be based on various market price valuations or even
individuals willingness to pay for such services. However, with this flexibility comes the
potential to derive ambiguous monetary values of biodiversity, as different valuation
methodologies each have their strengths and weaknesses (Nunes and van den Bergh, 2001).
While a reasonable level of flexibility is necessary for assessment methods to accommodate
unusual situations, this flexibility needs to be balanced to ensure environmental
considerations are not compromised (Gibbons et al., 2009). At times, ecosystem, economic,
and market values are at odds with each other, as only some of the species in an ecosystem
are valued due to a number of reasons (Farber et al., 2002). It is for this reason that economic
biodiversity indicators and methods ought to be based on accurate biological indicators based
on scientific principles (Nunes and van den Bergh, 2001).
MARKET AND NON-MARKET BIODIVERSITY VALUATION
The main obstacles to the wider application of biodiversity valuation in Australia are lack
of biophysical information to support valuations, the technical accuracy of valuation
techniques, and ethical concerns over valuing environmental impacts in monetary terms
(Department of the Environment and Heritage, 2005). Particular ethical criticisms of
economic biodiversity valuations relate to conferring of dollar figures on „priceless‟
biodiverse assets, such as a non-plantation forest or river ecosystem. As always, there is a
counter argument: human development decisions either implicitly or explicitly value
ecosystems. Implicit valuation simply ignores biodiversity values in decision-making, and, by
comparison, explicit economic valuation represents the potential biodiversity losses
(Department of the Environment and Heritage, 2005). The primary purpose of economic
valuation is to obtain consistent information on the costs and benefits of biodiversity
conservation to inform decision-makers (Pagiola et al., 2004). This may balance the
predominance of implicit valuation processes.
There are a variety of values that biodiversity can be attributed beyond individual and
productive values, including security values that ensure the continued service provision from
ecological functions (Fromm, 2000). Theoretically, biodiversity value can be characterized by
a number of values: local versus global diversity, life diversity versus biological resources,
instrumental versus intrinsic values, and so on (Nunes and van den Bergh, 2001). Biodiversity
value can also be categorized in terms of an ecosystem spatially, or a habitat that is in high
demand, such as areas of recreation or tourism (Nunes and van den Bergh, 2001). However,
policymakers must be aware that there are unresolved issues in some valuation methods. For
example, whether economic valuations at multiple levels leads to double counting of
biodiversity values (McHenry, 2011a).
Market-based classifications of economic valuation include techniques such as: the
human capital approach; productivity changes method; defensive expenditures; Nova S
cienc
e Pub
lishe
rs, In
c.
Plantation and Non-Plantation Biodiversity Values 9
repair/replacement expenditures; shadow projects, and; the opportunity cost method
(Gilespie, 2000). In comparison, there are six major ecosystem service non-market economic
valuation techniques when market valuations do not capture the social value of biodiversity:
avoided cost techniques quantify the value of costs that would have occurred in the absence
of certain ecosystem services; factor income techniques value the enhancement to incomes
from improving ecosystem services; travel cost techniques reflect the costs people are
prepared to pay to travel to enjoy ecosystem services of specific regions; hedonic pricing
techniques reflect the differential prices people pay for goods that involve specific ecosystem
amenities; contingent valuation techniques value ecosystem services by quantifying the
differential values that people are willing to pay for hypothetical ecosystem service
alternatives, and finally; replacement cost techniques use the cost of substitutes that can
replace the ecosystem services (Farber et al., 2002).
The replacement cost technique is the only technique in both-market and non-market
categories, as it leaves scope to sum additional techniques to derive site-specific non-market
values (such as travel costs) and likely market-based values (such as plantation carbon
sequestration). The replacement cost technique estimates how much it would cost to replace
an environmental resource and is a promising approach to provide a substitute for an
ecosystem service valuation technique (Department of the Environment and Heritage, 2005).
The replacement cost technique gives value to ecosystem services by quantifying the cost of
restoring or synthetically replacing it (Balmford et al., 2002). This technique does not strictly
evaluate the value of biodiversity benefits, but is useful for providing an initial estimate of the
resources value (Department of the Environment and Heritage, 2005). While intuitively
appealing, replacement cost methods may misrepresent the „willingness to pay‟ or
„willingness to accept‟ valuation concepts in some circumstances where social amenities are
lost in the synthetic replacement (Farber et al., 2002). Nonetheless, replacement cost methods
do provide an easily verifiable and practical methodological choice to reveal the lower
bounds of biodiversity value to restore functional diversity and facilitate a cost-benefit
analysis of land use change options.
Formal cost-benefit analyses of areas of biodiversity can be used to determine productive
and individual values, although essential services may not be considered when there are
significant ecosystem knowledge gaps (Fromm, 2000). For example, a robust attempt at
valuing flood protection services provided by various vegetative islands (both plantation and
non-plantation) must be based on complex hydrological models of topography and
ecosystems, and uncertainties or errors can become considerable (Howarth and Farber, 2002).
However, if the economic costs of establishing and maintaining vegetative islands on
degraded land is low, then there is little practical barrier to „over-engineering‟ to ensure
sufficient protection as a form of insurance. If a plantation project aimed to replicate the
original high-quality habitat, then this organic category of replacement cost method would
have roughly comparable ecological function in terms of exported ecosystem services as the
original habitat (Emerton, 2001). Replacing the original vegetation would also avoid the lost
social benefits and may more accurately represent „willingness to pay‟ or „willingness to
accept‟ values by improving, retaining, or re-establishing ecosystem services over and above
flood-protection (Farber et al., 2002). However, economic valuations such as replacement
cost tend to handle large-scale and long-term problems poorly, but have the potential to be
suitable for looking into shorter-term and local-scale values (Pagiola et al., 2004).
Nova S
cienc
e Pub
lishe
rs, In
c.
Mark P. McHenry and Katinka X. Ruthrof 10
ECOSYSTEM SERVICE VALUATION METHOD AND LIMITATIONS
Valuation studies illuminate ecological structure and function relationships and their roles
in supporting human welfare (Howarth and Farber, 2002). While economic valuation has both
strengths and limitations as a decision-making tool, it is clear that information about
environmental management costs and benefits are essential to ensure efficient, equitable, and
sustainable outcomes. While most of the direct and indirect use values of ecosystems may be
approximated quite accurately, the availability of physical data or the change in the functional
ecosystem services are often limited (Pagiola et al., 2004). Variables, such as vegetation
condition, percentage of vegetation types cleared in the region, and the area of any potential
vegetative offset location should receive special attention during assessment (Gibbons et al.,
2009).
Local historical and cultural knowledge of ecosystems and their traditional land uses is
also recommended to inform biodiversity valuation studies (Dyer et al., 2008). When cultural,
historical, and social systems are intimately entwined with ecosystems, the individual
component values should, in theory, be a larger value than the sum, as these values are more
communal and have greater interpersonal impacts than standard economic ecosystem values
(Farber et al., 2002). Therefore, there is no one „correct‟ method or technique to obtain
ecosystem values, and there is a need for, as Farber et al. (2002) p390 describes as
“conceptual pluralism, and thinking outside the box” in its development. These issues beg the
question of: “How valuable are ecosystems to whom?”, as ecosystem benefits can fall
unequally across different groups of people, while being valuable to some and incurring costs
to others (Pagiola et al., 2004).
Landscape, species, and genetic diversity that provide input into productive processes
have been widely valued using the contingent valuation method (Nunes and van den Bergh,
2001). Contingent valuation asks how much a person would pay for a particular
environmental outcome, or how much compensation they would be prepared for its loss
(Balmford et al., 2002). The contingent valuation method is the most useful to identify and
measure economic non-use values. In principal, the contingent valuation method is applicable
for all biodiversity categories, except for categories that the general public is not informed
about, or has little experience with, for example: ecosystem life-support function valuations.
When far removed from human perception, contingent valuation becomes problematic when
eliciting the economic value of ecological processes (Nunes and van den Bergh, 2001), such
as the carbon fixation of trees, or respiration of soil biota. Contingent valuation is more suited
to interpretations of existence and bequest values from the amount an individual would pay to
know that a particular native fish exists in its natural habitat and remain so for future
generations, respectively. The concern with contingent valuation is the reliability and validity
of the responses (Loomis et al., 2000). These issues may be improved by including the
hedonic price method, where environmental services are valued by comparing market prices
of biodiversity conservation at a regional scale, such as a water body or catchment
(Lockwood et al., 2000; Balmford et al., 2002).
A hybridized total economic valuation of use and non-use values could be used by
utilizing government departments expenditure on specific ecosystem amenities (the hedonic
method) and the additional costs that people are prepared to pay to travel to use the ecosystem
(travel cost method), with the addition of a contingent valuation study of the non-use values Nova S
cienc
e Pub
lishe
rs, In
c.
Plantation and Non-Plantation Biodiversity Values 11
of native vegetation that sum to add value to the construction of new habitats (replacement
cost method). Using hybrid methods enables flexibility to cater for the unique circumstances
of each biological system (both plantation and non-plantation), and introduces a higher level
of rigor for decision-makers when choosing between various direct, indirect, or non-use
alternatives, than simply the current status quo of implicit valuation.
CONCLUSION
Regardless of the level of scientific rigor, high-precision, or accuracy of data utilized to
underpin and verify biodiversity values, there will necessarily remain a subjective human and
local element to the economic values determined. Rather than a stark trade-off between
biodiversity conservation and high-value plantation commodity production, a large fraction of
conservation objectives can be achieved at little economic cost with thoughtful land-use
planning (Polasky et al., 2005). While economists continue to debate the validity of economic
valuation methods, rightly or wrongly, they undermine the public confidence in valuation
techniques (ten Kate et al., 2004). At the same time, questions of irreversibility and
uncertainty raises issues for environmental valuation (Howarth and Farber, 2002). The prime
reasons for the explicit valuation of biodiversity is to introduce at least some value into
decision-making, and simultaneously foster a level of rigor in the analysis of the costs and
benefits of various alternative options available.
This review suggests that valuations of functional biodiversity is a bridge towards market
valuation of biodiversity, and new „non-commodity‟ markets may close the economic and
market „externality gap‟ between ecosystem conservation and exploitation. However,
functional biodiversity is difficult to value. Thus, the development of a hybridized „total
economic valuation‟ approach considering both use and non-use values of government
expenditures on specific ecosystem amenities and the travel costs that visitors incur,
alongside a contingent valuation of the non-use values of vegetation, and replacement cost
methods for new plantations, may a be a suitable approach. Such hybrid methods enables
flexibility to cater for each biological system (both plantation and non-plantation), and
introduces a level of relative comparison for decision-makers that is at least an improvement
on the current status quo of implicit valuation.
REFERENCES
Balmford, A., Bruner, A., Cooper, P., Costanza, R., Farber, S., Green, R. E., Jenkins, M.,
Jefferies, P., Jessamy, V., Madden, J., Munro, K., Myers, N., Naeem, S., Paavola, J.,
Raymnet, M., Rosendo, S., Roughgarden, J., Trumper, K., and Turner, R. K. (2002).
Economic reasons for conserving wild nature. Science, 297, 950-953.
Bastian, C. T., McLeod, D. M., Germino, J., Reiners, W. A., and Blasko, B. J. (2002).
Environmental amenities and agricultural land values: a hedonic model using
geographical information systems data. Ecological Economics, 40, 337-349.
Bengtsson, J., Jones, H., and Setala, H. (1997). The value of biodiversity. Tree, 12(9), 334-
336. Nova S
cienc
e Pub
lishe
rs, In
c.

Mark P. McHenry and Katinka X. Ruthrof 12
Bennett, J. (1999, 20-21 May). Estimating the values of environmental impacts of agriculture.
Paper presented at the Country Matters Conference, Canberra.
Brussaard, L., de Ruiter, P. C., and Brown, G. G. (2007). Soil biodiversity for agricultural
sustainability. Agriculture Ecosystems and Environment, 121(3), 233-244.
Costanza, R., d'Arge, R., de Groot, R., Farber, S., Grasso, M., Hannon, B., Limburg, K.,
Naeem, S., V, O. N. R., Paruelo, J., Raskin, R. G., Sutton, P., and van den Belt, M.
(1997). The value of the world's ecosystem services and natural capital. Nature, 387, 253-
260.
Department of the Environment and Heritage. (2005). Making economic valuation work for
biodiversity. Canberra, ACT: Land and Water Australia.
Diesendorf, M. (2007). Greenhouse solutions with sustainable energy. Sydney: University of
New South Wales Press.
Dyer, S., Grant, J., Lesack, T., and Weber, M. (2008). Catching up: conservation and
biodiversity offsets in Alberta's boreal forest. Ottawa, Canada: Canadian Boreal
Initiative.
Emerton, L. (2001). Economic measures for biodiversity planning: an annotated bibliography
of methods, experiences and cases. Nairobi, East Africa: The World Conservation Union
(IUCN).
European Communities. (2008). The economics of ecosystems and biodiversity: an interim
report. Cambridge, United Kingdom: Banson.
Farber, S. C., Costanza, R., and Wilson, M. A. (2002). Economic and ecological concepts for
valuing ecosystem services. Ecological Economics, 41, 375-392.
Foxon, T. J., Gross, R., Chase, A., Howes, J., Arnall, A., and Anderson, D. (2005). UK
innovation systems for new and renewable energy technologies: drivers, barriers and
system failures. Energy Policy, 33, 2123-2137.
Fromm, O. (2000). Ecological structure and functions of biodiversity as elements of its total
economic value. Environmental and Resource Economics, 16, 303-328.
Gibbons, P., Briggs, S. V., Ayers, D., Seddon, J., Doyle, S., and Cosier, P. (2009). An
operational method to assess impacts of land clearing on terrestrial biodiversity.
Ecological Indicators, 9, 26-40.
Gilespie, R. (2000). Economic values of the native vegetation of New South Wales. Sydney,
New South Wales: Native Vegetation Advisory Council, New South Wales.
Gregory Mankiw, N., Gans, J., King, S., and Stonecash, R. (2000). Principals of Economics.
Sydney: Harcourt Australia.
Griffiths, B. S., Ritz, K., Bardgett, R. D., Cook, R., Christensen, S., Ekelund, F., Sorensen, S.
J., Baath, E., Bloem, J., de Ruiter, P. C., Dolfing, J., and Nicolardot, B. (2000).
Ecosystem response of pasture soil communities to fumigation-induced microbial
diversity reductions: an examination of the biodiversity - ecosystem function relationship.
Oikos, 90, 279-294.
Hecht, J. (2005). Valuing the resources of Mulanje Mountain: study design: USAID.
Howarth, R. B., and Farber, S. (2002). Accounting for the value of ecosystem services.
Ecological Economics, 41, 421-429.
Jaffe, A. B., Newell, R. G., and Stavins, R. N. (2005). A tale of two market failures:
technology and environmental policy. Ecological Economics, 54, 164-174. Nova S
cienc
e Pub
lishe
rs, In
c.
Plantation and Non-Plantation Biodiversity Values 13
John, M., Pannell, D., and Kingwell, R. (2005). Climate change and the economics of farm
management in the face of land degradation: dryland salinity in Western Australia.
Canadian Journal of Agricultural Economics, 53, 443-459.
Lockwood, M., Walpole, S., and Miles, C. (2000). Economics of remnant native vegetation
conservation on private property Canberra, ACT: Land and Water Resources Research
and Development Corporation.
Longo, A., and Markandya, A. (2005). Identification of options and policy instruments for the
internalisation of external costs of electricity generation. The Fondazione Eni Enrico
Mattei Nota di Lavoro Series.
Loomis, J., Kent, P., Strange, L., Fausch, K., and Covich, A. (2000). Measuring the total
economic value of restoring ecosystem services in an impaired river basin: results from a
contingent valuation survey. Ecological Economics, 33, 103-117.
Martinez-Alier, J. (1990). Ecological economics: energy environment and society. Oxford,
England: Basil Blackwell.
McHenry, M. P. (2009a). Policy options when giving negative externalities market value:
Clean energy policymaking and restructuring the Western Australian energy sector.
Energy Policy, 37, 1423-1431.
McHenry, M. P. (2009b). Synergies between conventional soil organic carbon, farm
productivity, soil sequestration and soil carbon market risk in Australia. In: E. T. Nardali
(Ed.), In No-Till Farming: Effects on Soil, Pros and Cons, and Potential. Hauppauge,
New York, USA: Nova Science. 978-1-60741-402-5.
McHenry, M. P. (2010). Carbon-based stock feed additives: a research methodology that
explores ecologically delivered C biosequestration, alongside live-weights, feed-use
efficiency, soil nutrient retention, and perennial fodder plantations. Journal of the Science
of Food and Agriculture, 90, 183-187.
McHenry, M. P. (2011a). Australian carbon biosequestration and clean energy policy market
co-evolution: Mechanisms, mitigation, and convergence. Australian Forestry Journal,
75(2) 901-913.
McHenry, M. P. (2011b). Integrating climate change mitigation and adaptation: Refining
theory for a mathematical framework to quantify private and public cost-effectiveness,
and carbon emissions for energy and development projects. Renewable Energy, 36(4),
1166-1176.
McHenry, M. P. (2011c). Soil organic carbon, biochar, and applicable research results for
increasing farm productivity under Australian agricultural conditions. Communications in
Soil Science and Plant Analysis, 42, 1187-1199.
McHenry, M. P. (2012a). Practicalities of establishing forestry carbon sequestration projects
in the agricultural sector: a technical and economic analysis with implications. In: B. J.
Ryan and D. E. Anderson (Eds.), Carbon sequestration: technology, measurement
technologies and environmental effects. Hauppauge, New York, USA: Nova Science
Publishers. 978-1-62081-081-7.
McHenry, M. P. (2012b). Sensitive variables for applying biochar as a fertiliser substitute and
a method to sequester carbon in soils: a wheat crop scenario. In: B. J. Ryan and D. E.
Anderson (Eds.), Carbon sequestration: technology, measurement technologies and
environmental effects. Hauppauge, New York, USA: Nova Science Publishers. 978-1-
62081-081-7. Nova S
cienc
e Pub
lishe
rs, In
c.

Mark P. McHenry and Katinka X. Ruthrof 14
Nunes, P. A. L. D., and van den Bergh, J. C. J. M. (2001). Economic valuation of
biodiversity: sense or nonsense? Ecological Economics, 39, 203-222.
Pagiola, S., von Ritter, K., and Bishop, J. (2004). How much is an ecosystem worth? -
assessing the economic value of ecosystem conservation. Washington, DC USA.: The
International Bank for Reconstruction and Development/The World Bank.
Pannell, D. J., and Glenn, N. A. (2000). A framework for the economic evaluation and
selection of sustainability indicators in agriculture. Ecological Economics, 33, 135-149.
Polasky, S., Nelson, E., Lonsdorf, E., Fackler, P., and Starfield, A. (2005). Conserving
species in a working landscape: land use with biological and economic objectives.
Ecological Applications, 15(4), 1387-1401.
Ten Kate, K., Bishop, J., and Bayon, R. (2004). Biodiversity offsets: views, experience, and
the business case. Gland, Switzerland, Cambridge, United Kingdom, and London, United
Kingdom: The World Conservation Union (IUCN) and Insight Investment.
Tobor-Kaplon, M. A., Bloem, J., Romkens, P. F. A. M., and de Ruiter, P. C. (2005).
Functional stability of microbial communities in contaminated soils. Oikos, 111(1), 119-
129.
United Nations. (1992). Convention on Biological Diversity. Rio de Janeiro, Brazil.
Nova S
cienc
e Pub
lishe
rs, In
c.
In: Plantations ISBN: 978-1-60876-576-8
Editor: Ren Hai © 2013 Nova Science Publishers, Inc.
Chapter 2
MUSHROOMS AND WOODLANDS:
ECOLOGICAL NEXUS
Osarekhoe Omorefosa Osemwegie1*,
John Aroye Okhuoya2 and Theophilus A. Dania
2
1Biological Sciences Department, College of Science and Engineering, Landmark
University, Omu Aran, Kwara State, Nigeria 2Department of Plant Biology and Biotechnology, Faculty of Life Sciences,
University of Benin, Benin City, Edo State, Nigeria
ABSTRACT
Mushrooms produce specialised spectra of enzymes that they use in biochemical
extracellular digestion of diverse and chemically varied land organic compounds of both
synthetic and natural origin.
This singular behaviour enthroned fungi especially mushrooms as a foremost
ecological biodegrader of complex organic matter and recycler of interlocked elements in
organic compounds.
They are characterised by sub-perennial arrays of unseen vegetative growths, their
visible reproductive part remains a function of seasonality, nutrient levels and inter-
specific interactions.
The extent of their interaction and role on heterogeneous and homogenous
woodlands is indispensable with wide ranged benefits for agroforestry, agriculture and
conservation initiatives. A conceptualization of the ecological processes expressed by
mushrooms in woodland zones may underscore the synergism in the ecological
complexities of the woodland ecosystems productivity.
Keywords: Mushrooms, woodlands, interactions, conceptualization, potential benefits
* Corresponding Author: Biological Sciences Department, College of Science and Engineering, Landmark
University, Omu #Aran, Kwara State, Nigeria. Email: [email protected]. Nova S
cienc
e Pub
lishe
rs, In
c.

Osarekhoe Omorefosa Osemwegie, John Aroye Okhuoya and Theophilus A. Dania 16
INTRODUCTION
Mushrooms, which in various literatures are also referred to as macrofungi, toadstools,
macromycetes, basidioma (sexual fruit body of basidiomycetes) or ascoma (sexual fruit body
of ascomycetes) represent a biological and taxonomically distinctive group of fungi
(Redhead, 1997; Labarѐre and Menini, 2000).
These are defined diversely as larger fungi or higher fungi of the Class Basidiomycetes or
Ascomycetes and recently, Zygomycetes and non-lichenized fungi with large fruitification
(fruit body). In addition, mushrooms are also fungi with typical stalk and cap configuration,
fleshy or non-fleshy, fruiting body of a fungus plant which typically contains spores or spore-
bearing structures visible to the naked eye (Kirk et al., 2001; Miles and Chang, 2004;
Wasser, 2007).
The term mushroom is used in a restrictive sense to describe the extension of a fungus
mycelium, edible toadstool or basidiomycetes (Nicholson, 1989; Adewusi et al., 1993). It also
represents a polypore (non-gilled or non-lamellae mushroom), large visible fungus with
medicinal values, toadstool which is inedible or poisonous, mass of interwoven hyphae,
agaric (fleshy mushroom) and sporocarp (spore harbour) of a fungus rather than the mycelium
(Masuka and Ryvarden, 1993; Harkonen et al., 2003).
The restrictive use by extension also includes the antiquated categorization of wood
colonized obtrusive sporocarp as mushrooms and non-wood fungi as toadstool. Mushroom is
described by Chang and Miles (1993) as a macrofungus with a distinctive fruit body which
may be epigeous (above ground) or hypogeous (below ground) and is sufficiently large
enough to be seen with the naked eyes and picked by hand. Mushrooms therefore need not be
restricted to basidiomycetes or ascomycetes, fleshy or non-fleshy, edible or non-edible,
medicinal or lethal, subterranean rather than epigeous or hypogeous and may grow on
different organic based substrates/substrata (wood or non-wood) in diverse habitats
(Bates, 2006). The term mushroom can be used interchangeably with toadstools as opposed to
the antiquated categorization of the former as visible wood or edible fungal fruit-bodies and
the later as poisonous or non-wood based fruit-bodies. Mushrooms may consequently include
poisonous or edible, ectomycorrhizae species associated with the roots of conifers and
dicotyledonous trees or saprophytic species growing on plant tissues and plant wastes or
poisonous species or opportunistic parasites of tree plants (Labarѐre and Menini, 2000). They
also exhibit varying size, colour, shape (bracket, puffballs, truffles, cup, toothed, club etc.),
and texture (Figure 1) (O‟Dell et al., 2004; Wasser, 2007).
The growing global consciousness and knowledge of mushroom resources and products
have assisted the emergence of new areas of mycology which include but not limited to
mushroom science or biology, mushroom biotechnology and mycogeography. Chang and
Miles (1993) described mushroom biology as a special scientific excerpt (discipline or
branch) of mycology comprising diverse aspects that include mushroom cultivation and
genetics; medicinal and nutritional mushrooms; pathology, ecology and geomycology,
physiology and evolutionary biology, taxonomy and toxicity of mushrooms etc.
Mushrooms are non-photosynthetic, achlorophyllous fungal organisms incapable of
manufacturing their own food as do green plants. They produce a wide range of enzymes and
acids that can degrade a variety of complex substrates (organic matter) and consequently have
broad ecological distribution covering temperate, subtropical and tropical vegetations. Nova S
cienc
e Pub
lishe
rs, In
c.
Mushrooms and Woodlands 17
Figure 1. The diversity of mushrooms in some woodlands of Edo State, Nigeria. Lentinus squarrosulus
(M.) Singer (a), Auricularia auricular Judae (b), Marasmius graminum (Lib.) Berk. (c), Tremella
fuciformis Fr. (d), Clavaria sp. (Afro-fungus), Xylaria hypoxylon (L.) Grev. (f), Bondarzewia sp. (g),
Schizophyllum commune Fr. (h), Pluteus cervinus (Schaeff. ex Fr.) Kum. (i). Bar = 0.5mm.
They exist as saprophytes, parasites of trees or as symbionts on or within the cells of the
roots of higher plants (i.e. mycorrhizae) or they become an integral non-pathogenic
endophytic part of a plant part (Zadrazil, 1980; Wood, 1984; Chang et al., 1993). They are
also important in nature conservation, forest health, management and productivity because of
their proactive ecological roles and ecosystem functions to micro- and macrofauna and flora,
and mycorestoration processes (Ohga et al., 2000; Mshigeni, 2005; Stamets, 2005). The
majority of symbiotic microfungi have been reported on animals, humans and plants
(Kirk et al., 2001).
In return, the forest communities influence the atmosphere of mutual interactions,
mushroom spore dissemination and the establishment of hitherto cryptic mycelia,
strengthening genetic plasticity, and gene flow (Fries, 1981; Gregory, 1984). Mushrooms are
apparently more potentially valuable to plants, humans, some animals and insects compared
to other traditional thallophytes and microorganisms yet understudied as healthy ecosystem
resource.
It is within these contextual premises that this paper sorts to overview the robust
benevolence in the life activities of fungi in many woodland ecosystems and the
conceptualization of added values to improving human and animal life especially in Africa.
Nova S
cienc
e Pub
lishe
rs, In
c.
Osarekhoe Omorefosa Osemwegie, John Aroye Okhuoya and Theophilus A. Dania 18
MUSHROOM INTERDEPENDENCE WITH OTHER BIOTICS
Practice of Exploiting Edible Mushrooms from the Wild
The nutritional and the medicinal values of mushrooms are recognized in different parts
of the globe with abundant reports on their nutrient contents and medicinal usage (Lelley,
1987; Arora, 1989; Quimio et al., 1990; Bhandary, 1991; Masuka and Ryvarden, 1993; Alofe
et al., 1996; Kekawa, 2001; Akpaja et al., 2003; Osemwegie et al., 2006). The growing
demand for mushrooms as food and/or medicine especially in highly developed countries of
the world with advanced mushroom cultivation industries has boosted their commercial and
foreign exchange values. It has equally improve cultivation practices in developing nations,
exportation and rapid technological development that addresses improvement of yield;
reduced cropping period, genetic selection of pest/pathogen resistant variety and genetic
engineering for improved valued product yield (Oei, 1991; Chang and Miles, 1993; Mshigeni
et al., 2003; Miles and Chang, 2004). In many developing countries of Africa, mushrooms are
still being sourced from the wild rather than from approved cultivation cottages, farms or
certified retail markets. This practice predispose mushroom hunters (gatherers) to various
degrees of danger or worst still life threatening conditions from attack by wild animals and
insect. Although, this have been the ancient recreational practice of African, it is the direct
result of poor access to information, training and technology, ignorance of the possibility of
mushroom cultivation, lack of access to affordable mushrooming spawns, dis-interest by
veritable farmers, low numbers and slow developing mushroom cultivation industries and
lack of funds inter alia. Over-reliance on mushrooms from the wild or woodland forests in
many African nations slowly depresses wild mushroom diversity. This consequently has
feedback effects of forest fragmentation and gap, deforestation (including firewoodcollection)
and other general anthropogenic disturbances. It may also expose consumers to the risk of
mistakenly gathering poisonous with edible mushrooms leading to mycetisma or
mycotoxicosis (Quimio et al., 1990; Oei, 1991; Akpaja et al., 2003; Osemwegie et al., 2006).
This may possibly have a long term negative consequence on the forest or forest-floor
ecosystem balance and pressured forest productivity. The domestication of many African
edible mushrooms is slow and developing due to subjective reasons of socio-infrastructural
dysfunction, lack of political will power and poverty.
The indirect effects of tree loss due to deforestation activities, wood fuel (firewood and
charcoal) gathering, animal grazing by cattle rearing nomads and the practice of bush burning
on mushrooms diversity or the distribution, habitat selection and evolution of mushrooms
cannot also be overlooked. Though, empirical data are dearth on the impact of each of these
on the mushroom species richness, diversity and delivery of ecosystem function, overall
forest health and productivity, and climate for most African countries (Egli et al., 2006).
Alabi (1991), Osemwegie et al. (2006) and Idu et al. (2007) reported low incidents of
mushroom poisoning and death from mycophagy of wild edible mushrooms in Nigeria which
may be collected for commerce, poverty alleviation or food subsistence. This may be due to
factors such as lack of documented evidences in orthodox medical records, unpopular use of
modern health care centres by most rural communities, poor befuddled diagnostic and non-
reporting of incidences due to mushrooms poisoning or death. Mushrooms are widely
reported in scientific literature to be good sources of food, tonic and, in some cases medicine Nova S
cienc
e Pub
lishe
rs, In
c.
Mushrooms and Woodlands 19
since prehistoric times (Chang, 1980; Alofe, 1991). The nutritive nature, cultural knowledge
and values that are handed down generations were however more recent (Chang and Miles,
1993; Miles and Chang, 1997). Vegetations in Africa have been reported as hotspots of
mushroom diversity and new taxa, mapping of identified mushrooms worldwide remained
challenging to researchers while documentations on mycogeography are dearth. Mueller et al.
(2007) concurred with the hypothesis that mushroom mapping challenge is derived from the
variation between the location of mushroom fruit bodies and the mycelia activity as well as
the distribution of mycelia. Mushrooms contain 20-45% of protein (dry matter) and rich in all
essential amino acid whose quality competes favourably with those of plant and animal origin
(Lelley, 1987). In addition, they also possess polymeric carbohydrate diverse biochemical
characterization, origin, and various low molecular weight carbon compounds that include
glucose, fructose, galactose and threalose; minerals nutrients notable amongst which are
potassium, phosphorus and iron. They are also very rich in crude fibre and vitamins
particularly thiamine (B1), riboflavin (B2), panthotenic acid (B3), ascorbic acid (C) and
biotin (H) (Labarѐre and Menini, 2000).
Other Explorative Uses
In developed countries of the world however, mushrooms are also easily and readily
processed, dried, pickled or canned for storage until ready for shipment to end
users/consumers. Mushrooms growing popularity is acknowledged in literatures to enhance
both foreign and local commerce, and agriculture (e.g. animal husbandry, crop and tree
farming, fertilization of agricultural soils and biological control of pathogens and pests etc.).
It is also fundamental in the bioconversion of solid wastes of industrial, domestic and
agricultural origin; biotechnology such as bioremediation or mycorestoration of arable lands
contaminated by either heavy metals or agrochemical products e.g. pesticides and herbicides
or petroleum hydrocarbon and other effluents of diverse origins (Onianwa, 1995; Okeke et al.,
1996; Ochiel et al., 1997; Isikhuemhen et al., 2003; Anoliefo et al., 2002; Wasser, 2007).
Furthermore, mushrooms are also variably recognized in industries as sources of amino acids,
antibiotics, enzymes, organic acids, food, beverages, hormones (e.g. abscisic acid,
zymosterol) and natural products that are alternative substitute to synthetic chemicals in
biopulping. This is in addition to the wide range of new mushroom products being explored
in many aspects of human lives (Agu, et al., 1993; Kirk et al., 1993; Dreyfuss and Chapela,
1994; Bucher et al., 2004; Mshigeni, 2005). They are equally valuable in folk medicine
practice in Africa, Asia and South America despite the paucity of information on the patency
of folk knowledge of medicinal mushrooms, mushroom genetic resources and biodiversity
data e.g. species composition, richness and diversity (Alabi, 1991; Ryvarden et al., 1994;
Chang and Mshigeni, 2001; Akpaja et al., 2003; Osemwegie et al., 2006; Idu et al., 2006).
Little is also documented on mushroom biogeography, aboriginal (native, endemic or
indigene) and introduced macrofungal species in different locations around the globe contrary
to reports of their earlier discovery relative to other group of fungi (Miles and Chang, 1997;
Mueller et al., 2007). The holistic summary of the benefits of mushrooms to man including
their ecological role in forest ecosystem stability, development and community functions
cannot be over-emphasized (Gilbertson and Bigelow, 1998; Read and Perez-Moreno, 2003).
These potentials remain untapped in Nigeria and some other African countries. Nova S
cienc
e Pub
lishe
rs, In
c.
Osarekhoe Omorefosa Osemwegie, John Aroye Okhuoya and Theophilus A. Dania 20
Mushrooms which perhaps are valued for their edibility, medicinal uses, diverse domestic
and ecological relevance has encouraged global research interests (Jain, 2000; Labarѐre and
Menini, 2000; Stamets, 2000; Kirk et al., 2001; Miles and Chang, 2004; Mshigeni, 2005). It
has consequently become necessary to join in the global initiatives at understanding our
indigenous mushroom resources, identifying and preserving such resource pools by
minimizing threats to their diversity and ecological functions.
Forest Community and Litterfall
The forest ecosystems (woodlands) are complex with prolific reports on their community
structure, functions and composition with respect to animals, insects and leafy (herbaceous)
plants ecography compared to macrofungi (Waring and Schlesinger, 1985). Fungi and
especially mushrooms have hitherto been recognised as an integral but fundamental part of
the forest community and plantations, farms, gardens and other places with high deposits of
organic matter. Shigeki et al. (1994) and Takashi (2007) enunciated the role of fungi and
mushrooms in woodland ecosystems or forest‟s mineral cycles and the importance of lignin
as a regulating factor in the decomposition of litter. Where it not for the unceasing decay
activities of fungi and more especially mushrooms, humans and other living organisms would
have become suffused or suffocated in dirt or drowned neck-deep in leaves. Consequently,
fungi and mushrooms are also affected by a huge range of interconnected ecosystem activities
such as nutrient acquisition, competition for limited space, decomposition and litterfall
dynamics, and biogeochemical cycles (Coûteaux et al., 1995; Sala et al., 2000; Kauserud et
al., 2008). The heterogeneous and the homogeneous forests of the world therefore suffice as
the hottest spot of mushroom diversity (Myers et al., 2000)
According to Simmons (2003) litterfall is relevant to the movement of various organic
and inorganic matter through woodland ecosystems especially those characterised by a rich
expanse of heterogeneous trees and ecosystem services. Proctor (1983) and Dantas and
Phillipson (1989) observed that litterfall is important in the estimation of primary
productivity, stand vitality, indices of seasonal phenomena related to plant phenology, energy
and nutrient fluxes, and as bioindicators of ecosystem health. The word litter is reported by
McIntosh (1964) in the concise oxford dictionary, and Eagle and Hawkins (1975) in the
oxford illustrated dictionary of English to mean (i) rushes, straw and other materials used in
making animal beddings; (ii) straw and dung for farmyard; (iii) state of untidiness or
disorderly accumulation of papers or make place untidy, scatter or leave lying. Ecologically,
litter referred to a layer of dead plant material or any material especially of organic origin
lying on the surface of the soil such as shed animal skin, plant parts or organs (Proctor, 1983;
Simmons, 2003). This material does not however include standing dead matter such as tree
stumps, dead trees and felled tree trunks which render the aforementioned definitions
contextually unsatisfactory to an ecologist concerned with the functions of an ecosystem.
Furthermore, Proctor (1983) defined litter as dead or decaying organic matter whose source
may be from above or below ground plant parts while Maguire (1994) and Mudrick et al.
(1994) remarked that it represents a major biological pathway for essential elements transfer
from vegetation to soil and vice versa. Litterfall is therefore defined as the organic debris or
litter falling from the above ground parts of a plant onto the forest or plantation floor (Onyibe,
1990). In the same vein, Proctor et al., (1983) and Clark et al. (2001) described it as the Nova S
cienc
e Pub
lishe
rs, In
c.
Mushrooms and Woodlands 21
pathway for the transfer of organic and chemical elements from vegetation to the soil surface
in forest ecosystem. In contrast to this, Simmons (2003) defined litterfall as the constant rain
of organic debris on the forest floor while also describing it in a functional term as the
transfer of organic matter (carbon, energy and nutrients) from the tree canopy to the forest
floor. Consequently, the characteristic components of litterfall will include leaves, buds,
twigs, flowers, fruits, seeds, glumes and coarse woods of not more than 2cm diameter of
which only the leaf litter has been extensively studied with work on all other components
dearth (Vitousek, 1984; Proctor, 1984; Dantas and Phillipson, 1989; Simmons, 2003). The
litterfall therefore constitutes over 65% of the woodland degradable biomass while organic
biomolecules of animal origin and standing dead or felled trees composed the remaining 25%.
This reaffirms the irreplaceable role of forest litters as the conduit in the cycling of elements
valuable for tree nourishment and soil tilt (English term that describes the structure and
quality of a soil), growth and healthy performance of the forest ecosystem. Fungi along with
bacteria rely mostly on the litters as their primary food resource and stimulus in the ceaseless
process of decomposition and habitat selectivity. This natural process is harnessed in organic
farming to for composting, humus (humic substances) formation and other geomycological
mineralization processes.
Literatures are equally numerous on litterfall estimates either relative to their rate of
accumulation or disappearance or decomposition or nutrient content in various woodland
stands across the world spreading through both temperate and tropical climates (Aerts, 1997).
Vitousek (1982), Simmons (2003) and Vallinga (2004) reported that the ratio of leaf fall to
litter accumulation is higher in the tropics and low at higher latitudes. This acknowledges the
fundamental and simultaneous effect of climate and edaphic variables on dead forest biomass
decomposition activity as well as the metabolic diversity and activities of microbiotic
degraders (Weedon et al., 2009). Woodland litters have also been widely studied in relation to
fauna and flora diversity, ecological performance and overall forest productivity (Dantas and
Phillipson, 1989; Molofsky and Augspurger, 1992; Finotti et al., 2003). Reports are however
scanty on the interaction between litterfall, mushrooms and climate relative to elemental
extraction, accumulation and translocation, and how this interaction affects mushroom
metabolic selectivity and diversity structure in woodland ecosystems across temperate and
tropical latitudes. The recognition of the forest as the largest carbon pool and the attendant
understanding of the variations in the physical chemical and structural properties of litter
elements are consequently fundamental to estimating decomposition rates and niche
selectivity in any woodland ecosystem. Invariable, more researches to uncover the total
intricate workings and ecological connectivity between mushroom eco-processes (e.g.
mineralization, comminution, mobilization, utilization by metabolism or bioaccumulation and
other woodland ecosystem variables of climate, especially moisture and temperature) and tree
diversity or trait structure are still ongoing.
Information and studies on the eco-diversity of mushrooms limited in scope, scanty and
failed provide true representation of global diversity, nature, heritage and resources.
Therefore, it is important to connect with a global initiative to document, create inventories
and identify more mushroom genetic resource. The knowledge may just be important in (i)
identifying species vulnerable to extinction, estimating extinction rates and establishing
sustainable conservation strategies or basis for preserving mushroom hotspot areas, (ii)
estimating, monitoring and predicting mushroom diversity loss and extinction rates, (iii)
contribute to global inventory of mushrooms with the discovery of previously cryptic Nova S
cienc
e Pub
lishe
rs, In
c.
Osarekhoe Omorefosa Osemwegie, John Aroye Okhuoya and Theophilus A. Dania 22
(undescribed) taxa, habit and habitat (and niche), (iv) discover more ethnomycological
knowledge and practices especially in other remote areas of Africa and Asia, this may be as
variable as there are cultures, (v) boosting understanding of mushroom seasonality and other
ecological behaviours that affect the provision of healthy ecosystem functions, goods and
services, (vi) identifying and separating resident (indigent) and immigrant (introduced)
mushroom resources and, (vii) generating data that could select mushrooms as very sensitive
bioindicator of climatic change. Mushrooms from various empirical studies are
incontrovertibly a major nexus between plants, their nutrient availability and nutrient resource
utilization through the use of innumerable hydrolysing enzymes in natural elemental cycling
phenomena.
MUSHROOMS VERSUS TREES
Mushrooms and plants especially trees have ab initio enjoyed a ceaseless relationship that
could be dated back to many millennia long before the recognition of mushrooms by humans.
The extent and the nature of this relationship are constantly evolving with the environment
and may not be fully understood by modern science. However, mushroom diversity estimates
by Hawksworth (1991 and 2001) that put global fungi diversity at 1.5 million was
extrapolated from native plant species diversity, reemphasizing the inherent mutuality of the
two groups of organism. Subsequent attempts at diversity estimate of terrestrial fungi
including mushrooms could not also be divorced from trees/plants diversity (Manoharachary
et al., 2005; Crous et al., 2006; Chaverri and Vilchez, 2006; Wasser, 2007). Mueller et al.
(2006) and Hammond (1992) reaffirms this hypothesis by identifying that the ratio of plant-
fungus is fundamental to arriving at the actual global estimate of mushrooms. Estimating
mushroom diversity in Africa is constrained because the forest and trees were badly
documented, confounded by latitude and gradient coupled with dearth of grants and expert
mycologists especially mushroom taxonomists (Gryzenhout et al., 2012). These coupled with
the emerging controversies on fungal pleomorphism could disconfirm existing modest
assumption of global fungal estimate and contributed directly or indirectly to the poor fungal
biodiversity data from Africa. Therefore, it is logical to hypothesise that the architectural end
result of any woodland ecosystem across the globe is hitherto predetermined by a plethora of
complex interactive networks. We may also affirm that the woodland ecosystem provides
more resources, niche opportunities and surfaces for fungi to thrive due to its profound carbon
and mineral storage capacity. In view of this, it is expected that global fungal biodiversity is
to be more than what is estimated by Hawksworth (1991) and Wasser (2007). Consequently,
Labarѐre and Menini (2000) concluded that the knowledge of wild mushroom species in the
world over is poor and challenging researchers into undertaking more studies on the
biodiversity of fungi especially those that are macroscopic and less cryptic. This is to improve
the existing record on the 7% (about 100,000) fungi and 10% (14,000) mushrooms estimated
by Wasser (2007), as species already described globally.
The woodland patches around the globe represent large pools of carbon which are
mobilized by a conglomerate of microorganisms from litterfall and dead coarse woods in a
phenomenal biogeochemical process that stabilizes the ecosystem. Detritus food web and
forest floor decomposition dynamics is driven by fungi activities that provide the impetus for Nova S
cienc
e Pub
lishe
rs, In
c.

Mushrooms and Woodlands 23
detrital ecological succession involving bacteria, actinomycetes and other soil animalcules.
The role of fungi and mushroom in the maintenance of the forest (woodland) ecosystem was
linked to factors such as feeding habit.
This is exclusively by extracellular digestion of dead woodland biomass using
biochemical enzymes and acids, food resource distribution and microenvironmental
conditions. Studies have reported the dominance of ligninolytic, hemicellulolytic and
cellulolytic mushrooms (Figure 2) as the main decomposers of recalcitrant substances,
xenophobic and forest floor litter in many woodland ecosystems (Lynch and Thorn, 2006).
Consequently, this causes the release of renewable nutrient resource for use by the trees.
Mushrooms also influenced the long-term speciation, natural selection of resistant trees and
the slow disappearance of susceptible ones to disease causing attributes. Although,
mushrooms have only been associated with narrow disease causing potentials in plants
compared to their microfungi counterpart, they are still capable of depressing net productivity
of any poorly managed forestry and agroforestry.
The mechanism of competition by mushrooms for limited forest floor resources and
space with other microorganisms and/or detritus feeders may have stimulated the evolution of
acquired mutualistic behaviour with trees, consequently tilting the complex ecological
balance of ecosystem functions, metabolic diversity of decomposers and community stability
of the woodland ecosystem. The ecological role of fungi in the recycling of carbon, nitrogen,
oxygen, phosphorus, water and other minerals in woodland ecosystems is pivotal in
determining the net productivity, regeneration capacity and plant species composition of any
vegetation.
Humans have for many generations relied on woodland ecosystems for diverse
sustainable non-wood resources and products including edible and medicinal mushrooms.
They have contributed further to the extinction of trees and invariable loss of mushrooms
diversity due to geometric population expansion pressure and activity. This ecosystem is
incontrovertibly the largest repository (pool) of mushrooms across the globe which also
reemphasises their significance to the sustenance of healthy woodland vegetations.
Limited trees in diverse woodland have been reported to evolved root-pathogen defensive
mechanisms and mobilize nutrients more efficiently through the assistance of macrofungi
inhabiting their root system (mycorrhizae). The fungus help trap and/or manufacture nitrate
based nutrients for the host plant while receiving energy-rich carbohydrate resource in return.
Figure 2. The distribution of different arbitrary group of woodland fungi from a study of forests and
agroforest survey in Edo State, Nigeria (Osemwegie, 2008).
23%
70%
7%
Litter mushrooms
Soil mushrooms
Wood inhabitingmushrooms
Nova S
cienc
e Pub
lishe
rs, In
c.
Osarekhoe Omorefosa Osemwegie, John Aroye Okhuoya and Theophilus A. Dania 24
This is in addition to their role in the fighting off invasion of the host by other potentially
dangerous soil associated pests and pathogens through the expression of allelopathic
characteristic, superior feeding vigour, and uncanny antagonism. Knowledge has also
emerged on many other fungi of diverse nature that are located within the host plant tissues
called endophytes. They co-evolved with many species of trees in a symbiotic relationship
with the mechanism of symbiosis currently not well understood but hypothesized as
asymptomatic. Empirical work of Vega et al. (2008) showed that endophytes may benefit the
host plants by preventing pathogenic organisms from colonizing it, creating a “barrier effect”
where it outcompete the invading pathogens or produce chemicals inimical to the growth of
competitors. Fungi that are categorized as endophytes also contribute positively to the growth
and transpiration rates of the host coupled with protection against drought, heat and
overgrazing due to localised toxic content (Gao et al, 2010). Majority of soil fungi are
efficient in nutrient mineralization, bioweathering and CO2 evolution while also regulating
the turn-over of carbon and nitrogen.
Mushrooms and other non-mushroom forming fungi are parasitic and often looked upon
as evil while expressing their natural roles in maintaining global equilibrium through
processes that create new habitat and drive evolution. Based on this, humans may need better
understanding of parasitic fungi, the management of ecosystem economy and their contiguous
ecological significance to mount restraint against fungal annihilation. The constant use of
synthetic chemical fungicide to kill parasitic members of fungi is recently identified as having
negative consequences on the evolution of economically valuable endophytes that could
benefit humans especially in the area of medicine. It is also conceptual that some mushrooms
are pleomorphic in nature and the sexual teleomorphic mushroom phase may have a parasitic
anamorphic representative vulnerable to chemical attacks by humans. Although the effect of
constant human attacks of parasitic anamorphs on their corresponding mushroom teleomrphs
is not fully understood but may result in the decimation of mushroom diversity and eventual
extinction of hyper-susceptible species, loss of potentially valuable fungal resources and
productivity of vegetations (woodland ecosystems). Parasitic fungi may however attain
equilibrium with their host in time and space, transmuting into potentially useful endophytes.
The persistent chemical attacks on fungal parasites predates and drives the evolution of
resistant species, inject toxin or residue into ecosystem food chain that may become
biological magnified from one trophic level to another, and the environment with potentially
dangerous consequences to humans (Kaewchai et al., 2009). The voracious nature of fungal
nutrition results in the subterranean spread for miles of mycelium foraging for carbon and
nitrogen, and creating a compact network capable of protecting topsoil leaching, in situ
mycofiltration as well as adsorption of carbon/nitrogen, bacterial, insect and nematode
elements from runoff, mobilization of usable nutrient elements valuable to the health of plant
vegetation and inclined interaction with earth metals. Mushrooms therefore have the selective
advantage in wastewater, effluent and sewage treatment in vitro studies over bacteria and
other soil organisms. Furthermore, their broad ecological functions in the delivery of
ecosystem‟s goods and services is earnestly harnessed for the improvement of humans
livelihood (Figure 3) in the areas of agriculture (bioferfilizers, biocontrol), environment
(biodegradation, bioremediation), industries (brewing, pharmaceutic, nutrition, biopulping,
biogas, biofuel, dye extraction) and economy (mushroom farming, food security, mushroom
retailing/commerce). Therefore, the question is whether mushrooms are worth preserving
despite their unobtrusive nature and if there is enough political will to form and implement Nova S
cienc
e Pub
lishe
rs, In
c.
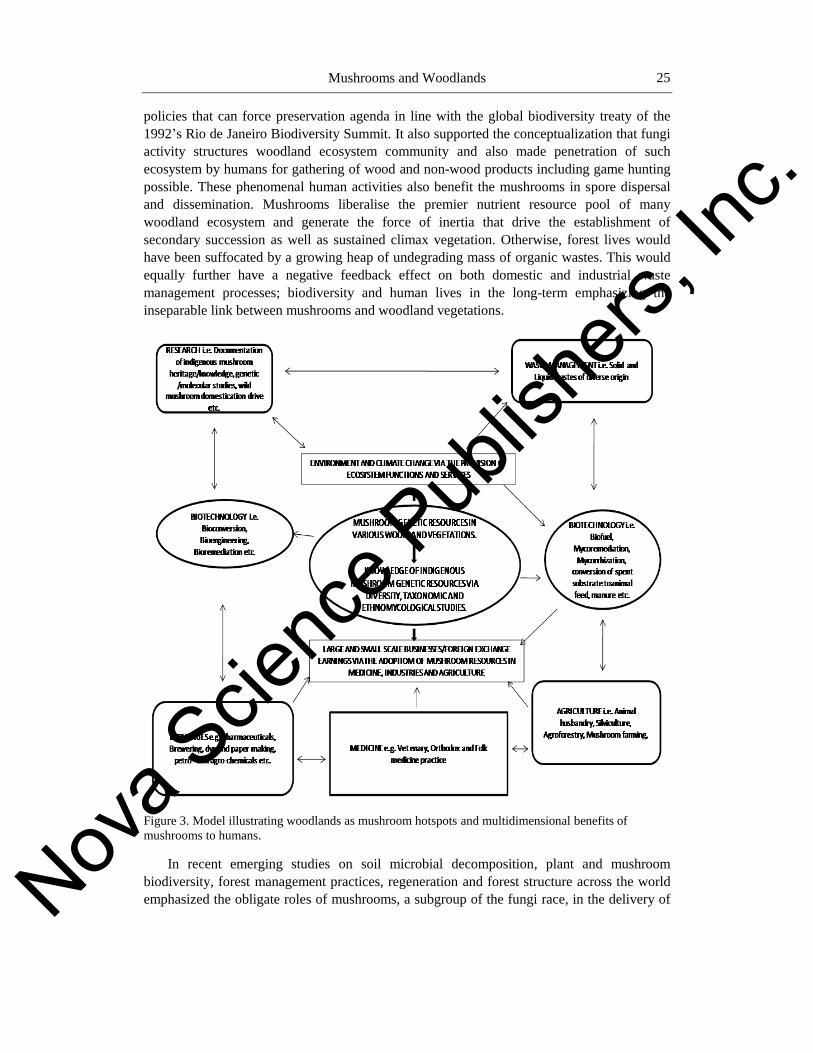
Mushrooms and Woodlands 25
policies that can force preservation agenda in line with the global biodiversity treaty of the
1992‟s Rio de Janeiro Biodiversity Summit. It also supported the conceptualization that fungi
activity structures woodland ecosystem community and also made penetration of such
ecosystem by humans for gathering of wood and non-wood products including game hunting
possible. These phenomenal human activities also benefit the mushrooms in spore dispersal
and dissemination. Mushrooms liberalise the premier nutrient resource pool of many
woodland ecosystem and generate the force of inertia that drive the establishment of
secondary succession as well as sustained climax vegetation. Otherwise, forest lives would
have been suffocated by a growing heap of undegrading mass of organic wastes. This would
equally further have a negative feedback effect on both domestic and industrial waste
management processes; biodiversity and human lives in the long-term emphasizing the
inseparable link between mushrooms and woodland vegetations.
Figure 3. Model illustrating woodlands as mushroom hotspots and multidimensional benefits of
mushrooms to humans.
In recent emerging studies on soil microbial decomposition, plant and mushroom
biodiversity, forest management practices, regeneration and forest structure across the world
emphasized the obligate roles of mushrooms, a subgroup of the fungi race, in the delivery of Nova S
cienc
e Pub
lishe
rs, In
c.

Osarekhoe Omorefosa Osemwegie, John Aroye Okhuoya and Theophilus A. Dania 26
inherent ecological goods and services that support woodland ecosystems. The
multidimensional services comprised the promotion of optimal nutrient uptake, pathogens
suppression as well as their inocula through superior competitive capacity for food and niche.
In addition, mushrooms contribute to the regulation and mineralization of nutrients by
biodegrading ecosystem wastes amongst others and natural mycofiltration processes that
remove elements from topsoils capable of potentially suppressing the healthy development of
plant vegetations. The dimension of mushrooms ecological versatility underscores their
connection to the woodland ecosystems. This study has provided insights into how tree or
plant diversity loss results in a corresponding loss of mushroom diversity.
DISCUSSION
Fungi, more especially mushrooms are proven to be crucially important in the
improvement of humans and animals through their mysterious capacity to deliver efficiently
ecosystem goods and services that improves forest health, productivity and products.
Deregulated exploitation of diverse woodlands for edible and medicinal mushrooms would
have unconsciously but logically driven some mushrooms to extinction and causes selective
evolutionary changes in others through speciation. Although, a large part of the local
populace provided a well-articulated explanation that bothers on the priority to feed families
and improve livelihood while misunderstanding the paired capacity between utilization to
quench food need or poverty and conservation (Boa et al., 2004) The negative consequences
of wild mushroom exploitation for human purposes are more popular in literatures than the
positive effects that are slower in manifesting. This is confined in the dynamism of evolution
of trees, mushrooms and detritus animals dependent on mushroom feed. The transmutation of
the naturally occurring phenomena of fungi ecosystem activities for the benefit of humans is
still evolving globally as some of the activities may yet be cryptic or artificially
irreproducible. This lends credence to the fact that the importance of fungi contrasted widely
to their extant study capacity and it is by no means a happenstance that African forests
abound with explorative opportunities in mycology with diverse species of new fungal taxa
still cryptic (Gryzenhout et al., 2012). Fungi are capable of serving as renewable raw
materials for industries dealing in mycopestides i.e. mycofungicides, mycoherbicides,
mycoinsecticides etc., paper (biopulping), dye, wasteland development, fertilizers
(mycofertilizers), animal feed (single cell protein, probiotics, additive etc), waste
management, medicine, drugs and hormones etc. but currently under explored in Africa
(Figure 3).
Human activities, especially deforestation, negatively affect the mushroom population
and community composition leading to loss of diversity, decelerated rate of biogeochemical
recycling, depleted potential habitat and ultimately climate change. Mushrooms are also
suitable bio-indicators of woodland ecosystem stress and disturbances parameters resulting
from forest management practices or a healthy forest. It is therefore pertinent to initiate a
sustainable regime of forest conservation and preservation practices especially in African that
would preserve the continent‟s vegetations and biodiversity heritage. It is also essential to
challenge researchers and ecologist in exploring cheap, more environmentally-friendly Nova S
cienc
e Pub
lishe
rs, In
c.

Mushrooms and Woodlands 27
alternatives to chemical eradication of economic parasites and/or protecting fungi from
activities that facilitate their decimation.
Suffice to say that low to zero parasite population could result in life-threatening
ecosystem consequences that may compromise the development of immunity or loss of host
suppression of pathogen activity and limit the evolution of symbiotic species. This perception
obtains from the theory that suggested that symbiotic relationships evolved from a long line
of parasitism that culminated in host-parasite equilibrium, a point where the parasite becomes
powerless in causing host infection.
CONCLUSION
Mushrooms have remained an invaluable but obtrusive part of fungi currently evolving
an identity as a scientific discipline – Mushroom Science and gaining popularity as viable
resources for the production of many novel products. The bio-prospecting, characterization
and bio-exploration of this group of fungi have suffered great neglect in many African
countries and other developing nations of the world. This may have been precipitated largely
by ignorance of the inherent potential abound in mushrooms, complete lack of adequate
capital, infrastructural and human capacities, non-availability of sponsorship sources (non-
governmental and governmental), uncertainty of profit generation and lack of preferential for
mushrooms and mycology. It is therefore important to set out measures that help moderate
and minimize woodlands encroachment by humans for recreational and non-recreational
(logging, farming, construction etc) activities. This can be achieved by introducing
conservation laws, red-tapping species at risk of extinction, popularizing domestication
initiatives and values of mushrooms to forest health and management through government
agencies, and developing through many tertiary Institutions the necessary capacity to sustain
as well as improve research with further applications of mushrooms and other fungi in
improving livelihood. Furthermore, connecting to global initiative on forest conservation and
international collaboration that is based on instrumentation, training, exchanges, funding and
resource materials (books, spawns, journals) can also promote bio-exploration of mushrooms
in some African countries.
REFERENCES
Alabi, R.O. (1991). Mycology and Nigerian culture: past, present and future. In: Proceedings
of 1st conference on African Mycology, Mauritius, June 10-15 1990. pp 43-52.
Adewusi, S.R.A., Alofe, F.U., Odeyemi, O., Afolabi, O.A and Oke, O.L. (1993). Studies on
some edible wild mushrooms from Nigeria 1: nutritional, teratogenic and toxic
considerations. Plant Foods and Human Nutrition 43:115-121.
Aerts, R. (1997). Climate, leaf litter Chemistry and leaf litter decomposition in terrestrial
ecosystems: triangular relationship. Oiko 79:439-449.
Akpaja, E.O., Isikhuemhen, S.O and Okhuoya, J.A. (2003) Ethnomycology and usage of
edible and medicinal mushrooms among the Igbo people of Nigeria. International
Journal of Medicinal Mushrooms 5:313-319. Nova S
cienc
e Pub
lishe
rs, In
c.

Osarekhoe Omorefosa Osemwegie, John Aroye Okhuoya and Theophilus A. Dania 28
Alofe, F.V., Odeyemi, O and Oke, O.L. (1996). Three edible wild mushrooms from Nigeria:
their proximate and mineral composition. Plant Foods Human Nutrition 49(1):63-73.
Anoliefo,G.O., Isikhuemhen,S.O and Ohimain,E. (2002). Phytoassessment of soil polluted
with Farcados blend crude oil exposed to a white rot fungi; Pleurotus tuberregium (Fr.)
Sing. In: Proceedings of the 2002 national conference on environmental science and
technology. Greensboror, North-Carolina, USA. September 8-10. pp43-57.
Arora, D. (1989). Ethnobotany and plant domestication: Global perspective. In: Mehods and
approaches in ethnobotany. K. S. Jain (ed.). Society of ethnobotany. Lucknow. pp 49-57.
Bates,S.T. (2006). Preliminary checklist of Arizona macrofungi. Canotia 2:47-78.
Bhandary, H.R. (1991). Some edible and medicinal mushrooms from Nepal, Network
(Newsletter of the national committee for APINMAP/S CAMAP, Nepal) 1: 1-2.
Boa, E (2011). From Chipho to Msika: An introduction to mushrooms, trees and forests, In:
Mushrooms in forests and woodlands: resource management, values and local
livelihoods, Anthony B Cunningham and Xuefei Yang (eds.) Earthscan Ltd, Washington,
DC, USA. 217 pp.
Bucher,V.V.C., Pointing,S.B., Hyde, K.D and Reddy,C.A. (2004). Production of wood decay
enzymes, loss of mass and lignin solubilization in wood by diverse tropical fresh water
fungi. Microbial Ecology 43:331-337.
Chang, S.T and Miles P. G. (1993). Mushrooms: trend in production and technological
development. UNIDO-Genetic Engineering and Biotechnological Monitor 41-42:73-84.
Chaverri, P and Vilchez, B. (2006). Hypocrealean (Hypocreales, Ascomycota) fungal
diversity in different stages of tropical succession in Costa Rica. Biotropica 38:531-543.
Clark, D.A, Brown,D.W., Kicklighter,J.Q., Chambers,J.R., Thomlinson and Ni, J. (2001).
Measuring net primary production in forests: concepts and field methods. Ecol. Appl.
11:356-370.
Couteaux, M.M., Bottner, P and Berg, B. (1995). Litter decomposition, climate and litter
quality. Tree 10:63-66.
Crous, W.P., Rong, H.I., Wood, A., Lee, S., Glen, H., Botha, W., Slippers, B., Beer, Z.W.,
Wingfield, J.M and Hawksworth, L.D (2006). How many species of Fungi are there at
the tip of Africa?. Studies in Mycology 55:13-33.
Dantas, M and Phillipson, J. (1989). Litterfall and litter nutrient content on primary and
secondary Amasonian „terra firme‟ rainforest. Journal of Tropical Ecology 5: 27-36.
Dreyfuss, M.M and Chapela, I.H. (1994). Potential of fungi in the discovery of novel, low-
molecular weight pharmaceuticals. In: The discovery of natural products with therapeutic
potential. V.P. Gullo (ed.) Butterworth-Heinemann, London. pp 49-80.
Eagle,D and Hawkins,J. (1975). The Oxford illustrated dictionary. Oxford University Press,
USA. 998 p.
Egli,S., Peter,M., Buser,C., Stahel,W and Ayer,F. (2006). Mushroom picking does not impair
future harvests-results of a long-term study in Switzerland. Biological Conservation
129:271-276.
Finotti,,R., Freita,R.S., Cerqueira,R and Vieira,M.V. (2003). A method to determine the
minimum number of litter traps in litterfall studies. Biotropica 35: 419-421.
Gao, FK, Dai,CC and Liu,XZ. (2010). Mechanisms of fungal endophytes in plant protection
against pathogens. African Journal of Microbiology Research 4(13): 1346 – 1351. Nova S
cienc
e Pub
lishe
rs, In
c.

Mushrooms and Woodlands 29
Gilbertson, R.L and Bigelow, D.M. (1998). Annotated checklist of wood rotting
Basidiomycetes of the sky Islands in Southeastern Arizona. Journal of the Arizona-
Nevada Academy of Science 31:13-36.
Gregory P.H (1984). The fungal mycelium: an historical perspective. Transactions of the
British Mycological Society 82: 1-11.
Gryzenhout,M., Jefwa,J.M and Yorou,N.S. (2012). The status of mycology in Africa: a
document to promote awareness. IMA Fiungus 3(1): 99-102.
Hammond, P.M. (1992). Species inventory. In: Global Biodiversity: status of the earth‟s
living resources B. Groombridge (ed.). Chapman and Hall, London. pp 17-39.
Harkonen, M., Saarimaki, T., Nwasumbi, L. and Niemela, T. (1993). Collection of the
Tanzanian mushroom heritage as a form of development of cooperation between the
University of Helsinki and Dares Salam. Aquilo Serie Botanica 31: 99-105.
Hawksworth, D.L. (2001). The magnitude of fungal diversity: the 1.5 million species estimate
revisited. Mycological Research 105:1422-1432.
Hawksworth, D.L (1991). The fungal dimension of biodiversity; magnitude, significance and
conservation. Mycological Research 95:641-655.
Idu, M., Osemwegie, O.O and Akinnibosun, H.A. (2006). Floristic diversity of Okomu Forest
Reserve in Nigeria. Phytotaxonomy 6:14-22.
Isikhuemhen,S.O, Anoliefo,G.O and Oghale,O. (2003). Bioremediation of crude oil polluted
soil by the white rot fungus Pleurotus tuber-regium (Fr.) Sing. Environmental Sciences
and Pollution Reseach 10:108-112.
Jain, S.K. (2000). Human aspects of plant diversity. Economic Botany 54:459-470.
Kaewchai,S, Soytong,K and Hyde,K.D. (2009). Mycofungicides and fungal biofertilizers.
Fungal Diversity 38: 25- 50.
Kauserud,H., Stige,C.L., Vik,O.J., Okland,H.R., Hoiland, K. and Stenseth,C.N. (2008).
Mushroom fruiting and climate change. Proceedings of the National Academy of Sciences
105:3811 – 3814.
Kekawa, T. (2001). Beneficial effects of mushrooms, edible and medicinal, on health care.
National Journal of Medicinal Mushroom 4:76-79.
Kirk, P.M., Cannon, P., David, J.C and Stalpers, J.A. (2001). Ainsworth and Bisby‟s
dictionary of the Fungi. 9th edition, CABI Bioscience, UK centre. 624p.
Labarere, J and Menini, U. (2000). Collection, Characterization, Conservation and utilization
of mushrooms, germplasm resources in Africa. In: The proceedings of the First
International Congress for the Characterization, Conservation, Evaluation and Utilization
of Mushroom Genetic Resources for Food and Agriculture. FAO Bordeaux/France 9-13,
March 1998.
Lelley, J. (1987). Edible mushrooms as a weapon against starvation. Mushroom Journal of
Tropics 7:135-140.
Lynch, J. D. M. and Thorn, G. R. (2006). Diversity of basidiomycetes in Michigan
Agricultural soils. Applied and Environmental Microbiology 72: 7050 – 7056.
Maguire, D.A. (1994). Branch mortality and potential litter Fall from Douglas Fir trees on
stands of Varying density. Forest Ecology Management 70:41-53.
Masuka,A.J and Ryvarden, L. (1993) Aphyllophorales (basidiomycetes) of Zimbabwe. The
African Journal of Mycology and Biotechnology 1: 24-32.
McIntosh, E. (1964). The concise oxford dictionary of current English. Clarendon Press.
Oxford. 1558 p. Nova S
cienc
e Pub
lishe
rs, In
c.
Osarekhoe Omorefosa Osemwegie, John Aroye Okhuoya and Theophilus A. Dania 30
Miles, P.G and Chang, S.T. (2004). Mushrooms: cultivation, nutritional value, medicinal
effect and environmental impact. 2nd
edition. CRC Press. 480p.
Miles, P. G and Chang, S. T. (2004). Mushrooms: cultivation, nutritional value, medicinal
effect and environmental impact. 2nd
edition. CRC Press. 480p.
Molofsky, J and Augspurger, K.C. (1992). The effect of leaf-litter on early seedling
establishment in a tropical Forest. Ecology 73: 68-77.
Manoharachary, C., Sridhar, K., Singh, R., Adholeya, A., Suryanarayanan, T.S, Rawat, S and
Johri, B.N. (2005). Fungal biodiversity: distribution, conservation and prospecting of
fungi from India. Current Science 89:58-70.
Mshigeni, E.K. (2005). Unveiling Africa‟s treasures of medicinal mushrooms: contributions
of Professor Shu-Ting Chang. International Journal of Medicinal Mushrooms 7:23-28.
Mshigeni,E.K. 2003. Africa‟s mushrooms: a neglected bioresource whose time has come.
Discovery and Innovation 15: 121-124.
Mshigeni,E.K., Chang,S.T and Gwanama,C. (2003). Surprises scientific charm,
socioeconomic potential, and possibilities in the mushroom world. Discovery and
Innovation 15: 1-2.
Mueller, M.G., Schmit, P.J., Leacock, R.P., Buyck, B., Cifuentes, J., Desjardin, E.D., Halling,
E.R., Hjortstam, K., Hurriaga, T., Larsson, H. K., Lodge, J. D., Way, W. T, Minter D.,
Rajchenberg, M., Redhead, A.S., Ryvarden, Trappe, M.J, Watling, R and Wu, Q. (2007).
Global diversity and distribution of macrofungi. Biodiversity and Conservation 16:
37 - 48.
Mudrick, D.A., Hoosein, M., Hicks, R.R., Jr and Townsend E.C (1994). Decomposition of
leaf litter in an Appalachain Forest: effects of leaf species, aspects, slope position and
time. Forest Ecology Management 68:231-250.
Myers,N., Mittermeier,G.C., Da Fonseca,B.A.G. and Kent, J. (2000). Biodiversity hotspots
for conservation priorities. Nature 403(24): 853 – 858.
O‟Dell,T.E., Lodge,D.J. and Mueller,G.M. (2004). Approaches to sampling macrofungi. In:
Biodiversity of fungi: inventory and monitoring methods. Mueller,G.M., Bills,G.F. and
Foster,M.S. (eds). Elsevier Academic Press, San Diego. pp163-168.
Ohga, S., Cho, N.S., Thurston, C.F and Wood, D.A (2000). Transciptional regulation of
Laccase and Cellulase in relation to Fruit body formation on the mycelium of Lentinula
erodes on a sawdust-based substrate Mycoscience 41:149-153.
Osemwegie,O.O., Eriyaremu, G.E and Abdulmalik, J. (2006). A survey of macrofungi in
Edo/Delta region of Nigeria, their morphology and uses. Global Journal of Pure and
Applied Sciences 12:149-157.
Oei, P. (1991). Some aspects of mushroom cultivation in developing countries Mushroom.
Science 13:777-780.
Onianwa, P.C. (1995). Petroleum hydrocarbon Pollution of urban topsoil in Ibadan City,
Nigeria. Environment International 21: 341-343.
Ochiel., G.S, Evans, H.C and Eilenberg, J. (1997). Cordycepioideus, a pathogen of Termites
in Kenya. Mycologist 11:7-9.
Okeke, B. C., Smith, J.E., Paterson, A and Watson-Craik, I.A. (1996). Influence of
environmental parameters on Pentachlorophenol biotransformation in soil by Lentinula
edodes andPhanerochaete chrysosporium. Applied Microbiology and Biotechnology 45:
263-266. Nova S
cienc
e Pub
lishe
rs, In
c.
Mushrooms and Woodlands 31
Onyibe H.J (1990). Ecology of the weed flora and litter fall in a mature rubber plantation in
Bendel State, Nigeria. Ph.D thesis. Department of Botany, University of Benin.
Osemwegie, O. O. (2008). Ecodiversity study of mushrooms in a rubber plantation and
lowland forest in Iyanomo, Benin City, Edo State. Ph.D Thesis. University of Benin,
Benin City, Edo State, Nigeria.
Quimio, T.H, Chang, S.T, Royse, D.J and Memni, U.G. (1990). Technical guidelines for
mushroom growing in the tropics. F.A.O plant production and protection paper, 106.
Food and agriculture organization of the United Nations Roma.
Proctor, J. (1983). Tropical Forest litter fall. In: British Ecological Society Rain Forest
Symposium. Sutton, S., Chadwick, A and Whitmore, T.C (eds). Blackwell Scientific
Publications, Oxford. 566 p.
Proctor, J., Anderson,M., Fogden,S.C.L and Vallack,H.W. (1983). Ecological studies in four
contrasting lowland rain forests in Gunung Mulu National Park, Sarawak II. Litterfall,
litter standing crop and preliminary observations on herbivory. Journal of Ecology 71:
261-283.
Read D.J and Perez-Moreno J. (2003). Mycorrhizas and nutrient cycling in ecosystems. A
journey towards Relevance?. New Phytologist 157:475-92.
Redhead. S.A (1997). Standardized inventory methodologies for components of British
Colombia‟s biodiversity: Microfungi Resources. Inventory Committee, Vancouver. pp
1-59.
Sala,E.O., Chapin III,S.F., Armesto,J.J., Berlow,E., Bloomfield,J., Dirzo,R.., Sanwald-
Huber,E., Huenneke,F.L., Jackson,B.R., Kinzig,A., Leemans,R., Lodge,M.D.,
Mooney,A.H., Oesterheld,M., Poff,L.N., Sykes,T.M., Walker,H.B., Walker,M. and
Wall,H.D. (2000). Global biodiversity scenerios for the year 2100. Science’s Compass
287: 1770 – 1773.
Shigeki, I., Shigeki, S and Osamu, Y. (1994). Analysis of mushroom diversity in successional
young Forests and equilibrium evergreen broad-leaved forests. Mycoscience 35:1-14.
Simmons, A.J. (2003). Litter fall: A laboratory exercise in ecology. Watershed Methods
Manual. pp1-9.
Stamets,P. (2005). Mycelium running: how mushrooms can help save the world. Ten Speed
Press, Berkeley, CA. 339 p.
Takashi, O. (2007). Ecology of ligninolytic fungi associated with leaf litter decomposition.
Ecological Research 22: 955-974.
Vega FE, Posada F, Aime MC, Pava-Ripoll M, Infante F, Rehner SA (2008).
Entomopathogenic fungal endophytes. Biol. Control, 46: 72-82.
Vitousek, P.M. (1984). Litter fall, nutrient cycling and nutrient limitation in trophical forests.
Ecology 65:285-298.
Wasser, P. S. (2007). A book review: Mycelium running: How mushrooms can help save the
world. Herbalgram 76:50-57.
Waring, R.H and Schlesinger, W. H. (1985). Forest ecosystems: concepts and management.
Academic Press, Orlando. 340p.
Weedon,J.T., Cornell,W.K., Cornelissen,J.H.C., Zanne,A.E., Wirth,C and Coomes,A. (2009).
Global meta-analysis of wood decomposition rates: a role for trait variation among tree
species? Ecology Letters 12: 45 – 56.
Wood, D.A (1984). Microbial processes in mushroom cultivation: a large scale solid substrate
fermentation. Journal of Chemical Technology and Biotechnology 34B: 232-240. Nova S
cienc
e Pub
lishe
rs, In
c.

Osarekhoe Omorefosa Osemwegie, John Aroye Okhuoya and Theophilus A. Dania 32
Zadrazil., F. (1980). Conversion of different plant wastes into feed by Basidiomycetes.
European Journal of Applied Microbiology and Biotechnology 9: 243-248.
Nova S
cienc
e Pub
lishe
rs, In
c.
In: Plantations ISBN: 978-1-60876-576-8
Editor: Ren Hai © 2013 Nova Science Publishers, Inc.
Chapter 3
THE USE OF FOREST PLANTATIONS IN THE SEMIARID
SAHEL REGIONS: IMPACTS ON THE ABUNDANCE AND
DIVERSITY OF SOIL LEGUME-NODULATING
RHIZOBIA AND ARBUSCULAR MYCORRHIZAL
FUNGAL COMMUNITIES
Godar Sene1,2
, Mansour Thiao1,3
, Anicet Manga4,
Seynabou Sene1,3
, Damase Khasa5, Aboubacry Kane
1,3,
Mame Samba Mbaye3, Ramatoulaye Samba-Mbaye
1,3
and Samba Ndao Sylla1,3
1Laboratoire Commun de Microbiologie LCM IRD/ISRA/UCAD, Dakar-Sénégal
2Institut Sénégalais de Recherches Agricoles,
Bel-Air Dakar-Sénégal 3Département de Biologie Végétale, Faculté des sciences et Techniques,
Université Cheikh Anta Diop, Dakar-Fann, Sénégal. 4UFR S2ATA, Section Production Végétale et Agronomie,
Université Gaston Berger, Saint Louis-Sénégal 5Centre d‟Étude de la Forêt, Chaire de Recherche du Canada
en Génomique Forestière et Environnementale et Institut de Biologie
Intégrative et des Systèmes, Université Laval, Québec, Québec, Canada
ABSTRACT
Several fast-growing and multipurpose tree species such as exotic and valuable
native species have been widely used in West Africa. These man-made forest plantations
usually focused upon the trees and are defined mainly in relation to their capacity to
produce timber and prevent catastrophic events such as damage by wind. In recent years,
Corresponding author: E-mail: [email protected]/[email protected] Tel.: (+221) 77 515 82 63; Fax:
(+221) 33 849 33 02. Nova S
cienc
e Pub
lishe
rs, In
c.

Godar Sene, Mansour Thiao, Anicet Manga et al. 34
however, there has been a growing awareness amongst plant ecologists and soil microbial
ecologists that understanding the connectivity between their study organisms is of utmost
importance. The interactions between plants and soil microorganisms are particularly
important because plants represent the main pathway through which carbon, the element
that severely limits microbial growth, enters into soil. From a reciprocal viewpoint,
microbial associations have been pointed as an important strategy to guarantee plant
survival under semiarid conditions. However, there are several recent studies that have
been carried out on the devastating ecological impact resulting from anthropogenic
dispersal of exotic plants. They suggest that exotic tree and shrub plantations could
interact with soil microbial communities and disrupt mutualistic associations between the
existing ecological associations within native communities, leading to soil fertility
depletion.
Given the growing body of empirical evidence of the importance of these perennial
plants, it is becoming increasingly important to understand the impacts of such dispersal
of man-made forestry on soil biological properties. In this chapter, we will expose and
discuss some of the relevant research work that has been implemented in Sub-saharian
ecosystems with special emphasis on studies that have dealt with tree plantation impacts
on soil microbial communities. Particularly, we discussed here the influences of 28-
years-old tree plantations of tropical, subtropical, and exotic tree species on the soil
legume-nodulating rhizobia and arbuscular mycorrhizal fungal communities.
Keywords: Degradation of Sahelian Ecosystems; Reforestation Systems; Ecological Impacts;
Soil Fertility; Rhizobia; Mycorrhizae
1. INTRODUCTION
Degradation of forest lands due to agricultural expansion, overgrazing, fire, and tree
cutting is a serious environmental concern in many Sahelian countries (Donfack et al., 1995;
Diouf et al., 2002; Tappan et al., 2004; Bai et al., 2008; Vincke et al., 2010). This leads to
losses of biodiversity, a decline in soil fertility, and a deterioration of soil physical and
biological properties (Tiffen and Mortimor, 2002; Mungai et al., 2005; Guadarrama et al.,
2008; Curlevski et al., 2010; Stürmer and Siqueira, 2011). In such a degraded land, the
regeneration with tree forestry upstream is threatened, suggesting urgent needs of ecological
rehabilitation through which soil quality could be improved to support biological
productivity. There is an increasing evidence that forest plantations can play a key role in
ecosystem rehabilitation or restoration (Donfack et al., 1995; Fortin et al., 2008; Vincke et al.,
2010), and many studies have supported that the presence of the tree species provide a
number of ecological advantages through increased soil organic matter content, biodiversity
conservation, and improved soil microbial activity, and nutrient cycling rates (Peichl et al.,
2006; Hobbie et al., 2006, 2007; Rivest et al., 2009). Hence diverse exotic and indigenous
tree species, economically important, with edible and highly nutritional crops for both human
and animal consumption have been widely used in the West African area (Ingleby et al.,
1997; Diagne et al., 2001; Douf et al., 2002; Duponnois et al., 2005). However, the models
and ideas guiding these applied fields have mostly come from sources other than restoration
ecology and conservation of soil biology (Kisa et al., 2007; Faye et al., 2009; Bilgo et al.,
2012). Nova S
cienc
e Pub
lishe
rs, In
c.

The Use of Forest Plantations in the Semiarid Sahel Regions 35
Man-made forest plantations in these areas usually focused upon the tree species, and are
defined mainly in relation to their capacity to produce timber and prevent catastrophic events
such as damage by wind (Diouf et al., 2002). Such concepts of management practices, which
did not consider the other resources existing in the ecosystem, lack an ecological basis (Fortin
et al., 2008). It has been demonstrated that aboveground and belowground communities are
intimately linked (Bever et al., 1997; van der Heijden et al., 1998, 2006, 2008) and these
linkages greatly affect ecosystem properties (Xingjun et al., 2005; Sanon et al., 2009). The
changes in plant communities will therefore exert a great impact on the belowground
microbial communities (Sene et al., 2012a, 2012b, 2013). However, available data on the
impact of vegetation changes (tree plantations) on the soil microbial communities are rather
scattered, and there are still many gaps in our knowledge. The subject has been ably studied
by Akpo et al. (2003), who draw attention to the role of the tree plantations on the
belowground flora and soil chemical conditions. Soil microbes play key roles in ecosystems
and mediate many ecological processes that are central to ecosystem functioning, including
nutrient acquisition (Dommergues et al., 1999; Sene et al., 2010), nitrogen cycling (Fortin et
al., 2008), carbon cycling (van der Heijden et al., 2008), soil formation (Rillig and Mummey,
2006), decomposition processes (Peichl et al., 2006; Hobbie et al., 2006, 2007), and the
regulation and maintenance of plant biodiversity (van der Heijden et al., 1998, 2008). Further,
biotic and environmental factors drive the activity, structure, and diversity of soil microbial
communities, which are controlled by many factors including plant species (van der Heijden
et al., 1998, 2008). In this chapter, we will expose and discuss some of the relevant research
work that has been implemented in Sahelian ecosystems with special emphasis on studies that
have dealt with tree plantation impacts on soil microbial communities. Particularly discussed
are the influences of exotic and indigenous tree species on the soil symbiotic microorganisms
(legume-nodulating rhizobia and arbuscular mycorrhizal fungal communities).
2. SOIL MICROBIAL COMMUNITIES:
BIOLOGICAL MEANS OF IMPROVING NUTRIENT
UPTAKE IN TREES
Soil and water are the basic natural resources essential for ecosystem functioning and soil
is a non renewable source upon which the mankind depends for his survival. From a
biological perspective, soil constitutes a diverse ecosystem in which plant roots and
microorganisms coexist and interact for nutrient uptakes (Dommergues et al., 1999; Smith
and Read, 1997, 2008). Microbial communities in the soil are composed of bacteria,
actinomycetes, fungi, protozoa, and nematodes. Plants interact with guilds of these beneficial
microorganisms like N2-fixing bacteria (Kahindi et al., 1997; Dommergues et al., 1999) and
mycorrhizal fungi (Smith and Read, 1997, 2008), stimulating their productivity by supplying
limiting nutrients (Bala and Giller, 2006; van der Heijden et al., 2008; Schnitzer et al., 2011).
Among the plant-microbe interactions, the legume-rhizobia symbiosis that converts
nitrogen gas (N2) into ammonia is perhaps the best studied (Kahindi et al., 1997). The fixation
of N2 makes up to approximately 80 % (by volume) of the air that we breathe (Dommergues
et al., 1999). The nitrogen gas cannot be used directly by plants or animals to synthesize
essential biological nitrogen-containing compounds such as amino acids and nucleotides Nova S
cienc
e Pub
lishe
rs, In
c.
Godar Sene, Mansour Thiao, Anicet Manga et al. 36
(Kahindi et al., 1997; Dommergues et al., 1999). First, it has to be converted into ammonia
and, among the wide range of bacteria that could fix N2, legume-nodulating rhizobia (LNR)
are of the most important for their potential in maintaining soil fertility (Graham, 2008; Noel,
2009; Lindström et al., 2010).
Mycorrhizal fungi are soil-dwelling microorganisms that form mutualistic relationships
with over 80% of all vascular plants and affect plant fitness and competitive interactions
(Johnson et al., 1997). They are commonly known not only to assist host plants with
phosphorus uptake (Smith and Read, 2008), but may also to provide other benefits including
protection from pathogens (Cardoso and Kuyper, 2006), assisting with the uptake of water
and other nutrients such as nitrogen and copper (Smith and Read, 2008; Sene et al., 2010).
Hyphae of arbuscular mycorrhizal fungi (AMF) also play a role in the formation and
structural stability of soil aggregates (Rillig and Mummey, 2006), and contribute to the
composition of plant community structures (van der Heijden et al., 2006). In return, LNR and
AMF receive photosynthetic products from the host plant (Dommergues et al., 1999; Smith
and Read, 2008). Various studies suggested that a specific interaction that influences both the
nodulation and mycorrhizal colonization processes occurs between the LNR and AMF in
legumes (Kahindi et al., 1997; Duponnois et al., 2005; van der Heijden et al., 2008; Sene et
al., 2010). It is well documented that growth and productivity of the legumes were dependent
on the combination of LNR and AMF, revealing that positive interactions between
compatible symbionts could significantly increase growth and productivity. Container
experiments with peanuts (Arachis hypogaea L.) demonstrated that under open air
environmental conditions, biomass production and pod yield in dual inoculated plants with
bradyrhizobia and mycorrhiza is generally greater than in non-inoculated plants, and more
nodules were formed (Sene et al., 2010). Numerous other papers have also reported that both
the nitrogen-fixing bacteria and the mycorrhizal fungi play important roles in nutrient
relationships in natural forest stands (van der Heijden et al., 1998, 2006, 2008; Fortin et al.,
2008; Noel, 2009) and undoubtedly they will play significant roles in man-made forest
systems. The LNR as well as the AMF are thought to play an important role in the
establishment and succession of plant communities (Cardoso and Kuyper, 2006; van der
Heijden et al., 1998, 2008; Oehl et al., 2010; Schnitzer et al., 2011). The natural indigenous
population of these soil symbiotic microorganisms, if available, could therefore facilitate
ecosystem resilience when faced with environmental disturbances. However, benefits of the
tree plant-microbe symbiosis, whether the food, fodder, soil fertility, or forestry, will depend
on the management of natural biodiversity of both the plant host and the symbiotic
microorganisms present in the soils. Only when we better understand the factors regulating
this biodiversity we will be able to conserve it for the future and exploit it fully in Sahelian
ecosystems. In this chapter, we outline the ecological role of man-made forestry on the soil
symbiotic microorganisms in the semi-arid Sahel region.
Nova S
cienc
e Pub
lishe
rs, In
c.
The Use of Forest Plantations in the Semiarid Sahel Regions 37
3. INFLUENCE OF THE MAN-MADE TREE SPECIES
ON THE INDIGENOUS MICROBIAL COMMUNITIES
The main prerequisites for choosing plant material is to select species which are adapted
to the biotic (pests) and abiotic (climate, soil) environment of the specific site (Larsen, 1995;
Diouf et al., 2002). Local species and populations usually ensure a certain degree of
adaptedness, since the population genetic structure reflects the fluctuations in local
environmental forcing functions (Forrester et al., 2006; Lemma et al., 2007). A recent study
by Ndoye et al. (2012) in two contrasting rainfall sites of Senegal has indicated positive
effects of Acacia senegal trees on soil mycorrhizal potential and enzyme activities. In
contrast, there are some examples which have demonstrated the dangers of using unadapted
plant species (Xingjun et al., 2005; Silva et al., 2007; Jordan et al., 2008; Mascaro et al.,
2008). To date, relatively few studies have investigated in this aspect in the semi-arid Sahel
region, and they were only focused on exotic plant species. The main conclusions drawn from
these studies were that the exotic tree species being propagated in this area apparently have a
major influence on the soil belowground microbial communities and soil physic-chemicals
(Kisa et al., 2007; Remigi et al., 2008; Faye et al., 2009). For instance, in a study in Senegal
at Ngane, Remigi et al. (2008) showed that Acacia holosericea, an exotic tree species,
induced strong modifications in soil microbial functionalities (assessed by measuring the
patterns of in situ catabolic potential of microbial communities) and reduced soil resistance in
response to increasing stress or disturbance (salinity, temperature, and freeze-thaw and wet-
dry cycles). The authors also indicated that A. holosericea strongly modified the structure of
AMF communities. Such a trend of ecological effects of exotic tree plant introduction was
further confirmed in a study by Bilgo et al. (2012), showing strong modifications in soil
microbial functions. A recent study from Faye et al. (2009) also highlighted that A.
holosericea plant species could modify the structure of Bradyrhizobium populations and their
effectiveness on Faidherbia albida (Del.) a. Chev. (a native endemic Sahelian Acacia
species) growth. It is worth noting that such a modification could contribute limiting the
natural regeneration of F. albida. Indeed, it has been previously reported that some legume
species require LNR to successfully coexist with other plants in natural and also man-made
communities (van der Heijden et al., 2006, 2008). Therefore, disturbance of native LNR
communities could alter plant competitive interactions, more particularly, decrease the
capacity of legumes to out-compete other plants (Faye et al., 2009).
A study in Burkina Faso at Gampela by Kisa et al. (2007) has also reported that the exotic
tree species Eucalyptus camaldulensis significantly modified the soil bacterial community.
The authors showed that both community structure (assessed by denaturing gradient gel
electrophoresis profiles) and function (assessed by substrate-induced respiration responses
including soil catabolic evenness) were significantly affected after 12 months of culture. They
additionally showed that the changes in the bacterial structure and function were accompanied
by disturbances in the composition of herbaceous plant species layer.
Nova S
cienc
e Pub
lishe
rs, In
c.
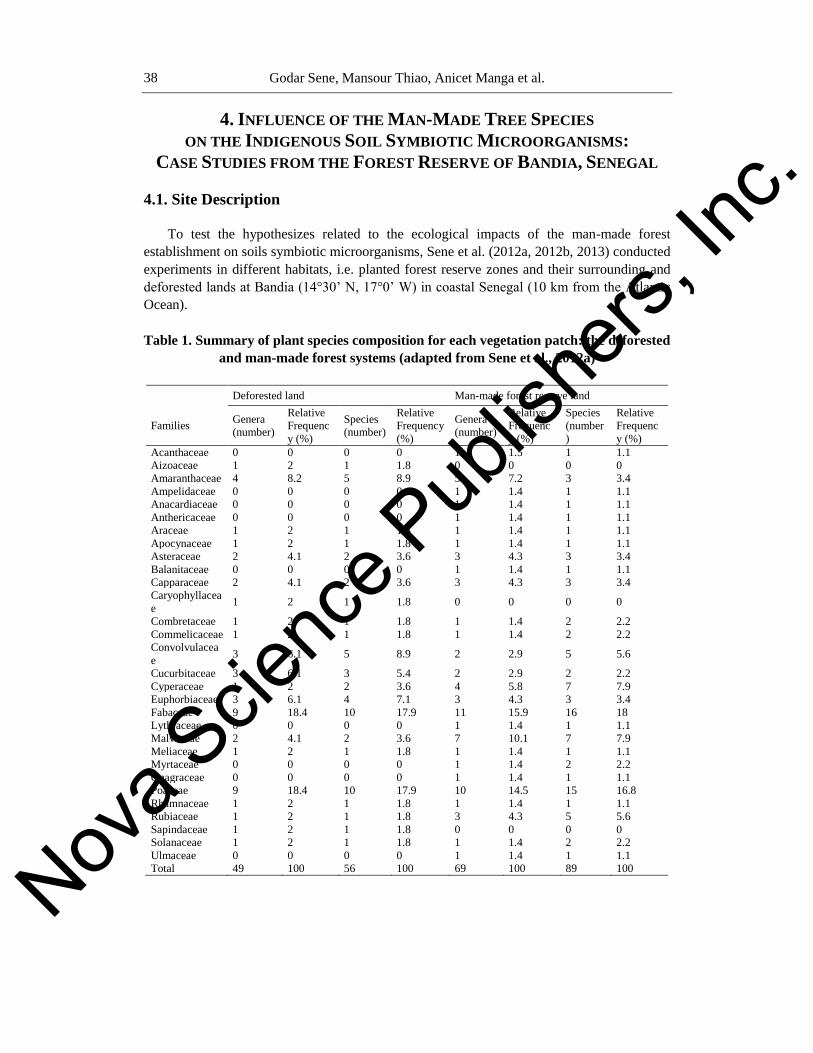
Godar Sene, Mansour Thiao, Anicet Manga et al. 38
4. INFLUENCE OF THE MAN-MADE TREE SPECIES
ON THE INDIGENOUS SOIL SYMBIOTIC MICROORGANISMS:
CASE STUDIES FROM THE FOREST RESERVE OF BANDIA, SENEGAL
4.1. Site Description
To test the hypothesizes related to the ecological impacts of the man-made forest
establishment on soils symbiotic microorganisms, Sene et al. (2012a, 2012b, 2013) conducted
experiments in different habitats, i.e. planted forest reserve zones and their surrounding and
deforested lands at Bandia (14þ30‟ N, 17þ0‟ W) in coastal Senegal (10 km from the Atlantic
Ocean).
Table 1. Summary of plant species composition for each vegetation patch: the deforested
and man-made forest systems (adapted from Sene et al., 2012a)
Deforested land Man-made forest reserve land
Families Genera
(number)
Relative
Frequenc
y (%)
Species
(number)
Relative
Frequency
(%)
Genera
(number)
Relative
Frequenc
y (%)
Species
(number
)
Relative
Frequenc
y (%)
Acanthaceae 0 0 0 0 1 1.5 1 1.1
Aizoaceae 1 2 1 1.8 0 0 0 0
Amaranthaceae 4 8.2 5 8.9 5 7.2 3 3.4
Ampelidaceae 0 0 0 0 1 1.4 1 1.1
Anacardiaceae 0 0 0 0 1 1.4 1 1.1
Anthericaceae 0 0 0 0 1 1.4 1 1.1
Araceae 1 2 1 1.8 1 1.4 1 1.1
Apocynaceae 1 2 1 1.8 1 1.4 1 1.1
Asteraceae 2 4.1 2 3.6 3 4.3 3 3.4
Balanitaceae 0 0 0 0 1 1.4 1 1.1
Capparaceae 2 4.1 2 3.6 3 4.3 3 3.4
Caryophyllacea
e 1 2 1 1.8 0 0 0 0
Combretaceae 1 2 1 1.8 1 1.4 2 2.2
Commelicaceae 1 2 1 1.8 1 1.4 2 2.2
Convolvulacea
e 3 6.1 5 8.9 2 2.9 5 5.6
Cucurbitaceae 3 6.1 3 5.4 2 2.9 2 2.2
Cyperaceae 1 2 2 3.6 4 5.8 7 7.9
Euphorbiaceae 3 6.1 4 7.1 3 4.3 3 3.4
Fabaceae 9 18.4 10 17.9 11 15.9 16 18
Lythraceae 0 0 0 0 1 1.4 1 1.1
Malvaceae 2 4.1 2 3.6 7 10.1 7 7.9
Meliaceae 1 2 1 1.8 1 1.4 1 1.1
Myrtaceae 0 0 0 0 1 1.4 2 2.2
Onagraceae 0 0 0 0 1 1.4 1 1.1
Poaceae 9 18.4 10 17.9 10 14.5 15 16.8
Rhamnaceae 1 2 1 1.8 1 1.4 1 1.1
Rubiaceae 1 2 1 1.8 3 4.3 5 5.6
Sapindaceae 1 2 1 1.8 0 0 0 0
Solanaceae 1 2 1 1.8 1 1.4 2 2.2
Ulmaceae 0 0 0 0 1 1.4 1 1.1
Total 49 100 56 100 69 100 89 100
Nova S
cienc
e Pub
lishe
rs, In
c.
The Use of Forest Plantations in the Semiarid Sahel Regions 39
The climate is typical of semiarid lands of West Africa with mean temperature ranging
from 25þC to 35þC, and an annual rainfall ranging from 400 to 700 mm, occurring mostly
during a single short rainy season lasting for 2-3 months. Mineral compositions of the soils
overly solid sand-clay base materials (Sene et al., 2012a). An inventory of plant species was
carried out, and the summary of plant compositions for each vegetation patch is presented in
Table 1.
Briefly, the man-made forest land is a composed of 89 plant species including 15
dominant arboreal plant species, 2 shrub species, and 72 herbaceous plant species. Trees are
planted in monospecific stands of about 28 years and comprised 9 indigenous species: A.
nilotica (L.) Willd. ex Del., A. senegal (L.) Willd., A. seyal Del., A. tortilis (Forsk.) Hayne,
Celtis integrifolia Lam., Grewia bicolor Roth, Sclerocarya birea Hochst., Sterculia setigera
Del., and Zizyphus mauritiana Lam.; and 7 exotic species: Azadirachta indica A. Juss., E.
camaldulensis Dehnh., E. microtheca F. Muell., Cassia siamea Lam., Gliricidia sepium
(Jacq.) Kunth, Hardwikia binata Roxb., and Prosopis juliflora (Sw.) DC. These species are
commonly planted throughout the Sahel and were growing on the same soil type as at Bandia.
They were established in 1980 with a spacing of 4.5 x 4.5 m. The shrub plant community is
dominated by Bossia senegalensis. The common herbaceous plants at the time of sampling
were: Mitracarpus villosus Cham. and Schltdl., Acalypha crenata Hochst. ex A Rich.,
Achyranthes aspera L., Cucumis melo L., Rhynchosia minima (L.) DC., Stylochyton
hypogaeus Lepr., Commelina benghalensis L., and A. aspera; M. villosus have the more
important patches beneath the tree plantations.
In the deforested land, all woody plants were harvested about 30 years ago, resulting in
the disturbed land vegetation cover being dominated by shrubs and annual plant species. This
land is composed of 56 species including A. seyal and A. nilotica trees, which are isolated in
individuals, Combretaceae shrubs and annual plant species. The most dominant herbaceous
species at the period of sampling were: Cassia obtusifolia L., Brachiaria racemosa (L.) Stapf,
Mitracarpus villosus Cham. and Schltdl., Digitaria ciliaris (Retz.) Koeler, Cyperus rotundus
L., Fimbristylis exilis Roem. and Schult., Enteropogon prieurii (Kunth) Cl., and Cyperus
esculentus L.; Cassia obtusifolia has the more important patch.
4.2. Influence of the Man-Made Tree Species on the Indigenous LNR
Populations
Many studies have supported that tree plants provide a number of ecological advantages
through increasing soil organic matter content, biodiversity conservation, and improving soil
microbial activity and nutrient cycling rates (Munguai et al., 2005; Forrester et al., 2006;
Peichl et al., 2006; Hobbie et al., 2006, 2007). Studies conducted at the Bandia ecosystem by
Sene et al. (2012a, 2013) have shown that significant variability exists in the LNR
populations estimated in different exotic and native tree plantations established in this area.
The authors showed close positive correlations between the sizes of LNR populations
estimated both in the dry and rainy seasons and the presence of legume tree hosts (Sene et al.,
2013). More importantly, they indicated significant increases in Rhizobium spp. (fast growers
LNR) population densities in response to planting with Sahelian acacia species, and a high
number of genotypes were fitted to these tree plantations, which undoubtedly suggest that
enrichment of soil Rhizobium spp. populations is host-specific. Nova S
cienc
e Pub
lishe
rs, In
c.
Godar Sene, Mansour Thiao, Anicet Manga et al. 40
This result is consistent with the known influence of host legume-nodulating species on
soil LNR. In fact, it is recognized that Sahelian acacia species may be nodulated by strains of
Rhizobium spp. and/or by strains of Bradyrhizobium spp. (slow growers LNR) (Dreyfus et al.,
1988; Bala and Giller, 2006; Diouf et al., 2007). More interestingly, they develop extensive
root systems near the soil surface (Gueye M. pers. com.), and usually have a large number of
natural nodules during the rainy period (Diouf D. pers. com.). This could naturally facilitate
the LNR multiplication and diversification through rhizosphere effects and senescence of
nodules as well as provision of organic nitrogen, which could interact with soil organic
carbon to enhance soil structural stability (Andrade et al., 2002; Wolde-Meskel et al., 2005;
Mwenda et al., 2011). This recalls a study by Lawson et al. (1987), showing large differences
in Rhizobium leguminosarum bv. trifolii population, which was caused by the presence of
homologous legume hosts.
By contrast, Sene et al. (2012a) have further indicated that infrequent or delayed
nodulation still occurred in their different trap experiments for soil samples from the
deforested lands. This suggests that a low number of LNR reside in these soils (Sene et al.,
2012a), and this is particularly worrisome for the LNR belonging to the fast grower groups
(Rhizobium spp.). Moreover, the authors have indicated that the 16S rRNA sequences
analyses have shown reduced diversity of sub-clusters. This pattern could be simply attributed
to the scarcity of the tree plants, and the less diverse tree species available in this land use.
Because of the limited energy and nutrient sources, only the LNR that could thrive with the
few available tree plants could be present, and at low numbers. The authors also showed a
low number of LNR populations in plantations where the tree plant does not form symbiotic
association with the LNR (Sene et al., 2013), possibly attributable to the lack of homologous
hosts, and/or a lower level of saprotrophic adaptation to the environmental conditions beneath
these tree plantations. Compared with these studies, the legume-related effects as early
observed by Woomer et al. (1988), and recently confirmed by Faye et al. (2009), appear to be
an important way to maintain high levels of LNR populations.
The Linkages between Plant Species Composition and Soil Microorganisms:
What about LNR within Man-Made Tree Plantations?
Because of the direct ecological linkages existing between plant species composition and
soil symbiotic microorganisms (Bever et al., 1997; van der Heijden et al., 1998; 2006), most
experiments suggest that disturbance or change in the environment that affect aboveground
plants will also affect the soil microsymbionts (Woomer et al., 1988; Kisa et al., 2007; Silva
et al., 2007; Remigi et al., 2008; Faye et al., 2009; Bilgo et al., 2012). However, in the case of
the LNR as affected by man-made forestry, details of the results may depend on both the
composition of natural LNR population and symbiotic characteristics of the present host
legumes as reported by Sene et al. (2013). These authors have first revealed that the
development of herbaceous vegetation was drastically inhibited in plantations of G. sepium
and P. juliflora exotic species (Table 2), possibly attributable to allopathic and/or competition
effects. As it appears to be mainly the case for the AMF (Kisa et al., 2007; Silva et al., 2007;
Sene et al., 2012b), the observation mentioned for the herb vegetation compositions apply to
the LNR as well (Bever et al., 1997; van der Heijden et al., 2006, 2008). However, Sene et al.
(2013) have indicated a high genetic diversity of LNR for P. juliflora tree plantation, which
did not support the hypothesis that above- and below-ground diversity could be causally
related. Nova S
cienc
e Pub
lishe
rs, In
c.

The Use of Forest Plantations in the Semiarid Sahel Regions 41
Since they have further shown with the cross-nodulation tests that a large spectrum exists
for P. juliflora tree species, this indicates an extant diversity of compatible LNR across the
study area.
The authors have also shown a large spectrum for nodulation for A. seyal tree species and
accordingly, this tree plantation harbored a high genetic diversity of soil LNR. A. seyal tree
species is native to a broad belt across Africa between the Sahelian and moist forest zones,
from Senegal in the west, to Sudan and Kenya in the east, suggesting adaptation to the LNR
from this area. Likewise, the exotic P. juliflora was first introduced in Senegal, Africa, in
1822 (Diouf et al., 2002).
Table 2. Richness of shrub and herb species, diversity indexes [richness (R), diversity
(H’ ) and evenness (1-D)] of the IGS-RFLP genotypes, and of the spore morphotypes
recorded in each tree plantation (adapted from Sene et al., 2012b, 2013)
Tree species
Vegetation Diversity index of LNR Spore diversity
Richness of
shrub species
Richness of
herb species R H’ 1-D R H’ 1 – D
Indigenous
A. nilotica 4 20 7 1.531 0.899 3 0.611 0.430
A. seyal 4 17 15 2.963 0.962 3 0.530 0.405
A. senegal 3 24 10 1.957 0.923 3 0.603 0.428
A. tortilis 5 14 9 1.643 0.913 2 0.491 0.313
C. integrifolia 4 37 5 1.228 0.754 4 1.04 0.799
G. bicolor 3 19 3 0.747 0.585 2 0.488 0.307
S. birrea 2 19 6 1.219 0.893 4 0.663 0.503
S. setigera 3 17 6 1.283 0.831 4 0.709 0.580
Z. mauritiana 4 27 3 0.786 0.532 2 0.489 0.352
Exotic
A. indica 2 15 2 0.455 0.336 4 0.880 0.575
E. camaldulensis 2 12 5 1.095 0.787 3 0.679 0.442
E. microtheca 4 29 6 1.382 0.893 2 0.386 0.228
C. siamea 4 15 6 1.252 0.849 2 0.410 0.324
G. sepium 3 8 3 0.841 0.548 3 0.359 0.264
H. binata 4 14 4 0.987 0.723 4 0.747 0.506
P. juliflora 3 8 9 1.943 0.911 3 0.669 0.441
R Margalef (richness), H’ Shannon (diversity), 1-D Pielou (evenness) indexes.
According to the authors, this old introduction may contribute to evolutionary adaptations
between P. juliflora and native LNR strains, favouring symbiotic relationships that could
explain the occurrence of compatible LNR with Prosopis species, highlighting the high
genetic diversity of LNR recorded in P. juliflora plantations. It has been reported, however,
that relative permissiveness of exotic plant species to the diversity of LNR may not guarantee
infectiveness and effectiveness in N2-fixation (Faye et al., 2009). Thus, further work is
needed to understand the functional significance of the genetic diversity pattern in P. juliflora
plantations and its impact on soil quality and vegetation structure.
In contrast, Sene et al. (2013) have indicated a restricted host range for the newly
introduced G. sepium species, suggesting that this exotic legume species may have low
compatibility with the native LNR. Moreover, the authors showed that G. sepium tree
plantation harbored less genetic diversity of LNR. There is a large body of investigations Nova S
cienc
e Pub
lishe
rs, In
c.
Godar Sene, Mansour Thiao, Anicet Manga et al. 42
which has supported the idea that the introduction of a leguminous tree plant is capable of
promoting the selection of particular LNR genotypes (Xingjun et al., 2005; Faye et al., 2009),
by penalizing those fail to fix N2 (Kiers et al., 2003) and thus, reducing the diversity of soil
LNR. However, in the case of the G. sepium plantation, Sene et al. (2013) have indicated that
both the size and genetic diversity of soil LNR are still low; and this suggests that other
factors to which the LNR populations are most sensitive could also be considered. One can
therefore suspect release of toxins from the tree root exudation and/or leaf litters
decomposition, which usually occur in the ecotone of exotic plant species (Kisa et al., 2007;
Remigi et al., 2008; Faye et al., 2009; Sanon et al., 2009). These compounds, when
accumulated into soil, could not only decrease the belowground herb vegetation, but also act
as allelochemicals on LNR growth and survival.
4.3. Influence of the Man-Made Tree Species on the Diversity of Indigenous
Mycorrhizal Fungi
Propagules of AMF in the soil normally take the form of spores, root fragments or hyphal
networks and are sensitive to slight soil modifications by any degrading agent (Smith and
Read, 1997; Sanon et al., 2009; Oehl et al., 2010). Since it has been recognized that land
degradation can decrease AMF taxa richness (Duponnois et al., 2001), it could be expected to
observe smaller numbers of AMF taxa in a deforested land in comparison with a reforested
zone.
However, Sene et al. (2012b) have reported that the deforested land ecosystem at Bandia
has preserved higher mean spore richness compared to that associated with the man-made
forest systems.
More importantly, the larger-spored AMF (Scutellospora and Gigaspora) were lacking in
soils sampled beneath the man-made tree plantations. The displacement of these larger-spored
AMF species was further associated with a concomitant proliferation of small-spored
(Glomus) species, indicating clearly that the community structure of soil mycorrhizal fungi
was affected (Sene et al., 2012a, 2012b).
AMF specialists and generalists have been identified before (Oehl et al., 2010), and the
data from Sene et al. (2012a, 2012b) also suggest that this group of fungi differs in niche
breadth. Therefore, one can hypothesize that factors such as the environmental conditions
created by the management options could be responsible to the distribution pattern of AMF
rather than the plant species themselves.
In fact, while most experiments suggest that the tree presence induces an increase in soil
microbial community (Ingleby et al., 1997; Diagne et al., 2001; Mwenda et al., 2011) details
of the results may depend on how the plant species are managed and, if environmental
conditions are not conductive, certain plants can favor the development of particular AMF
taxa (Alguacil et al., 2010). Further stating such effects of vegetation changes on AMF
communities are studies from Zhang et al. (2004), Guadarrama et al. (2008), and Stürmer and
Siqueira (2011).
On the other hand, the differences in the community composition of the AMF may be due
to soil properties, such as soil P and N contents, that greatly differed between the two land
systems (Sene et al., 2012a). Nova S
cienc
e Pub
lishe
rs, In
c.

The Use of Forest Plantations in the Semiarid Sahel Regions 43
According to the authors, the higher levels in some soil chemical components they
observed in the reforested plots may have a negative impact on the AMF species diversity
independently of host plants. This statement recalls earlier reports from Johnson et al. (1991),
and from Johnson (1993), and recent works by Egerton-Warburton and Allen (2000), and by
Alguacil et al. (2010). These authors have reported shifts in AMF communities along
gradients of N deposition, soil organic C, or N and P additions. In addition, it has been shown
by Oehl et al. (2010) that C and N contents were important factors partitioning niche space
within the AMF genera.
4.4. Influence of the Man-Made Tree Species on the Mycorrhizal Inoculum
Potential (MIP) of Soils
As AMF are believed to be obligatory symbionts, changes in a vegetation cover should
be expected to influence the activity and viability of their propagules (Zhang et al., 2004), and
this can lead to a significant increase or reduce of the quantity of viable mycelium for
colonizing and infecting plant roots (van der Heijden et al., 2006). At first sight, data from
Sene et al. (2012b) indicated that most plants found in their field study areas could support
the AMF symbiosis (Table 3), which is why AMF propagules were ubiquitous in all soil
samples. Nevertheless, the authors showed that the soil MIP decreased in soil samples from
the man-made forest systems though there is increase of tree plant covers. This result was not
in agreement with the traditional view that MIP was greater around the tree plants (Duponnois
et al., 2001), but it conforms with a number of recent studies reporting increased MIP after
deforestation (Zhang et al., 2004; Guadarrama et al., 2008), or in different land use areas
including mature forest and sites converted to pasture (Stürmer and Siqueira, 2011).
According to the authors, the most striking difference between the deforested and man-made
forest systems was that the former had fewer trees (mainly remnant to the ancient woodland
that once blanketed the area), and less different tree species than those in the latter (Sene et
al., 2012a). In such a degraded land pattern, once the tree vegetation was removed, carbon
and nutrient cycles can be disrupted and soils exposed to intensive radiation. Nevertheless,
the authors have indicated that the deforested land supports dense herbaceous vegetation
comprised of plant species highly mycotrophic dominated by Cassia obtusifolia, that have
certainly evolved distinct mechanisms such as mycorrhizal symbiosis for nutrient cycling and
uptake. AMF usually have a positive influence on their host plants when soil resources are
limiting, allowing the most efficient plant-AMF combination to eventually dominate and cope
with stressful conditions (van der Heijden et al., 1998). If this was the case, the herb
vegetation compositions may have, in turn, maintained high numbers of AMF propagules in
the soil. These annual herbaceous plants are known to be very efficient in AMF propagules
multiplication in the soil surface (Duponnois et al., 2001; Zhang et al., 2004; Guadarrama et
al., 2008), and might encourage build up of AMF propagule numbers. This is in accordance
with their observation on field AM colonization showing clearly that, root systems of the
dominant herbaceous species out of the tree plantations (C. obtusifolia, D. ciliaris,
Rhynchosia minima, Brachyaria racemosa etc.) were highly colonized (Table 3). This
observation was also confirmed by data obtained in C. integrifolia plantation where there is a
poor survival of the tree plants, and this has lead to an open canopy areas, and more ground
vegetation with concomitant inputs of AMF propagules. These data confirm earlier studies, Nova S
cienc
e Pub
lishe
rs, In
c.

Godar Sene, Mansour Thiao, Anicet Manga et al. 44
where difference on spore concentrations between tree species was attributed to differences
on the ground vegetation under these trees (Ingleby et al., 1997; Diagne et al., 2006).
Research carried out in recent decades also corroborates such a statement and emphasizes the
role of herbaceous species in sustaining soil mycorrhizal inoculums (Duponnois et al., 2001;
Zhang et al., 2004; Diagne et al., 2006; Guadarrama et al., 2008).
Table 3. Arbuscular mycorrhizal colonization of dominant plants from the deforested
(ZHC) and man-made (RES) forest land (adapted from Sene et al., 2012a)
Deforested land Man-made forest land
Species AM
colonization
Confident
limits P < 0.05
AM
colonization
Confident
limits P < 0.05
Herb
plants
Acalypha crenata Hochst.
ex A Ric. 32.31A,def ± 6.27 37.83A,bcd ± 6.32
Achyranthes aspera L. 31.70A,ef ± 5.50 32.36A,cde ± 5.67
Brachyaria racemosa L. 47.24A,bc ± 6.96 13.90B,gh ± 3.79
Cassia obtusifolia L. 79.32A,a ± 11.71 61.63A,a ± 9.84
Dactyloctenium aegyptium
(L.) Wild. 7.90A,g ± 2.86 6.40A,i ± 1.97
Digitaria ciliaris (Retz.) Cl. 62.20A,ab ± 10.72 46.65A,ab ± 5.39
Enteropogon prieurii
(Kunth) Cl. 28.40A,f ± 5.04 25.04A,ef ± 4.50
Mitracarpus villosus Cham.
and Schltdl. 41.42A,cde ± 5.30 32.92A,cde ± 4.51
Rhynchosia minima (L.) DC. 52.07A,bc ± 5.60 41.18B,bc ± 4.07
Indigenous
tree
species
Acacia nilotica (L.) Wild.
ex. Del. 5.01B,g ± 1.68 12.22A,ghi ± 4.86
A. senegal (L.) Wild. – – 14.01gh ± 3.40
A. seyal Del. 24.75A,f ± 5.98 20.45A,fg ± 5.74
A. tortilis (Forsk.) Hayne – – 19.87fg ± 5.09
Celtis integrifolia Lam. – – 8.95hi ± 3.06
Grewia bicolor Roth – – 27.8def ± 6.71
Sclerocarya birrea Hochst. – – 16.38fgh ± 5.45
Sterculia setigera Del. – – 8.22hi ± 3.61
Zizyphus mauritiana Lam. – – 11.83ghi ± 4.83
Exotic tree
species Azadirachta indica A. Juss. – – 50.18ab ± 11.84
Eucalyptus camaldulensis
Dehnh. – – 6.05i ± 1.78
E. microtheca F. Muell. – – 10.55hi ± 2.88
Cassia siamea Lam. – – 13.50gh ± 3.86
Gliricidia sepium (Jacq.)
Kunth – – 26.70ef ± 4.74
Hardwikia binata Roxb – – 10.42hi ± 4.14
Prosopis juliflora (Sw.) DC. – – 24.55ef ± 4.63
Nova S
cienc
e Pub
lishe
rs, In
c.
The Use of Forest Plantations in the Semiarid Sahel Regions 45
For each species, different capital letters (line) indicate significant differences between areas
(Tukey multiple means test, P < 0.05); for each area, different lowercase letters (column)
indicate significant differences between species.
In contrast, the tree plants in the man-made forest systems grew close to each other,
strongly limiting light penetration to the soil, reducing soil temperature and possibly limiting
colonization and sporulation of obligate AMF (Sene et al. (2012a, 2012b). According to the
authors, this could partially explain the poor colonization of the tree root systems and
corollary, this may led to the decrease of soil MIP. Alternatively, high nutrient contents are
also reported for soil samples from the man-made forest and this can generate “novel
ecological niches”, which may have large negative effects on root plant colonization (Sene et
al., 2012a, 2012b). This observation recalls numbers of studies, which have shown that the
concentration of nutrients (mainly P) in plant tissues affects root colonization by AMF (Smith
and Read, 2008), because the benefit of AMF may become relatively smaller than the C drain
they create. Under such circumstances, the feedback from AMF is previously reported to be
negative (Johnson et al., 1997). These observations interestingly point to the need of further
models and ideas for the man-made forest managers, with special emphasis on the soil
microbial ecologies.
Why is There Slower Mycorrhizal Propagule during the Rainy Season?
For several tree plantations, Sene et al. (2012b) showed that the AMF propagules were
significantly reduced in soil samples at the wet season compared to that of the dry season.
However, spore density increased with no change observed in AMF spores richness.
Additionally, further comparison on the relative abundance of each spore morphotype had
shown little variation between the two seasons (Sene et al., 2012b). Although there is a strong
evidence of seasonality in AMF communities (Dumbrell et al., 2011), seasonal niche of the
different sources of AMF propagules (mycelium, spore), owing to environmental factors to
which these propagules are most sensitive, may be the driving force in regulating the
temporal dynamics of AMF inoculums. One can tentatively explain this seasonal variability
of AMF propagules by evoking distinct processes according to the tree species in question.
For the first process, one can suspect release of toxins from the tree root exudation and/or
leaf litters decomposition at the wet season. The chemical compounds of root exudation are
not only different among species but can be modified according to the plant phenology
(Cheng, 2008). The seasonal effect affects not only the plants but also the AMF community,
altering the life cycle of different species (Oehl et al., 2009, 2010). These compounds, when
accumulated into soil, could act as allelochemicals on AMF development (Stinson et al.,
2006). This could also affect mycorrhiza through decreasing the underground herbaceous
vegetation, as host infection sites and rhizospheres are not available. Such allelopathic
interferences usually occur in the ecotone of exotic plant species (Kisa et al., 2007; Silva et
al., 2007; Remigi et al., 2008; Sanon et al., 2009).
An equally consistent explanation is that during the rainy period, the factors influencing
microbial activity in Sahelian areas were apparently promoted by the availability of water and
decomposing cover residues in the plantations, leading to an increase in nutrient availability,
as indicated by Sene et al. (2012a, 2013). As a consequence, this can reduce the membrane
permeability of root cortex cells and root exudes and then can depress root colonization
(Tawaraya et al., 1996). Accordingly, the nutrient availability together with the gap of light
beneath the tree species (Sene et al., 20012b) can create parasitic associations between AMF Nova S
cienc
e Pub
lishe
rs, In
c.
Godar Sene, Mansour Thiao, Anicet Manga et al. 46
and the ground vegetation because the costs of the symbiosis exceed the benefits (Johnson et
al., 1997), and this corollary decreases soil MIP through decreasing root herbs availability
(Sene et al., 2012b). In addition, beyond a certain threshold, a more abundant nutrient
availability should possibly result in a weaker dependence of plants on AMF for optimum
nutrition (Mendoza et al., 2011). Such statements should be expected in plantations of
Sahelian acacia species, where increasing soil organic matter, N and P content might generate
a “novel ecological niche”, negatively effecting soil AMF propagules (Sene et al., 2012b).
However, because both the soil chemical composition and the ground vegetation changed
beneath these tree plantations, cause-and-effect relationships are difficult to attribute
primarily to soil or ground vegetation characteristics, and data to date did not provided
sufficient reasons to conclude on this.
CONCLUSION AND FURTHER DIRECTIONS
There is substantial evidence from the man-made forest systems in the semi-arid Sahel
region that specific tree plantations can affect the natural LNR and AMF growth and
diversities as well as the soil nutrients cycling. This chapter shows that the tree plantations of
N2 fixing species are more efficient in enriching the soil with LNR organisms. It clearly
indicated that high numbers and genetic diversity of Rhizobium spp. were best fitted to these
tree plantations, which likely suggest that enrichment of soil Rhizobium spp. population is
host-specific. Nevertheless, there are few plantations of exotic tree legumes that harbored less
number and genetic diversity of LNR compared to those of non N2 fixing species. The chapter
also highlighted that the man-made forest systems can greatly alter the AMF communities
and thus keep soil MIP low. The scarcity of herbaceous layers beneath the tree plantations
might account for the low number of AMF spores and the low soil MIP. These indicators are
nonetheless insufficient to give all the information required by a man-made forest manager.
Hence, more work will be necessary to elucidate how to maximize the biodiversity of soil
LNR and AMF communities in man-made forest systems. To investigate this aspect, this
chapter suggests that attention be given to the mixed-tree plantations, as recommended by
Forrester et al. (2006), of N2 fixing species with non N2 fixing species. It will be interesting,
therefore, to further investigate the processes and interactions that will affect the productivity
in such mixed-species stands. An additional challenge with the man-made tree plantations is
to elucidate how to maximize the above and belowground plant coexistence, with special
emphasis on the herb legume hosts with a large spectrum for nodulation, and the herb plants
having a high mycorrhizal dependency. This can lead to fully exploiting their potential uses
by promoting the soil microbial communities.
REFERENCES
Akpo, L. E., Banoin, M., Grouzis, M. (2003). Effet de l'arbre sur la production et la qualité
fourragère de la végétation herbacée : bilan pastoral en milieu sahélien. Rev. Méd. Vét.,
154, 619-628. Nova S
cienc
e Pub
lishe
rs, In
c.
The Use of Forest Plantations in the Semiarid Sahel Regions 47
Alguacil, M. M., Lozano, Z., Campoy, M. J., Roldán, A. (2010). Phosphorus fertilization
management modifies the biodiversity of AM fungi in a tropical savanna forage system.
Soil Biol. Bioch., 42, 1114-1122.
Andrade, D. S., Murphy, P. J., Giller, K. E. (2002). The diversity of Phaseolus-nodulating
rhizobial populations is altered by liming of acid soils planted with Phaseolus vulgaris L.
in Brazil. Appl. Environ. Microbiol., 68, 4025-4034.
Bai, Z. G., Dent, D. L., Olsson, L., Schaepman, M. E. (2008). Global assessment of land
degradation and improvement. 1. Identification by remote sensing. Report 2008/01,
ISRIC–World Soil Information, Wageningen.
Bala, A., Giller, K. E. (2006). Relationships between rhizobial diversity and host legume
nodulation and nitrogen fixation in tropical ecosystems. Nutr. Cycl. Agroecosyst., 76,
319-330.
Bever, J. D., Westoven, K. M., Antonovics, J. (1997). Incorporation the soil community into
plant population dynamics: the utility of the feedback approach. J. Ecol., 85, 561-573.
Bilgo, A., Sangare, S. K, Thioulouse, J., Prin, Y., Hien, V., Galiana, A., Baudoin, E., Hafidi,
M., Bâ, A.M., Duponnois, R. (2011). Response of native soil microbial functions to the
controlled mycorrhization of an exotic tree legume, Acacia holosericea in a Sahelian
ecosystem. Mycorrhiza, 22, 175-187.
Cardoso, I. M., Kuyper, T. W. (2006). Mycorrhizas and tropical soil fertility Agriculture.
Ecosyst. Environ., 116, 72-84.
Cheng, W. (2008). Rhizosphere priming effect: its functional relationships with microbial
turnover, evapotranspiration, and C–N budgets. Soil Biol. Biochem., 41, 1795-1801.
Curlevski, N. J. A., Xu, Z., Anderson, I. C., Cairney, J. W. G. (2010). Converting Australian
tropical rainforest to native Araucariaceae plantations alters soil fungal communities. Soil
Biol. Biochem., 42, 14-20.
Diagne, O., Ingleby, K., Deans, J. D., Lindley, D. K., Diaité, I., Neyra, M. (2001).
Mycorrhizal inoculum potential of soils from alley cropping plots in Sénégal. Forest
Ecol. Manag., 146, 35-43.
Diagne, O., Seck, A. S., Gassama-Dia, Y. K. (2006). Seasonal and spatial distribution of roots
and arbuscular mycorrhizal fungi under live fences of Acacia laeta and Acacia mellifera
in Sénégal. Southern Afr. Forest J., 207(1), 41-46.
Diouf, D., Samba-Mbaye, R. T., Lesueur, D., Ba, A. T., Dreyfus, B., de Lajudie, P., Neyra,
M. (2007). Genetic diversity of Acacia seyal rhizobial population indigenous to
Senegalese soils in relation to salinity and pH of the sampling sites. Microbial Ecol., 54,
553-566.
Diouf, D., Sougoufara, B., Neyra, M., Lesueur, D. (2002). Le reboisement au Sénégal : bilan
des réalisations de 1993 à 1998. Rev. For. Fr. LIV., 3, 227-238.
Dommergues, Y., Duhaux, E., Hoang, G.D. (1999). Les Arbres Fixateurs d‟Azote :
Caractéristiques fondamentales et rôle dans l‟aménagement des écosystèmes
méditerranéens et tropicaux. Y. Dommergues (ed). Édition espaces 34. Paris, 475p.
Donfack, P., Floret, C., Pontanier, R. (1995). Secondary succession in abandoned fields of
dry tropical northern Cameroon. J. Veg. Sci., 6, 499-508.
Dreyfus, B., Diem, H. G., Freire, J., Keya, S. O., Dommergues, Y. R. (1988). Nitrogen
fixation in tropical agriculture and forestry. In Dasilva E.J, Dommergues YRNyns EJ,
Ratledge C (Eds). Microbial technology in developping world. Oxford University Press,
Oxford, pp. 1-7. Nova S
cienc
e Pub
lishe
rs, In
c.
Godar Sene, Mansour Thiao, Anicet Manga et al. 48
Dumbrell, A. J., Ashton, P. D., Aziz, N., Feng, G., Nelson, M., Dytham, C., Fitter, A. H.,
Helgason, T. (2011). Distinct seasonal assemblages of arbuscular mycorrhizal fungi
revealed by massively parallel pyrosequencing. New Phytol., 190(3), 794-804.
Duponnois, R., Colombet, A., Hien, V. Thioulouse, J. (2005). The mycorrhizal fungus
Glomus intraradices and rock phosphate amendment influence plant growth and
microbial activity in the rhizosphere of Acacia holosericea. Soil Biol. Biochem., 37,
1460-1468.
Duponnois, R., Plenchette, C., Thioulouse, J., Cadet, P. (2001). The mycorrhizal soil
infectivity and arbuscular mycorrhizal fungal spore communities in soils of different aged
fallows in Senegal. Appl. Soil Ecol., 17, 239-251.
Egerton-Warburton, L. M., Allen, E. B. (2000). Shifts in arbuscular mycorrhizal communities
along an anthropogenic nitrogen deposition gradient. Ecol. Appl., 10, 484-496.
Faye, A., Krasova-Wade, T., Thiao, M., Thioulouse, J., Neyra, M., Prin, Y., Galiana, A., et al.
(2009). Controlled ectomycorrhization of an exotic legume tree species Acacia
holosericea affects the structure of root nodule bacteria community and their symbiotic
effectiveness on Faiderbia albida, a native Sahelian Acacia. Soil Biol. Biochem., 41,
1245-1252.
Forrester, D. I., Bauhus, J., Cowie, A. L., Vanclay, J. K. (2006). Mixed-species plantations of
Eucalyptus with nitrogen fixing trees: a review. Forest Ecol. Manag., 233, 211-230.
Fortin, J. A., Plenchette, C., Piché, Y. (2008). Les Mycorhizes : la Nouvelle Révolution
Verte. Édition multimondes, Québec Canada, 138 p.
Graham, P. H. (2008). Ecology of the root-nodule bacteria of legumes. In: Dilworth, M.J.,
James, E.K., Sprent, J.I., Newton, W.E. (Eds.), Leguminous Nitrogen-Fixing Symbioses.
Springer, pp. 23-58.
Guadarrama, P., Castillo-Argüero, S., Ramos-Zapata, J. A., Camargo-Ricalde, S. L., Álvarez-
Sánchez, J. (2008). Propagules of arbuscular mycorrhizal fungi in a secondary dry forest
of Oaxaca, Mexico. Int. J. Trop. Biol., 56(1), 269-277.
Hobbie, S. E., Ogdahl, M., Chorover, J., Chadwick, O. A., Oleksyn, J. et al. (2007). Tree
Species Effects on Soil Organic Matter Dynamics: The Role of Soil Cation Composition.
Ecosyst., 10, 999-1018.
Hobbie, S. E., Reich, P. B., Oleksyn, J., Ogdahl, M., Zytkowiak, R. et al. (2006). Species
effects on decomposition and forest floor dynamics in a common garden. Ecol., 87(9),
2288-2297.
Ingleby, K., Diagne, O., Deans, J. D., Lindley, D. K., Neyra, M., Ducousso, M. (1997).
Distribution of roots, arbuscular mycorrhizal colonisation and spores around fast-growing
tree species in Senegal. Forest Ecol. Manag., 90, 19-27.
Johnson, N. C. (1993). Can fertilization of soil select less mutulalistic mycorrhizae? Ecol.
Appl., 3, 749-757.
Johnson, N. C., Zak, D. R., Tilman, D., Pfleger, F. L. (1991). Dynamics of
vesiculararbuscular mycorrhizae during old field succession. Oecologia, 86, 349-358.
Johnson, N.C., Graham, J.H. and Smith, F.A. (1997). Functioning and mycorrhizal
associations along the mutualism-parasitism continuum. New Phytol., 135, 575-586.
Jordan, N. R., Larson, D. L., Huerd, S. C. (2008). Soil modification by invasive plants: effects
on native and invasive species of mixed-grass prairies. Biol. Invasion., 10, 177-190. Nova S
cienc
e Pub
lishe
rs, In
c.
The Use of Forest Plantations in the Semiarid Sahel Regions 49
Kahindi, J. H. P., Woomer, P., George, T., de Souza Moreira, F. M., Karanja, N. K., Giller,
K. E. (1997). Agricultural intensification, soil biodiversity and ecosystem function in the
tropics: the role of nitrogen-fixing bacteria. Appl. Soil Ecol., 6, 55-76.
Kiers, ET, Rousseau, RA, West, SA, Denison, RF (2003) Host sanctions and the legume-
Rhizobium mutualism. Nature (Lond.), 425, 78-81.
Kisa, A., Sanon, A., Thioulouse, J., Assigbetse, K., Sylla, S., Spichiger, R., Dieng, et al.
(2007). Arbuscular mycorrhizal symbiosis can counterbalance the negative influence of
the exotic tree species Eucalyptus camaldulensis on the structure and functioning of soil
microbial communities in a sahelian soil. FEMS Microbiol. Ecol., 62, 32-44.
Larsen, J. Bo (1995). Ecological stability of forests and sustainable silviculture. Forest Ecol.
Manag., 73, 85-96.
Lawson, K., Barnet, Y. M., McGilchrist, C. A. (1987). Environmental factors influencing
numbers of Rhizobium leguminosarum bv. trifolii and its bacteriophages in two field
soils. Appl. Environ. Microbiol., 53, 1125-1131.
Lemma, B., Nilsson, I., Kleja, D. B., Olsson, M., Knicker, H. (2007). Decomposition and
substrate quality of leaf litters and fine roots from three exotic plantations and a native
forest in the southwestern highlands of Ethiopia. Soil Biol. Biochem., 39, 2317-2328.
Lindström, K., Murwira, M., Willems, A., Altier, N. (2010). The biodiversity of beneficial
microbe-host mutualism: the case of rhizobia. Res. Microbiol., 161, 453-463.
Mascaro, J., Becklund, K. K., Hughes, R. F., Schnitzer, S. A. (2008). Limited native plant
regeneration in novel, exotic-dominated forests on Hawai‟i. Forest Ecol. Manag., 256,
593-606.
Mendoza, R., Cabello, M., Anchorena, J., García, I., Marbán, L. (2011). Soil parameters and
host plants associated with arbuscular mycorrhizae in the grazed Magellanic steppe of
Tierra del Fuego. Agr. Ecosyst. Environ., 140, 411-418.
Mungai, N. W., Motavalli, P. P., Kremer, R. J., Nelson, K. A. (2005). Spatial variation of soil
enzyme activities and microbial functional diversity in temperate alley cropping systems.
Biol. Fertil. Soils, 42, 129-136.
Mwenda, G. M., Kranja, N. K., Boga, H., Kahindi, J. H. P., Muigai, A., Odee, D. (2011).
Abundance and diversity of legume-nodulating rhizobia in soils of Embu district, Kenya.
J. Trop. Subtrop. Agroecosystems, 13, 1-10.
Ndoye, F, Kane, A., Mangaptché, E. L. N., Bakhoum, N., Sanon, A., Diouf, D., Sy, M. O.,
Baudoin, E., Noba, K., Prin, Y. (2012). Changes in land use system and environmental
factors affect arbuscular mycorrhizal fungal density and diversity, and enzyme activities
in rhizospheric soils of Acacia senegal (L.) Willd. ISRN Ecol. (in press)
doi:10.5402/2012/563191.
Noel, K. D. (2009). Rhizobia. In: Encyclopedia of Microbiology, 3rd edition, ed. Schaechter
M. Oxford: Elsevier, pp. 261-277.
Oehl, F., Laczko, E., Bogenrieder, A., Stahr, K., Bösch, R., van der Heijden, M., Sieverding,
E. (2010). Soil type and land use intensity determine the composition of arbuscular
mycorrhizal fungal communities. Soil Biol. Biochem., 42, 724-738.
Oehl, F., Sieverding, E., Ineichen, K., Maïder, P., Wiemken, A., Boller, T. (2009). Distinct
sporulation dynamics of arbuscular mycorrhizal fungal communities from different
agroecosystems in long-term microcosms. Agric. Ecosyst. Environ., 134, 257-268. Nova S
cienc
e Pub
lishe
rs, In
c.
Godar Sene, Mansour Thiao, Anicet Manga et al. 50
Peichl, M., Thevathasan, N. V., Gordon, A. M., Huss, J., Abohassan, R. A. (2006). Carbon
sequestration potentials in temperate tree-based intercropping systems, southern Ontario,
Canada. Agroforest. Syst., 66, 243-257.
Remigi, P., Faye, A., Kane, A., Deruaz, M., Thioulouse, J., Cissoko, M., Prin, Y., Galiana,
A., Dreyfus, B., Duponnois, R. (2008). The exotic legume tree species Acacia
holosericea alters microbial soil functionalities and the structure of the arbuscular
mycorrhizal community. Appl. Environ. Microbiol., 74, 1485-1493.
Rillig, M. C., Mummey, D. L. (2006). Tansley review – mycorrhizas and soil structure. New
Phytol., 171, 41-53.
Rivest, D., Cogliastro, A., Vanasse, A., Olivier, A. (2009). Production of soybean associated
with different hybrid poplar clones in a tree-based intercropping system in southwestern
Québec, Canada. Agric. Ecosyst. Environ., 131, 51-60.
Sanon, A., Beguiristain, T., Cébron, A., Berthelin, J., Ndoye, I., Leyval, C., Sylla, S.,
Duponnois, R. (2009). Changes in soil diversity and global activities following invasions
of the exotic invasive plant, Amaranthus viridis L., decrease the growth of native sahelian
Acacia species. FEMS Microbiol. Ecol., 70, 118-131.
Schnitzer, S. A., Klironomos, J. N., Hillerislambers, J., Kinkel, L. L., Reich, P. B., Xiao, K. et
al. (2011). Soil microbes drive the classic plant diversity-productivity pattern. Ecol., 92,
296-303.
Sene, G., Thiao, M., Samba-Mbaye, R., Ndoye, F., Kane, A., Diouf, D., Sylla, S. N. (2010).
Response of three peanut cultivars toward inoculation with two Bradyrhizobium strains
and an arbuscular mycorrhizal fungus in Senegal. Afr. J. Microbiol. Res., 4(23), 2520-
2527.
Sene, G., Samba-Mbaye, R., Thiao, M., Khasa, D. P., Kane, A., Mbaye, M. S., Manga, A.,
Sylla, S. N. (2012a). The abundance and diversity of legume-nodulating rhizobia and
arbuscular mycorrhizal fungal communities in soil samples from deforested and man-
made forest systems in a semiarid Sahel region in Senegal. Europ. J. Soil Biol., 52, 30-40
http://dx.doi.org/10.1016/j.ejsobi.2012.05.005.
Sene, G., Thiao, M., Manga, A., Kane, A., Samba-Mbaye, R., Mbaye, M. S., Khasa, D. P.,
Sylla, S. N. (2012b). Arbuscular mycorrhizal soil infectivity and spores distribution
across plantations of tropical, subtropical and exotic tree species: A case study from the
forest reserve of Bandia, Senegal. Afr. J. Ecol., 50, 218-232 doi: 10.1111/j.1365-
2028.2011.01315.x.
Sene, G., Thiao, M., Samba-Mbaye, R., Khasa, D. P., Kane, A., Mbaye, M. S., Beaulieu, M.-
È., Manga, A., Sylla, S. N. (2013). The abundance and diversity of legume-nodulating
rhizobia in 28-year-old plantations of tropical, subtropical and exotic tree species: a case
study from the forest reserve of Bandia, Senegal. Microb. Ecol., 65(1), 128-144 doi:
10.1007/s00248-012-0094-y.
Silva, A. M. M., Silva, A. R., Pinheiro, A. M., Freitas, S. R. V. B., Silva, V. D. A., et al.
(2007). Alkaloids from Prosopis juliflora leaves induce glial activation, cytotoxicity and
stimulate NO production. Toxicon, 49, 601-614.
Smith, S. E., Read, D. J. (1997). Mycorrhizal symbiosis. Academic Press; 2nd
ed. London,
605 p.
Smith, S. E., Read, D. J. (2008). Mycorrhizal Symbiosis, 3rd ed. Academic Press Inc.,
London, UK, 815 p. Nova S
cienc
e Pub
lishe
rs, In
c.

The Use of Forest Plantations in the Semiarid Sahel Regions 51
Stinson, K. A., Campbell, S. A., Powell, J. R., Wolfe, B. E., Callaway, R. M., et al. (2006).
Invasive plant suppresses the growth of native tree seedlings by disrupting belowground
mutualisms. PLoS Biol., 4, 727-731.
Stürmer, S. L. Siqueira, J. O. (2011). Species richness and spore abundance of arbuscular
mycorrhizal fungi across distinct land uses in Western Brazilian Amazon. Mycorrhiza,
21(4), 255-267.
Tappan, G. G., Sall, M., Wood, E. C., Cushing, M. (2004). Ecoregions and land cover trends
in Senegal. J. Arid Environ., 59, 427-462.
Tawaraya, K., Watanabe, S., Yoshioda, E. (1996). Effect of onion (Allium cepa) root exudates
on the hyphal growth of Gigaspora margarita. Mycorrhiza, 6(1), 57-59.
Tiffen, M., Mortimore, M. (2002). Questioning desertification in dryland sub-Saharan Africa.
Natural Resources Forum, 26, 218-233.
van der Heijden, M. G. A., Bakker, R., Verwaal, J., Scheublin, T. R., Rutten, M., van
Logtestijn, R., Staehelin, C. (2006). Symbiotic bacteria as a determinant of plant
community structure and plant productivity in dune glassland. FEMS Microbiol. Ecol.,
56, 178-187.
van der Heijden, M. G. A., Bardgett, R. D., van Straalen, N. M. (2008). The unseen majority:
soil microbes as drivers of plant diversity and productivity in terrestrial ecosystems. Ecol.
Lett., 11, 296-310.
van der Heijden, M. G. A., Klironomos, J. N., Ursic, M., Moutoglis, P., Streitwolf-Engel, R.,
et al. (1998). Mycorrhizal fungal diversity determines plant biodiversity, ecosystem
variability and productivity. Nature, 396, 72-75.
Vincke, C., Diédhiou, I., Grouzis M. (2010). Long term dynamics and structure of woody
vegetation in the Ferlo (Senegal). J. Arid Environ., 74, 268-276.
Wolde-meskel, E., Terefework, Z., Frostegård, Å. sa, Lindström, K. (2005). Genetic diversity
and phylogeny of rhizobia isolated from agroforestry legume species in southern
Ethiopia. Int. J. Syst. Evol. Microbiol., 55, 1439-1452.
Woomer, P., Singleton, P. W., Bohlool, B. B. (1988). Ecological indicators of native rhizobia
in tropical soils. Appl. Environ. Microbiol., 54, 1112-1116.
Xingjun, Y., Dan, Y., Zhijun, L., Keping, M.A. (2005). A new mechanism of invader success:
exotic plant inhibits natural vegetation restoration by changing soil microbe community.
Chinese Sci. Bull., 50, 1105-1112.
Zhang, Y., Gui, L. D., Liu, R. J. (2004). Survey of arbuscular mycorrhizal fungi in deforested
and natural forest land in the subtropical region of Dujiangyan, southwest China. Plant
Soil, 261, 257-263.
Nova S
cienc
e Pub
lishe
rs, In
c.

Nova S
cienc
e Pub
lishe
rs, In
c.
In: Plantations ISBN: 978-1-60876-576-8
Editor: Ren Hai © 2013 Nova Science Publishers, Inc.
Chapter 4
INDIGENOUS-OWNED PASTORAL LAND FORESTRY
CARBON BIOSEQUESTRATION AND
BIOENERGY OPTIONS IN ARID, SALT-AFFECTED
WESTERN AUSTRALIAN REGIONS
Mark P. McHenry1* and Julia Anwar McHenry
2
1Faculty of Minerals and Energy, Murdoch University, Western Australia
2Faculty of Health Sciences, Curtin University Health Research Campus,
Western Australia
ABSTRACT
This research comprises a technical and economic feasibility study of
geoengineering and revegetating 1,500 ha on an Indigenous-owned pastoral lease in an
arid region (<250 mm mean annual rainfall) in the Mid West Region of Western
Australia for forestry carbon biosequestration and bioenergy projects. A single tree
species, Eucalyptus camaldulensis, an indigenous tree species of the region was used in
two modeled scenarios. The carbon biosequestration and NPC (8% p.a. real discount rate)
was modeled over 15 years, yielding an equivalent mitigation cost of AUD15.34 tCO2-e-
1, assuming the total biosequestration (185,635 tCO2-e) was forward sold in year 0 in the
first scenario. In the second scenario, the stand was the primary feedstock for a
biorefinery producing activated carbon, renewable electricity, and biodiesel produced
from 20 t day-1
(16% moisture) E. camaldulensis, with harvesting commencing in the
sixth year after stand establishment. The final total biosequestration for both the
unharvested and harvested stand scenarios were modeled as identical in the 15th
year. The
NPV of the biorefinery was modeled separately from stand biosequestration also
discounted at 8% p.a. Depending on the mitigation assumptions, and the commercial
costs/prices of inputs/outputs over the 15 years, the biorefinery NPV ranged from slightly
below zero to AUD6.5 million, and mitigated a further 73,761 tCO2-e, based on modeling
assumptions.
*
Corresponding Author address Murdoch University, 90 South St Murdoch, Western Australia, 6150. Email:
[email protected]. Nova S
cienc
e Pub
lishe
rs, In
c.
Mark P. McHenry and Julia Anwar McHenry 54
Keywords: Carbon; forestry biosequestration; bioenergy; arid; salt; pastoral plantations
INTRODUCTION
Livestock grazing land use activities on pastoral leaseholds occur on around 40% of the
state of Western Australia (WA), representing approximately 98 million ha. Attempts to
diversify pastoral leases since the 1800s into more intensive and/or productive uses other than
grazing have been occurring in a minor sense over time, including agricultural and
horticultural alternatives. However, most diversifications, apart from mining, have been
commercially unsuccessful over time (Payne et al., 1998). The Land Administration Act
1997, various other environmental legislation, and the Pastoral Lands Board limit leasehold
activities, and any diversification, conservation, or sale of any product of a non-pastoral
nature currently requires a permit from the Board. Penalties range from fines of a few
thousand dollars to lease termination. In addition to bureaucratic barriers, active land
regeneration may require expensive geoengineering techniques including earthworks, stream
flow modification, and replanting of native species in suitable ecological niches, which are all
dependent on local hydrology, vegetation, soils, land surface characteristics, existing land
uses, and local capacity (Payne et al., 1998; McHenry, 2010, 2011, 2012a, 2012b, 2012c,
2012d, 2013). Several regions are currently are overgrazed with considerable loss of perennial
vegetation, biodiversity, and in places advanced degradation has resulted in loss of water and
nutrient infiltration due to compacted soils (Curry et al., 2008). Therefore, there is a
considerable challenge to achieving reasonable tree survival and growth rates in arid land
rehabilitation, carbon (C) biosequestration, and bioenergy projects, quite separate from any
commercially viable energy or conventional diversification alternative for pastoralists
(Yamada et al., 1999; McHenry, 2009c, 2009a, 2009b, 2009d, 2012e). In arid lands of
Australia, the availability of moisture and flows of water largely determine the growth and
development of trees, which often uniquely utilize groundwater as a primary water source
(Mensforth et al., 1994; Thorburn & Walker, 1994; Yamada et al., 1999; Shiono et al., 2004;
Matsumoto et al., 2006; Tanouchi et al., 2006). As arid land rains are infrequent, irregular,
and the majority of the volumes are lost by runoff and evaporation (Hirukawa et al., 2006),
the soil and land characteristics are important determinants of improving soil water
availability and water holding capacity for revegetation activities (Payne et al., 1998;
Egashira et al., 2003). Locations with eroded soils and large siliceous layers (hardpans)
inhibit tree growth as the hardpan barrier prevents root development for sourcing groundwater
(Shiono et al., 2006), and a rapid recovery of the original vegetation may be impossible
without mechanical intervention to break up the hardpans of around 1 m thickness (Yamada
et al., 1999; Curry et al., 2008). In the main, the total biomass accumulation of native tree
species in these region are low, with the exception of Eucalyptus species in niche ecologies,
or geoengineered areas (Yamada et al., 1999). As tree growth in both natural and revegetated
stands are related to the volume and specific path of water flows (Abe et al., 2003), small-
scale geoengineering offers an additional means to recreate soil water holding capacities akin
to, or even surpassing pre-European periods, enabling high growth and survival rates for
rehabilitation projects using selected local species. Nova S
cienc
e Pub
lishe
rs, In
c.
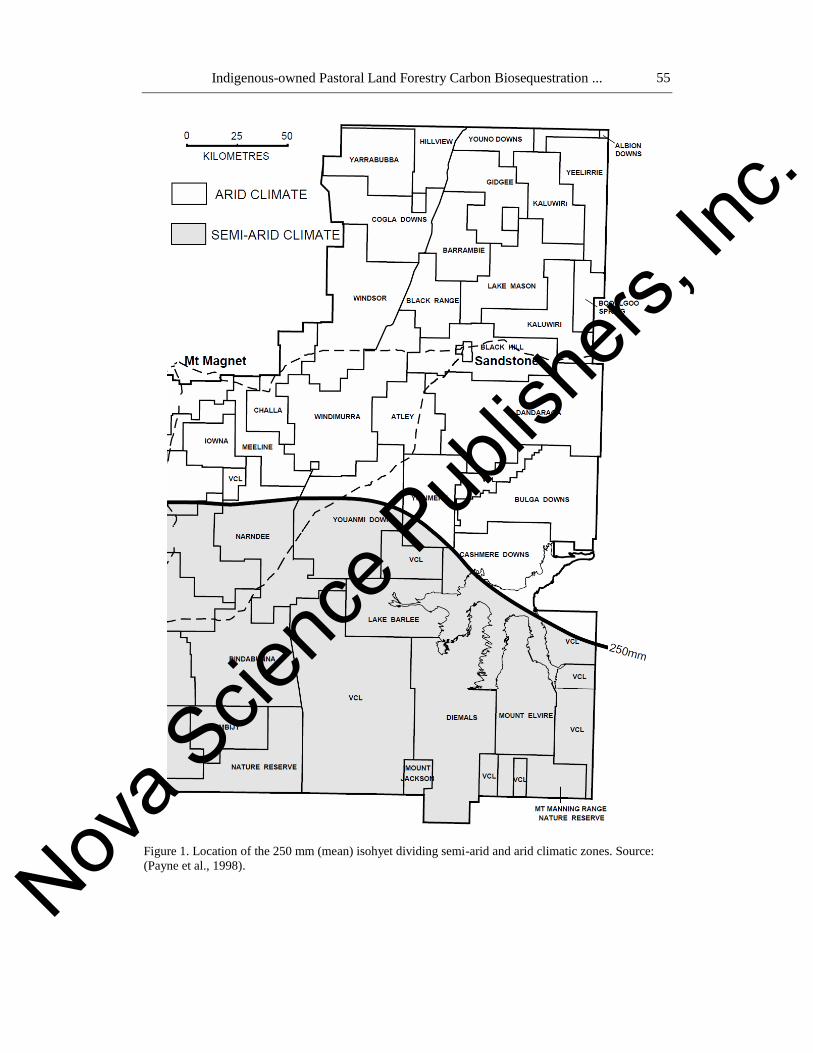
Indigenous-owned Pastoral Land Forestry Carbon Biosequestration ... 55
Figure 1. Location of the 250 mm (mean) isohyet dividing semi-arid and arid climatic zones. Source:
(Payne et al., 1998).
Nova S
cienc
e Pub
lishe
rs, In
c.
Mark P. McHenry and Julia Anwar McHenry 56
THE FOCUS REGION AND AVAILABLE BIOMASS GROWTH DATA
The focus pastoral region for this research is within the Murchison bioregion, and is
climatically arid (Curry et al., 2008) (Figure 1). Geologically, the sub-region lies on Archean
rock, and is part of the Yilgarn Craton (Payne et al., 1998). Linear to arcuate belts of
greenstone and local gneissic rocks intruded by granitoid rock of Archaean age are overlaid
with alluvial, colluvial, Aeolian, and lacustrine deposits of Cainozoic age (Payne et al., 1998;
Yamada et al., 1999). The extensive surface landscape is largely comprised of flat colluvial-
alluvial geologies that support various species, including dominant Acacia and Eucalyptus
species (Payne et al., 1998). The region exhibits high annual rainfall variability, receiving
between 60 to 500 mm, with higher rainfall years due to unpredictable summer storms. The
area receives around 45% of the total annual mean rainfall of around 250-200 mm in the wet
months and around 55% in the dry months (Payne et al., 1998; Yamada et al., 1999; Abe et
al., 2003). The Cogla Downs pastoral station, Lat. (S) 27o
26‟, Lon. (E) 118o 56‟, at 500 m
a.s.l., has 56 years of recorded rainfall observations. The lowest recorded rainfall was 69 mm
in 1969, and the highest of 546 mm recorded in 1942 demonstrates the extreme variation from
the median annual recorded rainfall of 191 mm (Payne et al., 1998). In terms of temperature,
the mean monthly maximum and minimum temperatures of the hottest month (January) is
around 37 and 22oC, respectively. The mean monthly maximum and minimum temperature of
the coldest month (July) is around 18 and 6 o
C, respectively (Yamada et al., 1999). Thus,
evaporation dominates as an influence on flora and fauna systems of the region, often being in
excess of 10 times the annual rainfall received (Payne et al., 1998). The technical and
economic analyses in this research are based on longer-term research data derived from the
Sturt Meadows pastoral lease, which were calibrated as a representative dataset using recent
(2010) experimental tree plantings at Cogla Downs station to derive practical on-site planting
information (Figure 2). Sturt Meadows is in the same Murchison bioregion and exhibits very
similar geological, hydrological, and climatic conditions as Cogla Downs, and is located
around 200 km SE from Cogla Downs, and 200 km N from Kalgoorlie (Figure 3). The total
area of Cogla Downs pastoral station is 199,478 ha.
Since 1996, a research partnership between Japan Science and Technology Corporation
(JST) and Core Research for Evolutional Science and Technology (CREST) have conducted
comprehensive intensive revegetation trials, sampling, field experiments, and associated
atmospheric and ecophysical monitoring on several sites on the Sturt Meadows pastoral lease
(Curry et al., 2008). Arial photographic analysis of the Sturt Meadows station (a total area of
299,250 ha) in 1999 provided an estimate of 8.5 tDM ha-1
for the aboveground biomass and a
total 10.5 tDM ha-1
, assuming an average belowground root biomass component of around
24% (Yamada et al., 1999). Most of the species in the region exhibit slow growth, with the
notable exception of the E. camaldulensis trees which can grow at around 30-35 kg DM yr-1
.
This is around 9-10 times greater growth rates than other local species, which is attributed to
both a species and research site difference (Yamada et al., 1999) (Table 1). Table 1 shows
estimating average C biosequestration of tree species in arid regions is complicated by age
uncertainty, often due to the episodic growth, germination, and plant establishment in years of
above average rainfall (Yamada et al., 1999). Nonetheless, an average total potential natural
biomass growth C biosequestration post-destocking for the Sturt Meadows lease was Nova S
cienc
e Pub
lishe
rs, In
c.
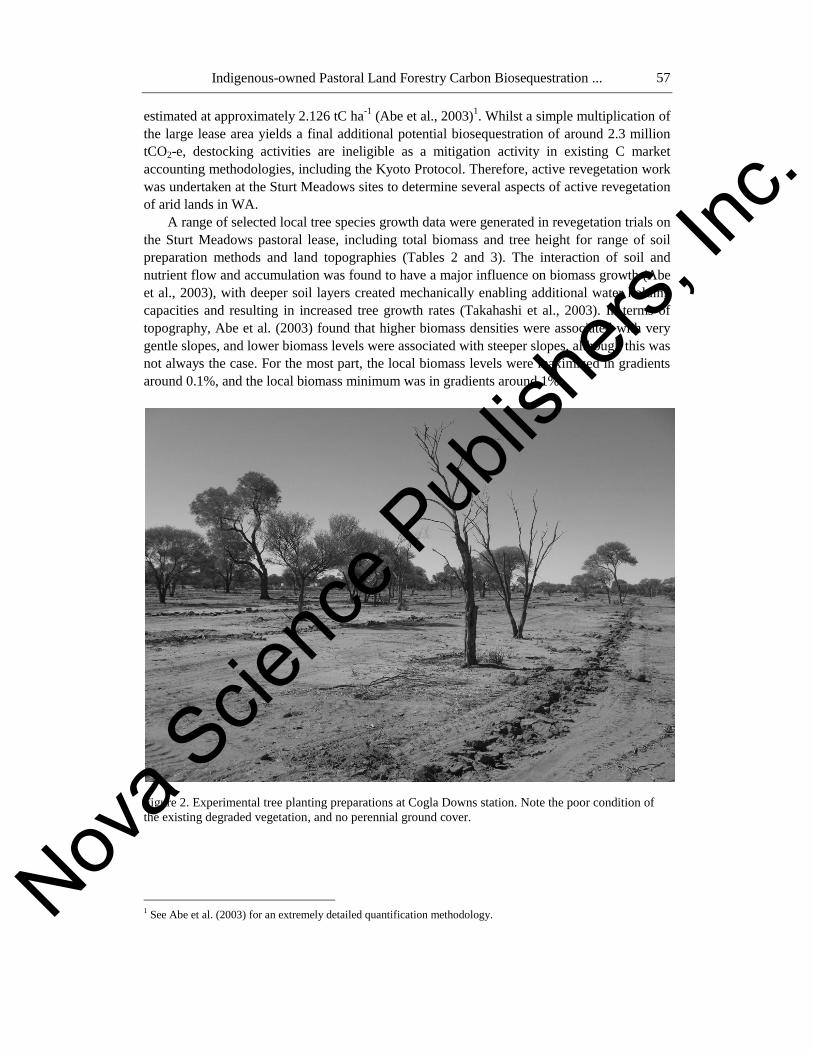
Indigenous-owned Pastoral Land Forestry Carbon Biosequestration ... 57
estimated at approximately 2.126 tC ha-1
(Abe et al., 2003)1. Whilst a simple multiplication of
the large lease area yields a final additional potential biosequestration of around 2.3 million
tCO2-e, destocking activities are ineligible as a mitigation activity in existing C market
accounting methodologies, including the Kyoto Protocol. Therefore, active revegetation work
was undertaken at the Sturt Meadows sites to determine several aspects of active revegetation
of arid lands in WA.
A range of selected local tree species growth data were generated in revegetation trials on
the Sturt Meadows pastoral lease, including total biomass and tree height for range of soil
preparation methods and land topographies (Tables 2 and 3). The interaction of soil and
nutrient flow and accumulation was found to have a major influence on biomass growth (Abe
et al., 2003), with deeper soil layers created mechanically enabling additional water holding
capacities and resulting in increased tree growth rates (Takahashi et al., 2003). In terms of
topography, Abe et al. (2003) found that higher biomass densities were associated with very
gentle slopes, and lower biomass levels were associated with steeper slopes, although this was
not always the case. For the most part, the local biomass levels were maximized in gradients
around 0.1%, and the local biomass minimum was in gradients around 1%.
Figure 2. Experimental tree planting preparations at Cogla Downs station. Note the poor condition of
the existing degraded vegetation, and no perennial ground cover.
1 See Abe et al. (2003) for an extremely detailed quantification methodology. Nova S
cienc
e Pub
lishe
rs, In
c.
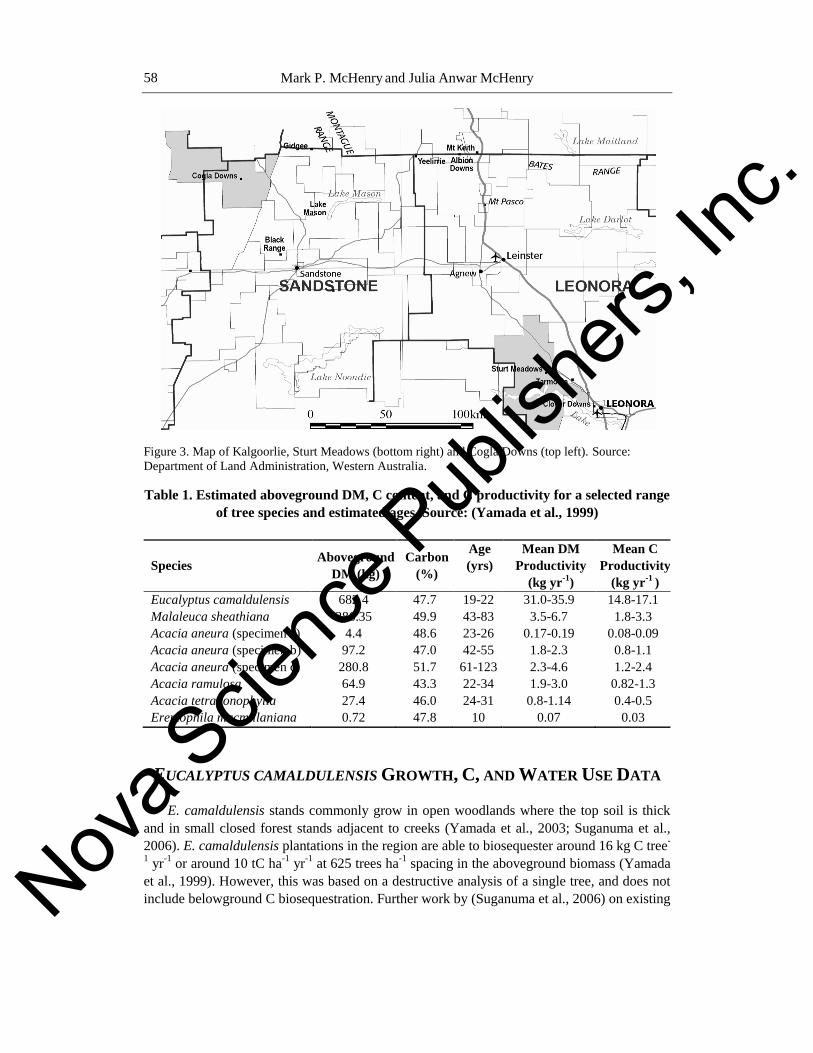
Mark P. McHenry and Julia Anwar McHenry 58
Figure 3. Map of Kalgoorlie, Sturt Meadows (bottom right) and Cogla Downs (top left). Source:
Department of Land Administration, Western Australia.
Table 1. Estimated aboveground DM, C content, and C productivity for a selected range
of tree species and estimated ages. Source: (Yamada et al., 1999)
Species Aboveground
DM (kg)
Carbon
(%)
Age
(yrs)
Mean DM
Productivity
(kg yr-1
)
Mean C
Productivity
(kg yr-1
)
Eucalyptus camaldulensis 682.4 47.7 19-22 31.0-35.9 14.8-17.1
Malaleuca sheathiana 286.35 49.9 43-83 3.5-6.7 1.8-3.3
Acacia aneura (specimen a) 4.4 48.6 23-26 0.17-0.19 0.08-0.09
Acacia aneura (specimen b) 97.2 47.0 42-55 1.8-2.3 0.8-1.1
Acacia aneura (specimen c) 280.8 51.7 61-123 2.3-4.6 1.2-2.4
Acacia ramulosa 64.9 43.3 22-34 1.9-3.0 0.82-1.3
Acacia tetragonophylla 27.4 46.0 24-31 0.8-1.14 0.4-0.5
Eremophila macmillaniana 0.72 47.8 10 0.07 0.03
EUCALYPTUS CAMALDULENSIS GROWTH, C, AND WATER USE DATA
E. camaldulensis stands commonly grow in open woodlands where the top soil is thick
and in small closed forest stands adjacent to creeks (Yamada et al., 2003; Suganuma et al.,
2006). E. camaldulensis plantations in the region are able to biosequester around 16 kg C tree-
1 yr
-1 or around 10 tC ha
-1 yr
-1 at 625 trees ha
-1 spacing in the aboveground biomass (Yamada
et al., 1999). However, this was based on a destructive analysis of a single tree, and does not
include belowground C biosequestration. Further work by (Suganuma et al., 2006) on existing Nova S
cienc
e Pub
lishe
rs, In
c.
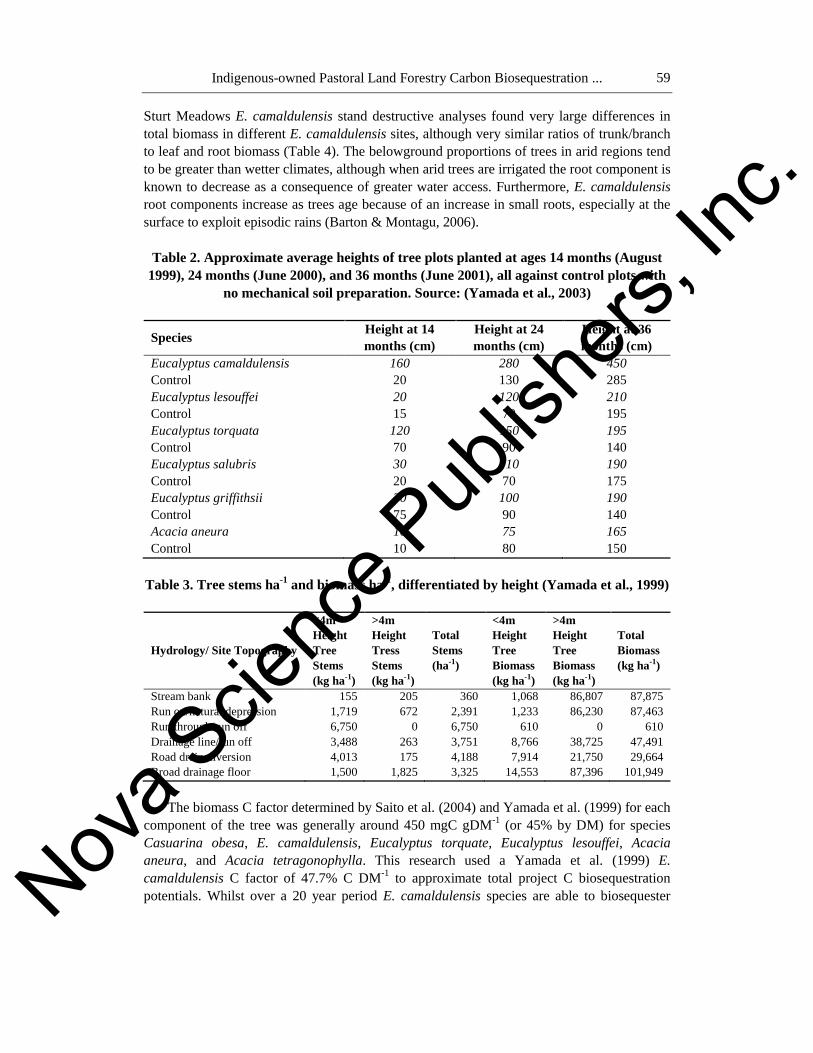
Indigenous-owned Pastoral Land Forestry Carbon Biosequestration ... 59
Sturt Meadows E. camaldulensis stand destructive analyses found very large differences in
total biomass in different E. camaldulensis sites, although very similar ratios of trunk/branch
to leaf and root biomass (Table 4). The belowground proportions of trees in arid regions tend
to be greater than wetter climates, although when arid trees are irrigated the root component is
known to decrease as a consequence of greater water access. Furthermore, E. camaldulensis
root components increase as trees age because of an increase in small roots, especially at the
surface to exploit episodic rains (Barton & Montagu, 2006).
Table 2. Approximate average heights of tree plots planted at ages 14 months (August
1999), 24 months (June 2000), and 36 months (June 2001), all against control plots with
no mechanical soil preparation. Source: (Yamada et al., 2003)
Species Height at 14
months (cm)
Height at 24
months (cm)
Height at 36
months (cm)
Eucalyptus camaldulensis 160 280 450
Control 20 130 285
Eucalyptus lesouffei 20 120 210
Control 15 70 195
Eucalyptus torquata 120 150 195
Control 70 90 140
Eucalyptus salubris 30 110 190
Control 20 70 175
Eucalyptus griffithsii 30 100 190
Control 75 90 140
Acacia aneura 10 75 165
Control 10 80 150
Table 3. Tree stems ha-1
and biomass ha-1
, differentiated by height (Yamada et al., 1999)
Hydrology/ Site Topography
<4m
Height
Tree
Stems
(kg ha-1)
>4m
Height
Tress
Stems
(kg ha-1)
Total
Stems
(ha-1)
<4m
Height
Tree
Biomass
(kg ha-1)
>4m
Height
Tree
Biomass
(kg ha-1)
Total
Biomass
(kg ha-1)
Stream bank 155 205 360 1,068 86,807 87,875
Run on/natural depression 1,719 672 2,391 1,233 86,230 87,463
Run through/run off 6,750 0 6,750 610 0 610
Drainage line/run off 3,488 263 3,751 8,766 38,725 47,491
Road drain diversion 4,013 175 4,188 7,914 21,750 29,664
Broad drainage floor 1,500 1,825 3,325 14,553 87,396 101,949
The biomass C factor determined by Saito et al. (2004) and Yamada et al. (1999) for each
component of the tree was generally around 450 mgC gDM-1
(or 45% by DM) for species
Casuarina obesa, E. camaldulensis, Eucalyptus torquate, Eucalyptus lesouffei, Acacia
aneura, and Acacia tetragonophylla. This research used a Yamada et al. (1999) E.
camaldulensis C factor of 47.7% C DM-1
to approximate total project C biosequestration
potentials. Whilst over a 20 year period E. camaldulensis species are able to biosequester Nova S
cienc
e Pub
lishe
rs, In
c.
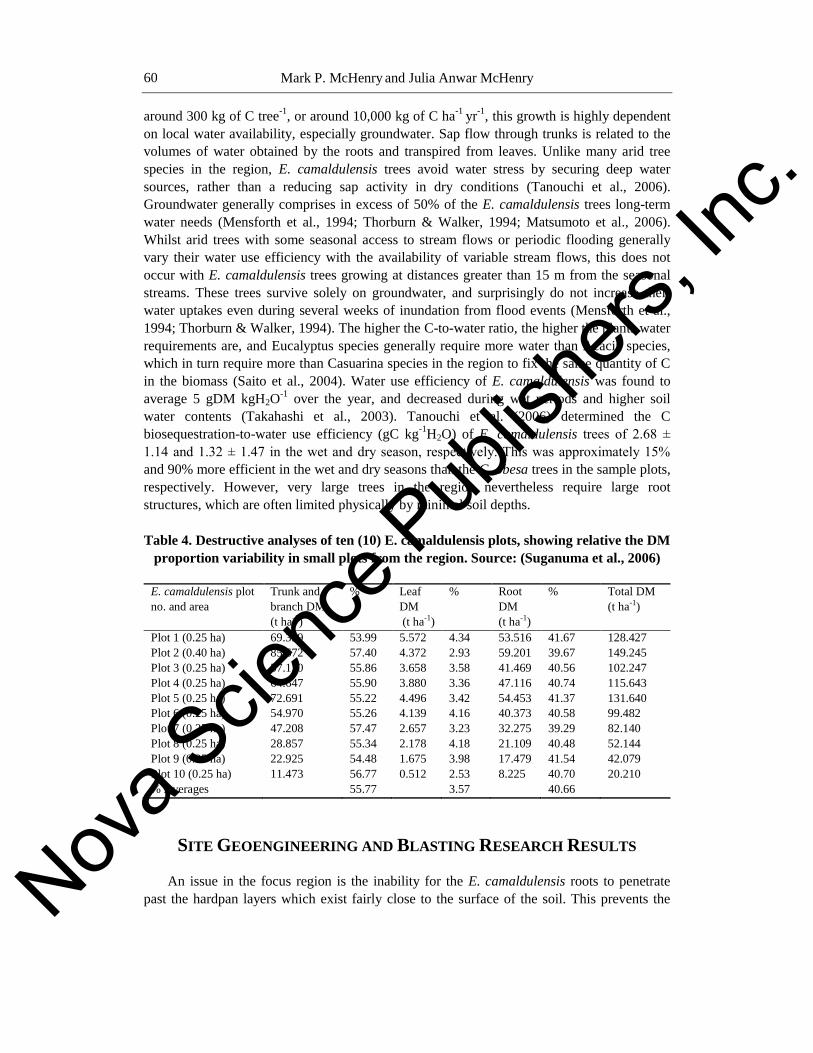
Mark P. McHenry and Julia Anwar McHenry 60
around 300 kg of C tree-1
, or around 10,000 kg of C ha-1
yr-1
, this growth is highly dependent
on local water availability, especially groundwater. Sap flow through trunks is related to the
volumes of water obtained by the roots and transpired from leaves. Unlike many arid tree
species in the region, E. camaldulensis trees avoid water stress by securing deep water
sources, rather than a reducing sap activity in dry conditions (Tanouchi et al., 2006).
Groundwater generally comprises in excess of 50% of the E. camaldulensis trees long-term
water needs (Mensforth et al., 1994; Thorburn & Walker, 1994; Matsumoto et al., 2006).
Whilst arid trees with some seasonal access to stream flows or periodic flooding generally
vary their water use efficiency with the availability of variable stream flows, this does not
occur with E. camaldulensis trees growing at distances greater than 15 m from the seasonal
streams. These trees survive solely on groundwater, and surprisingly do not increase their
water uptakes even during several weeks of inundation from flood events (Mensforth et al.,
1994; Thorburn & Walker, 1994). The higher the C-to-water ratio, the higher the plants water
requirements are, and Eucalyptus species generally require more water than Acacia species,
which in turn require more than Casuarina species in the region to fix the same quantity of C
in the biomass (Saito et al., 2004). Water use efficiency of E. camaldulensis was found to
average 5 gDM kgH2O-1
over the year, and decreased during wet periods and higher soil
water contents (Takahashi et al., 2003). Tanouchi et al. (2006) determined the C
biosequestration-to-water use efficiency (gC kg-1
H2O) of E. camaldulensis trees of 2.68 ±
1.14 and 1.32 ± 1.47 in the wet and dry season, respectively. This was approximately 15%
and 90% more efficient in the wet and dry seasons than the C. obesa trees in the sample plots,
respectively. However, very large trees in the region nevertheless require large root
structures, which are often limited physically by minimal soil depths.
Table 4. Destructive analyses of ten (10) E. camaldulensis plots, showing relative the DM
proportion variability in small plots from the region. Source: (Suganuma et al., 2006)
E. camaldulensis plot
no. and area
Trunk and
branch DM
(t ha-1)
% Leaf
DM
(t ha-1)
% Root
DM
(t ha-1)
% Total DM
(t ha-1)
Plot 1 (0.25 ha) 69.339 53.99 5.572 4.34 53.516 41.67 128.427
Plot 2 (0.40 ha) 85.672 57.40 4.372 2.93 59.201 39.67 149.245
Plot 3 (0.25 ha) 57.120 55.86 3.658 3.58 41.469 40.56 102.247
Plot 4 (0.25 ha) 64.647 55.90 3.880 3.36 47.116 40.74 115.643
Plot 5 (0.25 ha) 72.691 55.22 4.496 3.42 54.453 41.37 131.640
Plot 6 (0.25 ha) 54.970 55.26 4.139 4.16 40.373 40.58 99.482
Plot 7 (0.25 ha) 47.208 57.47 2.657 3.23 32.275 39.29 82.140
Plot 8 (0.25 ha) 28.857 55.34 2.178 4.18 21.109 40.48 52.144
Plot 9 (0.25 ha) 22.925 54.48 1.675 3.98 17.479 41.54 42.079
Plot 10 (0.25 ha) 11.473 56.77 0.512 2.53 8.225 40.70 20.210
% Averages 55.77 3.57 40.66
SITE GEOENGINEERING AND BLASTING RESEARCH RESULTS
An issue in the focus region is the inability for the E. camaldulensis roots to penetrate
past the hardpan layers which exist fairly close to the surface of the soil. This prevents the Nova S
cienc
e Pub
lishe
rs, In
c.

Indigenous-owned Pastoral Land Forestry Carbon Biosequestration ... 61
survival and growth of smaller trees into large trees which biosequester more C per unit area
(Yamada et al., 1999). The use of soil conditioners such as calcinated bauxite to increase
water holding capacities by increasing the soil surface area, was trialed in the area with some
success (Hamano et al., 2000b). Research by Hamano et al. (2000a) also explored soil
preparation methods that included drilling and fracturing the soil layer to break the hardpan
and to fill the hole with larger particles with high permeability and smaller intraparticles for
water retention. Ground preparation research by Yamada et al. (2003) simply using
explosives and the results described the growth and survival rates of trees planted for C
biosequestration in plots with the tree holes (5 m diameter blast and a 5 m blast depth) created
by dynamite against a control plot with no blasting. The researchers found that the additional
CO2-e emission created from the dynamite blast was only around one fortieth of the emissions
expected to be absorbed by the trees by maturity. Hardpan blasting research was also
undertaken by Shiono et al. (2006) with the equivalent of around 200 blast holes per ha, with
one tree planted per blast hole. Each blast was created with approximately 10 kg of
ammonium nitrate fuel oil explosive, and the resulting cracked hardpan blasted zone diameter
was on average 2.4 m, and the average depth penetration was around 2.6 m (Shiono et al.,
2006; Tanouchi et al., 2006). The survival ratios for the E. camaldulensis after blasting were
approximately double that of the control plots, and the growth rates were also found to be
improved (Shiono et al., 2006). Further geoengineering methods to increase water availability
include surface water diversion to create water harvesting embankments which also capture
eroded soil and nutrient runoff. Whilst series of embankments may reduce flows downstream,
it may mitigate the occurrence of flood events commonly caused by degraded upstream land
in the region while retaining local nutrients upstream (Abe et al., 2003). In terms of direct
geoengineering of lands to restore water infiltration and root penetration, additional trials are
needed to quantify the variety and impact of each mechanical manipulation for rehabilitation
of arid regions (Yamada et al., 1999).
C BIOSEQUESTRATION EXTRAPOLATIONS
The model used 200 surviving trees ha-1
as the basis behind the biomass and associated C
biosequestration potential. This was based on a tree planting density of around 300 ha-1
at an
estimated (medium-to-high) survival rate of 66%. The model assumed a more conservative
growth rate than the Yamada et al. (1999) research, and 8 kg C tree-1
yr-1
over the 15 year
interval was selected for the model2. This gave an average of 24 tC ha
-1, or 87.984 tCO2-e ha
-1
of aboveground biosequestration at 200 surviving stems ha-1
. Assuming 40.66% belowground
biomass based on research by Suganuma et al. (2006), and a consistent C content of both
below and aboveground biomass of 47.7% based on the Yamada et al. (1999) results, the total
biosequestration projection was 123.758 tCO2-e ha-1
over the 15 year interval. As the growth
and associated biosequestration of the stand would not be a constant 8 kgC yr-1
, the author
introduced a standardized tree growth model suitable for the tree species which sums to an
annual average biosequestration of 8 kg C tree-1
yr-1
over the full 15 year interval. Figures 4
and 5 show the sum of the above and belowground dry biomass and C biosequestration
2 This is half of the growth rate of the Yamada et al. (1999) research. Nova S
cienc
e Pub
lishe
rs, In
c.

Mark P. McHenry and Julia Anwar McHenry 62
projection profile of the tree stand over the 15 year interval on a per ha basis. The total
projected biosequestration for the 1,500 ha stand was 50,637 tC, or 185,635 tCO2-e.
Table 5. The model in table form of the projected scheduled annual discounted cashflow
calculations for establishing, maintaining, and verifying C biosequestered in a 1,500 ha
stand. (Total project NPC is in bold)
The 1,500 ha tree stand represents around 0.75% of the total area of the Cogla Downs
lease. These growth rates are based on soil geoengineering using only deep ripping using a
bulldozer to break up the hardpan to a depth of 1-1.5 m, and trees planted in holes dug to a
depth of slightly below the surrounding ground level as shown in Figure 6. Post planting
watering regimes were modeled to occur at planting, and twice each dry season for the first
two years to achieve the estimated 66% survival rates. These survival rates will be heavily
dependent on the season, and significantly less survival rates, even zero, may occur with Nova S
cienc
e Pub
lishe
rs, In
c.

Indigenous-owned Pastoral Land Forestry Carbon Biosequestration ... 63
insufficient watering regimes or grazing fencing. Figure 7 represents the same tree stand over
the 15 year interval with harvesting of an average of 3.27 t ha-1
of dry biomass (equivalent to
around 1.56 tC ha-1
) from the stand annually, commencing in the 6th
year. The annual stand C
biosequestration rate remains relatively high compared to the unharvested stand scenario due
to reduced tree competition approximated in the model. The annual harvest rate was chosen to
fulfill the requirements of the 20 t day-1
(16% moisture content) biorefinery demand, and is
roughly half of the total maximum potential harvest from the stand each year after the sixth
year. Figure 8 shows the dry biomass growth projection of the tree stand over 15 years, with
harvesting commencing in the sixth year.
Figure 4. Annual modeled changes in stand dry biomass growth rate (light grey, t ha-1
yr-1
), and total
dry biomass (dark grey, t ha-1
).
Figure 5. Annual modeled changes in stand C biosequestration rate (light grey, tC ha-1
yr-1
), and total C
biosequestration (dark grey, tC ha-1
). Nova S
cienc
e Pub
lishe
rs, In
c.
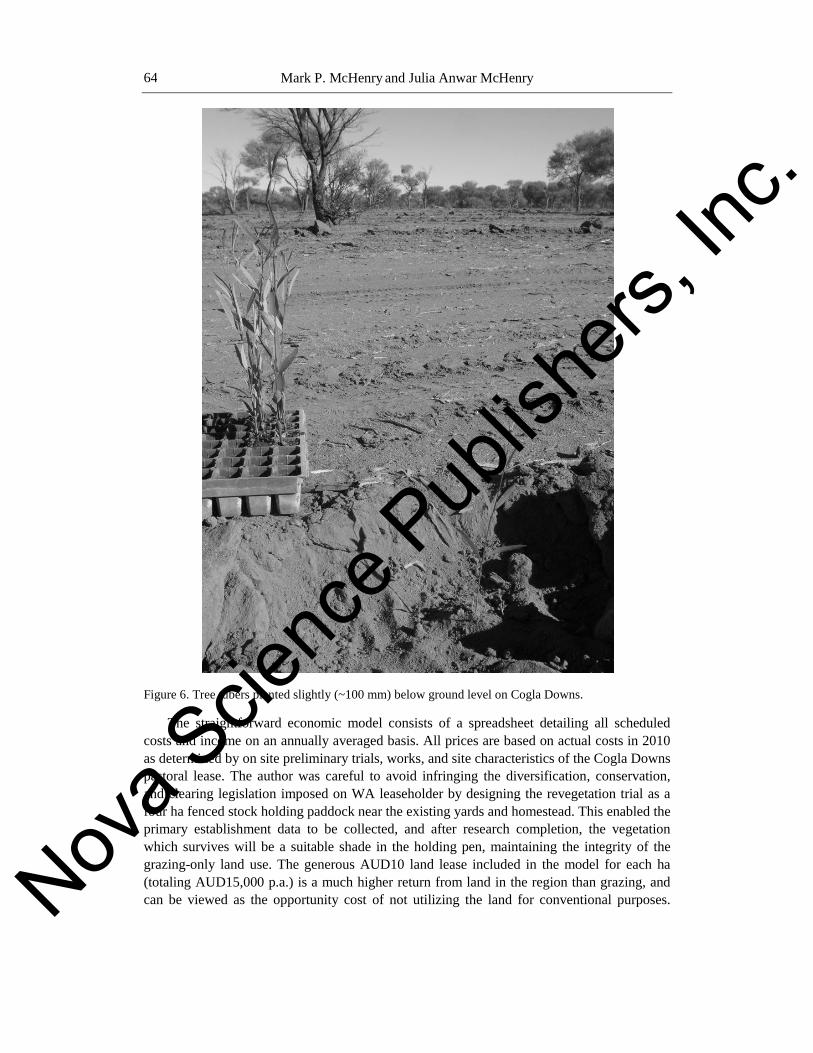
Mark P. McHenry and Julia Anwar McHenry 64
Figure 6. Tree tubers planted slightly (~100 mm) below ground level on Cogla Downs.
The straightforward economic model consists of a spreadsheet detailing all scheduled
costs and income on an annually averaged basis. All prices are based on actual costs in 2010
as determined by on site preliminary trials, works, and site characteristics of the Cogla Downs
pastoral lease. The author was careful to avoid infringing the diversification, conservation,
and clearing legislation imposed on WA leaseholder by designing the revegetation trial as a
four ha fenced stock holding paddock near the existing yards and homestead. This enabled the
primary establishment data to be collected, and after research completion, the vegetation
which survives will be a suitable shade in the holding pen, maintaining the integrity of the
grazing-only land use. The generous AUD10 land lease included in the model for each ha
(totaling AUD15,000 p.a.) is a much higher return from land in the region than grazing, and
can be viewed as the opportunity cost of not utilizing the land for conventional purposes. Nova S
cienc
e Pub
lishe
rs, In
c.

Indigenous-owned Pastoral Land Forestry Carbon Biosequestration ... 65
Leasing of pastoral land also currently requires a permit from the Pastoral Lands Board.
Where not available, prices were estimated using conservative costs based on the generally
high cost of transport, capital, and acquiring both skilled and unskilled labor in the region.
Table 5 shows the major activities occurring in each year in column two, and concisely
describes the assumptions behind each costing.
Figure 7. Annual modeled changes in the harvested stand C biosequestration rate (light grey, tC ha-1
yr-
1), and total C biosequestration (dark grey, tC ha
-1).
Figure 8. Annual modeled changes in the harvested stand dry biomass growth rate (light grey, tC ha-1
yr-1
), and total dry biomass accumulation (dark grey, tC ha-1
). Nova S
cienc
e Pub
lishe
rs, In
c.

Mark P. McHenry and Julia Anwar McHenry 66
Figure 9. The cumulative costs of the 1,500 project, discounted at a real 8% p.a.
Using a large bulldozer to deep rip the tree lines at around 1-1.5 m depth on the land
contour (to capture runoff and prevent erosion) required a speed of around three km hr-1
.
Ripping the rows at average widths of seven meters between rows and avoiding existing
vegetation where possible lead to the completion of one ha approximately every 15 minutes
of continuous operation, costing around AUD50 ha-1
at a AUD200 hr-1
contract rate (inc.
GST). Trees planted at approximately 4-5 m apart in the row, mostly in bare patches, yields
approximately 300 stems ha-1
. The planting cost ha-1
included using a stand-on “kanga
digger” articulated drilling arm to break up the ripped clods of generally dry earth to create a
soft soil hole of approximately 0.45 m diameter and 0.2 m deep in the deep ripped line. The
hole preparation makes the use of a hand held tube tree planter feasible, conservatively taking
two people around 3.5 hrs to prepare and plant one ha of E. camaldulensis tubers using the
“kanga digger” and tree planter in combination. The assumed time included “watering-in” of
trees using a standard ute-mounted fire-fighter tank and petrol-powered pump. The modeled
planting regime was based on four teams of two workers, working 37.5 hrs in a week, taking
around 36 weeks to complete the entire 1,500 ha revegetation site, avoiding working in the
hottest months (December to February). All establishment emissions were excluded from the
project mitigation potential calculations, as they are relatively minor. The planting costs
occurred in year zero in the model, and were based on a simple AUD210 payment ha-1
,
reflecting the above calculations paid at the equivalent of a AUD30 hr-1
wage. The fertilizer
calculations were based on two applications (in year one and two) of 775 g MAP per tree,
scattered slightly away from the stem in the hole. The fertilizer cost was assumed to be
AUD800 t-1
delivered, based on the scale of the requirements of around 700 t total MAP for
the applications over the two years delivered to the remote site. Figure 9 shows the
cumulative discounted costs of the project over the 15 year interval.
The market potential of the project was calculated by dividing the projected total NPC
(AUD2,847,916) by the total projected mitigation potential (185,635 tCO2-e) for the
unharvested 1,500 ha stand to determine a C credit price that the project will require to break
even. Assuming all C biosequestered was forward sold in year zero, the minimum breakeven
price of AUD15.34 tCO2-e-1
is required by the project proponent. Any additional C price, Nova S
cienc
e Pub
lishe
rs, In
c.

Indigenous-owned Pastoral Land Forestry Carbon Biosequestration ... 67
biosequestration yield, or cost increase/decrease is to the advantage/detriment of the project
proponent and/or investors. This relatively low C price required, combined with the relatively
conservative biomass growth yields when compared to the peer-reviewed literature is a
promising finding. Furthermore, many of the “costs” involved in the tree propagation, stand
establishment, and land management are themselves opportunities for small-scale business
operators, which require only moderate capital outlays, skill and labor requirements
appropriate for many remote arid areas of Australia, which may not require full-time on-site
involvement.
BIOREFINERY MODELLING RESULTS AND DISCUSSION
In contrast to the relatively clear-cut task of establishing and maintaining a tree
revegetation project, developing and operating a bioenergy facility requires highly skilled
individuals, maintaining system logistics and input/output flows full-time, and entails high
CAPEX, and medium OPEX. The modeled system was designed to displace current fossil
fuel-based mineral diesel fuel, and fossil fuel electricity demand of a theoretical facility in the
region with 100% renewable biodiesel and electricity. Additional investment value was
derived from Renewable Energy Certificates (RECs), representing 1 MWh of certified
renewable electricity production, and activated C sales. The technology proposed for the
model was based on technical specifications provided to the author by the technology
supplier3. The technology, sometimes known as a biorefinery, can utilize various biomass
inputs other than vegetative forestry or agricultural wastes, including municipal solid waste,
plastics, tyres, paper, animal products (etc.), in addition to the active removal of contaminants
(usually heavy metals) from the direct processing of soils. Technologies such as these would
enable processing of waste materials co-fired alongside the primary input of harvested,
chipped, and dried E. camaldulensis biomass, derived from sustainable harvesting of the
1,500 ha revegetation project. If alternative waste/biomass sources are used as inputs, this will
displace the equivalent wood requirement, as each alternative waste source will exhibit a
different LHV.
The specific biorefinery selected for this research was based on a two-step process of
anaerobic gasification to produce syngas, which is converted to a commercial grade biodiesel
by Fischer-Tropsch synthesis. The offgas from the Fischer-Tropsch process is used for direct
electricity generation. See Figure 10 for a basic flow diagram of the system. The model
assumed 20 t day-1
wood-only input at 16% moisture content, representing 16.8 t day-1
DM
biomass input. On an annual basis at a capacity factor of 0.8 (or 292 days yr-1
) a total average
of 4,905.6 t of DM biomass, or 3.27 tDM ha-1
year-1
from the 1,500 ha project was harvested
for bioenergy. In the model, the 20 t day-1
wood chips, yield around 3,470 L day-1
of
biodiesel, a net export of 350 kW of electricity, 0.4 t day-1
solid residues consisting of
activated C produced at 1,100 oC with steam, alongside some inactivated C and minor ash
components. The thermal waste exhaust energy of 64,601 MJ day-1
was used to dry the wood
3 Since this research was undertaken, the technology provider no longer offers this commercial unit, and has asked
to remain anonymous. Whilst this technically renders this research hypothetical rather than a pre-commercial
feasibility study, this experience is indicative of many relatively immature renewable energy systems at present.
Nonetheless, many new scalable bioenergy conversion technologies are currently under development, and have
the potential to reduce capital costs and increase conversion efficiencies significantly. Nova S
cienc
e Pub
lishe
rs, In
c.
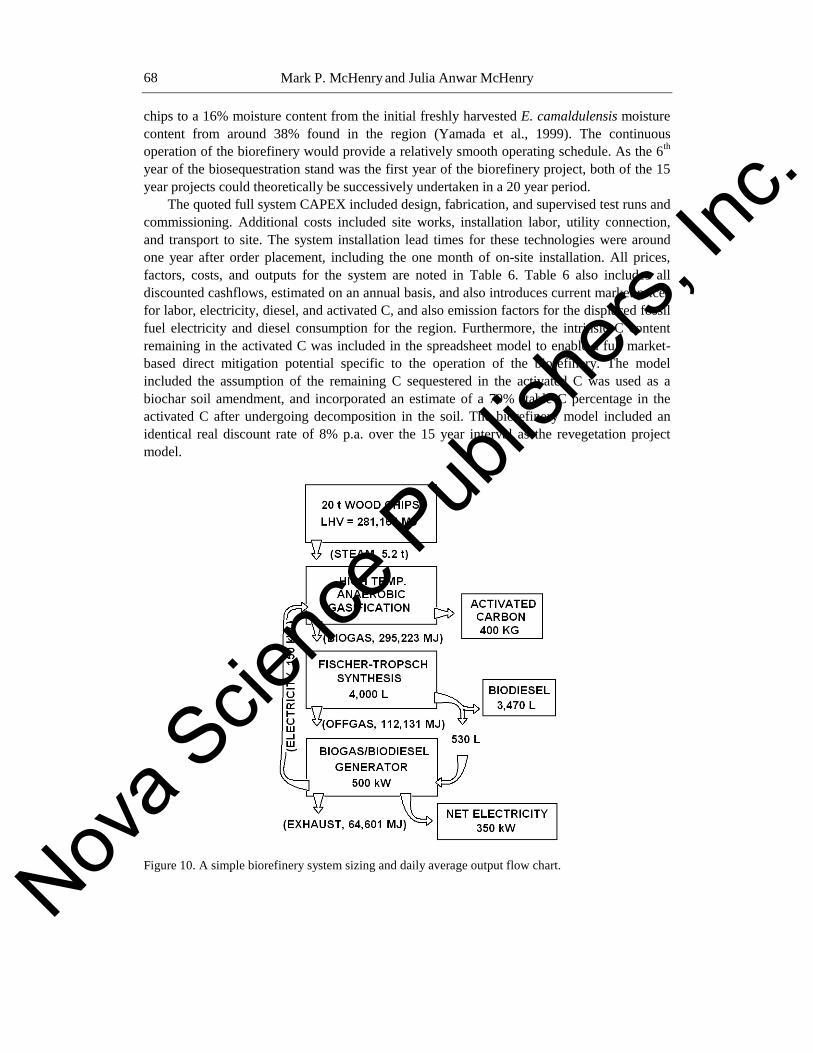
Mark P. McHenry and Julia Anwar McHenry 68
chips to a 16% moisture content from the initial freshly harvested E. camaldulensis moisture
content from around 38% found in the region (Yamada et al., 1999). The continuous
operation of the biorefinery would provide a relatively smooth operating schedule. As the 6th
year of the biosequestration stand was the first year of the biorefinery project, both of the 15
year projects could theoretically be successively undertaken in a 20 year period.
The quoted full system CAPEX included design, fabrication, and supervised test runs and
commissioning. Additional costs included site works, installation labor, utility connection,
and transport to site. The system installation lead times for these technologies were around
one year after order placement, including the one month of on-site installation. All prices,
factors, costs, and outputs for the system are noted in Table 6. Table 6 also includes all
discounted cashflows, estimated on an annual basis, and also introduces current market prices
for labor, electricity, diesel, and activated C, and also emission factors for the displaced fossil
fuel electricity and diesel consumption for the region. Furthermore, the intrinsic C content
remaining in the activated C was included in the spreadsheet model to enable a full market-
based direct mitigation potential specific to the operation of the biorefinery. The model
included the assumption of the remaining C sequestered in the activated C was used as a
biochar soil amendment, and incorporated an estimate of a 70% stable C percentage in the
activated C after undergoing decomposition in the soil. The biorefinery model included an
identical real discount rate of 8% p.a. over the 15 year interval as the revegetation project
model.
Figure 10. A simple biorefinery system sizing and daily average output flow chart. Nova S
cienc
e Pub
lishe
rs, In
c.
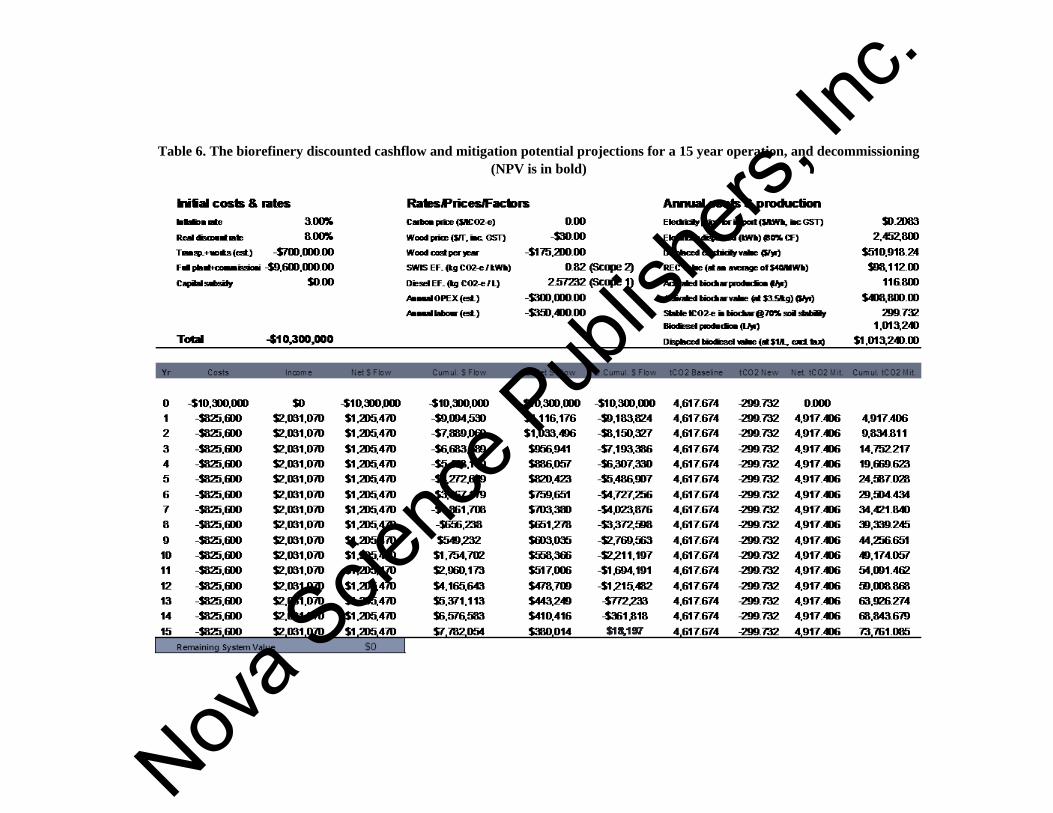
Table 6. The biorefinery discounted cashflow and mitigation potential projections for a 15 year operation, and decommissioning
(NPV is in bold)
Nova S
cienc
e Pub
lishe
rs, In
c.
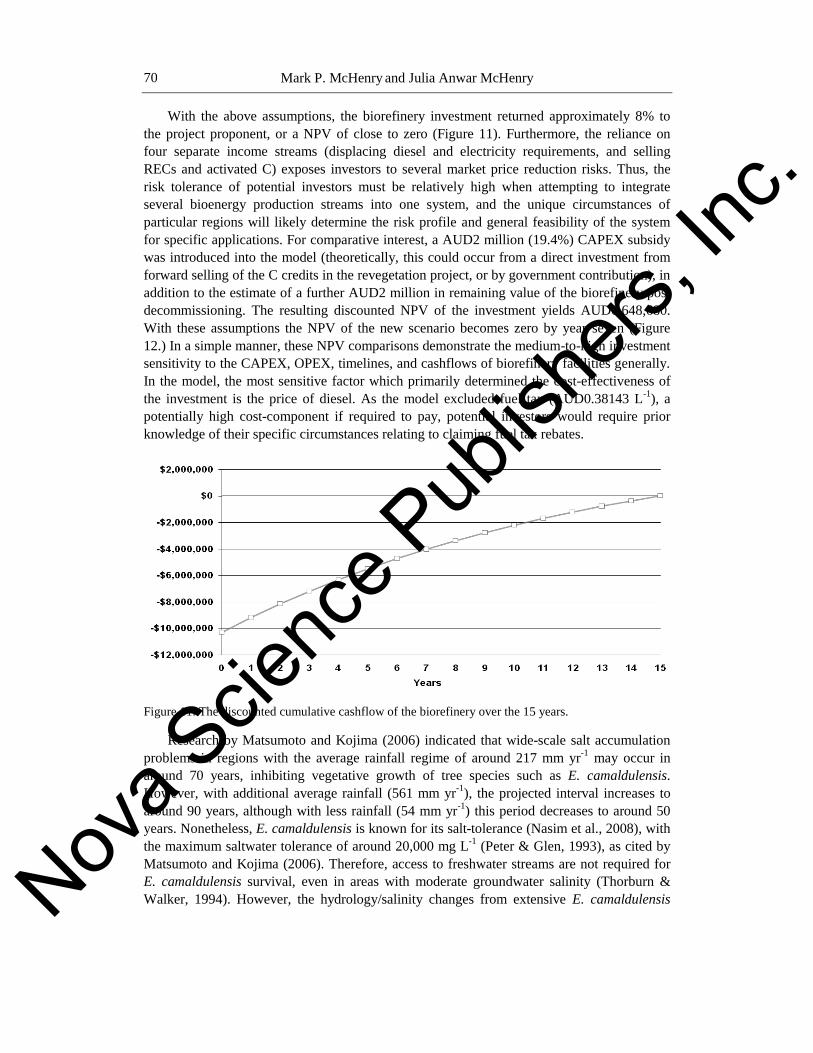
Mark P. McHenry and Julia Anwar McHenry 70
With the above assumptions, the biorefinery investment returned approximately 8% to
the project proponent, or a NPV of close to zero (Figure 11). Furthermore, the reliance on
four separate income streams (displacing diesel and electricity requirements, and selling
RECs and activated C) exposes investors to several market price reduction risks. Thus, the
risk tolerance of potential investors must be relatively high when attempting to integrate
several bioenergy production streams into one system, and the unique circumstances of
particular regions will likely determine the risk profile and general feasibility of the system
for specific applications. For comparative interest, a AUD2 million (19.4%) CAPEX subsidy
was introduced into the model (theoretically, this could occur from a direct investment from
forward selling of the C credits in the revegetation project, or by government contribution), in
addition to the estimate of a further AUD2 million in remaining value of the biorefinery post
decommissioning. The resulting discounted NPV of the investment yields AUD6,648,680.
With these assumptions the NPV of the new scenario becomes zero by year seven (Figure
12.) In a simple manner, these NPV comparisons demonstrate the medium-to-high investment
sensitivity to the CAPEX, OPEX, timelines, and cashflows of biorefinery facilities generally.
In the model, the most sensitive factor which primarily determined the cost-effectiveness of
the investment is the price of diesel. As the model excluded fuel tax (AUD0.38143 L-1
), a
potentially high cost-component if required to pay, potential investors would require prior
knowledge of their specific circumstances relating to claiming fuel tax rebates.
Figure 11. The discounted cumulative cashflow of the biorefinery over the 15 years.
Research by Matsumoto and Kojima (2006) indicated that wide-scale salt accumulation
problems in regions with the average rainfall regime of around 217 mm yr-1
may occur in
around 70 years, inhibiting vegetative growth of tree species such as E. camaldulensis.
However, with additional average rainfall (561 mm yr-1
), the projected interval increases to
around 90 years, although with less rainfall (54 mm yr-1
) this period decreases to around 50
years. Nonetheless, E. camaldulensis is known for its salt-tolerance (Nasim et al., 2008), with
the maximum saltwater tolerance of around 20,000 mg L-1
(Peter & Glen, 1993), as cited by
Matsumoto and Kojima (2006). Therefore, access to freshwater streams are not required for
E. camaldulensis survival, even in areas with moderate groundwater salinity (Thorburn &
Walker, 1994). However, the hydrology/salinity changes from extensive E. camaldulensis Nova S
cienc
e Pub
lishe
rs, In
c.
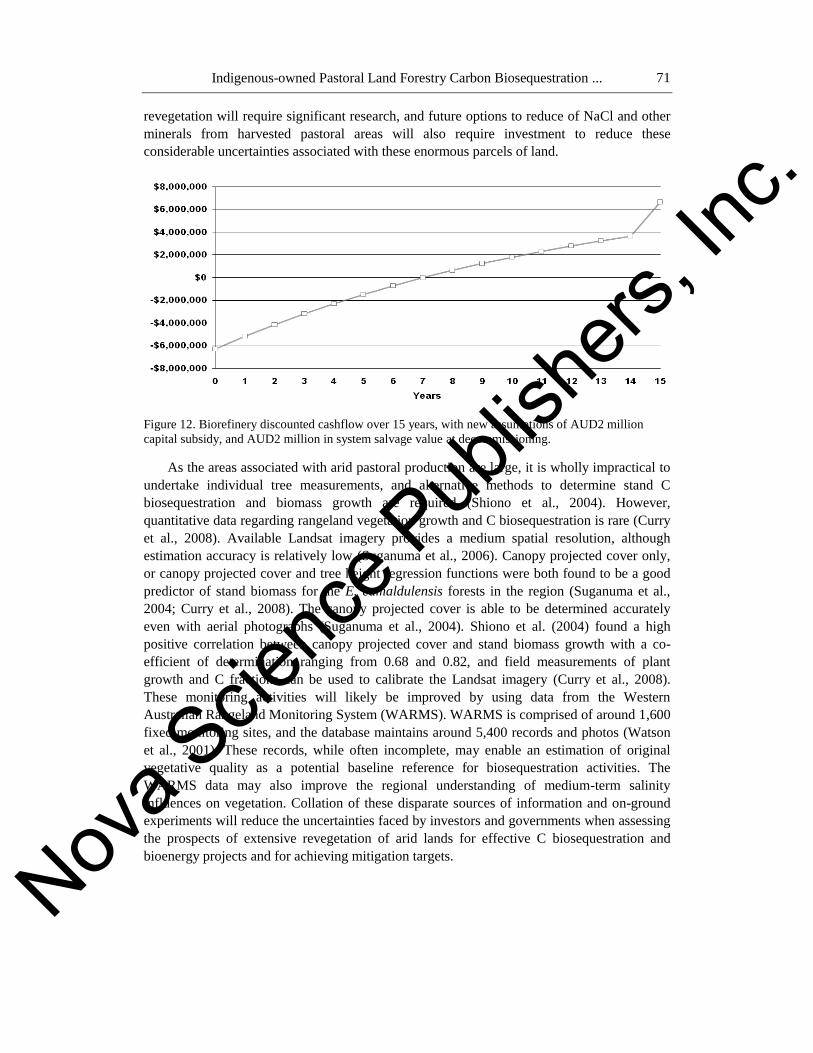
Indigenous-owned Pastoral Land Forestry Carbon Biosequestration ... 71
revegetation will require significant research, and future options to reduce of NaCl and other
minerals from harvested pastoral areas will also require investment to reduce these
considerable uncertainties associated with these enormous parcels of land.
Figure 12. Biorefinery discounted cashflow over 15 years, with new assumptions of AUD2 million
capital subsidy, and AUD2 million in system salvage value at decommissioning.
As the areas associated with arid pastoral production are large, it is wholly impractical to
undertake individual tree measurements, and alternative methods to determine stand C
biosequestration and biomass growth are required (Shiono et al., 2004). However,
quantitative data regarding rangeland vegetation growth and C biosequestration is rare (Curry
et al., 2008). Available Landsat imagery provides a medium spatial resolution, although
estimation accuracy is relatively low (Suganuma et al., 2006). Canopy projected cover only,
or canopy projected cover and tree height regression functions were both found to be a good
predictor of stand biomass for the E. camaldulensis forests in the region (Suganuma et al.,
2004; Curry et al., 2008). The canopy projected cover is able to be determined accurately
even with aerial photographs (Suganuma et al., 2004). Shiono et al. (2004) found a high
positive correlation between canopy projected cover and stand biomass growth with a co-
efficient of determination ranging from 0.68 and 0.82, and field measurements of plant
growth and C fractions can be used to calibrate the Landsat imagery (Curry et al., 2008).
These monitoring activities will likely be improved by using data from the Western
Australian Rangeland Monitoring System (WARMS). WARMS is comprised of around 1,600
fixed monitoring sites, and the database maintains around 5,400 records and photos (Watson
et al., 2001). These records, while often incomplete, may enable an estimation of original
vegetative quality as a potential baseline reference for biosequestration activities. The
WARMS data may also improve the regional understanding of medium-term salinity
influences on vegetation. Collation of these disparate sources of information and on-ground
experiments will reduce the uncertainties faced by investors and governments when assessing
the prospects of extensive revegetation of arid lands for effective C biosequestration and
bioenergy projects and for achieving mitigation targets.
Nova S
cienc
e Pub
lishe
rs, In
c.
Mark P. McHenry and Julia Anwar McHenry 72
CONCLUSION
Assuming grazing lands in WA are able to biosequester 8 tC ha-1
yr-1
for 15 years, a
mitigation potential of 121,275,000 tCO2-e can be achieved if only 1% of the 98 million ha of
grazed pastoral lands were revegetated. The average annual WA emissions over the next 15
years are projected to be approximately 80,000,000 tCO2-e, and a 1% land use change from
grazing to revegetation in pastoral WA could roughly mitigate 10% of the total WA state
emissions over the 15 years. At an approximate value of AUD15 tCO2-e-1
, this potential
represents around AUD1.8 billion in gross revenue flowing into remote and pastoral regions
over the 15 years, a major new source of income for regional WA. This opportunity,
especially for understocked Indigenous owned pastoral leases like Cogla Downs, is an
entirely new means of increasing productivity, enabling many small-scale synergistic
entrepreneurial opportunities and associated meaningful jobs outside of social welfare system.
Many of these land management activities are synergistic with existing Indigenous cultural
tourism development initiatives in remote Australia. Finally, this research indicates that
further research and development is required to reduce technical and economic uncertainties
by focusing on the impacts of major changes to physical flows of C, energy, water, and
elemental compositions in pastoral ecosystems of WA. However, as all WA pastoral leases
expire on the 30 June 2015, the fate of new lease activities and lease holders themselves
remains uncertain, and a decrease in administrative barriers to pastoral diversification may
facilitate greater local innovation.
ACKNOWLEDGEMENTS
Thanks to John Law for passing on the majority of the published reference material. Also
thanks to Dave, Danny, Kylie, and the kids for helping us clean up the site, drive in pickets
and posts, and straining the fence and watering trees while we constructed and planted.
Thanks to Brendin Flanigan, Wayne McDonald, and Robert McEachern at the Mid West
Development Commission, and Alan Thompson and Ron Bradfield from Yulella for your
assistance in supporting the revegetation trial.
REFERENCES
Abe, Y., Taniguchi, M., Suganuma, H., Saito, M., Kojima, T., Egashira, Y., Yamamoto, Y.,
& Yamada, K. (2003). Comparative analysis between biomass and topographic features
in arid land, Western Australia. Journal of Chemical Engineering of Japan, 36(4), 376-
382.
Barton, C. V., & Montagu, K. D. (2006). Effect of spacing and water availability on
root:shoot ratio in Eucalyptus camaldulensis. Forest Ecology and Management, 221(1-3),
52-62.
Curry, P., Zdunic, K., Wallace, J., & Law, J. (2008). Landsat monitoring of woodland
regeneration in degraded mulga rangelands: implications for arid landscapes managed
for carbon sequestration. Paper presented at the 14th ARSPC, Darwin. Nova S
cienc
e Pub
lishe
rs, In
c.
Indigenous-owned Pastoral Land Forestry Carbon Biosequestration ... 73
Egashira, Y., Tomii, D., Ueyama, K., Takahashi, N., Kojima, T., Abe, T., Saijo, T., &
Yamada, K. (2003). Development of integrated simulator of water transport and plant
growth as an evaluation tool for arid land afforestation of CO2 fixation. Journal of
Chemical Engineering of Japan, 36(4), 383-390.
Hamano, H., Egashira, Y., & Kojima, T. (2000a). Numerical prediction of water movement in
Western Australian soil for large scale afforestation. Journal of Arid Land Studies, 10S,
25-28.
Hamano, H., Kato, S., Shimizu, T., Kojima, T., & Yamada, K. (2000b). A study on
possibility of bauxite utilization to improve soil properties for afforestation of arid land.
Journal or Arid Land Studies, 10S, 81-84.
Hirukawa, T., Asaka, N., Hamano, H., Yamada, K., & Kojima, T. (2006). A modelling
methodology of large scale water balance and salt accumulation for afforestation in arid
land. Journal of Arid Land Studies, 15(4), 247-250.
Matsumoto, M., Kato, S., Abe, T., & Kojima, T. (2006). Estimation of water availability
condition for afforestation in desert of Western Australia using carbon stable isotope ratio
analysis Journal of Arid Land Studies, 15(4), 243-246.
Matsumoto, M., & Kojima, T. (2006). Simulations of salt accumulation at soil surface under
different annual precipitation amounts in arid Leonora area, Western Australia. Journal
of Arid Land Studies, 16(1), 53-60.
McHenry, M. P. (2009a). Agricultural bio-char production, renewable energy generation and
farm carbon sequestration in WA: Certainty, uncertainty & risk. Agriculture, Ecosystems
and Environment, 129, 1–7.
McHenry, M. P. (2009b). Policy options when giving negative externalities market value:
Clean energy policymaking and restructuring the Western Australian energy sector.
Energy Policy, 37, 1423-1431.
McHenry, M. P. (2009c). Remote area power supply system technologies in Western
Australia: New developments in 30 years of slow progress. Renewable Energy, 34, 1348-
1353.
McHenry, M. P. (2009d). Why are remote Western Australians installing renewable energy
technologies in stand-alone power supply systems? Renewable Energy, 34, 1252-1256.
McHenry, M. P. (2010). Carbon-based stock feed additives: a research methodology that
explores ecologically delivered C biosequestration, alongside live-weights, feed-use
efficiency, soil nutrient retention, and perennial fodder plantations. Journal of the Science
of Food and Agriculture, 90, 183-187.
McHenry, M. P. (2011). Australian carbon biosequestration and clean energy policy market
co-evolution: Mechanisms, mitigation, and convergence. Australian Forestry Journal,
75(2) 901-913.
McHenry, M. P. (2012a). Australian carbon biosequestration and bioenergy policy co-
evolution: mechanisms, mitigation, and convergence. Australian Forestry Journal 75(2),
901-913.
McHenry, M. P. (2012b). Harnessing landholder‟s knowledge for efficient environmental
monitoring, accounting, and management for new environmental markets: lessons from
plantation forestry carbon sequestration in Western Australia. In: TBA (Ed.), Plantations:
Seasonal variation, growth and ecological impacts. Hauppauge, USA Nova Science
Publishers. Nova S
cienc
e Pub
lishe
rs, In
c.
Mark P. McHenry and Julia Anwar McHenry 74
McHenry, M. P. (2012c). Hybrid microalgal biofuel, desalination, and solution mining
systems: increased industrial waste energy, carbon, and water use efficiencies. Mitigation
and Adaptation Strategies for Global Change, DOI: 10.1007/s11027-012-9361-y.
McHenry, M. P. (2012d). Practicalities of establishing forestry carbon sequestration projects
in the agricultural sector: a technical and economic analysis with implications. In: B. J.
Ryan & D. E. Anderson (Eds.), Carbon sequestration: technology, measurement
technologies and environmental effects. Hauppauge, New York, USA: Nova Science
Publishers. 978-1-62081-081-7.
McHenry, M. P. (2012e). Small-scale (≤6 kWe) stand-alone and grid-connected photovoltaic,
wind, hydroelectric, biodiesel, and wood gasification system‟s simulated technical,
economic, and mitigation analyses for rural regions in Western Australia. Renewable
Energy, 38, 195-205.
McHenry, M. P. (2013). How farming and forestry converge: enhancing the interface between
agricultural production, and tree biomass/bioenergy systems to improve farm-scale
productivity in Western Australia. In: M. C. Allard (Ed.), Bioenergy systems, biological
sources and environmental impact. Hauppauge, New York, USA: Nova Science
Publishers. 978-1-62417-330-1.
Mensforth, L. J., Thorburn, P. J., Tyerman, S. D., & Walker, G. R. (1994). Sources of water
used by riparian Eucalyptus camaldulensis overlying highly saline groundwater.
Oecologia, 100, 21-28.
Nasim, M., Qureshi, R. H., Aziz, T., Saqib, M., Nawaz, S., Talib Sahi, S., & Pervaiz, S.
(2008). Growth and composition of salt-stressed Eucalyptus camaldulensis and
Eucalyptus tereticornis. Pakistan Journal of Botany, 40(2), 799-805.
Payne, A. L., Van Vreeswyk, A. M. E., Pringle, H. J. R., Leighton, K. A., & Hennig, P.
(1998). An inventory and condition survey of the Sandstone-Yalgoo-Paynes Find area,
Western Australia. Technical Bulletin No. 90. Perth, Western Australia: Department of
Agriculture, Western Australia.
Peter, J. T., & Glen, R. W. (1993). The source of water transpired by Eucalyptus
camaldulensis: soil, groundwater, or stream? In: Stable isotope and plant carbon-water
relations (pp. 511-527). San Diego: Academic Press Inc.
Rengasamy, P. (2006). Wold salinization with emphasis on Australia. Journal of
Experimental Botany, 57(5), 1017-1023.
Saito, N., Kojima, T., Kato, S., Hamano, H., Yamada, K., & Takahashi, F. (2004).
Water/carbon ratio measurement for selection of trees to fix carbon by arid land
afforestation (pp. 6): Seikei University and Shinshu University.
Shiono, K., Kanri, Y., Abe, Y., Tanouchi, H., Kojima, T., & Yamada, K. (2004). Stand
growth estimation of representative plant communities in arid land of Western Australia.
Journal of Arid Land Studies, 14S, 207-210.
Shiono, K., Suganuma, H., Abe, Y., Tanouchi, H., Utsugi, H., Saito, M., Takahashi, N.,
Kojima, T., & Yamada, K. (2006). Biomass growth estimation of an afforestation site and
natural forests in an arid land of Western Australia. Journal of Arid Land Studies, 15(4),
251-254.
Suganuma, H., Abe, Y., Taniguchi, M., Saito, M., & Yamada, K. (2004). Fundamental
research on detection of stand biomass change in an arid rangeland. Journal of Arid Land
Studies, 14S, 85-88. Nova S
cienc
e Pub
lishe
rs, In
c.
Indigenous-owned Pastoral Land Forestry Carbon Biosequestration ... 75
Suganuma, H., Abe, Y., Taniguchi, M., Tanouchi, H., Utsugi, H., Kojima, T., & Yamada, K.
(2006). Stand biomass estimation method by canopy coverage for application to remote
sensing in an arid area of Western Australia. Forest Ecology and Management, 222, 75-
87.
Takahashi, N., Tahara, K., Utsugi, H., Kojima, T., Egashira, Y., Abe, Y., Saito, M., &
Yamada, K. (2003). Water use efficiency of Eucalyptus camaldulensis growing in arid
regions in Western Australia. Journal of Chemical Engineering of Japan, 36(4), 391-400.
Tanouchi, H., Utsugi, H., Takahashi, N., Hamano, H., Kawarasaki, S., Kojima, T., &
Yamada, K. (2006). Water use efficiency of trees in arid lands: plasticity to water
conditions. Journal of Arid Land Studies, 15(4), 267-270.
Thorburn, P. J., & Walker, G. R. (1994). Variations in stream water uptake by Eucalyptus
camaldulensis with differing access to stream water. Oecologia, 100, 293-301.
Watson, I., Blood, D., Novelly, P., Thomas, P., & van Vreeswyk, S. (2001). Rangeland
monitoring, resource inventory, condition assessment and lease inspection activities in
Western Australia conducted by the Department of Agriculture. Report prepared for the
Rangeland Theme of the National Land and Water Resources Audit. Version 1.0. Perth,
Western Australia: Department of Agriculture, Western Australia.
Yamada, K., Kojima, T., Abe, Y., Saito, M., Egashira, Y., Takahashi, N., Tahara, K., & Law,
J. (2003). Restructuring and afforestation of hardpan to sequester carbon. Journal of
Chemical Engineering of Japan, 36(3), 328-332.
Yamada, K., Kojima, T., Abe, Y., Williams, A., & Law, J. (1999). Carbon sequestration in an
arid environment near Leonora, Western Australia. Journal of Arid Land Studies, 9(2),
143-151.
Nova S
cienc
e Pub
lishe
rs, In
c.

Nova S
cienc
e Pub
lishe
rs, In
c.
In: Plantations ISBN: 978-1-60876-576-8
Editor: Ren Hai © 2013 Nova Science Publishers, Inc.
Chapter 5
HARNESSING LANDHOLDER’S KNOWLEDGE FOR
ENVIRONMENTAL MONITORING AND MANAGEMENT
FOR NEW ENVIRONMENTAL MARKETS:
LESSONS FROM PLANTATION FORESTRY CARBON
SEQUESTRATION IN WESTERN AUSTRALIA
Mark P. McHenry* Faculty of Minerals and Energy, Murdoch University, Western Australia
ABSTRACT
Leveraging limited environmental monitoring and management funding using
landholder knowledge and capacity can reduce total costs of implementing plantation
forestry environmental market mechanisms by both reducing duplication and enhancing
on-ground activities to assimilate environmental and production system decisionmaking.
This chapter explores the integration of high accuracy on-site vegetative and ecological
methods and metrics (on-site verification, allometrics, expansion factors, carbon factors,
root-to-shoot ratios, etc.) into landscape and macro-scale plantation carbon and land
monitoring models to assist the development of innovative ecosystem service markets
derived from forestry plantation and carbon sequestration developments. Several
limitations of current methods and policies are outlined, requiring primarily information
tools and communication pathways to redress, opening the possibility for formally
capturing lifetimes of local landholder knowledge of forestry land use and environmental
system changes. This work suggests parallel advancements of on-site landholder and
remote land monitoring and management has the potential to achieve a multitude of
efficiencies. These include: cost-effective skilled environmental management jobs in
regional and remote areas; streamlined administration and research expenditures for on-
site environmental monitoring and supporting costs (transport, accommodation, etc.);
locally appropriate conservation activities sustained over time, and; direct communication
between landholders, researchers, and policymakers.
* Corresponding Author address Murdoch University, 90 South St Murdoch, Western Australia, 6150. Email:
[email protected]. Nova S
cienc
e Pub
lishe
rs, In
c.
Mark P. McHenry 78
Keywords: Land; biomass; allometry; modelling; policy; plantation forestry
INTRODUCTION
Emerging climate change, carbon (C), biodiversity, and water markets bring to attention
the multitude of functions that ecological systems perform (Fromm, 2000; Griffiths et al.,
2000; Nunes & van den Bergh, 2001; Australian Greenhouse Office, 2006). While
afforestration, reforestation, or revegetation seem to offer a simple prescriptive solution to
achieve environmental and climate change objectives from a policymakers perspective, those
on the land must manage a range of complex biological processes that compete for limited
resources (Van Vreeswyk et al., 2004). By aiming to simultaneously improve land
productivity, biodiversity, water quality (etc.), and mitigate greenhouse gas (GHG) emissions,
progress can be made where transdisciplinary government and landholder objectives overlap
(Antheaume, 2004).
On-site physical ecological accounting by inhabitants at the landscape level provide
calibration and verification of satellite monitoring and model assessment methods, enhance
quantitative analyses of vegetative physical characteristics, and offer first-hand
multigenerational knowledge of the land (Landsberg & Crowley, 2004; Balilla et al., 2012).
Landholder on-site accounting presents a relatively simple method to monitor changes in
complex ecological functions that bolster effective environmental market development. For
example, biomass, C, surface or groundwater, vapour, heat, or endemic species (etc.) fluxes
may be used as proxy indicators that markets can deem to represent functional ecosystem
changes at the landscape level. However, such deeming mechanisms may be imprecise,
exhibit many approximations, assumptions, and conceal uncertainty in complex biological
responses to change, and high uncertainties in real values generally result in lower market
values for deeming activities and products (McHenry, 2009b, 2010, 2011). Nonetheless, the
two crucial points in relation to deeming are essentially economic in nature: the net value of
deeming market participation to private landholders, and the administrative efficiency of
„soft‟ approaches that capture landholder capacity to protect public goods at the landscape
scale. Essentially, deeming may be an imperfect mechanism, but it need not be inaccurate or
an expensive market mechanism to tip the balance towards better land use policy outcomes.
In terms of new C markets, to effectively engage landholders to invest in changing the
productive balance of their land requires knowledge of the sequestration potential of specific
species and the likely costs and benefits to their existing production systems (McHenry,
2009a). New suites of tree species will influence the lands groundwater tables, stream flows,
weed and fauna management regimes, fire control measures, and the landowner‟s economic
situation (Clifton et al., 2007). Planning for new complex activities requires a very high
resolution of often site-specific biological, geological, sociological, and economic
information. While larger regional or landscape scale site models can broadly inform land use
change (LUC) policymakers and researchers regionally, in practice there is often little
reciprocal communication with those who actively manage and live on the land. Such
inhabitants will likely be able to enhance the appropriateness of input data, assumptions and
refine resulting policy outputs and conclusions. Nova S
cienc
e Pub
lishe
rs, In
c.
Harnessing Landholder‟s Knowledge for Environmental Monitoring ... 79
To sustainably operate at the landscape scale, landholders require very high resolution
and extremely reliable information with a focus on seasonal fluxes and environmental
extremes, rather than annually averaged data. Of particular interest to landholders are the
maintenance and thresholds of critical systems that sustain productivity, and often use
specific indicator species characteristics to monitor biological responses to seasonal and
annual landscape change. Thus seasonally differentiated functional ecosystem change datasets
are a fundamentally appropriate foundation for researchers and policymakers to develop and
maintain (Landsberg & Crowley, 2004; Stoneham, 2009). While potentially more costly
initially, information systems and models with multiple utilities will have a greater reciprocal
value to land managers, government planners, and industry security generally in periods of
increased climatic variability than much of the annually averaged data currently generated
and used. Market mechanisms can be harnessed to attract new investment to either directly or
indirectly assist the ability of governments to initiate the collaborative development of
monitoring and verification activities. However, investors will require certainty a priori
(Stoneham, 2009).
New markets will likely create new land ownership rights to maintain investor certainty.
Thus, landholders will also require long-term certainty regarding possible claims of rights to
the land from governments, ecological product holders, and how a diversified ownership
structure may influence their livelihood. In 2003, the Western Australian Parliament passed
the Carbon Rights Act 2003, which gave landowners a statutory basis to register, and trade
the C rights earned since 1 January 1990 as a separate interest in the land (The Parliament of
Western Australia, 2003). At present, what transpires on the land after C trading is dependent
on the legal obligations imposed under transfer of such rights, which are in-turn dependent on
each particular trading mechanism design. New markets will likely require similar new
property rights, and will thus require a similar legislative basis, although the monitoring and
verification regimes will likely require much additional but complimentary ecological input
data. While quality datasets enable the development of stable and sustained markets with a
high level of transparency, such datasets require an additional level of resolution,
transparency, and efficiency in combining regional models and on-site verification than is
available today. However, analogous developments have enabled the development of C
markets, which with augmentation, may be a suitable foundation for various ecological
markets.
THE INTERFACE BETWEEN C MODELS AND
ON-SITE VERIFICATION
The development of the Australian National Carbon Accounting System (NCAS) was
required to decrease uncertainty, improve transparency, and improve verification of national
land use, land-use change, and forestry (LULUCF) assets and fluxes under the United Nations
Framework Convention on Climate Change (UNFCCC) and Kyoto Protocol commitments
(Australian Greenhouse Office, 1999b, 1999a; Turner et al., 1999; Polglase et al., 2000;
Snowdon et al., 2000; Richards, 2001; Australian Greenhouse Office, 2002; Furby, 2002;
Furby & Woodgate, 2002; Paul et al., 2002; Richards et al., 2002; Booth et al., 2003;
Australian Greenhouse Office, 2005b, 2005a). The NCAS methodology was developed to be Nova S
cienc
e Pub
lishe
rs, In
c.
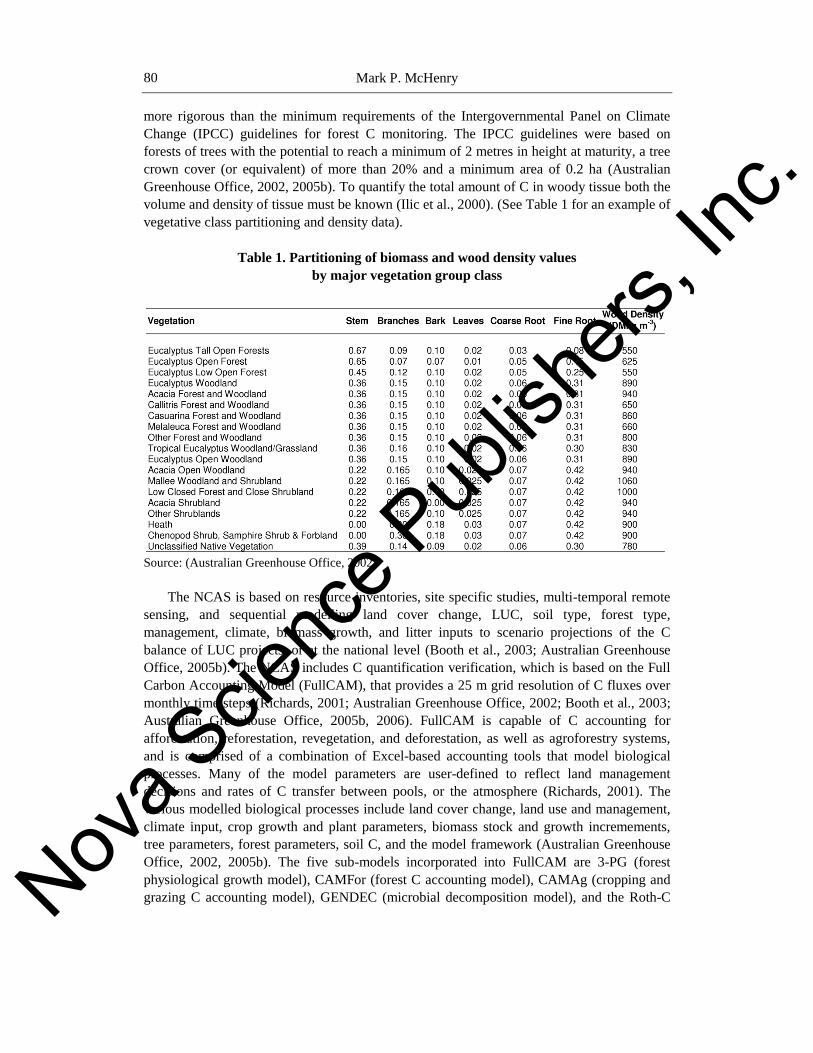
Mark P. McHenry 80
more rigorous than the minimum requirements of the Intergovernmental Panel on Climate
Change (IPCC) guidelines for forest C monitoring. The IPCC guidelines were based on
forests of trees with the potential to reach a minimum of 2 metres in height at maturity, a tree
crown cover (or equivalent) of more than 20% and a minimum area of 0.2 ha (Australian
Greenhouse Office, 2002, 2005b). To quantify the total amount of C in woody tissue both the
volume and density of tissue must be known (Ilic et al., 2000). (See Table 1 for an example of
vegetative class partitioning and density data).
Table 1. Partitioning of biomass and wood density values
by major vegetation group class
Source: (Australian Greenhouse Office, 2002)
The NCAS is based on resource inventories, site specific studies, multi-temporal remote
sensing, and sequential modelling land cover change, LUC, soil type, forest type,
management, climate, biomass growth, and litter inputs to scenario projections of the C
balance of LUC projects, or at the national level (Booth et al., 2003; Australian Greenhouse
Office, 2005b). The NCAS includes C quantification verification, which is based on the Full
Carbon Accounting Model (FullCAM), that provides a 25 m grid resolution of C fluxes over
monthly time steps (Richards, 2001; Australian Greenhouse Office, 2002; Booth et al., 2003;
Australian Greenhouse Office, 2005b, 2006). FullCAM is capable of C accounting for
afforestation, reforestation, revegetation, and deforestation, as well as agroforestry systems,
and is comprised of a combination of Excel-based accounting tools that model biological
processes. Many of the model parameters are user-defined to reflect land management
decisions and rates of C transfer between pools, or the atmosphere (Richards, 2001). The
various modelled biological processes include land cover change, land use and management,
climate input, crop growth and plant parameters, biomass stock and growth incremements,
tree parameters, forest parameters, soil C, and the model framework (Australian Greenhouse
Office, 2002, 2005b). The five sub-models incorporated into FullCAM are 3-PG (forest
physiological growth model), CAMFor (forest C accounting model), CAMAg (cropping and
grazing C accounting model), GENDEC (microbial decomposition model), and the Roth-C Nova S
cienc
e Pub
lishe
rs, In
c.

Harnessing Landholder‟s Knowledge for Environmental Monitoring ... 81
(soil C model) (Richards, 2001; Australian Greenhouse Office, 2002). The CAMFor
component assists C accounting and projections by calculating the C flows associated with
forest and tree stand changes, and also any wood product harvesting activities (Brack et al.,
2002; Brack & Richards, 2002). CAMFor converts annual changes in stem wood using
parametrics that approximate annual changes in tree components alongside C content. The
parametrics of importance are stem wood density and the variation of other tree components
relative to the stem, which vary with species, age, size, and on-site conditions (Booth et al.,
2003). Growth in the bark, branch, leaf, twig and root pools are modelled as an age dependent
increase relative to stem growth (Brack & Richards, 2002). FullCAM incorporates these and
other biological processes in relation to biogeographic information in the FullCAM database
(Booth et al., 2003).
To generate emissions and removals estimates for reforestation projects, a component of
the NCAS, the Carbon Accounting Toolbox (NCAT) was collaboratively developed by the
Australian Greenhouse Office, CSIRO, and the Australian National University. NCAT uses
the same data and models as the NCAS to generate net GHG removals and emission estimates
without requiring input data relating to stem volume and wood density. Thus, forest entities
using NCAT only require forest data such as tree species, years of establishment, thinning
measures, rotation intervals and any fertiliser applications as input data. While the Australian
Government does not yet prescribe the use of the NCAT, they do recommend its use for
forestry C emission and removal modelling to utilise the continually updated climate,
management activity, remote sensing, soil data, and forest type databases (Department of
Climate Change, 2008). Crucially, much of this updating incorporates on-site assessment, as
it is important that local data sets are not solely reliant on satellite imagery as to limit
interpretive errors. The on-site data greatly increases image interpretation and validation of
remote sensing results (Furby & Woodgate, 2002; Clifton et al., 2007).
ON-SITE VERIFICATION TO IMPROVE MODEL EFFECTIVENESS
Some on-site measurement methods are expensive, but accurate, while others are
inexpensive and less accurate. Remote sensing is one relatively inaccurate method, but has
the advantage of being inexpensive (Richards et al., 2002). Physiological models based on
remote sensing require relatively expensive field calibration from a network of quality audited
permanent plots (Australian Greenhouse Office, 1999a; Turner et al., 1999; Richards, 2001;
Richards et al., 2002). Researching economically efficient means to calibrate and verify
models through longitudinally maintained site-specific plot data sets is an important area for
policymakers to facilitate. The temporal distinction between calibration and verification
practices and data enable a longer term comprehension of changes in ecosystems from
historically continuous data. One serious gap in environmental inventories for verification and
calibration purposes relates to the dearth of private land information held in the public sphere.
This restricts the reliability of the increasingly important land use policy (Richards, 2001).
Development of systems such as the NCAS are undertaken recognising the imperfect
nature of the input data and the output. The system focuses on functional aggregated accuracy
and objectivity rather than attempt to pursue an ultimate level of precision of biomass growth
(Australian Greenhouse Office, 2002). The net primary productivity (NPP) of forests is the Nova S
cienc
e Pub
lishe
rs, In
c.

Mark P. McHenry 82
rate at which solar energy is converted to biomass, and its quantification is essentially the
objective of such models. Destructive sampling is one method of determining NPP, and while
it is suitable for individual plots of grass and shrub vegetation, it is rarely used for forest
ecosystems (Snowdon et al., 2002; Kesteven et al., 2004). There are two basic methods for
destructively estimating aboveground biomass of individual trees: the complete harvest
method, and; the partial harvest methods (Snowdon et al., 2002). However, determining the
biomass and C in standing, unharvested trees is accomplished by using calculations that
model the tree components such as stems, crowns, roots and tops for different sizes, ages and
tree spacing (Australian Greenhouse Office, 1999a; Ritzon & Sochacki, 2002; Bi et al., 2004).
Using easily measured tree characteristics to estimate tree biomass is called allometry, and
thousands of allometric equations for individual species in specific areas have been developed
using slightly different methods (Australian Greenhouse Office, 1999a; Eamus et al., 2000;
Richards et al., 2002; Specht & West, 2003; Bi et al., 2004).
ALLOMETRICS AND EXPANSION FACTORS:
UTILITY AND LIMITATIONS FOR NEW MARKETS
Allometric equations are an important technique to estimate tree and forest biomass and
sufficient information is available to estimate growth rates for forests (Australian Greenhouse
Office, 1999a; Turner et al., 1999; Richards et al., 2002). Relatively few allometric equations
are required to adequately describe the aboveground biomass of some vegetation types,
especially where one or two species dominate site basal area (the cross sectional area of trees
in a forest in m2 ha
-1) (Australian Greenhouse Office, 1999a; Richards et al., 2002). On-site
sampling of basal area tree height, and volume are currently used to refine NCAS estimates of
mature forest and regrowth of various ages (Australian Greenhouse Office, 1999a, 2006).
Basal area is often recommended as a standard measure for allometric equations as it was
often the only forestry variable recorded (Richards et al., 2002). Aboveground biomass can be
estimated from stand basal areas using ratios established for major Australian forest types
(Australian Greenhouse Office, 2006). However, basal area only allometric equations are less
useful than those that incorporate diameter at breast height (DBH) measurement (Richards et
al., 2002). Stem diameter can include DBH, or DBHOB (diameter at breast height over bark),
which are generally 130 cm from the ground unless stated otherwise (Brokaw & Thompson,
2000; Eamus et al., 2000; Keith et al., 2000; Snowdon et al., 2002; Zianis & Mancuccini,
2004). If possible all diameter measurements should be undertaken for both over and under
the bark. This can either be undertaken by removing the bark, or using a bark depth gauge to
estimate the under bark diameter. One use of measuring stem diameters both over and under
the bark is to estimate dry weight of dead trees and also to determine biomass information
about the bark itself. It is possible to get a good indication (generally within 2% difference) of
stem bark thickness by measuring only two opposite points on the stem. Other common stem
measurements are diameters at 10 cm (d10) and 30 cm (d30), which are used for small trees or
shrubs prone to forking. When there is more than one stem on the sample tree, calculating the
diameter of a circle of area equal to the sum of the cross-section areas of all stems at the same
height is known as the diameter equivalent (de) (Snowdon et al., 2002). Average biomass
estimates across a wide range of sites can be adequately estimated when using two variables, Nova S
cienc
e Pub
lishe
rs, In
c.

Harnessing Landholder‟s Knowledge for Environmental Monitoring ... 83
such as height and stem diameter for specific species and their sizes (Snowdon et al., 2000).
Tree height estimation on standing trees commonly use trigonometric or hypsometers at right
angles from any lean with two measurements from the opposite side of the tree (Snowdon et
al., 2002).
A study by Ritzon and Sochacki (2002) developed a model for predicting the biomass
and C for Pinus pinaster (Maritime pine) in the southwest of WA. This included destructive
sampling of trees aged between 1 and 47 years to determine dry matter biomass and C content
to develop allometric equations. Similar to comparable research, the study found that the
aboveground biomass of the tree contained very close to 50% C and the belowground tree
mass C content was around 48%, and that using more than one measurement provided the
most reliable allometric estimations (Ritzon & Sochacki, 2002). They developed equations
that predicted biomass and C for each component of the Maritime pines adequate for various
management practices, such as pruned for sawlogs, unpruned single paddock trees, or grown
in a windbreak.
Table 2. Linear regressions of the form Y = a + bD tables to estimate physical attributes
of 10 four year old Eucalyptus astringens (Brown Mallet) trees using DBHOB
measurements
Source: (Eamus et al., 2000)
Figure 1. Linear regression functions derived from 30 Eucalyptus astringens (Brown Mallet) trees of
four and twenty years of age to approximate height from DBHOB. Nova S
cienc
e Pub
lishe
rs, In
c.

Table 3. Selected available regression analyses of the form ln(M) = a*ln(DBH)+b of tree species grown in WA
Source: (Eamus et al., 2000)
Nova S
cienc
e Pub
lishe
rs, In
c.
Harnessing Landholder‟s Knowledge for Environmental Monitoring ... 85
The fundamental importance of biomass estimation for C and other ecological markets
necessitates a comprehensive suite of predictive equations for landscapes and species
(Australian Greenhouse Office, 1999a). It is possible to find simple linear allometric
equations of the form Y = a + bD, where a and b are the scaling coefficients, Y the total
aboveground tree dry biomass or tree height, and D is the DBH (See Table 2 and Figure 1).
However, the most commonly used form for biomass studies is M = aDb (Zianis &
Mancuccini, 2004). The variability of M is largely related to variability of D measurement,
while values of a and b vary with species, stand age, site, climate, and stand density. As the
relationship between M and D corresponds well to a power function, the raw data is usually
transformed logarithmically (Zianis & Mancuccini, 2004). (See Table 3 for a list of
logarithmically transformed linear allometric equations). Coefficients a and b are usually
determined by least-square regression of log-transformed data for DBH, and M measured
from destructive sampling (Eamus et al., 2000; Zianis & Mancuccini, 2004).
Unfortunately, there are fundamental issues with much of the available allometric data
and collection methods. Uncorrected estimates of biomass derived from least squares
regression on logarithmically transformed data should not be used to estimate biomass as they
seriously underestimate biomass without correction factors (Eamus et al., 2000). If available,
correction factors allows landholders to accurately quantify tree biomass from allometric
equations by measuring the relevant variables in the equations, such as the DBH (Eamus et
al., 2000; Bi et al., 2004). However, without correction factors biomass is likely to be
underestimated due to the DBH being relatively large and being skewed by the
antilogarithmic transformation1 (Eamus et al., 2000). The primary untransformed data is of
much greater utility to landholders and new markets, although very little original data exists,
and/or is available. Furthermore, allometric equations technically only apply to the forest
stand where they were derived, and equations will likely be unsuitable outside of the tree
species, tree size class, and the region of which they were obtained (Snowdon et al., 2000;
Richards et al., 2002). Despite these fundamental limitations, the primary source of error with
available biomass estimation equations derives from regression analyses. Statistical
comparisons and the combination of equations is constrained by a lack of standard
mathematical form, differences in independent variables, lack of statistical transformation
information, and deficiency in details of the original data (Australian Greenhouse Office,
1999a).
For larger areas of trees there are a range of what are called „expansion factors‟, which
are used with sample results to more accurately determine biomass and sequestration of larger
numbers of trees in accordance with NCAS protocols (Snowdon et al., 2002). Expansion data
assist accurate useful for modelling when the location and volumes are known, and must be of
sufficient detail, which may impinge on commercial sensitivities (Australian Greenhouse
Office, 1999a). Expansion factors vary according to species, canopy cover, region (etc.)
(Australian Greenhouse Office, 1999a; Furby, 2002). There are also differences between
commercial forest and unmanaged forests in terms of allometric regression expansion factors
(Australian Greenhouse Office, 1999b). These differences in land use should be reflected by
differences in allometric and expansion factor data. However, the main source of error in
upscaling biomass estimates using expansion factors relates to the number and adequacy of
sampled representative plots and the level of natural heterogeneity of particular forest species
1 Research by Eamus et al. (2000) includes a useful overview of allometric correction factors. Nova S
cienc
e Pub
lishe
rs, In
c.

Mark P. McHenry 86
(Australian Greenhouse Office, 1999a). Conversion of measurements to total forest biomass
requires wood density measurements and expansion factors that account for the stem as a
proportion of the total tree including stem, bark, branches, twigs, leaves and root data
(Australian Greenhouse Office, 1999a; Keith et al., 2000). Non-destructive sampling methods
at a site commonly entails removing 0.12 cm increment core from 110 cm aboveground to
ascertain whole tree density. The assessment of wood density also requires recording of the
location, altitude, age, and species of the tree, the height of the tree and sample points,
diameter over bark at the sampling point, compass direction of the sample, median and
seasonal distribution of rainfall, soil type, and a measure of site quality (Ilic et al., 2000).
Such details are rarely available, especially in primary form, free from statistical
transformation.
CARBON CONTENT AND COMPLEXITIES IN
BELOWGROUND BIOMASS ESTIMATION
Biomass estimates are converted to C by applying C factors, and in contrast to
allometrics and expansion factors, turn out to be remarkably consistent between species and
regions (Australian Greenhouse Office, 2006). (Table 4 shows general C content and turnover
rates). Australian research by Gifford (2000a) found that overall C contents of all tree tissues
and species was 50%, while leaves exhibit slightly higher C content of 52.8%, and leaf litter
C content was 54.3%. Gifford recommended for when a single %C value is required to
represent all aboveground components of all species, a value of 50±2% be used. When leaves
were analysed separately a value of 53±2% be adopted, and for Australian native species, a
value of 50±2% for woody components is appropriate. Deep wood near the centre of the trunk
exhibited around 2% higher C contents than sapwood due to lower mineral contents (Gifford,
2000a). Gifford (2000b) also obtained an averaged value for the C content of coarse wood
root of 49±1%, based on an analysis of 23 species. The range of these 23 species was 46.7 to
51.2%. When a continental value for forest roots including fine roots, 48±2% is suggested,
and when a single figure is required that represents the C content of all woody components
above and belowground (including branches and coarse roots), 49±2% is suggested.
Significantly, there is often less variability between tree species than between tissues
(Gifford, 2000b). While carbon factors themselves add little uncertainty to C estimates, the
errors of biomass carried through assessments remain the greatest source of uncertainty.
Biomass estimation through allometric relationships can be complicated by seasonal and
annual variability in NPP, unique underground vegetative structures, harvesting, fire, or
unusual environmental conditions (Turner et al., 1999). In mallee vegetation (low growing,
multi-stemmed Eucalypt species) individual lignotubers may be very large and coppicing or
fire can stimulate lignotuber growth as the tissues grow and the lignotuber merges with the
stem base (Kalin Arroyo et al., 1995; Snowdon et al., 2002). In southern Australia, the soil
water holding capacity over the period in summer and autumn (December to May), often
determines the growth and survival of trees (Hingston et al., 1998). In water limited regions
the relationship between age and biomass may not be strong due to the opportunistic growth
rate of vegetation in the more arid systems (Turner et al., 1999; Van Vreeswyk et al., 2004).
As root biomass growth patterns generally reflect water availability, sampling for minimum Nova S
cienc
e Pub
lishe
rs, In
c.
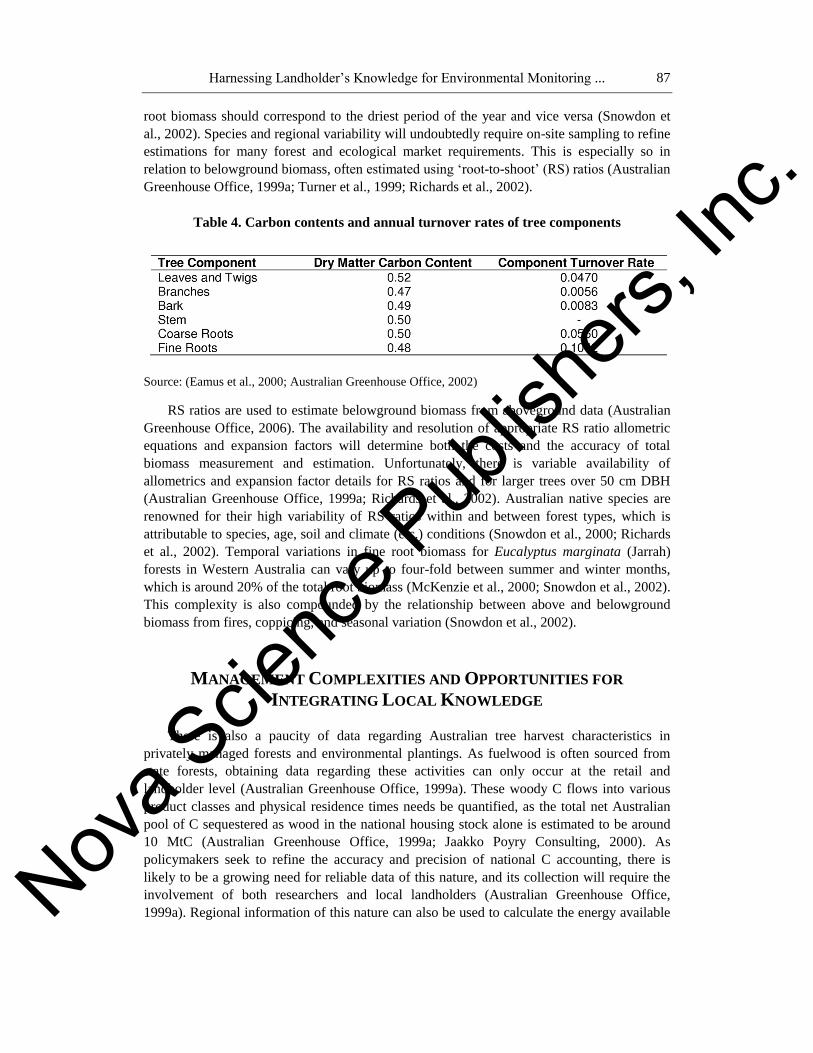
Harnessing Landholder‟s Knowledge for Environmental Monitoring ... 87
root biomass should correspond to the driest period of the year and vice versa (Snowdon et
al., 2002). Species and regional variability will undoubtedly require on-site sampling to refine
estimations for many forest and ecological market requirements. This is especially so in
relation to belowground biomass, often estimated using „root-to-shoot‟ (RS) ratios (Australian
Greenhouse Office, 1999a; Turner et al., 1999; Richards et al., 2002).
Table 4. Carbon contents and annual turnover rates of tree components
Source: (Eamus et al., 2000; Australian Greenhouse Office, 2002)
RS ratios are used to estimate belowground biomass from aboveground data (Australian
Greenhouse Office, 2006). The availability and resolution of appropriate RS ratio allometric
equations and expansion factors will determine both the costs and the accuracy of total
biomass measurement and estimation. Unfortunately, there is variable availability of
allometrics and expansion factor details for RS ratios and for larger trees over 50 cm DBH
(Australian Greenhouse Office, 1999a; Richards et al., 2002). Australian native species are
renowned for their high variability of RS ratios within and between forest types, which is
attributable to species, age, soil and climate (etc.) conditions (Snowdon et al., 2000; Richards
et al., 2002). Temporal variations in fine root biomass for Eucalyptus marginata (Jarrah)
forests in Western Australia can vary up to four-fold between summer and winter months,
which is around 20% of the total root biomass (McKenzie et al., 2000; Snowdon et al., 2002).
This complexity is also compounded by the relationship between above and belowground
biomass from fires, coppicing, and seasonal variation (Snowdon et al., 2002).
MANAGEMENT COMPLEXITIES AND OPPORTUNITIES FOR
INTEGRATING LOCAL KNOWLEDGE
There is also a paucity of data regarding Australian tree harvest characteristics in
privately managed forests and environmental plantings. As fuelwood is often sourced from
state forests, obtaining data regarding these activities can only occur at the retail and
landholder level (Australian Greenhouse Office, 1999a). These woody C flows into various
product classes and physical residence times needs be quantified, as the total net Australian
pool of C sequestered as wood in the national housing stock alone is estimated to be around
10 MtC (Australian Greenhouse Office, 1999a; Jaakko Poyry Consulting, 2000). As
policymakers seek to refine the accuracy and precision of national C accounting, there is
likely to be a growing need for reliable data of this nature, and its collection will require the
involvement of both researchers and local landholders (Australian Greenhouse Office,
1999a). Regional information of this nature can also be used to calculate the energy available Nova S
cienc
e Pub
lishe
rs, In
c.

Mark P. McHenry 88
for use in the expanding renewable energy markets in relation to woodheater demand, for
cofiring in conventional generators, or the growing market for small bioenergy units
cogenerating useful electricity and heat in regional areas (McHenry, 2009a).
In relation to environmental markets attributed to vegetative management, identifying the
timing and implementation of any land use activity will likely require very detailed biological
modelling, especially when concerning fire management. This quantification will require both
the concurrent agents of change, and the separated impact of change to be determined
(Richards, 2001). However, modelling data in inappropriately high resolutions may presume a
sense of false precision for market participants, and a balance between market value,
transparency, and practicality should evolve (Australian Greenhouse Office, 1999a).The most
likely form that individual landholders will be able to take part in future environmental
markets will be through „pooling‟. In a similar manner to supply market quantities of niche
products, or more recently, C pooling involves combining a number of small registered areas
in order to generate sufficient marketable product volume to obtain a positive return by
sharing costs of technical measurement, certification and marketing of the credits (The CRC
for Greenhouse Accounting & Tony Beck Consulting Services Pty Ltd, 2003; McHenry,
2012a).
Documented evidence required to establish eligibility of C sequestration projects
generally include restrictions on land uses where the project resides, a regime of maintenance
for ongoing compliance, and a risk management strategy (Independent Pricing and
Regulatory Tribunal, 2008). Aerial photographs or satellite imagery with on-site data are
required as a bare minimum to enable landowners to register land use and land management
changes. Accredited forestry sequestration activities and verification are often allowed to be
undertaken roughly every five years, with a corresponding credit for each period. C
assessments are calculated using models consistent with a corresponding standard, and
sometimes include an appropriate uncertainty analysis. Uncertainty analyses are often used to
reduce the final amount to ensure a conservative estimate (The New South Wales
Government, 2005). Vegetation that involves rotational harvesting at some point requires a
more sophisticated C modelling and accounting system than simple conservation plantings.
Eligible certificate creation for rotational harvesting usually requires C stocks never to fall
below the threshold of certificates created (Independent Pricing and Regulatory Tribunal,
2008).
ENVIRONMENTAL AND LAND-USE
CHANGE POLICY AMBIGUITY
The final forest C offset rules that will apply in Australia‟s climate change mitigation
policies are yet to be determined. The Commonwealth Government has indicated its intention
to review the development of longer term arrangements (The New South Wales Government,
2008). The previously proposed CPRS White Paper stated that offsetting will be likely
allowed from sectors outside C policies (Cosier et al., 2009), and this is likely to be the
approach followed by successor policies. As the agricultural sector will likely be excluded
from the C policy liabilities, landholders will be eligible to create C offsets for captured
sectors. Landholders, certain leaseholders and C property rights holders can apply to become Nova S
cienc
e Pub
lishe
rs, In
c.
Harnessing Landholder‟s Knowledge for Environmental Monitoring ... 89
accredited forest entities, which will be published by any scheme regulator. To be eligible for
the first Kyoto Protocol (KP) commitment period permit entitlements, forests were to be
registered before 1 January 2013 (Cosier et al., 2009).
There is likely to be continued developments occurring in the creation on new forest and
ecological management markets, of which have some precedence in the KP requirements for
LULUCF inclusion into national inventories. The COP 13 in Copenhagen secured further
interest in market mechanisms to improve forest management under the Reducing Emissions
from Deforestation and Forest Degradation in Developing Countries (UN-REDD
Programme). Forest management is defined as “a system of practices for stewardship and use
of forest land aimed at fulfilling relevant ecological (including biological diversity), economic
and social functions of the forest in a sustainable manner” (United Nations Framework
Convention on Climate Change, 2002) p 58. The KP‟s Article 3.4 includes the option of
accounting for forest management, revegetation, cropland management, and grazing land
management to be included in national targets. Of particular interest in Australia is ecological
market developments relating to grazed woodlands and rangelands, which are accounted
under the Grazing Lands component of Article 3.4 (Richards, 2001). As Australia currently
chooses not to account for article 3.4 emissions, there is a possibility that some of these
management activities will become involved in future markets under international
frameworks. Thus, it is only logical to compile and develop monitoring and quantitative
methods of proxy ecological indicators of such expanding management and conservation
policies in addition to simply biomass and C NPP. It is interesting to contrast how far land
use policies have come in Australia over a relatively short space of time. This may also be a
source of concern to landholders seeking to undertake long-term commitments, as Australian
policymakers, even in the same jurisdiction, have tended to provide little consistency over
time (McHenry, 2012a).
LESSONS LEARNED FROM HISTORY:
LAND-USE MARKET RISKS
The WA Government‟s Conditional Purchase (CP) crown land release scheme was first
introduced in early WA settlement, but was reinvigorated in 1961 and continued until 1982.
Each property in the CP scheme was purchased for only around 35 cents per ha (in 2010
Australian dollars), which included the government provision of land surveys, road access,
and telephone services. This attracted many unfamiliar with land management to implement
the minimum conditions of the CP scheme, which were to clear two-thirds of the property and
fence the boundary within a given period. This resulted in high rates of farm failure, and a
resultant over-clearing from successful neighbours to recover costs of overextending
themselves by acquiring the failed properties. Despite the known soil, biodiversity,
productivity losses and associated salinity issues at the time, the amount of clearing facilitated
by the WA Government between 1980 and 1990 in four significant bioregions totalled
between 80,000 and 160,000 ha each year (Australian Greenhouse Office, 2000). (Table 5)
The combined impact of government land development schemes, tax incentives and easy
finance lead to a scarcity of uncleared arable land. Thus, native vegetation clearing policies
were replaced by staunch clearing control legislation. The WA Government policy now Nova S
cienc
e Pub
lishe
rs, In
c.
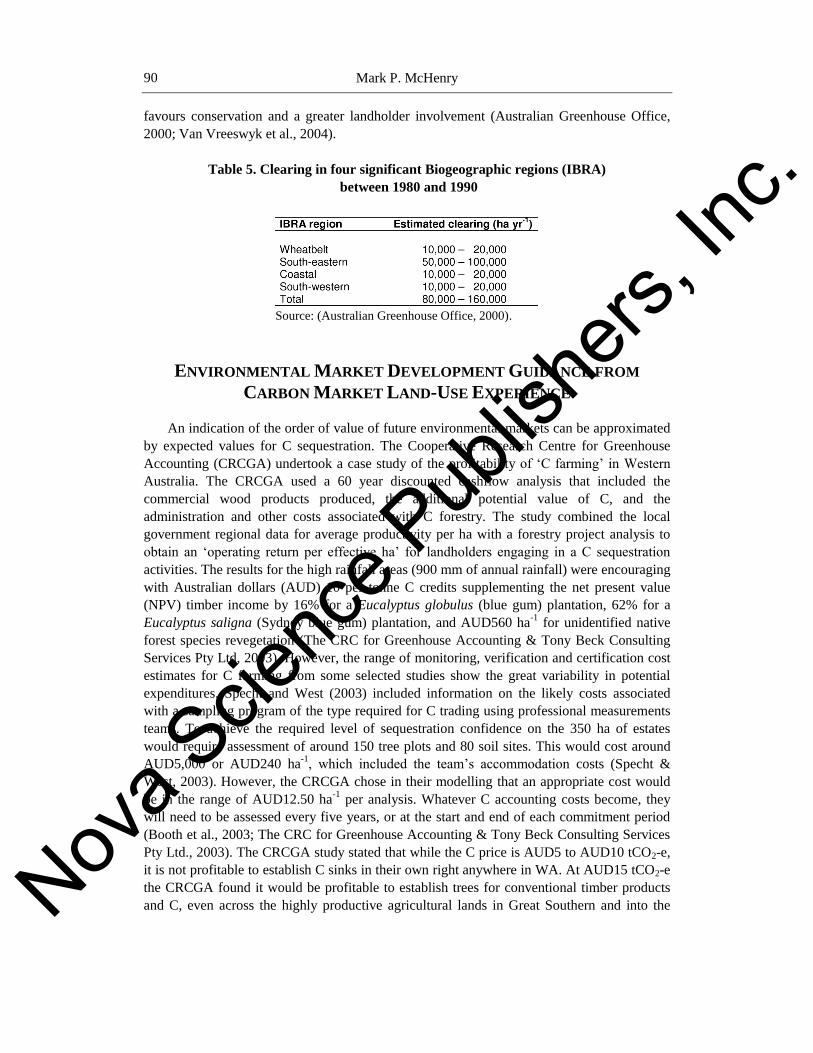
Mark P. McHenry 90
favours conservation and a greater landholder involvement (Australian Greenhouse Office,
2000; Van Vreeswyk et al., 2004).
Table 5. Clearing in four significant Biogeographic regions (IBRA)
between 1980 and 1990
Source: (Australian Greenhouse Office, 2000).
ENVIRONMENTAL MARKET DEVELOPMENT GUIDANCE FROM
CARBON MARKET LAND-USE EXPERIENCE
An indication of the order of value of future environmental markets can be approximated
by expected values for C sequestration. The Cooperative Research Centre for Greenhouse
Accounting (CRCGA) undertook a case study of the profitability of „C farming‟ in Western
Australia. The CRCGA used a 60 year discounted cashflow analysis that included the
commercial wood products produced, the additional potential value of C, and the
administration and other costs associated with C forestry. The study combined the local
government regional data for average productivity per ha with a forestry project analysis to
obtain an „operating return per effective ha‟ for landholders engaging in a C sequestration
activities. The results for the high rainfall areas (900 mm of annual rainfall) were encouraging
with Australian dollars (AUD) 10 per tonne C credits supplementing the net present value
(NPV) timber income by 16% for a Eucalyptus globulus (blue gum) plantation, 62% for a
Eucalyptus saligna (Sydney blue gum) plantation, and AUD560 ha-1
for unidentified native
forest species revegetation (The CRC for Greenhouse Accounting & Tony Beck Consulting
Services Pty Ltd, 2003). However, the range of monitoring, verification and certification cost
estimates for C farming from some selected studies show the great variability in potential
expenditures. Specht and West (2003) included information on the likely costs associated
with a sampling program of the type required for C trading using professional measurements
teams. To achieve the required level of sequestration confidence on the 350 ha of estates
would require assessment of around 150 tree plots and 80 soil sites. This would cost around
AUD5,000 or AUD240 ha-1
, which included the team‟s accommodation costs (Specht &
West, 2003). However, the CRCGA chose in their modelling that an appropriate cost would
be in the range of AUD12.50 ha-1
per analysis. Whatever C accounting costs become, they
will need to be assessed every five years, or at the start and end of each commitment period
(Booth et al., 2003; The CRC for Greenhouse Accounting & Tony Beck Consulting Services
Pty Ltd., 2003). The CRCGA study stated that while the C price is AUD5 to AUD10 tCO2-e,
it is not profitable to establish C sinks in their own right anywhere in WA. At AUD15 tCO2-e
the CRCGA found it would be profitable to establish trees for conventional timber products
and C, even across the highly productive agricultural lands in Great Southern and into the Nova S
cienc
e Pub
lishe
rs, In
c.
Harnessing Landholder‟s Knowledge for Environmental Monitoring ... 91
Southwest regions, only when the cost of land is not taken into account. The study concluded
that C farming/forestry activities could not compete commercially with current landholder
activities, but may be complementary to such activities or offset potential losses from
establishment costs of windbreaks and revegetation (The CRC for Greenhouse Accounting &
Tony Beck Consulting Services Pty Ltd., 2003). Effectively achieving this complementarily
will require low C accounting costs, an intimate knowledge of the land, and its productive
potential (McHenry, 2013).
BIOLOGICAL COMPLEXITY AND ENVIRONMENTAL
MARKETS USING A FORESTRY EXAMPLE
At the landscape scale, soil types, soil texture, local topography, water availability and
the condition and exposure of individual trees influence many aspects of vegetative NPP
(Kort & Turnok, 1999). Open-spaced trees are subjected to greater mechanical wind stress
and respond by increasing the thickness of stems, branches, and particularly the root system
(Ritzon & Sochacki, 2002). The proportion of total tree biomass in roots is generally between
30 - 50% of aboveground biomass (Kort & Turnok, 1999). However, it is known that planting
trees in higher densities, such as in a windbreak or plantations, reduce the percentage of tree
biomass in root systems. The amount of aboveground biomass also increases as the trees age
relative to the biomass in roots. This is more pronounced with open spaced trees than close-
spaced trees (Ritzon & Sochacki, 2002). For reasons of practicality, estimating the biomass of
smaller shrubby plants is best related to shelterbelt volume; as the space occupied by the total
leaf area available for photosynthesis is independent of the number of trees in the windbreak
because the lateral growth is limited by their neighbours (Kort & Turnok, 1999).
Additional intricacies discovered by site analyses are the variability of soil organic C
(SOC) below plantations and adjacent land. Short-term declines in SOC following LUC from
pasture to plantation in wetter regions requires landholders and modellers to account for these
losses in particular bioregions. The SOC levels would be expected to recover and possibly
exceed the pre-plantation level (Kirschbaum, 2000; Specht & West, 2003). Such assumptions
require on-site verification to refine models that aggregate data for market mechanisms and
formal accounts, such as Australia‟s National Greenhouse Gas Inventory (NGGI) (Brack &
Richards, 2002; Booth et al., 2003).
There are significant biological complexities in establishing large vegetative stocks for
new markets which are poorly understood by markets and current biometric models.
Although external to any C market transaction, negative environmental consequences may
occur in relation to water availability in sensitive catchments due to large reforestation
activities consuming sizeable quantities of water (Department of Climate Change, 2008;
Cosier et al., 2009; McHenry, 2012b). This will require estimation, planning and management
by local and state governments if such activities are projected to become widespread within
their planning horizons. The development of transparent mechanisms to quantify the
performance of activities will be crucial.
All biological conservation-based projects are subject to additional market risk, but are
also impacted by physical risks associated with fire, drought, or pests, which must be
reasonably accounted for (The CRC for Greenhouse Accounting & Tony Beck Consulting Nova S
cienc
e Pub
lishe
rs, In
c.
Mark P. McHenry 92
Services Pty Ltd., 2003). Compounding these issues are the policy change concerns for
landholders, including permanence issues arising from participation in conservation activities,
most of which are likely to be around 100 years or even permanently on titles or leases
(Booth et al., 2003; The CRC for Greenhouse Accounting & Tony Beck Consulting Services
Pty Ltd., 2003; Independent Pricing and Regulatory Tribunal, 2008). The risks of limiting
future management options is crucial for landholders, which may result in future
compensation payments to carbon rights holders if contractual obligations are annulled by
landholders (if this is possible) in addition to associated transaction costs (Booth et al., 2003;
The CRC for Greenhouse Accounting & Tony Beck Consulting Services Pty Ltd., 2003).
CONCLUSION
The integration of high accuracy on-site vegetative and ecological data into landscape
and macro-scale land monitoring models will enable new market mechanisms that internalise
environmental externalities from land management activities by providing both accurate and
precise on-site accounting and verification. This approach has the potential to achieve several
efficiencies including new skilled conservation jobs in remote areas, reduced capital and
infrastructure duplication for on-site environmental monitoring, streamlined government
administration and research ancillary expenses, locally appropriate conservation activities that
are sustained over time, and direct communication between landholders, academic
institutions, and land management policymakers.
Striking an operative balance between the accuracy of market product value, the genuine
value of on-ground activities, and the associated market administrative and monitoring costs
will necessitate on-site activities on both private and government lands. Policymakers should
be aware that landholders, due to their relationship with the land, generally hold the majority
of high resolution data regarding the efficacy and nuances of particular land use and
management alternatives (Stoneham, 2009). Experience has shown that land management
activities undertaken by governments or external entities in regional areas often under-
perform, and initiatives are rarely funded sufficiently to be sustained effectively (Van
Vreeswyk et al., 2004; Stoneham, 2009). The option of subcontracting landholders who live
and work in such regions may be a more effective solution to increasing travel and
accommodation costs of centralised contractors. An open relationship between policymakers
and landholders will therefore assist the development of appropriate management practices
that provide private landholder security, public good protection and enhancement, alongside
efficiency in terms of administering limited environmental funding. This will more effectively
harness the considerable existing knowledge and capacity in rural, regional, and remote
Australia and assist the generation of detailed knowledge of ecosystem functional change.
Pressures from industry expansion, urban encroachments, and conservation objectives on
existing regional food production systems and culturally sensitive lands will likely intensify
over-time. Improving the interface between landholders and policymakers through rigorous
monitoring mechanisms provides a much needed additional communication channel between
landholders and those not on the land, but with an external interest in it. With sufficient
knowledge and resources, private on-site landholders are often best placed to quantify the
productive potential of their land, and develop appropriate and cost-effective management Nova S
cienc
e Pub
lishe
rs, In
c.
Harnessing Landholder‟s Knowledge for Environmental Monitoring ... 93
activities. An internalisation of non-monetary land systems can generate a more effective and
sustained land management and environmental outcome that do not require acquisition or
expensive maintenance regimes by governments. Therefore, it will be prudent for
policymakers and researchers to work more transparently with private long-term landholders
to maximise benefits and minimise costs from new market opportunities, maintain ecological
services, and retain food productive capacity.
REFERENCES
Antheaume, N. (2004). Valuing external costs - from theory to practice: implications for full
cost environmental accounting. European Accounting Review, 13(3), 443-464.
Australian Greenhouse Office. (1999a). Implementation plan for the 1990 baseline. Canberra:
Australian Greenhouse Office.
Australian Greenhouse Office. (1999b). Setting the frame. Part 1: system framework, Part 2:
project specification 1990 baseline estimation, land use change and forestry sector.
Canberra: Australian Greenhouse Office.
Australian Greenhouse Office. (2000). Land clearing: a social history. Canberra: Australian
Greenhouse Office.
Australian Greenhouse Office. (2002). Greenhouse gas emissions from land use change in
Australia: an integrated application of the National Carbon Accounting System.
Canberra: Australian Greenhouse Office.
Australian Greenhouse Office. (2005a). Development plan 2004-8. Canberra: Australian
Greenhouse Office.
Australian Greenhouse Office. (2005b). Greenhouse gas emissions from land use change in
Australia: results of the National Carbon Accounting System 1988-2003. Canberra:
Australian Greenhouse Office.
Australian Greenhouse Office. (2006). Greenhouse action in regional Australia: Planning
forest sink projects - a guide to forest sink planning, management and carbon
accounting. Canberra: Australian Greenhouse Office.
Balilla, V. S., Anwar McHenry, J., McHenry, M. P., Parkinson, R. M., & Banal, D. T. (2012).
Aeta Magbukún of Mariveles: traditional Indigenous forest resource use practices and the
sustainable economic development challenge in remote Philippine regions. Journal of
Sustainable Forestry, 31(7), 687-709
Bi, H., Turner, J., & Lambert, M. J. (2004). Additive biomass equations for native eucalypt
forest trees of temperate Australia. Trees, 18(4), 467-479.
Booth, T. H., Kirschbaum, M., Richards, G., Zhang, X. Q., Domrongphol, P.,
Chittachumnonk, P., Hieu, N. K., Snowdon, P., Paul, K., Polglase, P., Raison, J.,
Teiveyanathan, T., Waterworth, R., Elliott, A., & Jovanovic, T. (2003, 24 February
2003). Carbon Accounting in Forests. Paper presented at the Facilitating International
Carbon Accounting in Forests, Canberra.
Brack, C., Coops, N., Furby, S., James, R., Kesteven, J., Landsberg, J., Raison, J., Richards,
G., & Turner, B. (2002). Report No. 27 - Biomass estimation: approaches for assessment
of stocks and stock change. Canberra: Australian Greenhouse Office. Nova S
cienc
e Pub
lishe
rs, In
c.
Mark P. McHenry 94
Brack, C. L., & Richards, G. P. (2002). Carbon accounting model for forests in Australia.
Environmental Pollution, 116, 187-194.
Brokaw, N., & Thompson, J. (2000). The H for DBH. Forest Ecology and Management, 129,
89-91.
Clifton, C., Cossens, B., & McAuley, C. (2007). Project REM1 - A framework for assessing
the environmental water requirements of groundwater dependent ecosystems report 1
assessment toolbox Kent Town, South Australia: Resource & Environmental
Management Pty Ltd.
Cosier, P., Flannery, T., Harding, R., Karoly, D., Lindenmayer, D., Possingham, H., Purves,
R., Saunders, D., Thorn, B., Williiams, J., & Young, M. (2009). Optimising carbon in the
Australian landscape - How to guide the terrestrial carbon market to deliver multiple
economic and environmental benefits: Wentworth Group of Concerned Scientists.
Department of Climate Change. (2008). Carbon Pollution Reduction Scheme White Paper:
Australia's low pollution future (Volume 1). Canberra: Commonwealth of Australia.
Eamus, D., McGuinnes, K., & Burrows, W. (2000). Report No. 5a - Review of allometric
relationships for estimating woody biomass for Queensland, the Northern Territory and
Western Australia. Canberra: Australian Greenhouse Office.
Fromm, O. (2000). Ecological structure and functions of biodiversity as elements of its total
economic value. Environmental and Resource Economics, 16, 303-328.
Furby, S. (2002). Land cover change: specification for remote sensing analysis. Canberra:
Australian Greenhouse Office.
Furby, S., & Woodgate, P. (2002). Remote sensing analysis of land cover change - pilot
testing of techniques. Canberra: Australian Greenhouse Office.
Gifford, R. G. (2000a). Carbon content of woody roots - revised analysis and a comparison
with woody shoot components. Canberra: Australian Greenhouse Office.
Gifford, R. M. (2000b). Carbon contents of above-ground tissues of forest and woodland
trees. Canberra: Australian Greenhouse Office.
Griffiths, B. S., Ritz, K., Bardgett, R. D., Cook, R., Christensen, S., Ekelund, F., Sorensen, S.
J., Baath, E., Bloem, J., de Ruiter, P. C., Dolfing, J., & Nicolardot, B. (2000). Ecosystem
response of pasture soil communities to fumigation-induced microbial diversity
reductions: an examination of the biodiversity - ecosystem function relationship. Oikos,
90, 279-294.
Hingston FJ, Galbraith JH, & Dimmock GM. (1998). Application of the process-based model
BIOMASS to Eucalyptus globulus subsp. globulus plantations on ex-farmland in south
western Australia - I. Water use by trees and assessing risk of losses due to drought.
Forest Ecology and Management, 106, 141-156.
Ilic, J., Boland, D., McDonald, M., Downes, G., & Blakemore, P. (2000). Wood density phase
1 - state of knowledge. Canberra: Australian Greenhouse Office.
Independent Pricing and Regulatory Tribunal. (2008). Compliance and operation of the NSW
Greenhouse Gas Reduction Scheme 2007. Retrieved 19 October, 2009, from
http://www.greenhousegas.nsw.gov.au/documents/SchRep07.pdf
Jaakko Poyry Consulting. (2000). Analysis of wood product accounting options for the
National Carbon Accounting System. Canberra: Australian Greenhouse Office.
Kalin Arroyo, M. T., Zedler, P. H., & Fox, M. D. (1995). Ecology and biogeography of
mediterranean ecosystems in Chile, California, and Australia. New York, USA:
Springer-Verlag. Nova S
cienc
e Pub
lishe
rs, In
c.

Harnessing Landholder‟s Knowledge for Environmental Monitoring ... 95
Keith, H., Barrett, D., & Keenan, R. (2000). Report No. 5b - Review of allometric
relationships for estimating woody biomass for New South Wales, the Australian Capital
Territory, Victoria, Tasmania and South Australia. Canberra: Australian Greenhouse
Office.
Kesteven, J., Landsberg, J., & UrS Australia. (2004). Developing a national forest
productivity model. Canberra: Australian Greenhouse Office.
Kirschbaum, M. U. F. (2000). What contribution can tree plantations make towards meeting
Australia's commitments under the Kyoto Protocol? Environmental Science & Policy, 3,
83-90.
Kort, J., & Turnok, R. (1999). Carbon reservoir and biomass in Canadian prairie shelterbelts.
Agroforestry Systems, 44, 175-186.
Landsberg, J., & Crowley, G. (2004). Monitoring rangeland biodiversity: plants as indicators.
Austral Ecology, 29, 59-77.
McHenry, M. P. (2009a). Agricultural bio-char production, renewable energy generation and
farm carbon sequestration in WA: Certainty, uncertainty & risk. Agriculture, Ecosystems
and Environment, 129, 1–7.
McHenry, M. P. (2009b). Synergies between conventional soil organic carbon, farm
productivity, soil sequestration and soil carbon market risk in Australia. In: E. T. Nardali
(Ed.), In No-Till Farming: Effects on Soil, Pros and Cons, and Potential. Hauppauge,
New York, USA: Nova Science. 978-1-60741-402-5.
McHenry, M. P. (2010). Carbon-based stock feed additives: a research methodology that
explores ecologically delivered C biosequestration, alongside live-weights, feed-use
efficiency, soil nutrient retention, and perennial fodder plantations. Journal of the Science
of Food and Agriculture, 90, 183-187.
McHenry, M. P. (2011). Soil organic carbon, biochar, and applicable research results for
increasing farm productivity under Australian agricultural conditions. Communications in
Soil Science and Plant Analysis, 42, 1187-1199.
McHenry, M. P. (2012a). Australian carbon biosequestration and bioenergy policy co-
evolution: mechanisms, mitigation, and convergence. Australian Forestry Journal 75(2),
901-913.
McHenry, M. P. (2012b). Practicalities of establishing forestry carbon sequestration projects
in the agricultural sector: a technical and economic analysis with implications. In: B. J.
Ryan & D. E. Anderson (Eds.), Carbon sequestration: technology, measurement
technologies and environmental effects. Hauppauge, New York, USA: Nova Science
Publishers. 978-1-62081-081-7.
McHenry, M. P. (2013). How farming and forestry converge: enhancing the interface between
agricultural production, and tree biomass/bioenergy systems to improve farm-scale
productivity in Western Australia. In: M. C. Allard (Ed.), Bioenergy systems, biological
sources and environmental impact. Hauppauge, New York, USA: Nova Science
Publishers. 978-1-62417-330-1.
McKenzie, N., Ryan, P., Fogarty, P., & Wood, J. (2000). Sampling, measurement and
analytical protocols for carbon estimation in soil, litter and woody biomass. Canberra:
Australian Greenhouse Office.
Nunes, P. A. L. D., & van den Bergh, J. C. J. M. (2001). Economic valuation of biodiversity:
sense or nonsense? Ecological Economics, 39, 203-222. Nova S
cienc
e Pub
lishe
rs, In
c.
Mark P. McHenry 96
Paul, K., Polglase, P., Coops, N., O'Connell, T., Grove, T., Mendham, D., Carlyle, C., May,
B., Smethhurst, P., & Baillie, C. (2002). Modelling change in soil carbon following
afforestation or reforestation: preliminary simulations using GRC3 and sensitivity
analyses. Canberra: Australian Greenhouse Office.
Polglase, P. J., Paul, K. I., Khanna, P. K., Nyakuengama, J. G., O'Connell, A. M., Grove, T.
S., & Battaglia, M. (2000). Change in soil carbon following afforestation or
reforestation: review of experimental evidence and development of a conceptual
framework. Canberra: Australian Greenhouse Office.
Richards, G., Brack, C., Coops, N., Furby, S., James, R., Kesteven, J., Landsberg, J., Raison,
J., & Turner, B. (2002). Biomass estimation: approaches for assessment of stocks and
stock change. Canberra: Australian Greenhouse Office.
Richards, G. P. (2001). The FullCAM carbon accounting model: development, calibration
and implementation for the National Carbon Accounting System. Canberra: Australian
Greenhouse Office.
Ritzon, P., & Sochacki, S. (2002). Measurement and prediction of biomass and carbon
content of Pinus pinaster trees in farm forestry plantations, south-western Australia.
Forest Ecology and Management, 175, 103-117.
Snowdon, P., Eamus, D., Gibbons, P., Khanna, P., Keith, H., Raison, J., & Kirschbaum, M.
(2000). Synthesis of allometrics, review of root biomass and design of future woody
biomass sampling. Canberra: Australian Greenhouse Office.
Snowdon, P., Raison, J., Keith, H., Ritzon, P., Grierson, P., Adams, M., Montagu, K., Bi, H.
Q., Burrows, W., & Eamus, D. (2002). Report No. 31 - Protocol for sampling tree and
stand biomass. Canberra: Australian Greenhouse Office.
Specht, A., & West, P. W. (2003). Estimation of biomass and sequestered carbon on farm
forest plantations in northern New South Wales, Australia. Biomass and Bioenergy,
25(4), 363-379.
Stoneham, G. (2009). Creating markets for environmental goods and services: a mechanism
design approach. Canberra: Land and Water Australia.
The CRC for Greenhouse Accounting & Tony Beck Consulting Services Pty Ltd. (2003).
Opportunities for the Western Australian land management sector arising from
greenhouse gas abatement. Perth, Western Australia: Western Australian State
Government.
The New South Wales Government. (2005). GGAS guide to applying to become an
accredited abatement certificate provider - Greenhouse Gas Benchmark Rule (Carbon
Sequestration) No. 5 of 2003 [Electronic Version], 2009 from http://www.greenhouse.
nsw.gov.au/documents/ GtA-CS.pdf.
The New South Wales Government. (2008). Transitional arrangements for the NSW
Greenhouse Gas Reduction Scheme - Consultation paper Sydney, NSW: NSW
Department of Water and Energy.
The Parliament of Western Australia. (2003). Carbon Rights Act 2003. Perth, Western
Australia: Parliamentary Counsel's Office of Western Australia.
Turner, B., Wells, K., Bauhus, J., Carey, G., Brack, C., & Kanowski, P. (1999). Woody
biomass methods for estimating change. Canberra: Australian Greenhouse Office.
United Nations Framework Convention on Climate Change. (2002). Conference of the Parties
on its seventh session (COP 7). United Nations Framework Convention on Climate
Change Retrieved 9 January, 2010, from http://unfccc.int/ressource/docs/cop7/13a01.pdf. Nova S
cienc
e Pub
lishe
rs, In
c.

Harnessing Landholder‟s Knowledge for Environmental Monitoring ... 97
Van Vreeswyk, A. M. E., Payne, A. L., Leighton, K., & Hennig, P. (2004). Technical Bulletin
No 92 - An inventory and condition survey of the Pilbara region, Western Australia
Perth, Western Australia: Department of Agriculture.
Zianis, D., & Mancuccini, M. (2004). On simplifying allometric analyses of forest biomass.
Forest Ecology and Management, 187, 311-332.
Nova S
cienc
e Pub
lishe
rs, In
c.

Nova S
cienc
e Pub
lishe
rs, In
c.

In: Plantations ISBN: 978-1-60876-576-8
Editor: Ren Hai © 2013 Nova Science Publishers, Inc.
Chapter 6
SEDIMENTARY ORGANIC CARBON DYNAMICS IN
A NATIVE AND AN EXOTIC MANGROVE PLANTATION
BASED ON DUAL CARBON ISOTOPIC ANALYSES
Qianmei Zhang1, Jinping Zhang
1, Lianlian Yuan
1,
Chengde Shen2 and Hai Ren
1
1Department of Ecology, South China Botanical Garden, Chinese Academy of
Sciences, Guangzhou, China 2Key Laboratory of Isotope Geochronology and Geochemistry, Guangzhou Institute
of Geochemistry, Chinese Academy of Sciences, Guangzhou, China
ABSTRACT
Sedimentary organic carbon (SOC) was quantified in two mangrove plantations and
a nearby barren site based on measurements of C and C isotopes in sediment cores.
Relative to the barren site, the native Kandelia candel plantation and the exotic
Sonneratia apetala plantation greatly affected values for SOC content, 13
C, and 14
C age
from 0 to about 60 cm but not at greater depths. SOC densities to a 60-cm depth were 155
and 174 Mg ha-1
in the native and exotic plantation, respectively. Change of SOC 13
C
with depth was similar in both plantations, and the new contributions to the total SOC in
the upper 16 cm were also similar (45–47%). At 16–60 cm, however, the new C
contributions were only 9% in the native plantation but as high as 31% in the exotic
plantation, i.e., the exotic S. apetala stored more mangrove-derived new C in its
anaerobic sub-surface than the native K. candel. From the perspective of SOC storage, S.
apetala rather than K. candel is recommended for restoring the degraded coastal area in
Southern China.
Keywords: Mangroves; sedimentary organic carbon; carbon isotope
Corresponding author. E-mail address: [email protected]. Tel: +8620-37252916. Fax: +8620-37252916. Nova S
cienc
e Pub
lishe
rs, In
c.
Qianmei Zhang, Jinping Zhang, Lianlian Yuan et al. 100
INTRODUCTION
In coastal ecosystems, mangroves provide significant ecological services, such as storm
and cyclone buffering, timber and fisheries production, and prevention of coastal erosion
(Barbier et al. 2008; Shaifullah et al. 2008). Despite these values, mangroves are seriously
threatened worldwide (Alongi 2002; Yanagisawa et al. 2009). About 35% of mangrove
forests have been degraded or lost over the past several decades (Barbier et al. 2008). Most
mangroves along the shorelines of China are threatened or degraded as a result of pollution,
aquaculture, over-cropping for timber, and coastal urbanization (Benfiled et al. 2005; Ren et
al. 2008). Recently, the establishment of mangrove plantations for sustainable coastal
development has attracted widespread attention (Matsui et al. 2008). Attractive characteristics
of mangroves forests/plantations include high productivity and a low ratio of decomposition
to net primary production (Gonneea et al. 2004; Jennerjahn and Ittekkot 2002). Consequently,
mangroves sequester significant amounts of carbon (C) in biomass and sediment (Bouillon et
al. 2008; Fujimoto 2004; Twilley et al. 1992), and are regarded as potentially efficient pools
or sinks for decreasing the concentration of atmospheric CO2 and mitigating global warming.
Over the past two decades, many studies have increased our knowledge about the
dynamics of C in mangrove forests. We still lack, however, a complete understanding of the
dynamics of sedimentary organic carbon (SOC) in the mangrove forests because SOC
dynamics are controlled by a large number of physical, chemical, and biological factors at a
variety of timescales (Aller and Blair 2004; Kristensen et al. 2008).
Two powerful tools for studying ecological processes like SOC dynamics in mangrove
forests are stable and radioactive C isotopic analyses (Bouillon and Bottcher 2006; Staddon
2004; West et al. 2006). For instance, the alteration in SOC 13
C values caused by C decay
provides clues for separating stages of SOC decomposition and thereby helps clarify SOC
dynamics (Chen et al. 2002). Radiocarbon measurement of SOC reflects the mixture of new
and old organic materials. When used with a simple two-source mixing model, 14
C
measurements are helpful for detecting and quantifying the contributions of new and old C
components to the total SOC (Rethemeyer et al. 2004). Unfortunately, few studies have
simultaneously reported SOC content and its stable and radioactive C isotopic signatures
from mangrove sediments (Kristensen et al. 2008).
The east coast of the Leizhou Peninsula, Southern China, presents a unique opportunity
to compare SOC dynamics in two mangrove plantations. The native mangrove Kandelia
candel and the exotic mangrove Sonneratia apetala were planted on initially barren flats to
restore the degraded coastal area. K. candel was planted in one plantation in 1993, and S.
apetala was planted in the other plantation in 2001. Relative to K. candel, S. apetala is highly
adaptable and grows rapidly (Ren et al. 2008). It was introduced into China in 1985 and has
been planted on over 1000 ha in China since 1991 (Ren et al. 2008). Because the introduced
S. apetala grows faster than the native K. candel, we hypothesized that S. apetala plantation
would store more SOC than the native K. candel plantation but that the vertical patterns
(depth patterns) of dual C isotopes in both plantations would be similar. To test this
hypothesis, we (1) quantified SOC accumulation in both plantations and in a reference barren
flat located between the plantations; (2) separated SOC decomposition stages in both
plantations based on vertical variations of 13
C values; and (3) estimated the contributions of
new C to the total SOC in both plantations. Nova S
cienc
e Pub
lishe
rs, In
c.

Sedimentary Organic Carbon Dynamics ... 101
MATERIALS AND METHODS
Study sites
The study area is located along the east coast of Leizhou Bay and is part of the Zhanjiang
Mangrove National Nature Reserve, which is the largest mangrove reserve in China. One
sediment core was collected from each of three sites: the K. candel plantation, the S. apetala
plantation, and a reference barren flat located between the plantations (Figure 1). The
reference barren flat was considered to be representative of the initial pre-plantation
sediments, assuming negligible tidal flushing of organic matter. For all sites, the average
annual precipitation is 1711 mm, and precipitation usually falls as rain from April to October.
The average annual temperature is 22.9 þC, and the average temperature in the coldest month
(January) is 15.5 þC. Average annual relative humidity is 80%. The tidal regime is diurnal,
and the average tidal amplitude is 2.52 m. The soil is mangrove acid soil with three typical
layers (0–10 cm: black, with organic matter, 10–40 cm: grey, and >40 cm: yellow or mixed
colour). The pH value for top soils is 6.9. The typical vegetation is the Kandelia candel -
Avicennia marina (Forsk.) community (He et al. 2007).
Figure 1. Locations of soil cores in the native Kandelia candel plantation, the exotic Sonneratia apetala
plantation, and the reference barren flat in Zhanjiang, Southern China.
Sediment Sampling
During ebb tide in June 2006, one sediment core (11 cm in diameter and 100 cm in
length) was excavated in the barren flat, the native plantation, and the exotic plantation. The Nova S
cienc
e Pub
lishe
rs, In
c.
Qianmei Zhang, Jinping Zhang, Lianlian Yuan et al. 102
three cores were divided into segments based on depth and the sediment characteristics. In
order to get detailed vertical distribution data, the sampling interval was 2 cm at 0–20 cm
depth, 5 cm at 20–50 cm depth, 10 cm at 50–80 cm depth, and 20 cm at 80–100 cm depth.
The collected sediment segments were transported to the Carbon Isotope Laboratory of the
Guangzhou Institute of Geochemistry, where they were frozen at -26 °C for later analyses.
C Isotope Analyses
C isotope analyses of all samples were conducted in 2006. The frozen sediment segments
were thawed to room temperature. After visible roots and fragmentary stones were removed,
a subsample (20-35 g) of each segment was freeze-dried under vacuum for 48 h, ground using
a mortar and pestle, and then passed through a 1-mm screen to remove rootlets and coarse
sand. The samples were treated with 2 M HCl to remove carbonate and then rinsed repeatedly
with distilled water until a neutral pH was reached. Water was removed by oven-drying at 90
þC for 24 h (Stuiver and Polach 1977).
Samples were then loaded into sealed, evacuated quartz tubes and combusted with CuO
at 860 þC for 2 h. The CO2 thus generated was cryogenically purified with dry-ice and liquid
nitrogen. SOC content was calculated from the quantity of CO2 generated from the
subsamples. 13
C values were determined in one portion of the generated CO2 with a
Finnigan MAT-251 (Finnigan Mat, Germany) mass spectrometer with a precision of 0.2%
at the State Key Laboratory of Loess and Quaternary Geology, Chinese Academy of
Sciences. Results were reported in per mil deviations from the International Pee Dee
belemnite standard as: 13
C = [(13
C/12
C) sample / (13
C/12
C) standard -1] × 1000. The other portion
of the generated CO2 was catalytically reduced to graphite Accelerator Mass Spectrometry
targets using the method of Vogel et al. (1987). Radioactive C isotope ratios were determined
in the generated graphite using AMS at the Institute of Heavy Ion Physics of Peking
University. 14
C data were all normalized for isotopic fractionation of 13
C with 13
C assuming
to be -25‰. Results were reported as the conventional radiocarbon ages (yr BP) (Stuiver and
Polach 1977).
The two-Source Isotope Mixing Model
First, based on the definition of the conventional radiocarbon age, F14
C can be calculated
by the radiocarbon age as:
))8267
)1950(
8033(exp(14
yt
CF (1)
where
Nova S
cienc
e Pub
lishe
rs, In
c.
Sedimentary Organic Carbon Dynamics ... 103
dards
sample
C
C
C
C
CF
tan
12
14
12
14
14
(2)
and t is the conventional radiocarbon age and y is the measuring year, which was 2006 in this
study.
The two-source isotope mixing model (Rethemeyer et al. 2004; Trumbore 2000) was
used to calculate the contributions of new C to the total SOC in each of the sediment
segments based on F14
C values. The F14
C value can be expressed as:
)1(141414 fCFfCFCF oldnewsample (3)
where F14
Csample is the F14
C of the sample; F14
Cnew is the F14
C of the new C component; f is
the contribution of new C to the total SOC; and F14
Cold is the F14
C of the initial C substrate
(Levin and Kromer 2004).
Assuming the new C component is fresh litter derived from the mangrove plantation, we
took the average F14
C value of atmospheric 14
C concentration at the period of mangrove
growth as F14
Cnew, and we took the F14
C value at the reference barren flat as F14
Cold. Based
on the recorded annual atmospheric 14
C concentration (see Levin and Kromer 2004; Levin et
al. 2008), we calculated the average F14
C values of atmospheric 14
C concentration at the
growth period, which was 1.093 for the native plantation and 1.077 for the exotic plantation.
The value of f was obtained once the above three F14
C values (sample, new, and old C) were
put into Eq. (3).
RESULTS
Neither the native nor the exotic plantation affected SOC content below 60 cm, i.e., SOC
content below 60 cm was similar in the plantations and in the barren flat (Figure 2). At 0-60
cm depth, SOC contents in the barren flat, the native plantation, and the exotic plantation
ranged from 0.18 to 0.83%, 0.46 to 1.82%, and 0.66 to 1.63%, respectively. SOC contents at
0-16 cm depth fluctuated greatly in the native plantation but were relatively stable in the
exotic plantation. SOC contents gradually decreased between 16 to 60 cm depth in both
plantations.
Neither the native nor the exotic plantation affected SOC 13
C values below 70 cm, i.e.,
SOC 13
C values below 70 cm were similar in the plantations and in the barren flat (Figure 3).
At 0-70 cm depth, however, SOC 13
C values were smaller in the plantations than in the
barren flat. At 0-70 cm depth, SOC 13
C values in the barren flat changed only slightly with
depth, with an average value of -21.98‰. In contrast, SOC 13
C values in both plantations
were relatively stable from 0 to 18 cm but increased from 18 to 70 cm. At 0–70 cm, SOC
13
C values ranged from -27.37 to -23.38‰ in the native plantation and from -26.66 to -
23.18‰ in the exotic plantation. Nova S
cienc
e Pub
lishe
rs, In
c.

Qianmei Zhang, Jinping Zhang, Lianlian Yuan et al. 104
SOC content (%)
0.0 0.4 0.8 1.2 1.6 2.0
Dep
th (c
m)
-100
-80
-60
-40
-20
0
exotic plantationnative plantation
barren flat
60-70 cm
Figure 2. Changes in SOC content as a function of depth in the native Kandelia candel plantation, the
exotic Sonneratia apetala plantation, and the reference barren flat, Southern China. Data at 6–8 cm in
the native plantation and at 70–80 cm at the barren flat are missing due to experimental problems.
Table 1. The contributions of new C to the total SOC in the native Kandelia candel and
exotic Sonneratia apetala plantations, Southern China
Depth (cm) New C contribution (%)
Native K. candel Exotic S. apetala
0-2 41 55 2-4 49 54 4-6 53 52 6-8 46 52 8-10 38 46 10-12 49 39 12-14 46 41 14-16 36 37 16-18 11 44 18-20 20 43 20-25 4 29 25-30 11 13 30-35 8 33 35-40 2 36 40-50 11 27 50-60 3 20 Nova S
cienc
e Pub
lishe
rs, In
c.

Sedimentary Organic Carbon Dynamics ... 105
Relative to the reference barren flat, neither plantation affected SOC 14
C ages below
about 60 cm (Figure 4). At 0–60 cm, however, SOC 14
C ages in the barren flat, the native
plantation, and the exotic plantation ranged from 1397 to 2608 yr BP, 255 to 2247 yr BP, and
391 to 1657 yr BP, respectively. In both plantations, SOC 14
C ages fluctuated without obvious
trend at 0-16 cm but increased with depth from 16 to 60 cm.
Table 1 summarized the contributions of new C to the total SOC as affected by sediment
depth and plantation. The new C contributions in the plantations were relatively similar in the
upper 16 cm, with 45 ± 5% in the native K. candel and 47 ± 6% in the exotic S. apetala. At
16–60 cm, however, the new C contribution was much greater in the exotic S. apetala
plantation (31 ± 8%) than in the native K. candel plantation (9 ± 4%).
13C (‰)
-28 -27 -26 -25 -24 -23 -22 -21
Dep
th (c
m)
-100
-80
-60
-40
-20
0
70-80 cm
barren flat
native plantationexotic plantation
Figure 3. Changes in SOC 13
C as a function of depth in the native Kandelia candel plantation, the
exotic Sonneratia apetala plantation, and the reference barren flat, Southern China. The value of SOC
13
C at 6–8 cm in the native plantation is missing because of experimental problems.
DISCUSSION
SOC Accumulation in the Mangrove Plantations
SOC contents in most soil layers between 0–60 cm were dramatically higher in both
plantations than in the reference barren flat (Figure 2), indicating substantial input and
accumulation of C in the mangrove plantations. SOC density can be calculated by multiplying Nova S
cienc
e Pub
lishe
rs, In
c.
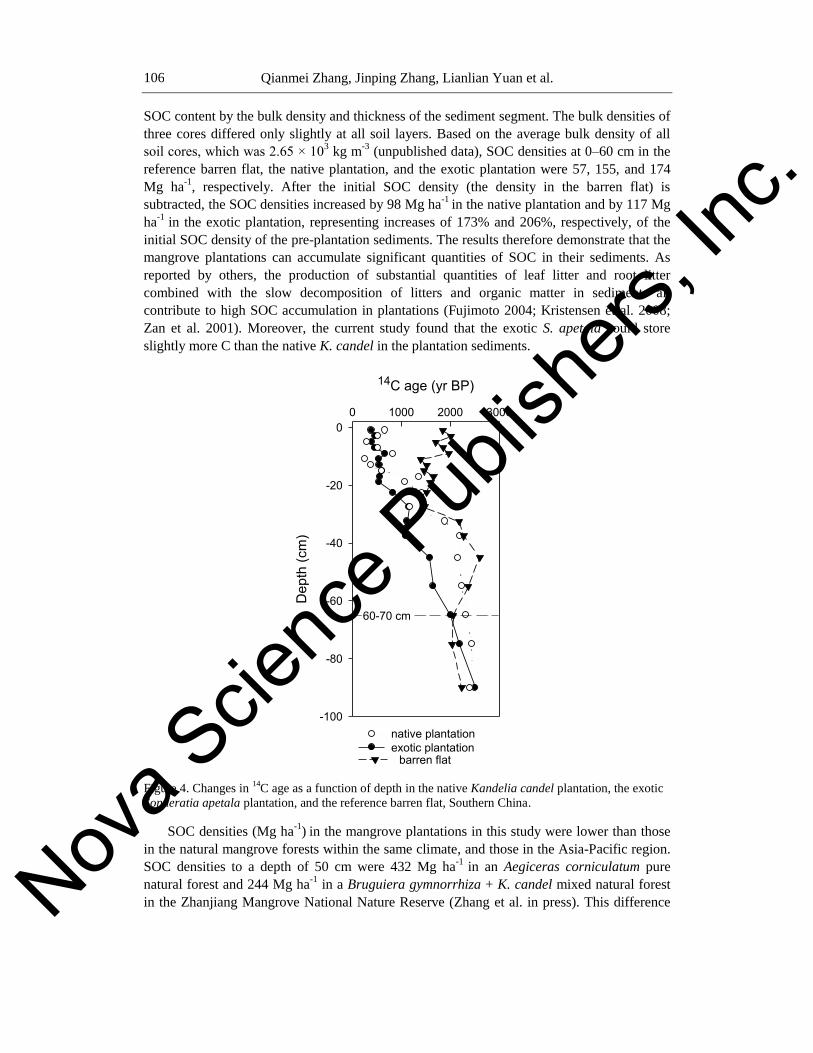
Qianmei Zhang, Jinping Zhang, Lianlian Yuan et al. 106
SOC content by the bulk density and thickness of the sediment segment. The bulk densities of
three cores differed only slightly at all soil layers. Based on the average bulk density of all
soil cores, which was 2.65 × 10³ kg m
-3 (unpublished data), SOC densities at 0–60 cm in the
reference barren flat, the native plantation, and the exotic plantation were 57, 155, and 174
Mg ha-1
, respectively. After the initial SOC density (the density in the barren flat) is
subtracted, the SOC densities increased by 98 Mg ha-1
in the native plantation and by 117 Mg
ha-1
in the exotic plantation, representing increases of 173% and 206%, respectively, of the
initial SOC density of the pre-plantation sediments. The results therefore demonstrate that the
mangrove plantations can accumulate significant quantities of SOC in their sediments. As
reported by others, the production of substantial quantities of leaf litter and root litter
combined with the slow decomposition of litters and organic matter in sediments all
contribute to high SOC accumulation in plantations (Fujimoto 2004; Kristensen et al. 2008;
Zan et al. 2001). Moreover, the current study found that the exotic S. apetala could store
slightly more C than the native K. candel in the plantation sediments.
14C age (yr BP)
0 1000 2000 3000
Dep
th (c
m)
-100
-80
-60
-40
-20
0
60-70 cm
exotic plantationnative plantation
barren flat
Figure 4. Changes in 14
C age as a function of depth in the native Kandelia candel plantation, the exotic
Sonneratia apetala plantation, and the reference barren flat, Southern China.
SOC densities (Mg ha-1
) in the mangrove plantations in this study were lower than those
in the natural mangrove forests within the same climate, and those in the Asia-Pacific region.
SOC densities to a depth of 50 cm were 432 Mg ha-1
in an Aegiceras corniculatum pure
natural forest and 244 Mg ha-1
in a Bruguiera gymnorrhiza + K. candel mixed natural forest
in the Zhanjiang Mangrove National Nature Reserve (Zhang et al. in press). This difference Nova S
cienc
e Pub
lishe
rs, In
c.
Sedimentary Organic Carbon Dynamics ... 107
probably reflects age, i.e., the two natural forests were more than 80 years old when sampled
(Zhang et al. 2009) whereas the two plantations in the current study were less than 16 years
old when sampled. In the sediments of various types of mangroves from different sites of the
Asia-Pacific region, the average SOC density was 887 Mg ha-1
with a range of 220 to 4200
Mg ha-1
; many of these sediments were sampled as deep as 100 cm and some even as deep as
200 cm (Fujimoto 2004). Because our estimates of SOC densities in sediments are based on
data only from the top 60 cm, the SOC densities in this study were underestimated relative to
the estimates based on greater depths.
SOC Decomposition in the Mangrove Plantations as Indicated by 13
C
Values
The vertical patterns of SOC 13
C (the changes in SOC 13
C with depth) were similar in
the two plantations but differed greatly between the plantations and the reference barren flat
(Figure 3). At 0–70 cm, SOC 13
C values were generally enriched with depth probably as a
result of C isotope fractionation during SOC decomposition in both plantations, but the values
were relatively stable with depth in the barren flat. SOC 13
C values in both plantations were
more negative than those in the barren flat at each soil layer possibly because the input of
13
C-depleted mangrove-derived organic matter lowered the 13
C value of the total SOC in
the plantations.
In most terrestrial soil ecosystems, SOC 13
C usually shows enrichment with depth, i.e.,
the values become less negative as soil depth increases (Balesdent et al. 1993; Boutton 1996;
Ehleringer et al. 2000; Wynn et al. 2006; Wynn 2007). The pattern is different in peat soils,
however, in that SOC 13
C values tend not to change with depth (Agren et al. 1996; Chen et
al. 2002; Collins et al. 1997). The pattern was also different in the mangrove sediments in the
current study in that SOC 13
C values were relatively stable in the top 18 cm and then became
gradually enriched as the depth increased from 18 to 70 cm (Figure 3). High productivity and
rapid organic matter deposition in mangrove forests might account for the relatively stable
pattern at the surface. The increase in SOC 13
C values between 18–70 cm, which probably
reflected decomposition, could be divided into two stages: (1) from 18 to about 35 cm, SOC
13
C values increased sharply probably as a result of C isotope fractionation resulting from
the decomposition of the labile SOC components; (2) from about 35 to 70 cm, SOC 13
C
values increased slowly probably because of the slow but steady decomposition of the
moderately resistant SOC components.
The enrichment of 13
C with depth has been related to increases in SOC decay and SOC
age with depth (Balesdent et al. 1990; Stout et al. 1981). Our results are consistent with this
statement in that the increases in SOC 13
C value with sediment depth (between 18–70 cm)
were associated with decreases in SOC content and increases in SOC 14
C age (see Figure 2–
4). Balesdent et al. (1993) reported that the enrichment in SOC 13
C with depth was similar in
eutrophic soils with rapid C decay and in oligotrophic soils with slow C decay. Our study
suggests that the increase in SOC 13
C with depth in mangrove plantations is independent of
mangrove species (see Figure 3).
Nova S
cienc
e Pub
lishe
rs, In
c.
Qianmei Zhang, Jinping Zhang, Lianlian Yuan et al. 108
Contribution of New C to the Total SOC in the Mangrove Plantations as
Indicated by 14
C Age
The contributions of new C to the total SOC ranged from 2 to 53% in the native K.
candel plantation and from 13 to 55% in the exotic S. apetala plantation (Table 1). From 0 to
16 cm, the contributions of new C differed slightly between the plantations (45 ± 5% in the K.
candel plantation and 47 ± 6% in the S. apetala plantation) but from 16 to 60 cm, the
contributions differed markedly between two plantations (9 ± 5% in the K. candel plantation
and 31 ± 8% in the S. apetala plantation). In other words, much higher contributions of new C
were transported and stored at depths between 16 and 60 cm in the S. apetala plantation than
in the K. candel plantation. Thus, from the perspective of C sequestration, S. apetala rather
than K. candel should be recommended as a key reforestation species in Southern China. Our
results are consistent with those of Ren et al. (2009), who pointed out that because S. apetala
grows rapidly and readily adapts to poor habitats, S. apetala plantations could sequester
significant amounts of C in their sediments.
Our results and inferences have some limitations. First, the calculated new C
contributions in the mangrove plantations were approximate because we assumed that the
SOC was a mixture of only new organic material (C in the mangrove-derived fresh litter) and
old organic material (C in the pre-plantation sediment). This simplification, i.e., the
partitioning of SOC into only two components, ignores the input of C from exogenous, tide-
eroded oceanic organic matter. Next we will take into account control plots to reduce the over
simplification. A second limitation is that, because of the high cost of dual C isotope
measurements, we sampled only one soil core in each plantation. Sampling with replication
will be necessary to draw more convincing conclusions.
CONCLUSION
The results of this paper, which were based on C and C isotopic measurements of the
sediment cores in a native plantation, an exotic plantation, and in an adjacent barren flat in
Southern China, indicated that establishment of the mangrove plantations resulted in the
accumulation of a large amount of SOC. The exotic S. apetala plantation stored slightly more
SOC than the native K. candel plantation. The change in SOC 13
C values with depth was
similar in both plantations, indicating that the processes of C decay are similar in the native
and exotic plantations. However, much larger quantities of mangrove-derived new C were
stored at 16–60 cm in the S. apetala plantation than in the K. candel plantation based on a
two-source isotope mixing model. Our study demonstrated that from the perspective of C
storage, S. apetala was a better plantation species than K. candel in Southern China because
the S. apetala plantation stored more labile, new C in its anaerobic sub-surface sediments.
Additional sampling and long-term monitoring are needed to increase our understanding of
SOC dynamics in these and other mangrove plantations.
Nova S
cienc
e Pub
lishe
rs, In
c.
Sedimentary Organic Carbon Dynamics ... 109
ACKNOWLEDGEMENTS
We thank Professor Li Zhi‟an, Senior Engineer Zhang Qianmei, and Mr Zou Bi (the
South China Botanical Garden), and Vice Director Xu Fanghong of the Administration of
Zhanjiang Mangrove National Natural Reserve for their help in field sampling. We also thank
Doctor Ding Ping of the Guangzhou Institute of Geochemistry, Chinese Academy of Sciences
for help and assistance in field sampling and laboratory operation. This research was
sponsored by funds of the Ministry of Science and Technology (No. 2007BAC28B04).
REFERENCES
Agren, G.I., E. Bosatta, and J. Balesdent. 1996. Isotope discrimination during decomposition
of organic matter: A theoretical analysis. Soil Science Society of American Journal
60:1121-1126.
Aller, R.C., and N.E. Blair. 2004. Early diagenetic remineralization of sedimentary organic C
in the Gulf of Papua deltaic complex (Papua New Guinea): Net loss of terrestrial C and
diagenetic fractionation of C isotopes. Geochimica Et Cosmochimica Acta 68:1815-1825.
Alongi, D.M. 2002. Present state and future of the world‟s mangrove forests. Environmental
Conservation 29:331-349.
Balesdent, J., A. Mariotti, and D. Boisgontier. 1990. Effect of tillage on soil organic carbon
mineralization estimated from 13
C abundance in maize fields. European Journal of Soil
Science 41(4):587-596.
Balesdent, J., C. Girardin, and A. Mariotti. 1993. Site-related delta-C-13 of tree leaves and
soil organic-matter in a temperate forest. Ecology 74:1713-1721.
Barbier, E.B., E.W. Koch, B.R. Silliman, S.D. Hacker, E. Wolanski, J. Primavera, E.F.
Granek, S. Polasky, S. Aswani, L.A. Cramer, D.M. Stoms, C.J. Kennedy, D. Bael, C.V.
Kappel, G.M.E. Perillo, and D.J. Reed. 2008. Coastal ecosystem-based management with
nonlinear ecological functions and values. Science 319:321-323.
Benfield, S.L., H.M. Guzman, and J.M. Mair. 2005. Temporal mangrove dynamics in relation
to coastal development in Pacific Panama. Journal of Environmental Mmanagement
76(3):263-276.
Bouillon, S., A.V. Borges, E. Castaneda-Moya, K. Diele, T. Dittmar, N.C. Duke, S.Y. Lee, C.
Marchand, J.J. Middelburg, V.H. Rivera-Monroy, T.J. Smith, and R.R. Twilley. 2008.
Mangrove production and carbon sinks: a revision of global budget estimates. Global
Biogeochemical Cycles 22:GB2013. doi:10.1029/2007GB003052.
Bouillon, S., and M.E. Bottcher. 2006. Stable isotopes in biogeosciences-Preface. Organic
Geochemistry 37:1197-1199.
Boutton, T.W. 1996, Stable carbon isotope ratios of soil organic matter and their use as
indicators of vegetation and climate change. In Mass spectrometry of soils, eds. T.W.
Boutton, and S. Yamasaki, 311-339. Marcel Dekker. New York.
Chen Q.Q., C.D. shen, S.L. Peng, Y.M. Sun, W.X. Yi, Z.A. Li, and M.T. Jiang. 2002. Soil
organic matter turnover in the subtropical mountainous region of South China. Soil
Science 167(6): 401-415. Nova S
cienc
e Pub
lishe
rs, In
c.
Qianmei Zhang, Jinping Zhang, Lianlian Yuan et al. 110
Collins, H.P., E.A. Paul, K. Paustain, and E.T. Elliott. 1997. Characterization of soil organic
carbon relative to its stability and turnover. In The role of soil organic matter in
agricultural systems and global change, eds. E.A. Paul, K. Paustain, E.T. Elliott, and C.V.
Cole, 51-72. CRC Press Inc. New York.
Ehleringer, J.R., N. Buchmann, and L.B. Flanagan. 2000. Carbon isotope ratios in
belowground carbon cycle processes. Ecological Applications 10:412-422.
Fujimoto, K. 2004. Below-ground carbon sequestration of mangrove forests in the Asia-
Pacific region. In Mangrove management and conservation: present and future, eds. M.
Vannucci, 138-146. United Nations University Press, Tokyo, Japan.
Gonneea, M.E., A. Paytan, and J.A. Herrera-Silveira. 2004. Tracing organic matter sources
and carbon burial in mangrove sediments over the past 160 years. Estuarine Coastal and
Shelf Science 61:211-227.
He, B.Y., T.H. Lai, H.Q. Fan, W.Q. Wang, and H.L. Zheng. 2007. Comparison of flooding-
tolerance in four mangrove species in a diurnal tidal zone in the Beibu Gulf. Estuarine
Coastal and Shelf Science 74:254-262.
Jennerjahn, T.C., and V. Ittekkot. 2002. Relevance of mangroves for the production and
deposition of organic matter along tropical continental margins. Naturwissenschaften
89:23-30.
Kristensen, E., S. Bouillon, T. Dittmar, and C. Marchand. 2008. Organic carbon dynamics in
mangrove ecosystems: A review. Aquatic Botany 89, 201-219.
Levin, I., and B. Kromer. 2004. The tropospheric (CO2)-C-14 level in mid-latitudes of the
Northern Hemisphere (1959-2003). Radiocarbon 46:1261-1272.
Levin, I., S. Hammer, B. Kromer, and F. Meinhardt. 2008. Radiocarbon observations in
atmospheric CO2: Determining fossil fuel CO2 over Europe using Jungfraujoch
observations as background. Science of the Total Environment 391:211-216.
Matsui, N., J. Suekuni, S. Havanond, A. Nishimiya, J. Yanai, and T. Kosaki. 2008.
Determination of soil-related factors controlling initial mangrove (Rhizophora apiculata
BL.) growth in an abandoned shrimp pond. Soil Science and Plant Nutrition 54:301-309.
Ren, H., H. Chen, Z.A. Li, and W.D. Han. 2009. Biomass accumulation and carbon storages
of four different aged Sonneratia apetala plantations in Southern China. Plant and Soil.
Doi:10.1007/s11104-009-0053-7.
Ren, H., S.G. Jian, H.F. Lu, Q.M Zhang, W.J. Shen, W.D. Han, Z.Y. Yin, and Q.F. Guo.
2008. Restoration of mangrove plantations and colonization by native species in Leizhou
bay, South China. Ecological Research 23: 401-407.
Rethemeyer, J., P.M. Grootes, F. Bruhn, N. Andersen, M.J. Nadeau, C. Kramer, and G.
Gleixner. 2004. Age heterogeneity of soil organic matter. Nuclear Instruments and
Methods in Physics Research B 223-224:521-527.
Shaifullah, K.M., M. Mezbahuddin, M. Sujauddin, and S.M.S. Haque. 2008. Effects of
coastal afforestation on some soil properties in Lakshmipur coast of Bangladesh. Journal
of Forestry Research (Harbin). doi: 10.1007/s11676-11008-10005-11678
Staddon, P.L. 2004. Carbon isotopes in functional soil ecology. Trends in Ecology &
Evolution 19:148-154.
Stout, J.D., K.M. Goh, and T.A. Rafter. 1981. Chemistry and turnover of naturally occurring
resistant organic compounds in soil. In Soil biochemistry, eds. E.A. Paul, and J.N. Ladd,
19-24. Marcel Dekker. New York. Nova S
cienc
e Pub
lishe
rs, In
c.
Sedimentary Organic Carbon Dynamics ... 111
Stuiver, M., and H.A. Polach. 1977. Discussion reporting of 14
C data. Radiocarbon 19: 355-
363.
Trumbore, S. 2000. Age of soil organic matter and soil respiration: Radiocarbon constraints
on belowground C dynamics. Ecological Applications 10:399-411.
Twilley, R.R., R.H. Chen, and T. Hargis.1992. Carbon sinks in mangroves and their
implications to carbon budget of tropical coastal ecosystems. Water Air and Soil
Pollution 64:265-288.
Vogel, J.S., D.E. Nelson, and J.R. Southon. 1987. C-14 background levels in an Accelerator
Mass-Spectrometry system. Radiocarbon 29:323-333.
West, J.B., G.J. Bowen, T.E. Cerling, and J.R. Ehleringer. 2006. Stable isotopes as one of
nature's ecological recorders. Trends in Ecology & Evolution 21:408-414.
Wynn, J.G. 2007. Carbon isotope fractionation during decomposition of organic matter in
soils and paleosols: Implications for paleoecological interpretations of paleosols.
Palaeogeography Palaeoclimatology Palaeoecology 251:437-448.
Wynn, J.G., J.W. Harden, and T.L. Fries. 2006. Stable carbon isotope depth profiles and soil
organic carbon dynamics in the lower Mississippi Basin. Geoderma 131:89-109.
Yanagisawa, H., S. Koshimura, K. Goto, T. Miyagi, F. Imamura, A. Ruangrassamee, and C.
Tanavud. 2009. The reduction effects of mangrove forest on a tsunami based on field
surveys at Pakarang Cape, Thailand and numerical analysis. Estuarine Coastal and Shelf
Science 81:27-37.
Zan, Q.J., Y.J. Wang, and W.B. Liao. 2001. Biomass and net productivity of Sonneratia
carseolaria-Sonneratia apetala mangrove forest. Journal of Wuhan Botanical Research
15:391-397.
Zhang, J.P., C.D. Shen, H. Ren, and K.X. Liu. Quantification of soil organic carbon storage
and turnover of high and middle tidal mangrove stands based on dual carbon isotopic
measurements. Ecological Modelling, in press.
Zhang, J.P., H. Ren, W.J. Shen, S.G. Jian, and F.H. Xu. 2009. Community composition,
species diversity and population biomass of the Gaoqiao mangrove forest in Southern
China. In International wetlands: Ecology, conservationa and restoration, eds. J.R.
Herrera, 177-189. Nova Science Publisher, Inc. New York.
Nova S
cienc
e Pub
lishe
rs, In
c.

Nova S
cienc
e Pub
lishe
rs, In
c.

In: Plantations ISBN: 978-1-60876-576-8
Editor: Ren Hai © 2013 Nova Science Publishers, Inc.
Chapter 7
THE POTENTIAL FOR CARBON SEQUESTRATION
IN CARBON DEPLETED AREAS OF THE BOREAL
FOREST ECOZONE THROUGH AGROFORESTRY-
BLOCK PLANTATION
Silvia Lac1,
and Manuel Esteban Lucas-Borja2,†
1Forestry Engineer Consultant, University of
Saskatchewan, Saskatchewan, Canada 2Department of Agroforestry Technology and Science
and Genetics, School of Advanced Agricultural Engineering
Castilla La Mancha University, Albacete, Spain
ABSTRACT
Agroforestry systems have been considered an important tool in the mitigation for
climate change. The conversion from forests to any other land-use is currently placing the
forest sector as the second with greatest emission of carbon dioxide worldwide (larger
than the transportation sector) and thus contributing to climate change. Actions to
contain/reverse/minimize carbon losses from the conversion from forests to any other
land-uses are furthermost important as can influence temperature rise in magnitude,
velocity (gradual increase gives ecosystems greater chances to adapt, less mortality), and
impacts (e.g., biodiversity, ecosystem functions and services). Where forest lands are in
high demand and or have been permanently changed to other land-uses, agroforestry may
be the only option available to restore to certain extent the original biome and recover the
carbon stocks lost to the land use conversion that took place in the past (from forests to
agriculture). Saskatchewan is the main agricultural province in Canada and is also the
case where many farms have been developed on previous forest soils (Gray Luvisolic and
Dark Gray Chernozemic/Luvisolic). The Boreal Forest is one of the world´s carbon
richest ecosystems, especially in the soils. Carbon stock change or carbon sequestration
potential was estimated for agroforestry systems type of wood fiber plantations adopted
Silvia Lac. E-mail: [email protected].
ý Manuel Esteban Lucas-Borja. Campus Universitario s/n, CP 02071, Albacete, Spain. E-mail: ManuelEsteban.
[email protected]. Nova S
cienc
e Pub
lishe
rs, In
c.
Silvia Lac and Manuel Esteban Lucas-Borja 114
for Saskatchewan Boreal forest soils, in the nearby areas to wood processing facilities
(converted into products). Carbon stocks were estimated for aboveground and
belowground compartments, and in forest products. Research gaps were also identified to
improve future estimations. Carbon sequestration estimations were carried out for future
scenarios of approximately 500 years, for different species, adoption rates, carbon pools
considered, and approaches to the forest products accounting system. The time-step used
was the rotation length.
Above- and belowground C sequestration potential calculated in 10-ha farms
converted to single species wood fiber plantation was higher for hybrid poplar (91.3 Mt
C) than for trembling aspen (19.1 Mt C) and white spruce (17.8 Mt C). When the forest
products pool) was considered (three pools), C sequestration potential was higher for
both trembling aspen and white spruce (0.4 Mt C) than for hybrid poplar (-9 Mt C). The
three- pools calculation was reproduced for hybrid poplar using the production approach,
which tends to penalize exporting countries by accounting emissions for the forest
products pool. This resulted in greater deficit/emission (-2.3 Mt C) due to Canada´s great
exports. The most important research needs identified included growth curves,
conversion and expansion factors, and soil organic carbon measurements. These
data/measurements are required for each cultivated species, agroforestry design and
silvicultural conditions (spacing, site quality, and stand management, etc).
Keywords: Climate change, carbon, carbon sequestration, carbon model, agroforestry, boreal
forest
INTRODUCTION: CLIMATE CHANGE AND THE FORESTRY SECTOR
Global warming is expected to cause both short-term and long-term effects, with earlier
impacts closer to the poles where most warming is predicted and observed (Intergovernmental
Panel on Climate Change, 2007), where carbon rich ecosystems and specially the boreal
forest can play a critical role both in mitigating or aggravating the issue through positive
feedback (the more temperature increase, the faster the decomposition rates and carbon
dioxide emissions feeding further to the temperature increases through increase in greenhouse
gas accumulation to the atmosphere).
All predictions indicate that temperature will increase, and increase more in the winter
than in the summer, however, not all places will experience a steady increase in temperature,
and locations with minimum and maximum temperature anomalies will change with time
(Stewart et al., 1997; Singh and Wheaton, 1991). The increase in temperature is expected to
lead to an increase in precipitation (Stewart et al., 1997; Singh and Wheaton, 1991). However
the increase in precipitation would not compensate for the increased evapotranspiration and
droughts would occur (Herrington et al., 1997). For the Prairies, the same authors reported
that the drought of the late 1980s resulted in reduced volume growth, increased seedling
mortality, and increased disturbances compared to the previous 50 years´ diseases (tent
caterpillar and spruce budworm) and fires. The boreal forest vegetation growth and
regeneration are predicted to be positively affected in some areas, while negatively affected in
other areas (Stewart et al., 1997; Herrington et al., 1997).
As the geographical distribution of boreal forest species is controlled by temperature and
precipitation, the boreal forest is also predicted to shift to new species composition as a result Nova S
cienc
e Pub
lishe
rs, In
c.

The Potential for Carbon Sequestration in Carbon Depleted Areas … 115
of climate change Singh and (Wheaton, 1991; International Institute for Applied Systems,
Analysis Future climate change and carbon budgets, 2000).
In the next century, with suitable conditions, the boreal forest is migrating northwards
into areas suited to sub-arctic and tundra ecosystems; and the climate at the southern edge of
the boreal forest is changing towards conditions more suitable to temperate forests and
grasslands. The boreal forest would then shrink considerably from its present size, as a result
of its southern boundary migrating faster northwards than its northern boundary (Stewart et
al., 1997).
This would result in a decreased forest carbon storage capacity. Wetlands and peatlands
could also dry out as a result of climate change, losing their ability to maintain carbon stocks
and releasing great amounts of carbon dioxide and methane into the atmosphere, thus
contributing to further climate change/global warming (Singh and Wheaton, 1991). So far, the
effects on the northern portion of the boreal forest are evident. A receding permafrost zone
and a noticeable warming in permafrost temperatures have been observed in forest and tundra
regions (Stewart et al., 1997). As the same authors report, there is evidence to the increase in
vegetation productivity between 45 and 70 degrees north, improved seed production by boreal
tree species along the northern boreal forest; increased disturbances related to fire compared
to prior periods; and accelerated phenological development in spruce.
Despite most predictions agree on the consequences of climate change at the global scale,
climatic parameters such as precipitation, temperature, and solar radiation intensity are still
difficult to predict (International Institute for Applied Systems, Analysis Future climate
change and carbon budgets, 2000; Waring and Running, 1998). Difficulties arise due to the
current limitations of understanding and representing climatic changes and also in transferring
global information to regional or local scales (Waring and Running, 1998). These, in turn,
result in uncertainties about the timing, location, and rate of projected changes as well as the
potential benefits of the climate change impacts (Stewart et al., 1997). Nevertheless, more and
more observations and evidences have been collected and these to confirm much prediction
ranges and all trends (Intergovernmental Panel on Climate Change, 2007).
The Canadian economy depends greatly on forestry. And the Canada‟s balance of trade
has benefitted much in the past from the contribution of forest products exports (Canadian
Forest Service, 1999). A loss of the current area due to the shrinkage of the boreal forest then
would greatly affect the Canadian economy. Forest companies would be forced to move
northwards and, if the boreal forest continues to shrink, the forestry sector may no longer be
able to operate in this region sometime in the future. The market for forest products has
shifted induced by the exports from lumber, wood pulp and printing paper to composite
panels and prefabricated buildings (Canadian Forest Service, 1999). Saskatchewan, with only
6.9% of Canadian forestlands exports almost 2% of Canada´s exports as wood pulp, paper
and paperboard, softwood lumber, and waferboard; and the main export markets for these
products are the US, European Union, Japan, Central and South America (Canadian Forest
Service, 1999). The market for export is growing for Saskatchewan, as well as for Canada
and, according to Mistik Management (Mike Martel, personal communication) and
Weyerhaeuser Corporation (Darryl Sande, personal communication), a shortage of wood is
predicted within 20 years from now. According to predictions, the Meadow Lake, Prince
Albert and Hudson Bay areas will see a reduction of the wood supply over the coming 5 to 10
years (Mak et al., 1999). Climate change forecasts are therefore highly incompatible to supply
this growing market for forest products. Nova S
cienc
e Pub
lishe
rs, In
c.

Silvia Lac and Manuel Esteban Lucas-Borja 116
Adaptation and mitigation strategies include managing stands to reduce fires, prescribed
burning, managing forest fuel, preserving and enhancing biodiversity, and managing forest
landscapes that are becoming increasingly fragmented (Herrington, 1997). Forestry
companies can replace natural species by planting better adapted species when the natural
species die, or move to locations where timber becomes more abundant; however the
adaptation of wildlife would be more difficult (Herrington, 1997).
Agroforestry can help to mitigate climate change directly through its carbon sequestration
potential; or indirectly if through releasing the harvesting pressure over natural forests. They
also include agricultural land use (potential to adopting agroforestry systems) that is in areas
that are both accessible and highly productive in Canada (Mak et al., 1999). With only 6% of
the forested area within agricultural rural Canada this supplies 19% of all round timber
harvested in the country, 79% of maple products, 79% of firewood and 100% of Christmas
trees. Furthermore difficulties in the forestry sector (economic downturns and diseases) can
turn into opportunities to the new agroforestry sector. As a result, And the unprecedented
combination of climate change and disturbances (e.g. flooding, drought, wildfire, insects,
ocean acidification) and other global change drivers (e.g. land-use change, pollution,
fragmentation of natural systems, overexploitation of resources) (Intergovernmental Panel on
Climate Change, 2007), may yet bring additional problems together which can prove difficult
to the Canadian forestry industry to overcome. And currently, the few mitigation options that
can contribute to reducing risks (highest rate of carbon stock change) for the short term
include stopping land-use conversion from primary forests to other land uses, and the
restoration of forestlands previously converted to other land uses.
METHODS TO ACCESS CARBON SEQUESTRATION IN
THE FOREST COMPONENT OF AGROFORESTRY SYSTEMS
Two methods are currently accepted under the Kyoto Protocol to be used for carbon
accounting in terrestrial ecosystems: the stock change and carbon flux approaches (Tipper and
De Jong, 1998; Watson et al., 2000). In the stock change approach, the carbon stocks in
vegetation tissues and in the soil are measured at different times, and the difference in the
carbon stock is the net ecosystem productivity (Watson et al., 2000). As these authors report,
carbon stock change receive a positive value when carbon stocks increase overtime
(sequestration) and a negative value when carbon is released or lost from the ecosystem.
The carbon flux approach is based in periodic measurements of carbon fluxes into and
out an ecosystem (Watson et al., 2000). As the same authors report, the carbon flux is usually
based on chambers and the eddy correlation/covariance technique. Estimates of carbon
sequestered with this method vary greatly due to climatic fluctuations and occasional insect
outbreaks, and also are highly affected by inter-annual variations in climate (Kostela et al.,
2000). Although this method is considered the most realistic, following forest carbon balances
on a yearly basis, it is more difficult and costly (Kostela et al., 2000; Watson et al., 2000).
Also, this method can be at best applied to local scales and short-term research (Kostela et al.,
2000), as research stations capable to measure fluxes are currently not numerous enough to
represent larger areas (Watson et al., 2000). Nova S
cienc
e Pub
lishe
rs, In
c.
The Potential for Carbon Sequestration in Carbon Depleted Areas … 117
Although methods exist to measure stocks as well as the fluxes of carbon in all
components of the terrestrial ecosystems (Watson et al., 2000), the stock change approach is a
lower cost and easier method and is less influenced by short-term fluctuations in the carbon
balance (Kostela et al., 2000; Watson et al., 2000) This method is normally applied for whole
rotation periods, with data more readily available and therefore more representative of the
ecosystems‟ heterogeneity (Watson et al., 2000). For this reason the stock change approach is
used most extensively to predict changes to the carbon cycle.
As research stations or field data to predict changes in the carbon cycle for agroforestry
ecosystems are currently not available, no other accounting method could be considered in
this study other than the stock change approach. Therefore, the stock change approach was
used for the forest component of the agroforestry ecosystem.
Within the stock change approach, the forest component of the agroforestry ecosystem
can be further divided as follows: (1) the aboveground C component which includes stem,
top, branches, foliage and stump; and (2) the belowground C component which includes roots
and sometimes soils (Bonnor, 1985). For a particular forest ecosystem, the amount of biomass
and therefore carbon allocated in aboveground components is primarily influenced by the soil
capability, nutrient status, and available moisture (Fisher and Binkley, 1999). Better soils,
nutrient status and moisture conditions will require trees less allocation of resources to root
development and sooner development of trees aboveground biomass (and carbon) (Fisher and
Binkley, 1999).
Different species of a given ecosystem may have particular allocation patterns, as a result
of different characteristics, such as photoperiod, nutrient and moisture requirements, and root
systems (Fisher and Binkley, 1999; Peterson and Peterson, 1992). Carbon allocation is also a
function of tree age, which determines young trees to have higher proportion of roots in
relation to the aboveground biomass, while the inverse occurs with mature trees (Fisher and
Binkley, 1999; Kurz, 1992; Peterson and Peterson, 1992).
STUDY AREA
The study area included the rural areas of Meadow Lake, Prince Albert and Hudson Bay.
These communities were chosen due to their heavy economic reliance on the forestry industry
(Canadian Forest Service, 1999; Mak, 1999). These communities have two pulp mills and a
paper mill, two OSB mills, a plywood mill, and over 130 sawmills (Brady and Appleby,
2000; Acton et al., 1998). These mills produce a wide range of marketable products, such as
lumber, plywood, wood chips, OSB, pulp and paper (Brady and Appleby, 2000). Therefore a
market for wood produced already exists, and regional deficits of softwoods are predicted for
Prince Albert and Hudson Bay (Mak, 1999).
Another important aspect to consider selecting the study within the distance range which
forestry companies, are willing to purchase and transport wood from.
From the carbon sequestration perspective, it is important that there is an incentive to
harvest trees when they are highly productive (before declining in productivity and carbon
sequestration potential), and that the carbon in the merchantable wood is be transferred to the
products pool and therefore stored/sequestered for longer (specially in longer lived products
such as for housing, but also in shorter lived products such as printing paper and recycling) Nova S
cienc
e Pub
lishe
rs, In
c.

Silvia Lac and Manuel Esteban Lucas-Borja 118
before they are disposed and the carbon is returned to the atmosphere (through immediate
release when burned for instance and or by decomposition where consumed by
microorganisms which release carbon back through respiration) (Watson et al., 2000; Kurz et
la., 1992; Canadian Climate Change Secretariat, 1999). The distances considered by the
existing wood processing facilities to purchase and transport wood from consist in the
following ranges: within a 150 km radius from the city of Meadow Lake (Mike Martel,
personal communication); within 50 km south, 50 km north, 100 km east, and 150 km west
from the city of Prince Albert; and within a 150 km radius from the city of Hudson Bay
(Darryl Sande, personal communication). Another important aspect considered in selecting
the study area is to work within the boundaries of the Boreal forest ecosystem. In such way,
the benefits produced by the restoration to the biome and ecosystem´s functions and services
(habitat, wildlife corridors, water quality, soil protection, etc.) can be maximized (Canadian
Climate Change Secretariat, 1999). The Boreal forest is nevertheless a highly rich carbon
biome (among the richest in the world). If carbon depletion is stopped and the lost C restored,
this could potentially recover about 30% of carbon stocks lost in the first few years after the
land-use conversion to agriculture (and other land uses), assuming that the maximum storage
in native forest conditions can be fully restored and maximum storage does not surpass
(Watson et al., 2000). Soils where these lands use changes (to agriculture) occurred (i.e., Gray
Luvisolic and Dark Gray Chernozemic/Luvisolic) were included in this study. Thirty-five
rural municipalities (RM‟s) were selected to take part in this study (figure 1). Each individual
RM was included only if simultaneously met 2 criteria: (1) the RM area had minimum of
50% cover of forest soils (Gray Luvisolic and Dark Gray Chernozemic/Luvisolic) and (2) RM
was within the distance range from wood processing facilities (information compiled from
questionnaires sent to the main facilities). Maps were used in GIS from the Saskatchewan
Land Resource Centre/University of Saskatchewan and agricultural land-use data for RM´s
was compiled from Statistics Canada (Statistics Canada, 1996). Ecozones and Ecoregions
maps were provided by the Saskatchewan Land Resource Centre/University of Saskatchewan.
The analysis indicates that 7,206 farms (383.68 ha in average) have the potential to be
converted to agroforestry systems, where each farm had an average area. The methods and
assumptions are further described in (Lac, 2002).
The study area was characterized in Acton et al. (1998). Its elevation ranges from 500 m
in its eastern part to 600 m in its western part, with generally a gradual break from plains to
uplands. It has a humid continental climate at lower elevations and in the southern part of the
study area, and sub-arctic climate at higher elevations and in its northern part, with
temperatures generally decreasing from south to north and from east to west. Total
precipitation is variable and low, increasing from southwest to northeast the study area. The
area has long and cold to very cold and snowy winters and short, warm and moist summers.
There is a gradual increase in wildlife productivity and diversity from north to south in the
study area, as the vegetation diversity increases. Aspen forests and their understory vegetation
provide habitat for many wildlife, such as beaver, deer, snowshoe, white tailed rabbit, etc.
The main human activities in the study area described by the same authors are forestry,
agriculture, hunting, trapping outdoor recreation, tourism, oil and gas exploration and
production, and mining. Forestry operations focus on pulp and paper production, with some
panelboard and saw mill operations, and less than 9% of the study area is within some form of
park or protected area, the majority of which are Wildlife Habitat Protection Act lands (Acton
et al., 1998). Nova S
cienc
e Pub
lishe
rs, In
c.

The Potential for Carbon Sequestration in Carbon Depleted Areas … 119
Figure 1. Study area, area available for the adoption of agroforestry systems in Saskatchewan.
FUTURE SCENARIOS RESULTS
Future scenarios of approximately 500 years were produced (Table 1). The time scale
was selected by the research team as the most reliable since using past records to estimate
future conditions is inherently limited.
Two native species (trembling aspen and white spruce) were considered to maximize
benefits (biodiversity, wildlife habitat and corridors, etc.) and according to best ecozones and
ecorregion maps and soil types inference for vegetation; using GIS and further described in
Lac (2002). A fast growing species was considered to maximize production and shorter term
income to farmers.
Thus, hybrid poplar varieties Walker and Assiniboine were included in this study as they
show best performance currently in the study area, according to the PFRA Shelterbelt Centre
and their publications, further described in the author´s M.Sc. thesis (Lac, 2002) which this
article is largely a summary. Due to the lack of information to different types of agroforestry
systems in the study area, block-arrangements/wood fiber plantations were considered to
resemble natural stands from which data could be used for next best substitute. A complete
description for methods, conversion and expansion factors used and assumptions is available
in Lac (2002).
Hybrid poplar growth curves (models for trees growth in the forestry sector, expressed in
volume per hectare yearly and for commercial use to specific forestry products) adapted
curves (Peterson et al., 1999), available for the Prairies (pulpwood) were used, assuming an
intermediate quality site, 3x3m tree spacing, no mortality, and medium intensity
management- site preparation, some cultivation and weed control.
Nova S
cienc
e Pub
lishe
rs, In
c.

Silvia Lac and Manuel Esteban Lucas-Borja 120
Table 1. Future scenarios considered for carbon sequestration in wood fiber plantations
Hybrid
poplar
Scenario 1: All farms currently without agroforestry systems convert 10 ha to
hybrid poplar wood fiber plantations. The projection was done for 495 years,
included 2 carbon pools (aboveground and belowground), and rotation periods of
15 years [19]. Result: 91.3 Mt C (sequestration).
Scenario 2: All farms currently without agroforestry systems convert 10 ha to
hybrid poplar wood fiber plantations. The projection was done for 495 years,
included 3 carbon pools (aboveground, belowground, and forest products), and
rotation periods of 15 years. Result: - 9 Mt C (emission).
Scenario 3: All farms currently without agroforestry systems convert 10 ha to
hybrid poplar wood fiber plantations. The projection was done for 495 years,
included 3 carbon pools (aboveground, belowground, and forest products), and
rotation periods of 15 years. In this scenario, all sequestration in the forest
products pool was accounted for Canada (production approach). Result: -2.3 Mt C
(emission).
Scenario 4: 360 farms convert 10 ha to hybrid poplar wood fiber plantations over
15 years (average adoption of 24 farms per year), until all farms currently without
agroforestry systems are converted. The projection was done for 495 years,
included 2 carbon pools (aboveground and belowground carbon stocks), and
rotation periods of 15 years. Result: 65.5 Mt C (sequestration).
Trembling
aspen
Scenario 5: All farms currently without agroforestry systems convert 10 ha to
trembling aspen wood fiber plantations. The projection was done for 490 years,
included 2 carbon pools (aboveground and belowground), and rotation periods of
70 years. Result: 19.1 Mt C (sequestration).
Scenario 6: All farms currently without agroforestry systems convert 10 ha to
trembling aspen wood fiber plantations. The projection was done for 490 years,
included 3 carbon pools (aboveground, belowground, and the forest products), and
rotation periods of 70 years. Result: 0.4 Mt C (sequestration).
Scenario 7: 1,680 farms convert 10 ha to trembling aspen wood fiber plantations
over 70 years (average adoption of 24 farms per year), until al farms currently
without agroforestry systems are converted. The projection was done for 495
years, included 2 pools aboveground and belowground), and rotations of 70 years.
Result: 15 Mt C (sequestration).
White
Spruce
Scenario 8: All farms currently without agroforestry systems convert 10 ha to
white spruce wood fiber plantations. The projection was done for 490 years,
included 2 carbon pools (aboveground and belowground carbon stocks), and
rotation periods of 70 years. Result: 17.8 Mt C (sequestration).
Scenario 9: All farms currently without agroforestry systems convert 10 ha
to white spruce wood fiber plantations at once. The projection was done for 490
years, included 3 carbon pools (aboveground, belowground, and the forest
products), and rotation periods of 70 years. Result: 0.4 Mt C (sequestration).
Scenario 10: 1,680 farms convert 10 ha to white spruce wood fiber plantations
over 70 years (average adoption of 24 farms per year), until al farms currently
without agroforestry systems are converted. The projection was done for 495
years, included 2 carbon pools (aboveground and belowground carbon stocks),
and rotations of 70 years. Result: 13.9 Mt C (sequestration). Nova S
cienc
e Pub
lishe
rs, In
c.
The Potential for Carbon Sequestration in Carbon Depleted Areas … 121
The marketable wood volume was converted to biomass using a wood basic density/
conversion factor of 0.358 t/m3
(Shroeder, 1996) an expansion factor of 1.454 was applied to
include all aboveground non-merchantable components (Peterson et al., 1999), and all
aboveground biomass was converted to carbon using a conversion factor of 0.42 (Horwath et
al., 1994). Soil carbon sequestration values are adopted from north central US (Hansen,
1993).
For trembling aspen, the state level forest government agency (Saskatchewan
Environment- Phil Loseth, personal communication) provided with growth curves from
natural stands (Golder Associates Ltd. Report on Construction of Yield Curves for Inventory
Zones C20, C30, C40, and C50 in Saskatchewan, 2001). The provincial growth curves for
trembling aspen are a compilation of data from various local inventories, which were part of
the Volume Sampling Program carried out between 1970 and 1990. The median of these
growth curves (C20, C50 and C60) was taken, which produced one growth curve for each of
the four crown density classes (i.e., crown cover of >10% <30%, >30% <55%, >55% <80%,
and >80%).
Second, the average between the two growth curves for the intermediate crown density
classes was taken and assumed representative of the study area. Marketable volume was
converted to biomass using a wood basic density/conversion factor of 0.408 t/m3 (Singh,
1987), an expansion factor of 1.18 was applied to include all aboveground non-merchantable
components (Singh, 1987), and a conversion factor of 0,502 was applied to convert all
aboveground biomass to carbon (Tillman, 1981).
For white spruce, growth curves were also provided from Saskatchewan Environment for
natural stands (Golder Associates Ltd. Report on Construction of Yield Curves for Inventory
Zones C20, C30, C40, and C50 in Saskatchewan, 2001), and data was processed in the same
manner as for white spruce whereas intermediate crown density classes was used and
assumed representative. The marketable volume was converted to biomass using a factor
(wood basic density) of 0.364 t/m3 (Wang and Micko, 1984), an expansion factor of 1.20 was
applied to include all aboveground non-merchantable components [28], and a conversion
factor of 0.527 was applied to convert biomass to carbon (Tillman, 1981).
The belowground carbon stocks for trembling aspen and white spruce were calculated
using values compiled for the carbon for the entire soil profile (Siltanen, 1997), because often
forestry methods used result in great soil disturbance and mixing of in the entire soil profile.
The best available soil organic carbon database which also permitted simultaneous queries for
soil zones, species (at mature age), ecoclimatic provinces or provinces, and also soil organic
carbon measurements for the entire soil profile, was the “Soil Profile and Organic Carbon
Data Base for Canadian Forest and Tundra Mineral Soils” (Siltanen, 1997).
The assumption therefore was that all carbon lost to the land-use conversion to
agriculture (30%) is fully recovered within the first rotation (70 years) to the maximum
potential for carbon storage, although few sources are available for long term records to
confirm this assumption (Siltanen, 1997).
Nevertheless it is expected that the maximum potential for carbon storage in agricultural
soils is unlikely to exceed that of their native condition (Yanai, et al., 2000; Nagle, 1990;
Janzen et al., 1998; Bruce et al., 1999). Values for soil carbon are assumed to include roots as
a conservative approach to avoid double accounting issues.
Due to difficulties in distinguishing the sources of soil organic carbon when sampling,
adding estimations of carbon stocks in roots biomass to estimations of carbon stocks in the Nova S
cienc
e Pub
lishe
rs, In
c.
Silvia Lac and Manuel Esteban Lucas-Borja 122
soil organic matter and mineral soil horizons is likely to cause double accounting for the
belowground carbon pool according to re-known soil scientists in the research team (Dan
Pennock and Marie Boehm), and therefore one of these should be chosen.
However, this can underestimate the C in the soil compartment. This is not addressed
directly (in other accounting methods such as the Carbon Budget Model for the Canadian
Forest Service (Kurz, 1992; Bruce et al., 1999).
For the forest products pool, it was possible to estimate future use of the species, in
consultation with the wood processing facilities and expert‟s opinion. Using the stock change
approach, the exports were estimated, together with the selection of an end disposal for
products and tree parts resulting from the industrial process. Half-lives (Skog, 1999) (time
that takes for half carbon to be released) were applied for each product when disposed to
decompose, and carbon was accounted as instant release when burning is used. Very long
carbon sequestration periods are considered in cases such as sawdist piles, whereas partial
decomposition is negligible (Price et al., 1996). Hybrid poplar end use is mostly to oriented
strand board- OSB; trembling aspen end use is mostly OSB and pulp and paper; and white
spruce end-use is to lumber, panels, and paper. The production approach was also used for
comparison (where all carbon sequestration/emission is accounted from the ecosystem).
Further details for accounting methods are available in (Lac, 2002).
Results indicate that the highest carbon sequestration potential will be reached for future
scenarios considering single species established on gray soils (Gray Luvisolic and Dark Gray
Chernozemic/Luvisolic) of Saskatchewan (10 ha per farm), and accounting for 2
compartments only (i.e., including aboveground and belowground C and excluding the forest
products compartment from the accounting). Total ecosystem carbon sequestration will be
91.3 Mt C for hybrid poplar (scenario 1), 19.1 Mt C for trembling aspen (scenario 5), and
17.8 Mt C for white spruce wood fiber plantations (scenario 8).
Under these scenarios, hybrid poplar had the highest carbon sequestration potential,
followed by trembling aspen and white spruce. This result can be largely explained by the
high rate of accumulation in the aboveground carbon pool of hybrid poplar, which
compensates for low levels of sequestration in the belowground carbon pool.
Future 500 years projections also including forest products (stock change approach)
indicate a total carbon sequestration of -9 Mt C for hybrid poplar (scenario 2), and 0.4 Mt C
for both trembling aspen and white spruce single species wood fiber plantations (scenarios 6,
9). Although the only difference between scenarios 2, 6, and 9 and scenarios 1, 5, and 8 was
the inclusion of forest products, results diverged from those previously calculated. They
showed the largest carbon sequestration for trembling aspen, followed by white spruce and
hybrid poplar wood fiber plantations.
This diverging result can be explained by a sum of factors, such as the end use of each
species in products, the number of rotations in these simulations for each species, and the
storage capacity in the carbon pools considered. The lower C sequestration in scenarios
including the forest products pool can be partially attributed to the method used for
accounting (stock change method). This method results in higher emissions in the producing
country (Canada), and higher sequestration in the consuming country. The scenario 3 was
similar to scenario 2, with the exception of using the production approach for the products
pool (i.e., carbon sequestration and emissions are accounted for the producing country). This
resulted in a total carbon sequestration (after 500 years) of -2.3 Mt C. As expected, scenario 3
resulted in lower carbon sequestration than scenario 2. Nova S
cienc
e Pub
lishe
rs, In
c.
The Potential for Carbon Sequestration in Carbon Depleted Areas … 123
DISCUSSIONS AND CONCLUSIONS
Results from this study suggest that including forest products pool shows distinct results
from the non-inclusion of this important pool, and would result in a different species selection
for the future simulations on wood fiber plantations and within the considered time length.
Wood fiber plantations with higher carbon sequestration potential (scenario 1) had the
potential to offset 5.6 years of Saskatchewan carbon dioxide emissions, i.e., 1.2% of total
emissions in 495 years, assuming Saskatchewan emissions continue at same rate (Pembina
Institute for Appropriate Development, 2000).
Likewise, a similar scenario would result in 1.3 times higher total marketable volume at
the end of each rotation in the context of the Saskatchewan annual allowable cut (Canadian
Forest Service, 1999).
Through applying conversion and expansion factors that have been extensively used for
Canada (Lemprière and Booth, 1998; Robinson et al., 1999) to the growth curves considered
in this study, the aboveground carbon sequestration at harvesting age was found to be
overestimated for hybrid poplar by 43%, for trembling aspen by 29%, and for white spruce
36%; as compared to results from this study.
Finally, the quality of estimates is so good as the quality of the data sources available. A
higher amount of data and information is likely to allow improving the quality of these
estimates.
RESEARCH NEEDS
The most important research gaps resulting from this analysis are:
● Specific growth curves for each species, compiled for each soil and ecological zones.
Within them, compiled for each agroforestry design and growth conditions, such as
spacing, site quality, and stand management;
● Soil organic carbon measurements for the entire soil profile (due to the mixing at soil
preparation for planting trees) from planted stands in agricultural or former
agricultural soils, for each species, for each agroforestry design, and growth
conditions (such as spacing, site quality, and stand management); and, within those,
could be compiled by either soil zone or other ecological framework;
● Conversion and expansion factors for each species, agroforestry design, and growth
conditions (such as spacing, site quality, and stand management); and, within those,
could be compiled by either soil zone or other ecological framework;
● More field data collection, preferably from long-term plots (or else from
chronosequential studies) for each agroforestry design and growth conditions (such
as spacing, site quality, and stand management);
Furthermore, the standardization of sampling, measurement and laboratory techniques
and technologies would greatly enhance the chances of field data to be compared and
compiled.
Nova S
cienc
e Pub
lishe
rs, In
c.
Silvia Lac and Manuel Esteban Lucas-Borja 124
REFERENCES
Acton, D. F., Padbury, G. A. and Stushnoff, C. T. (1998). The Ecoregions of Saskatchewan.
Saskatchewan Environment and Resource Management. Regina, Saskatchewan:
Canadian Plains Research Centre/University of Regina.
Bonnor, G. M. Inventory of Forest Biomass in Canada (1985). Chalk River, Ontario:
Petawawa National Forestry Institute/Canadian Forest Service.
Brady, A. and Appleby, A. (2000). Deforestation: Lack of Regeneration in Saskatchewan
Forests. Technical Report 1.
Bruce, J. P., Frome, M., Haites, E., Janzen, H., Lal, R., and Paustian, K. (1999). Carbon
sequestration in soils. Journal of Soil and Water Conservation 54:382-389.
Canadian Climate Change Secretariat (1999). Sinks Table Option Paper, Land-Use, Land-Use
Change and Forestry in Canada and the Kyoto Protocol (National Climate Change
Process).
Canadian Forest Service (1999). The State of Canada‟s Forests 1998-1999. Ottawa, Ontario:
Canadian Forest Service.
Fisher, R. F. and Binkley, D. (1999). Ecology and Management of Forest Soils. Third
Edition. New York, New York: John Wiley and Sons Inc.
Golder Associates Ltd. Report on Construction of Yield Curves for Inventory Zones C20,
C30, C40, and C50 in Saskatchewan (2001). Unpublished contract report. Prince Albert,
Saskatchewan: Saskatchewan Environment/Forest Ecosystems Branch.
Guy, R. D. and Benowicz, A. (1998). Can Afforestation Contribute to a Reduction in
Canada‟s net CO2 Emissions? A Report prepared for the CPPA.
Hansen, E. A. (1993). Soil carbon sequestration beneath hybrid poplar plantations in the north
central United States. Biomass and Bioenergy 5:431-436.
Herrington, R., Johnson, B. and Hunter, B. (1997). Responding to Global Climate Change in
the Prairies. Volume III of the Canada Country Study: Climate Change Impacts and
Adaptation. Adaptation and Impacts section, Atmospheric and Hydrologic Sciences
Division, Environment Canada.
Horwath, W. R., Pregitzer, K. S. and Paul, E. A. (1994). 14C allocation in tree-soil systems.
Tree Physiology 14:1163-1176.
Intergovernmental Panel on Climate Change (2007). Climate Change: Impacts, Adaptation
and Vulnerability. Contribution of Working Group II to the Fourth Assessment Report of
the IPCC. Cambridge, United Kingdom: Cambridge University Press.
International Institute for Applied Systems Analysis Future climate change and carbon
budgets (2000). Available at <http://www.iiasa.ac.at/Research/FOR/papers/medea/10_
future_climate_change.htm> Last accessed 09 February 2013.
Janzen, H. H., Campbell, C. A., Gregorich, E. G., and Ellert, B. H. (1998). Soil carbon
dynamics in Canadian agroecosystems. Ch.5 in: Rattan, L., Kimble, J. M., Follett, R. F.,
and Stewart, B. A. Advances in Soil Science: Soil Processes and the Carbon Cycle. Boca
Raton, Florida: CRC Press.
Kostela, J., Nygren, P., Berninger, F., and Luukkanen, O. (2000). Implications of the Kyoto
Protocol for Tropical Forest Management and Land Use: Prospects and Pitfalls. Tropical
Forestry Reports 22. Hakapaini Oy, Helsinki: Department of Forest Ecology/ University
of Helsinki. Nova S
cienc
e Pub
lishe
rs, In
c.
The Potential for Carbon Sequestration in Carbon Depleted Areas … 125
Kurz, W. A., Apps, M. J., Webb, T. M., and McNamee, P. J. (1992). The Carbon Budget
Model of the Canadian Forest Sector: Phase I. Edmonton, Alberta: Northern Forestry
Centre/Forestry Canada. Inf. Rep. NOR-X-326.
Lac, S. (2002). Carbon Sequestration in the Boreal Forest Plain Ecozone Through the
Conversion from Agriculture to Agroforestry. Master of Science thesis. Saskatoon,
Saskatchewan: Division of Environmental Engineering/University of Saskatchewan.
Lemprière, T. and Booth, D. (1998). Preliminary Estimates of Carbon Stock Changes in
2008-2012 Resulting from Reforestation, Afforestation and Deforestation Activity in
Canada since 1990. Internal Draft 27 February 1998. Ottawa, Ontario: Canadian Forest
Service/Natural Resources Canada.
Mak, K., Lavoie, A. and Grundberg, B. (1999). Evaluating the Potential and Opportunities
for Agroforestry in the Province of Saskatchewan. Regina, Saskatchewan: Saskatchewan
Agriculture and Food.
Nagle, G. S. (1990). Technical Background Paper: Trees for Canada Program. Victoria,
British Columbia: Nawitka Renewable Resource Consultants Ltd.
Natural Resources Canada, (2012). Carbon Budget Model. Natural Resources Canada.
Available at <http://cfs.nrcan.gc.ca/pages/94> Last accessed 09 February 2013.
Pembina Institute for Appropriate Development (2000). Provincial Government Performance
on Climate Change: 2000. Available at <http://www.pembina.org/> Last accessed 09
February 2013.
Peterson, E. B., Bonnor, G. M., Robinson, G. C., and Peterson, N. M. (1999). Carbon
sequestration aspects of an afforestation program in Canada’s Prairie Provinces.
Submitted to Joint Forest Sector Table/Sinks Table (National Climate Change Process).
Peterson, E. B. and Peterson, N. M. (1992). Ecology, Management, and Use of Aspen and
Balsam Poplar in the Prairie Provinces, Canada. Special Report 1, Forestry Canada
Northwest Region, Northern Forestry Centre. Victoria, British Columbia: Western
Ecological Services Ltd.
Price, D. T., Mair, R. M., Kurz, W. A., and Apps, J. (1996). Effects of forest management,
harvesting and wood processing on ecosystem carbon dynamics: a boreal case study.
Chapter 23, 279-292 pp. (1996). In: Apps, M. J. and Price, D. T. (Eds.). Forest
Ecosystems, Forest Management and the Global Carbon Cycle. NATO ASI series, Series
1, No. 40. New York, New York.
Robinson, G. C., Peterson, E. B., Smith, S. M., and Nagle, G. S. (1999). Estimating the
Carbon Sequestration Associated with Reforestation in Western Canada. Report by
Nawitka Renewable Resource Consultants for the Joint Forest Sector and (Sinks Table
National Climate Change Process).
Shroeder, W. R. (1996). Determination of Poplar Wood Quality and Land Suitability. Project
No. 96000472, Final Report. Indian Head, Saskatchewan: PFRA Shelterbelt Centre.
Siltanen, R. M., Apps, M. J., Zoltai, S. C., Mair, R. M., and Strong, W. L. (1997). A Soil
Profile and Organic Carbon Data Base for Canadian Forest and Tundra Mineral Soils.
Natural Resources Canada. Edmonton, Alberta: Northern Forestry Centre/Canadian
Forest Service.
Singh, T. (1982). Biomass Equations for ten Major Tree Species of the Prairie Provinces. Inf.
Environment Canada, Rep. NOR-X-242. Edmonton, Alberta: Northern Forestry Centre/
Canadian Forest Service. Nova S
cienc
e Pub
lishe
rs, In
c.
Silvia Lac and Manuel Esteban Lucas-Borja 126
Singh, T. (1987). Wood density variations in thirteen Canadian tree species. Wood Fiber
Science 19:363-369.
Singh, T. and Wheaton, E. E. (1991). Boreal forest sensitivity to global warming:
implications for forest management in Western Interior Canada. The Forestry Chronicle
67:342-348.
Skog, K. E. and Nicholson, G. A. (1999). Carbon cycling through wood products: the role of
wood and paper products in carbon sequestration. Forest Products Journal 48: 75-83
(1998). Cited in: Canadian Climate Change Secretariat. National Climate Change
Process, National Sinks Table Foundation Paper, Final Report.
Statistics Canada (1996). 1996 Census of Agriculture CD-ROM release 2.1. Saskatoon,
Saskatchewan: Data Library Services/University of Saskatchewan.
Stewart, R. B., Wheaton, E. and Spittlehouse, D. (1997). Climate change: implications for the
boreal forest. Pp. 22-24. In: Air and Water Waste Management Association Symposium.
Implications of Climate Change: What Do We Know? Conference proceedings. Calgary,
Alberta.
Tillman, D. A., Rossi, A. J. and Kitto, W. D. (1981). Wood Combustion: Principles,
Processes and Economics. Orlando, Florida: Academic Press.
Tipper, R. and De Jong, B. (1998). Quantification and regulation of carbon offsets from
forestry: comparison of alternative methodologies with special reference to Chiapas,
Mexico. Commonwealth Forestry Review 77:219-228. Cited in: Kostela, J., Nygren, P.,
Berninger, F., and Luukkanen, O. (2000). Implications of the Kyoto Protocol for Tropical
Forest Management and Land Use: Prospects and Pitfalls. Tropical Forestry Reports 22.
Hakapaini Oy, Helsinki: Department of Forest Ecology/ University of Helsinki.
Wang, I. C. and Micko, M. M. (1984). Wood quality of white spruce from north central
Alberta. Canadian Journal of Forest Research 14:181-185.
Waring, R. H. and Running, S. W. (1998). Forest Ecosystems Analysis at Multiple Scales.
Second Edition. San Diego, California: Academic Press.
Watson, R. T., Noble, I. R., Bolin, B., Ravindranath, N. H., Verardo, D. J., and Dokken, D. J.
(2000). IPCC Special Report on Land Use, Land-Use Change and Forestry. A Special
Report of the Intergovernmental Panel on Climate Change. New York, New York:
Cambridge University Press.
Yanai, R. D., Arthur, M. A., Siccama, T. G., and Federer, C. A. (2000). Challenges of
measuring forest floor organic matter dynamics: repeated measures from a
chronosequence. Forest Ecology and Management 138:273-283.
Nova S
cienc
e Pub
lishe
rs, In
c.

In: Plantations ISBN: 978-1-60876-576-8
Editor: Ren Hai © 2013 Nova Science Publishers, Inc.
Chapter 8
ROLES OF ARBUSCULAR MYCORRHIZAL
ASSOCIATION IN PLANT NUTRITION AND GROWTH
OF TROPICAL FORESTRY AND AGROFORESTRY
IN DEGRADED SOIL RECLAMATION
Nelson W. Osorio* and Juan D. León
Universidad Nacional de Colombia, Colombia
ABSTRACT
Plant productivity is severely constrained by the inadequate soil nutrient supply,
particularly in highly weathered tropical soils. One of the most relevant strategies of
plants to grow in these soils is the formation of arbuscular mycorrhizal association with
soil fungi.
The plant supplies carbonaceous compounds to the fungus, while the fungus
provides nutrients, particularly diffusion-limited ones such as phosphate (Pi), Cu2+
, and
Zn2+
. Roots can absorb available Pi from distances not exceeding a few millimeters (mm)
away from their surface, while mycorrhizal hyphae can extend to several centimeters
(cm) from the root surface, exploring a greater volume of soil. Mycorrhizal hyphae have
a higher affinity for absorbing Pi than roots. However, plant species exhibit different
degrees of mycorrhizal dependency (MD) to produce maximum growth at a given level
of soil nutrient availability. The MD of several tropical plant species used in forestry and
agro-forestry has been determined in relation to plant root characteristics and
environmental conditions.
This chapter explores the importance of the mycorrhizal association to plant nutrition
and growth of seedlings in the establishment of forestry/agro-forestry ecosystems and
vegetation restoration in degraded lands.
Keywords: Mycorrhizae, mycorrhizal dependency, soil phosphate, tropical agro-forestry,
degraded lands
*
Corresponding Author. Calle 59 A No. 63-20, 050034, Medellín, Colombia, Email: [email protected] and
[email protected]. Nova S
cienc
e Pub
lishe
rs, In
c.
Nelson W. Osorio and Juan D. León 128
INTRODUCTION
Plant productivity is severely constrained in soils from the tropical humid area due to
strong soil acidity (pH <5.0), high levels of exchangeable and soluble aluminum (Al) and low
nutrient bioavailability (Brady and Weil, 2002). Al ions not only cause toxicity in plants but
also reduce soil microbial activity (Lindsay, 2001). Given the intense precipitation in some
tropical areas (>2000 mm yr-1
), nutrients such as nitrogen, potassium, calcium, and
magnesium have been leached out from the soils leaving them depleted (Uphoff et al., 2006).
On the other hand, plant nutrients such as phosphate (Pi), sulfate, and boron are converted
into plant-unavailable forms by soil constituents (Havlin et al., 1999). For this reason, soil
soluble Pi concentration is commonly low in most tropical soils (0.001-0.01 mg L-1
) (Fox,
1979; Barber, 1995). The behavior of Pi in tropical soils has received much attention because
its deficiency is quite common and this limits plant performance in agriculture and forestry
ecosystems (Turner et al., 2006).
Plants exhibit different strategies to grow in Pi deficient soils that include: (i)
development of an elongated root system with fine roots and abundance of root hairs; (ii)
exudation of phosphatase enzymes capable of releasing Pi from organic compounds, (iii)
release of organic acids that dissolve Pi compounds, and (iv) formation of a symbiotic
association with soil fungi called mycorrhiza (Sylvia, 1999; Smith, 2002; Smith et al., 2003).
Mycorrhiza association occurs in the roots of most plants, however, there are different kinds
of mycorrhizae (Harley and Smith, 1983) and two types are commonly formed in forests and
plantation: arbuscular-mycorrhiza (AM) and ectomycorrhiza (ECM) (Smith and Read 1997;
Sylvia, 1999). The former mycorrhiza is formed by fungi of Glomeromycota (Schübler et al.,
2001), while the latter is formed by fungi of Ascomycota and Basidiomycota. The structure,
physiology and ecology are variable between these two types of associations (Smith and
Read, 1997). The arbuscular mycorrhiza is globally widespread in different types of plants
(herbaceous, trees, crops, etc.), while the ECM is more restrictive to conifer trees and other
species of forestry plants. Although little is known about mycorrhizal symbiosis for a large
number of tree species, it has been widely accepted that this association is not only important
for plants and trees survival in nutrient-poor soil (Read, 1991), but also plays a key role in
nutrient cycling and retention of nutrients in the soil (Medina and Cuevas, 1993; Rilling et al.,
2001). The arbuscular micorrizal fungi (AMF) provide also protection against drought stress
and pathogens pressure on the roots (Dehne, 1982; Harley and Smith, 1983; Langley and
Hungate, 2003) in addition to impacting on the composition of plant communities (Allen et
al., 1995; Van der Heijden et al., 1998; Kottke, 2002).
In this chapter, our aim is to discuss the importance of AMF as a key element in the
growth and Pi nutrition status of plant species used in tropical forestry, agroforestry, and
vegetation restoration programs of degraded lands.
Abundance and Functional Aspects of Arbuscular Micorrizal Fungi
in Natural Forests and Plantations
The mycorrhizal association is important for the growth of tropical trees, its dynamics in
the establishment of plantations and forest restoration has been acknowledged (Janos 1980a, Nova S
cienc
e Pub
lishe
rs, In
c.
Roles of Arbuscular Mycorrhizal Association in Plant Nutrition … 129
1980b, 1988; Huante et al., 1993). Tropical forests rich in plant species of different families
are dominated by trees capable of forming AMF, whereas temperate and boreal forests,
eucalyptus forests and dipterocarp forests are dominated by a few genera or species of trees
on which the ectomycorrhizal association is established. However, ECM forming trees have
also been found in patches or large spaces between trees that form AM in the humid tropics
(Farsi and Fontana 1962; Hogberg and Nylund, 1981; Hogberg, 1982; Onguene and
Kuyper, 2001).
Perhaps one of the most important aspects of mycorrhizae in tropical ecosystems is
related to nutrient recycling. Particularly, mycorrhizal associations represent for tropical tree
species a key strategy to overcome the shortage of soil nutrients (Read, 1991), especially for
Pi. This is one of the most serious limitations to plant development and productivity in the
humid tropics. Studies on terrestrial ecosystems, have determined the abundance of spores
forming mycorrhizae in soils, given their importance in the nutrient supply to the host plant in
exchange for carbohydrates (Trappe, 1987).
The study of biogeochemical cycling of Pi in Andean forests of Colombia was conducted
by Barreto (2005) who determined the abundance of AMF spores (Brundrett et al., 1996) in
samples of the A-horizon of Andisols (Fulvudands and Hapludands, US Soil Taxonomy
System; Buol et al., 1997). The aim was to determine the differences between native mature
forests of oak (Quercus humboldtii) and mature plantation of cypress (Cupressus lusitanica)
(> 50 years-old). Eight different AMF spore morphotypes were detected, but two were most
common; higher abundance was recorded in cypress plantations (131 spores per 100 g) than
in oak forests (79 spores per 100 g). This difference may be associated with a higher amount
of fine roots found in the first 30-cm soil depth of cypress plantations (14.8 Mg ha-1
) than in
oak forest (4.2 Mg ha-1
) (Barreto and León, 2005). Also, this may reflect the differences in
nutrient supply in each ecosystem from litter decay; in cypress plantation the annual
decomposition rate was k= 0.37, while in oak forests was k= 1.02 (León, 2007). In cypress
plantations in the same region, Alvarado (1988) found in all collected soil samples spores of
the AMF such as Glomus sp. and Entrophospora sp.; likely, the abundance of AMF spores
was associated with the increase in the density of fine roots and decrease in soil acidity
(Picone, 2002).
Some authors have suggested that Pi resorption just before leaf abscission may have an
adaptive significance for plants in soil Pi-deficient soil (Vitousek and Sanford, 1986). In the
case of cypress, León et al. (2009) determined lower Pi re-uptake (37%) than in the oak
(43%). Furthermore, in accordance with Medina et al. (1990), the values of the ratio Pi: N in
mature leaves (0.03) indicated a low availability of soil Pi to oak, while the cypress would be
slightly above the threshold value (0.05). Hence, the difference in AMF spores may be
associated with Pi recycling and availability in these ecosystems.
Reports on abundance of AMF spores from different tropical forests are numerous. For
instance, in forests of Nicaragua and Costa Rica, Picone (2002) found 110-770 AMF spores
per 100 g of dry soil, while in tropical rainforests of Cameroon, Musoko et al. (1994) found
approximately 250 AMF spores per 100 g. Wilson et al. (1992) found in Ivorian forests 100-
300 AMF spores per 100 g of dry soil. Louis and Lim (1987) reported between 100 and 500
spores per 100 g in Singapore forests. Allen et al. (1998) reported 100-280 and 30-90 AMF
spores per 100 g of soil in red and yellow tropical deciduous forest of Mexico, respectively.
On the other hand, plantations have also been used to remediate degraded soils; one of
the plant species most used for this purpose has been Acacia mangium, a fast growing tree, Nova S
cienc
e Pub
lishe
rs, In
c.
Nelson W. Osorio and Juan D. León 130
native from Australia, widely planted in Asia and Africa (Lee and Nguyen, 1991; Ren and
Yu, 2008). An advantage of A. mangium is its tolerance to degraded soils conditions and
capability to establish association with soil microorganisms such as nitrogen-fixing bacteria
(Bradyrhizobium group) (Galiana et al., 1994), AMF (Ba et al., 1996), and ECM (Anino
1992; Duponnois and Ba, 1999).
Local experience with plantations of A. mangium (11 years old) established on degraded
land by alluvial mining in Colombia (León et al., 2008) allow us to determine the presence of
AMF spores in its rhizosphere (19000 AMF spores per 100 g of soil) and AM mycelia inside
the roots. This value is comparable to that reported by Johnson and Wedin (1997) for humid
forests of Costa Rica (12000 spores/100 g). Biogeochemical cycling studies in these
plantations (Castellanos-Barliza and León, 2010; León et al., 2010) indicated an extreme
shortage of soil Pi supply characterized by low soil Bray II-Pi (<3 mg kg-1
), foliar Pi content
(0.04%), high leaf litter N:Pi ratio (124) and low return of Pi in the litter fall (0.5 kg ha-1
yr-1
)
(Swift et al., 1979; Aerts, 1997). The results indicated abundance of AMF spore, despite
records of high degree of human disturbance of that soil (Stahl et al., 1988; Jaramillo et al.,
2004). The development of mycorrhizae observed was a clear indication that the plant-
mycorrhizal fungus association was formed in plantations of A. mangium as well as other
associated plants such as Vismia sp., Piper sp. and Ceiba pentandra and several grass species.
Despite the abundance, there was low diversity with a clear dominance of a morphotype
that later was tentatively identified as G. microaggregatum (Medina et al., 1999). Likely, its
dominance is due to its adaptability to unfavorable soil conditions (Taylor, 2000), such as
poor soil structure, extreme acidity, and Hg presence. It needs to be determined whether the
presence of AMF spores is the result of its ability to persist despite the mining activities or
due to invasion of mycorrhizal propagules (e.g., spores and hyphae) from surrounding land by
runnoff. Indeed, field observations at these sites suggest that both processes may occur (León
et al., 2008). In any case, the presence of these spores and the mycorrhizal colonization
clearly indicate the ability of these fungi to infect A. mangium roots and presumably promote
plant growth (as shown later in this chapter based on the results of Daza and Osorio, 2011).
Presumably, the benefits to plant growth and performance of A. mangium in these soils are
also the result of N2-fixing bacteria found associated with the roots, which offers a
competitive advantage to the plant in those environments (Andrade et al., 2000), and
facilitating nutrient recycling process towards the support of ecosystem productivity (fine
litter fall 3.10 t ha-1
yr-1
) (Castellanos-Barliza and León, 2011).
Soil Phosphate Deficiency as a Constraint for Plant Growth
Soil Pi is constituted by organic and inorganic compounds of variable nature and
complexity (Havlin et al., 1999). Soil inorganic Pi can be in different pools that are at
chemical equilibria: (i) primary minerals mainly apatites [Ca5(PO4)(OH,F)]; (ii) secondary
minerals forming precipitates of iron-, aluminum-, and calcium-phosphates; (iii) strongly or
weakly adsorbed Pi on the surface of soil minerals, which depends on the type mineral; (iv)
soluble in the soil solution as H2PO4- in acid soils or HPO4
2- in alkaline soils. When plant
roots and soil microbes absorb Pi from the soil solution, this breaks the equilibria among
these Pi-pools and triggers a series of dissolving or desorbing reactions from the solid-phase
that slowly replenishes the concentration of soluble Pi in the soil solution (Lindsay, 2001). On Nova S
cienc
e Pub
lishe
rs, In
c.
Roles of Arbuscular Mycorrhizal Association in Plant Nutrition … 131
the other hand, soil organic Pi is forming compounds of variable nature (some of them
unknown) that are decomposed by plant and microbial enzymes (generically called
phosphatases) that breaks ester-links and slowly release Pi ions into the soil solution
(Stevenson, 1986).
The low bioavailability of Pi in tropical soils is caused by the chemical stability of soil Pi
compounds and the strength which Pi is retained on minerals surfaces. As a consequence,
most of Pi in these soils is unavailable and only a little portion called labile-Pi (≤ 1.0% of the
total-Pi) can be easily absorbed by plant roots (Table 1).
This is particularly evident in highly weathered soils of the tropics (Oxisols and Ultisols)
and in volcanic-ash soils (Andisols) (Sanchez and Uehara, 1980; Parfitt, 1989; Shoji et al.,
1993). Sanchez and Logan (1992) estimated that 1018 billion hectareas (ha) in the tropical
zone have high Pi retention capacity; 659 million are in the Neotropics. In agroecosystems,
the only significant source of Pi to plants roots is from the addition of Pi inputs (fertilizers or
organic amendments).
The long-term production without the application of Pi progressively will reduce the soil
Pi availability and exhaust the natural reserves in the soil (Smeck, 1985; Clark and Paul,
1989; Barber, 1995; Havlin et al., 1999). Soil Pi losses are represented by the removal in
cropping products and erosion, leaching is negligible in most soils (Smeck, 1985).
The immediate source of Pi for plant roots is the soil solution, which usually contains a
low soluble Pi concentration (Pi: 0.001-0.01 mg L-1
) (Fox, 1979; Barber, 1995). When Pi is
removed from the soil solution by roots, soil microbes and/or by Pi fixation reactions, a
gradient of Pi concentration is created between the solid phase and the soil solution around
the roots. Adsorbed Pi on the soil solid surfaces must desorb in order to replenish Pi in the
soil solution (Do Carmo Harta and Torrent, 2007).
Hence, Pi diffuses from the solid phase, where it is more concentrated, to the soil solution
around the root surface where its concentration is continuously being depleted. However, the
rate of Pi diffusion is quite slow (10-12
-10-15
m2 s
-1) (Schachtman et al., 1998) which limits the
Pi supply and creates a depletion zone of Pi around the roots of approximately 1-2 mm
(Barber, 1995). Pi ions beyond the zone of depletion cannot be accessed by the root surface
(Barber, 1995).
Phosphate ions that slowly diffuse into the soil solution originate mainly from Pi weakly
adsorbed on soil colloids and from those freshly precipitated (Sanchez, 1976; Stevenson,
1986; Lindsay, 2001).
Soil Pi supply depends on the Pi buffering capacity of soils (Pypers et al., 2006), which
can be estimated from the relationship between the concentration of Pi in soil solution and the
quantity of labile Pi in the solid phase (Barber, 1995; Holford, 1997).
Soil Pi sorption capacity and soluble Pi fertilizer requirement can be estimated through
the use of isotherm of sorption (Hue and Fox, 2010). Briefly, this consisted of the use of a
little aliquot of soil (2-3 g) that received grading amounts of Pi (0-2000 mg kg-1
) in plastic
centrifuge tubes. The most common source of Pi for this procedure is KH2PO4 dissolved in
0.01 M CaCl2.
Then, the tubes are frequently shaken during six days at room temperature (25ºC). After
that, the solution is separated by centrifugation 5000 rpm (2500xg) for 15 min and the soluble
Pi concentration measured by the molybdate-phosphate method (Murphy and Riley, 1962).
The data results are presented as a figure and regression model fitted the relationship between
adsorbed and soluble Pi (Figure 1). Nova S
cienc
e Pub
lishe
rs, In
c.
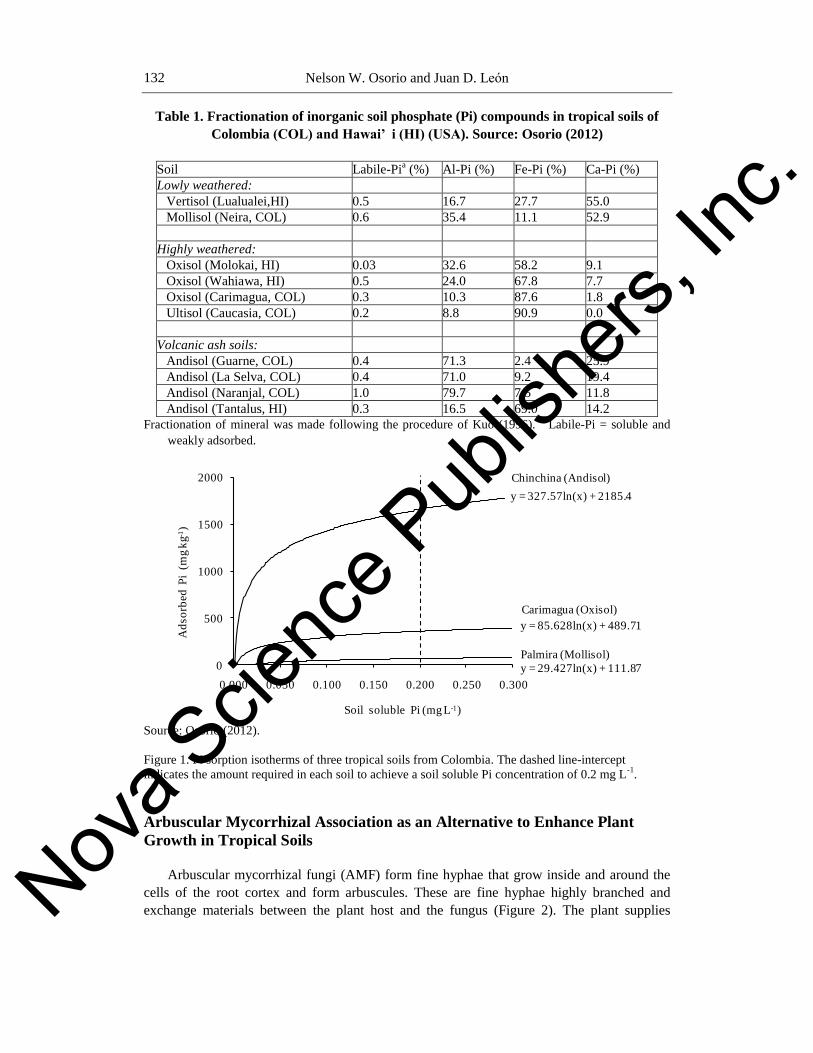
Nelson W. Osorio and Juan D. León 132
Table 1. Fractionation of inorganic soil phosphate (Pi) compounds in tropical soils of
Colombia (COL) and Hawai’ i (HI) (USA). Source: Osorio (2012)
Soil Labile-Pia (%) Al-Pi (%) Fe-Pi (%) Ca-Pi (%)
Lowly weathered:
Vertisol (Lualualei,HI) 0.5 16.7 27.7 55.0
Mollisol (Neira, COL) 0.6 35.4 11.1 52.9
Highly weathered:
Oxisol (Molokai, HI) 0.03 32.6 58.2 9.1
Oxisol (Wahiawa, HI) 0.5 24.0 67.8 7.7
Oxisol (Carimagua, COL) 0.3 10.3 87.6 1.8
Ultisol (Caucasia, COL) 0.2 8.8 90.9 0.0
Volcanic ash soils:
Andisol (Guarne, COL) 0.4 71.3 2.4 25.9
Andisol (La Selva, COL) 0.4 71.0 9.2 19.4
Andisol (Naranjal, COL) 1.0 79.7 7.5 11.8
Andisol (Tantalus, HI) 0.3 16.5 69.0 14.2
Fractionation of mineral was made following the procedure of Kuo (1996). a Labile-Pi = soluble and
weakly adsorbed.
Source: Osorio (2012).
Figure 1. Pi sorption isotherms of three tropical soils from Colombia. The dashed line-intercept
indicates the amount required in each soil to achieve a soil soluble Pi concentration of 0.2 mg L-1
.
Arbuscular Mycorrhizal Association as an Alternative to Enhance Plant
Growth in Tropical Soils
Arbuscular mycorrhizal fungi (AMF) form fine hyphae that grow inside and around the
cells of the root cortex and form arbuscules. These are fine hyphae highly branched and
exchange materials between the plant host and the fungus (Figure 2). The plant supplies
y = 29.427ln(x) + 111.87
y = 85.628ln(x) + 489.71
y = 327.57ln(x) + 2185.4
0
500
1000
1500
2000
0.000 0.050 0.100 0.150 0.200 0.250 0.300
Ad
so
rbed
Pi (
mg k
g-1)
Soil soluble Pi (mg L-1)
Palmira (Mollisol)
Carimagua (Oxisol)
Chinchina (Andisol)
Nova S
cienc
e Pub
lishe
rs, In
c.
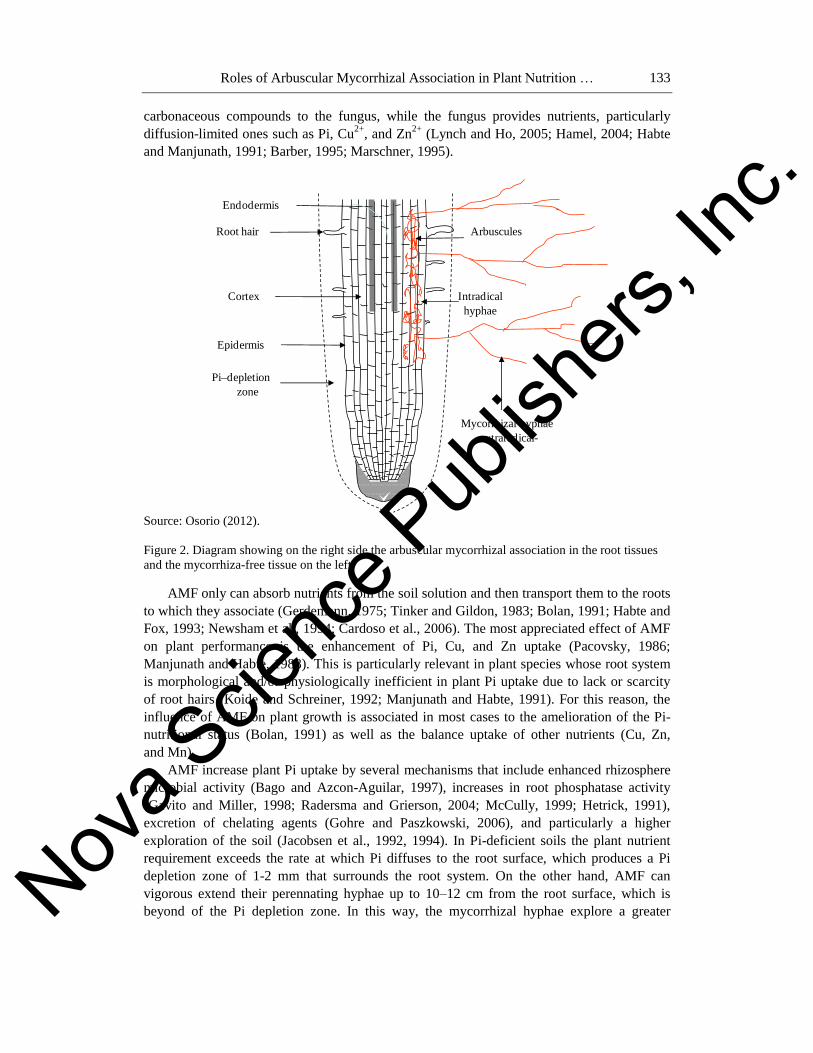
Roles of Arbuscular Mycorrhizal Association in Plant Nutrition … 133
carbonaceous compounds to the fungus, while the fungus provides nutrients, particularly
diffusion-limited ones such as Pi, Cu2+
, and Zn2+
(Lynch and Ho, 2005; Hamel, 2004; Habte
and Manjunath, 1991; Barber, 1995; Marschner, 1995).
Source: Osorio (2012).
Figure 2. Diagram showing on the right side the arbuscular mycorrhizal association in the root tissues
and the mycorrhiza-free tissue on the left.
AMF only can absorb nutrients from the soil solution and then transport them to the roots
to which they associate (Gerdemann, 1975; Tinker and Gildon, 1983; Bolan, 1991; Habte and
Fox, 1993; Newsham et al., 1994; Cardoso et al., 2006). The most appreciated effect of AMF
on plant performance is the enhancement of Pi, Cu, and Zn uptake (Pacovsky, 1986;
Manjunath and Habte, 1988). This is particularly relevant in plant species whose root system
is morphological and/or physiologically inefficient in plant Pi uptake due to lack or scarcity
of root hairs (Koide and Schreiner, 1992; Manjunath and Habte, 1991). For this reason, the
influence of AMF on plant growth is associated in most cases to the amelioration of the Pi-
nutritional status (Bolan, 1991) as well as the balance uptake of other nutrients (Cu, Zn,
and Mn).
AMF increase plant Pi uptake by several mechanisms that include enhanced rhizosphere
microbial activity (Bago and Azcon-Aguilar, 1997), increases in root phosphatase activity
(Gavito and Miller, 1998; Radersma and Grierson, 2004; McCully, 1999; Hetrick, 1991),
excretion of chelating agents (Gohre and Paszkowski, 2006), and particularly a higher
exploration of the soil (Jacobsen et al., 1992, 1994). In Pi-deficient soils the plant nutrient
requirement exceeds the rate at which Pi diffuses to the root surface, which produces a Pi
depletion zone of 1-2 mm that surrounds the root system. On the other hand, AMF can
vigorous extend their perennating hyphae up to 10–12 cm from the root surface, which is
beyond of the Pi depletion zone. In this way, the mycorrhizal hyphae explore a greater
Epidermis
Cortex
Endodermis
Root hair
Mycorrhizal hyphae
-extraradical-
Pi–depletion
zone
Arbuscules
Intradical
hyphae
Nova S
cienc
e Pub
lishe
rs, In
c.

Nelson W. Osorio and Juan D. León 134
volume of soil for P uptake than the root alone (Hattingh et al., 1973; Mosse, 1981; Hayman,
1983; Jacobsen et al., 1994; Jeffries et al., 2003). Some authors have estimated that the AMF
hyphae can explore 100-1000 more soil volume than the mycorrhizal-free roots (Sieverding,
1991). Also, the fact that the hyphae have a small diameter than roots can penetrate through
soil micropores that are not available for root systems (Bolan, 1991).
In addition, mycorrhizal hyphae have a higher affinity for absorbing Pi than roots
(Howeler et al., 1981). Schachtman et al. (1998) reported that the hyphae of Gigaspora
margarita had an affinity constant for Pi (Km) of 2.5 M (Pi: 0.077 mg L-1
), while many
plants usually exhibited a Km of 6-44 M (Pi: 0.19-1.36 mg L-1
), particularly those highly
dependent on mycorrhizal association (Nye and Tinker, 1977; Barber, 1995). In addition,
Barber (1995) affirmed that due to the small radius of the mycorrhizal hypha (1-3 m) there
is no Pi depletion zone around the hypha.
This allows the mycorrhizal hypha to take up Pi more effectively due to a higher and
more constant Pi concentration. However, Li et al. (1991) found a very narrow Pi depletion
zone around the mycorrhizal hypha. In contrast, roots with a greater radius (150 m) generate
a zone of depletion of at least 1 mm, resulting in low Pi concentration around the root surface.
Smith and Read (1997) reported P influx in mycorrhizal roots of 3 to 5-fold higher than non-
mycorrhizal roots (10-11 mol m-1
s-1
).
For the reasons mentioned above, the mycorrhizal association can reduce the requirement
of soluble Pi concentration of plants. In this way the rate of Pi fertilizers can be significantly
reduced (up to 40 times) as reported by Habte and Osorio (2001) for Leucaena leucocephala.
This represents not only an economical advantage but also an environmental benefit because
soil with high levels of soluble Pi can pollute surface waterways when soil particles are
eroded and deposited in them causing eutrophication (Culley et al., 1983;
Sharpley et al., 1992).
When plants rely on the mycorrhizal association and low Pi fertilization rather than heavy
Pi fertilization, the risks of water pollution are reduced (Miyasaka and Habte, 2001).
Therefore, AMF can be included in soil nutrient management programs oriented to reduce
environmental pollution (Habte and Osorio, 2001).
AMF have also been studied for their contribution to plant health because they can reduce
the negative impact of plant pathogens such as Phytophtora spp., Pythium spp., Fusarium
spp. and nematodes, among others (Linderman, 1988; Cooper and Grandison, 1986; Hooker
et al., 1994; Newsham et al., 1994; Trotta et al., 1996).
Similarly, AMF can improve the stability of soil aggregates, which is highly relevant for
the bioremediation of degraded soils (eroded, compacted, and mined) (Bethlenfalvay, 1992;
Wright and Upadhyaya, 1996, 1998; Rilling et al., 2001). It has been demonstrated that AMF
can also improve plant tolerance to water stress, salinity, soil acidity, and heavy metal toxicity
(Bethlenfalvay et al., 1988).
Mycorrhizal Dependency of Tropical Plants Used in Forestry
and Agroforestry
Despite multiple benefits that plants can derive from the mycorrhizal association, not all
plants depend on AMF. In fact, plant species exhibit different degrees of mycorrhizal Nova S
cienc
e Pub
lishe
rs, In
c.
Roles of Arbuscular Mycorrhizal Association in Plant Nutrition … 135
dependency (MD) (Plenchette et al., 1983). Mycorrhizal dependency is a measure of the
degree to which a plant species relies on mycorrhizal association for nutrient uptake and
growth (Habte and Osorio, 2001).
The earliest definition of this concept was made by Gerdemann (1975) who stated that
the dependency of plant species on mycorrhizal condition is a function of soil fertility. This
definition has since been modified to make it more operational by replacing the imprecise
term “soil fertility” with “soil solution Pi concentration” (Habte and Manjunath, 1991). It is
well established that plant species vary in their response to AMF inoculation (Plenchette et
al., 1983; Pope et al., 1983; Hetrick et al., 1988; Khalil et al., 1999).
Most of the variation has
been related to different ability of plant species to take up Pi at very low soil-Pi
concentrations in the absence of the mycorrhizal association (Baon et al., 1993). Habte and
Manjunath (1991) found that the MD of several plant species was determined by root
characteristics of the host species (root length, root density, root surface area, incidence and
length of hair roots), which determine their capacity to explore and absorb Pi from the soil
solution. Other authors found that the seed size and seed Pi reserve also control the value of
MD (Jaramillo and Osorio, 2005).
According to Plenchette et al. (1983) the MD should be calculated as the percentage of
the difference between the dry matter of inoculated and uninoculated plants over the dry
matter of inoculated plants:
MD = [(Inoculated plant dry matter - Uninoculated plant dry matter) † Inoculated plant dry matter]
x 100
On the other hand, when soil soluble Pi concentration is < 0.02 mg L-1
, most plant species
will respond significantly to mycorrhizal colonization (Figure 3). As soil soluble Pi increased
from 0.02 to 0.1–0.2 mg L-1
, the dependency of plants on AMF for Pi uptake diminishes
progressively (Figure 4). Thus, at 0.2 mg L-1
only very highly mycorrhizal-dependent species
respond significantly to mycorrhizal colonization. Since MD is significantly affected by soil
solution Pi level, Habte and Manjunath (1991) proposed that MD should be estimated at
different levels of available Pi, particularly at the soil solution Pi of 0.02 mg L-1
. Based on the
value of MD five categories have been proposed to classify plant species (Table 2). In Table 3
some plant species used in tropical forestry and agroforestry are presented according to their
MD category. Some examples of contrasting MD are presented in Figure 3 with Nageia
rospigliosii (romeron-pine) and Calophyllum brasiliense (barcino) inoculated or not with G.
aggregatum at three levels of soil soluble Pi.
Table 2. Categories of mycorrhizal dependence of plant species measured at a soluble Pi
level of 0.02 mg L-1. Source: Habte and Manjunath (1991)
Category MD (%) Further considerations
Independent 0 Plant species do not form the mycorrhizal association
Marginal 0-25 -
Moderate 25-50 -
High 50-75 Plant dry matter does not increase by AMF inoculation at 0.2 mg L-1
Very high >75 Plants dry matter increases by AMF inoculation at 0.2 mg L-1
Nova S
cienc
e Pub
lishe
rs, In
c.
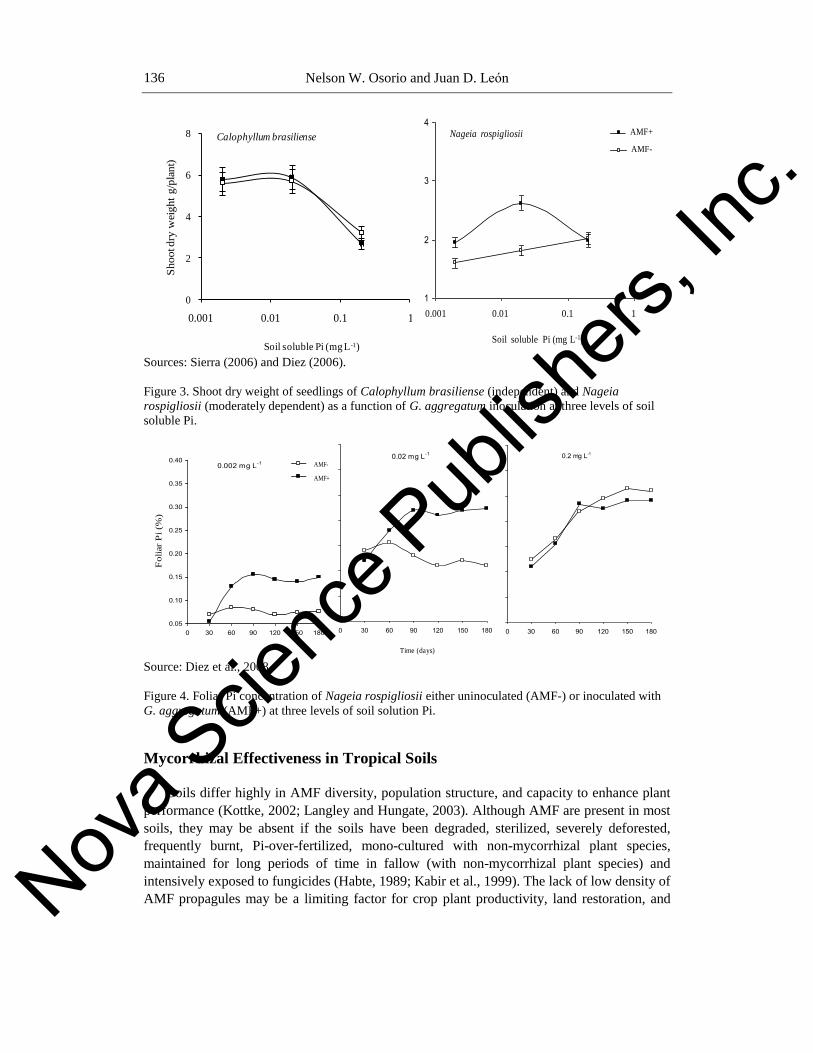
Nelson W. Osorio and Juan D. León 136
Sources: Sierra (2006) and Diez (2006).
Figure 3. Shoot dry weight of seedlings of Calophyllum brasiliense (independent) and Nageia
rospigliosii (moderately dependent) as a function of G. aggregatum inoculation at three levels of soil
soluble Pi.
Source: Diez et al., 2008.
Figure 4. Foliar Pi concentration of Nageia rospigliosii either uninoculated (AMF-) or inoculated with
G. aggregatum (AMF+) at three levels of soil solution Pi.
Mycorrhizal Effectiveness in Tropical Soils
Soils differ highly in AMF diversity, population structure, and capacity to enhance plant
performance (Kottke, 2002; Langley and Hungate, 2003). Although AMF are present in most
soils, they may be absent if the soils have been degraded, sterilized, severely deforested,
frequently burnt, Pi-over-fertilized, mono-cultured with non-mycorrhizal plant species,
maintained for long periods of time in fallow (with non-mycorrhizal plant species) and
intensively exposed to fungicides (Habte, 1989; Kabir et al., 1999). The lack of low density of
AMF propagules may be a limiting factor for crop plant productivity, land restoration, and
0
2
4
6
8
0.001 0.01 0.1 1
Sh
oot d
ry w
eig
ht
g/p
lan
t)
Soil soluble Pi (mg L-1)
Calophyllum brasiliense Low RI
1
2
3
4
0,001 0,01 0,1 1
Soil solution P (mg L-1)
Dry
mas
s (g
pla
nt-1)
M+
M-
Soil soluble Pi (mg L-1)
Shoot
dry
weig
ht
(g/p
lant)
AMF+
AMF-
0.001 0.01 0.1 1
Nageia rospigliosii
0.002 mg L-1
0.05
0.10
0.15
0.20
0.25
0.30
0.35
0.40
0 30 60 90 120 150 180
P fo
liar (
%)
M-
M+
Fo
liar
Pi (%
)
AMF-
AMF+
0.02 mg L-1
0 30 60 90 120 150 180
Tiempo (dias)Time (days)
0.2 mg L-1
0 30 60 90 120 150 180
Nova S
cienc
e Pub
lishe
rs, In
c.
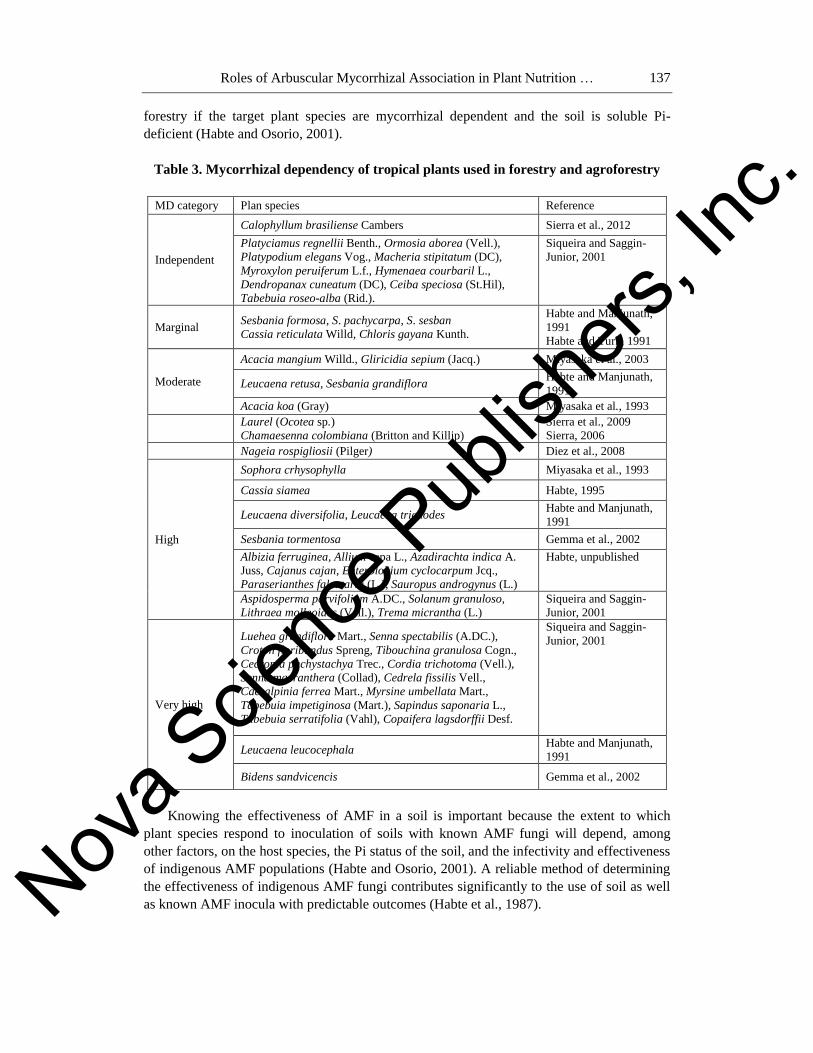
Roles of Arbuscular Mycorrhizal Association in Plant Nutrition … 137
forestry if the target plant species are mycorrhizal dependent and the soil is soluble Pi-
deficient (Habte and Osorio, 2001).
Table 3. Mycorrhizal dependency of tropical plants used in forestry and agroforestry
MD category Plan species Reference
Independent
Calophyllum brasiliense Cambers Sierra et al., 2012
Platyciamus regnellii Benth., Ormosia aborea (Vell.),
Platypodium elegans Vog., Macheria stipitatum (DC),
Myroxylon peruiferum L.f., Hymenaea courbaril L.,
Dendropanax cuneatum (DC), Ceiba speciosa (St.Hil),
Tabebuia roseo-alba (Rid.).
Siqueira and Saggin-
Junior, 2001
Marginal Sesbania formosa, S. pachycarpa, S. sesban
Cassia reticulata Willd, Chloris gayana Kunth.
Habte and Manjunath,
1991
Habte and Turk, 1991
Moderate
Acacia mangium Willd., Gliricidia sepium (Jacq.) Miyasaka et al., 2003
Leucaena retusa, Sesbania grandiflora Habte and Manjunath,
1991
Acacia koa (Gray) Miyasaka et al., 1993
Laurel (Ocotea sp.)
Chamaesenna colombiana (Britton and Killip)
Sierra et al., 2009
Sierra, 2006
Nageia rospigliosii (Pilger) Diez et al., 2008
High
Sophora crhysophylla Miyasaka et al., 1993
Cassia siamea Habte, 1995
Leucaena diversifolia, Leucaena trichodes Habte and Manjunath,
1991
Sesbania tormentosa Gemma et al., 2002
Albizia ferruginea, Allium cepa L., Azadirachta indica A.
Juss, Cajanus cajan, Enterolobium cyclocarpum Jcq.,
Paraserianthes falcataria (L.), Sauropus androgynus (L.)
Habte, unpublished
Aspidosperma parvifolium A.DC., Solanum granuloso,
Lithraea molleoides (Vell.), Trema micrantha (L.)
Siqueira and Saggin-
Junior, 2001
Very high
Luehea grandiflora Mart., Senna spectabilis (A.DC.),
Croton floribundus Spreng, Tibouchina granulosa Cogn.,
Cecropia pachystachya Trec., Cordia trichotoma (Vell.),
Senna macranthera (Collad), Cedrela fissilis Vell.,
Caesalpinia ferrea Mart., Myrsine umbellata Mart.,
Tabebuia impetiginosa (Mart.), Sapindus saponaria L.,
Tabebuia serratifolia (Vahl), Copaifera lagsdorffii Desf.
Siqueira and Saggin-
Junior, 2001
Leucaena leucocephala Habte and Manjunath,
1991
Bidens sandvicencis Gemma et al., 2002
Knowing the effectiveness of AMF in a soil is important because the extent to which
plant species respond to inoculation of soils with known AMF fungi will depend, among
other factors, on the host species, the Pi status of the soil, and the infectivity and effectiveness
of indigenous AMF populations (Habte and Osorio, 2001). A reliable method of determining
the effectiveness of indigenous AMF fungi contributes significantly to the use of soil as well
as known AMF inocula with predictable outcomes (Habte et al., 1987). Nova S
cienc
e Pub
lishe
rs, In
c.
Nelson W. Osorio and Juan D. León 138
Commonly the presence of mycorrhizal propagules in soils is quantified by the number of
AMF-spores, which is unfortunately not completely reliable (Osorio and Habte, 2001). AMF
spores can be unviable or exhibit a period of latency (Abbot and Robson, 1984; Allen et al.,
1995). For this reason, the presence of AMF spores is not a good indicator of AMF
effectiveness (Brundrett et al., 1996). The mycorrhizal effectiveness is directly related with
the amount of infective mycorrhizal propagules, not only viable spores but also extraradical
hypahe, and infected root fragments present in the soil (Brundrett et al., 1996).
The method used to measure mycorrhizal effectivenes of indigenous soil AMF consists of
the inoculation with aliquots of the soil (25 g) into a substrate conducive for optimal
mycorrhizal activity (soluble Pi level= 0.02 mg L-1
, pH 6.0), which is then planted with
seedlings of a plant species that exhibit high mycorrhizal dependency (e.g., Leucaena
leucocephala). Since plant growth and Pi uptake consistently increase as a result of AMF
infection, one of the best ways to determine the symbiotic effectiveness of soil AMF is to
monitor the Pi status of host plants as the symbiosis develops (Habte and Osorio, 2001). To
this aim the pinnule technique developed by Habte et al. (1987) is a rapid, nondestructive, and
precise technique for monitoring the development of symbiotic effectiveness in the arbuscular
mycorrhizal association.
In the next paragraphs we described two experiments carried out to determine
mycorrhizal effectiveness of indigenous AMF in (i) soils degraded by alluvial mining and
intensive cropping, and (ii) soils subjected to different uses such as forestry, fallow, crops and
grassland.
Mycorrhizal Effectiveness of Degraded Soils
This investigation was conducted under greenhouse conditions at the Universidad
Nacional de Colombia (6þ 15´ N, 75þ 35´ W and 1495 m altitude). The substrate was a B-
horizon from clay-loam Ultisol which was air-dried, sieved at 4 mm, autoclaved (120ºC, 0.1
MPa, 2h), and then limed with CaCO3 to reach a soil pH of 6.0. Later the soil fertilized with
KH2PO4 (350 mg of P kg-1
) to obtain soil soluble Pi concentration of 0.02 mg L-1
, which is
optimal for mycorrhizal activity. To this purpose a Pi sorption isotherm was previously
conducted as explained before (Fox and Kamprath, 1970).
Then, 600g of the substrate were transferred into plastic pots and later inoculated
separately with either 15 g of a degraded soil by alluvial mining, 15 g of a degraded soil from
an oil-palm plantation (Elaeis guineensis, 30 year-old), or 15 g of an effective mycorrhizal
inoculum composed by 17 infective propagules of Glomus aggregatum per g (Table 4). An
uninoculated control was included for comparison purposes. After that, the substrate was
planted with germinated seeds of Leucaena leucocephala, previously scarified with H2SO4 for
20 min. Plants were grown for 49 days and frequently watered to maintain 60% of the
maximal water holding capacity. A Pi-free Hoagland solution was added weekly.
Foliar Pi content was monitored as a function of time from the fourth pinnule counting
from the base in youngest pinna fully expanded as explained by Habte et al. (1987), Aziz and
Habte (1987), and Habte and Fox (1993) (Figure 5). Mycorrhizal colonization of plant roots
were measured by the grid-line method (Giovannetti and Mosse, 1980) after clearing with
KOH (Phillips and Hayman, 1970) and staining with fucsin acid (Kormanik et al., 1980). The Nova S
cienc
e Pub
lishe
rs, In
c.
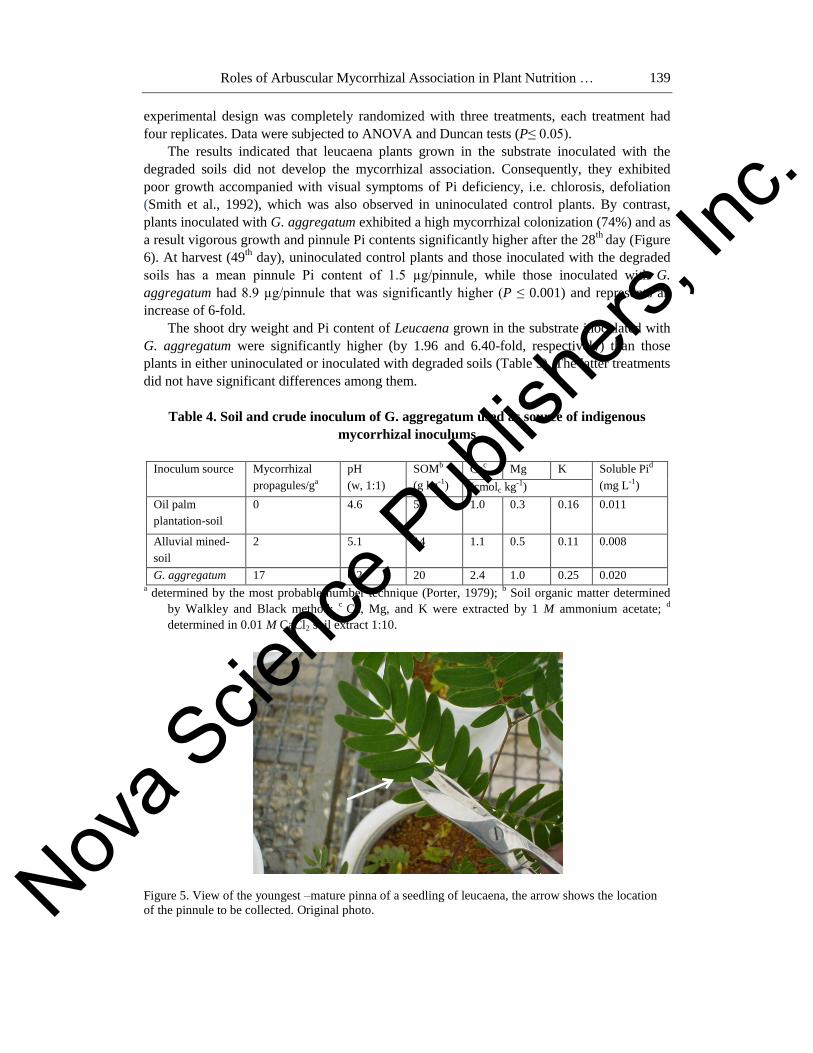
Roles of Arbuscular Mycorrhizal Association in Plant Nutrition … 139
experimental design was completely randomized with three treatments, each treatment had
four replicates. Data were subjected to ANOVA and Duncan tests (P≤ 0.05).
The results indicated that leucaena plants grown in the substrate inoculated with the
degraded soils did not develop the mycorrhizal association. Consequently, they exhibited
poor growth accompanied with visual symptoms of Pi deficiency, i.e. chlorosis, defoliation
(Smith et al., 1992), which was also observed in uninoculated control plants. By contrast,
plants inoculated with G. aggregatum exhibited a high mycorrhizal colonization (74%) and as
a result vigorous growth and pinnule Pi contents significantly higher after the 28th
day (Figure
6). At harvest (49th day), uninoculated control plants and those inoculated with the degraded
soils has a mean pinnule Pi content of 1.5 µg/pinnule, while those inoculated with G.
aggregatum had 8.9 µg/pinnule that was significantly higher (P ≤ 0.001) and represents an
increase of 6-fold.
The shoot dry weight and Pi content of Leucaena grown in the substrate inoculated with
G. aggregatum were significantly higher (by 1.96 and 6.40-fold, respectively) than those
plants in either uninoculated or inoculated with degraded soils (Table 5). The latter treatments
did not have significant differences among them.
Table 4. Soil and crude inoculum of G. aggregatum used as source of indigenous
mycorrhizal inoculums
Inoculum source Mycorrhizal
propagules/ga
pH
(w, 1:1)
SOMb
(g kg-1)
Cac Mg K Soluble Pid
(mg L-1) (cmolc kg-1)
Oil palm
plantation-soil
0 4.6 50 1.0 0.3 0.16 0.011
Alluvial mined-
soil
2 5.1 14 1.1 0.5 0.11 0.008
G. aggregatum 17 6.2 20 2.4 1.0 0.25 0.020 a determined by the most probable number technique (Porter, 1979);
b Soil organic matter determined
by Walkley and Black method; c
Ca, Mg, and K were extracted by 1 M ammonium acetate; d
determined in 0.01 M CaCl2 soil extract 1:10.
Figure 5. View of the youngest –mature pinna of a seedling of leucaena, the arrow shows the location
of the pinnule to be collected. Original photo. Nova S
cienc
e Pub
lishe
rs, In
c.
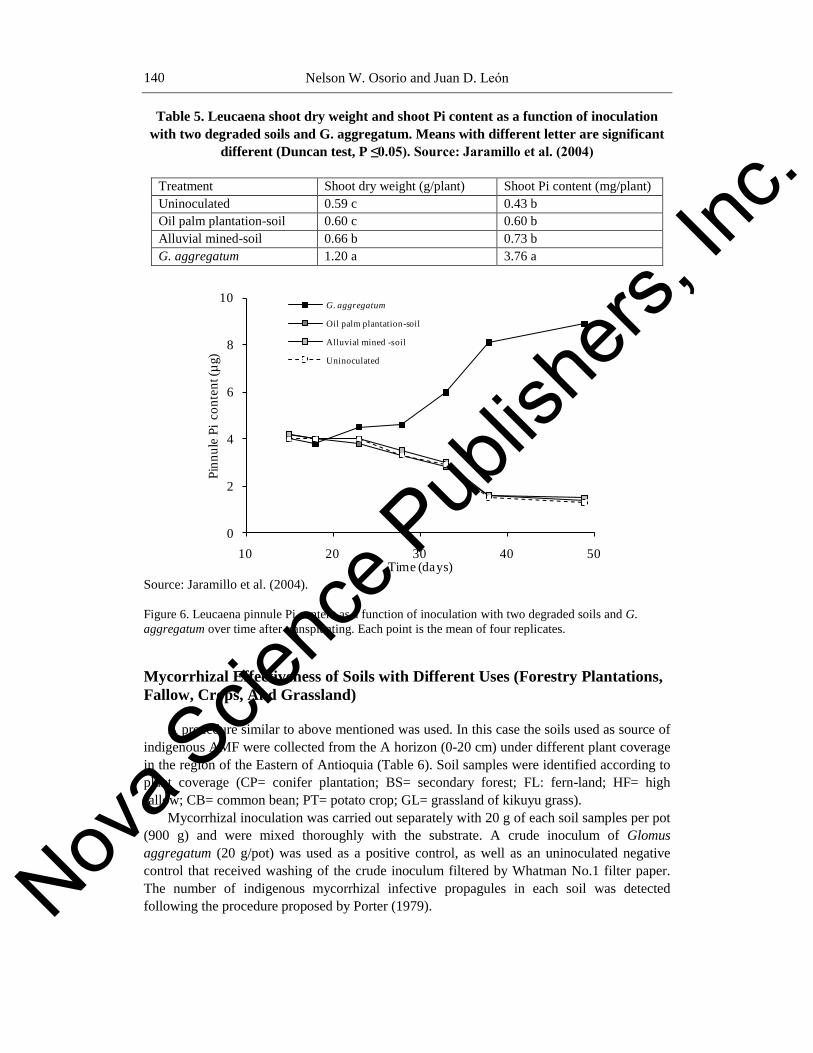
Nelson W. Osorio and Juan D. León 140
Table 5. Leucaena shoot dry weight and shoot Pi content as a function of inoculation
with two degraded soils and G. aggregatum. Means with different letter are significant
different (Duncan test, P ≤ 0.05). Source: Jaramillo et al. (2004)
Treatment Shoot dry weight (g/plant) Shoot Pi content (mg/plant)
Uninoculated 0.59 c 0.43 b
Oil palm plantation-soil 0.60 c 0.60 b
Alluvial mined-soil 0.66 b 0.73 b
G. aggregatum 1.20 a 3.76 a
Source: Jaramillo et al. (2004).
Figure 6. Leucaena pinnule Pi content as a function of inoculation with two degraded soils and G.
aggregatum over time after transplanting. Each point is the mean of four replicates.
Mycorrhizal Effectiveness of Soils with Different Uses (Forestry Plantations,
Fallow, Crops, And Grassland)
A procedure similar to above mentioned was used. In this case the soils used as source of
indigenous AMF were collected from the A horizon (0-20 cm) under different plant coverage
in the region of the Eastern of Antioquia (Table 6). Soil samples were identified according to
plant coverage (CP= conifer plantation; BS= secondary forest; FL: fern-land; HF= high
fallow; CB= common bean; PT= potato crop; GL= grassland of kikuyu grass).
Mycorrhizal inoculation was carried out separately with 20 g of each soil samples per pot
(900 g) and were mixed thoroughly with the substrate. A crude inoculum of Glomus
aggregatum (20 g/pot) was used as a positive control, as well as an uninoculated negative
control that received washing of the crude inoculum filtered by Whatman No.1 filter paper.
The number of indigenous mycorrhizal infective propagules in each soil was detected
following the procedure proposed by Porter (1979).
0
2
4
6
8
10
10 20 30 40 50
Pin
nu
le P
i co
nte
nt (µ
g)
Time (days)
G. aggregatum
Oil palm plantation-soil
Alluvial mined -soil
Uninoculated
Nova S
cienc
e Pub
lishe
rs, In
c.
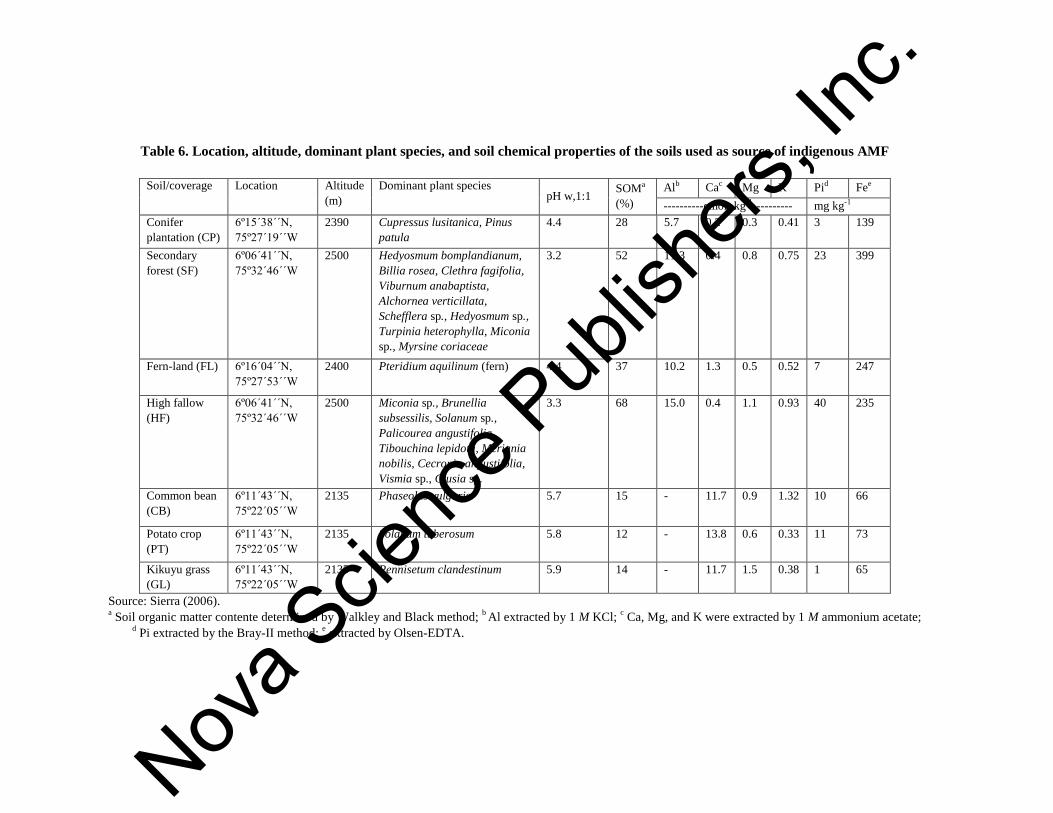
Table 6. Location, altitude, dominant plant species, and soil chemical properties of the soils used as source of indigenous AMF
Soil/coverage Location Altitude
(m)
Dominant plant species pH w,1:1
SOMa
(%)
Alb Cac Mg K Pid Fee
----------cmolc kg-1---------- mg kg-1
Conifer
plantation (CP)
6º15´38´´N,
75º27´19´´W
2390 Cupressus lusitanica, Pinus
patula
4.4 28 5.7 0.2 0.3 0.41 3 139
Secondary
forest (SF)
6º06´41´´N,
75º32´46´´W
2500 Hedyosmum bomplandianum,
Billia rosea, Clethra fagifolia,
Viburnum anabaptista,
Alchornea verticillata,
Schefflera sp., Hedyosmum sp.,
Turpinia heterophylla, Miconia
sp., Myrsine coriaceae
3.2 52 11.3 0.4 0.8 0.75 23 399
Fern-land (FL) 6º16´04´´N,
75º27´53´´W
2400 Pteridium aquilinum (fern) 4.4 37 10.2 1.3 0.5 0.52 7 247
High fallow
(HF)
6º06´41´´N,
75º32´46´´W
2500 Miconia sp., Brunellia
subsessilis, Solanum sp.,
Palicourea angustifolia,
Tibouchina lepidota, Meriania
nobilis, Cecropia angustifolia,
Vismia sp., Clusia sp.
3.3 68 15.0 0.4 1.1 0.93 40 235
Common bean
(CB)
6º11´43´´N,
75º22´05´´W
2135 Phaseolus vulgaris 5.7 15 - 11.7 0.9 1.32 10 66
Potato crop
(PT)
6º11´43´´N,
75º22´05´´W
2135 Solanum tuberosum 5.8 12 - 13.8 0.6 0.33 11 73
Kikuyu grass
(GL)
6º11´43´´N,
75º22´05´´W
2135 Pennisetum clandestinum 5.9 14 - 11.7 1.5 0.38 1 65
Source: Sierra (2006). a Soil organic matter contente determined by Walkley and Black method;
b Al extracted by 1 M KCl;
c Ca, Mg, and K were extracted by 1 M ammonium acetate;
d Pi extracted by the Bray-II method;
e extracted by Olsen-EDTA.
Nova S
cienc
e Pub
lishe
rs, In
c.
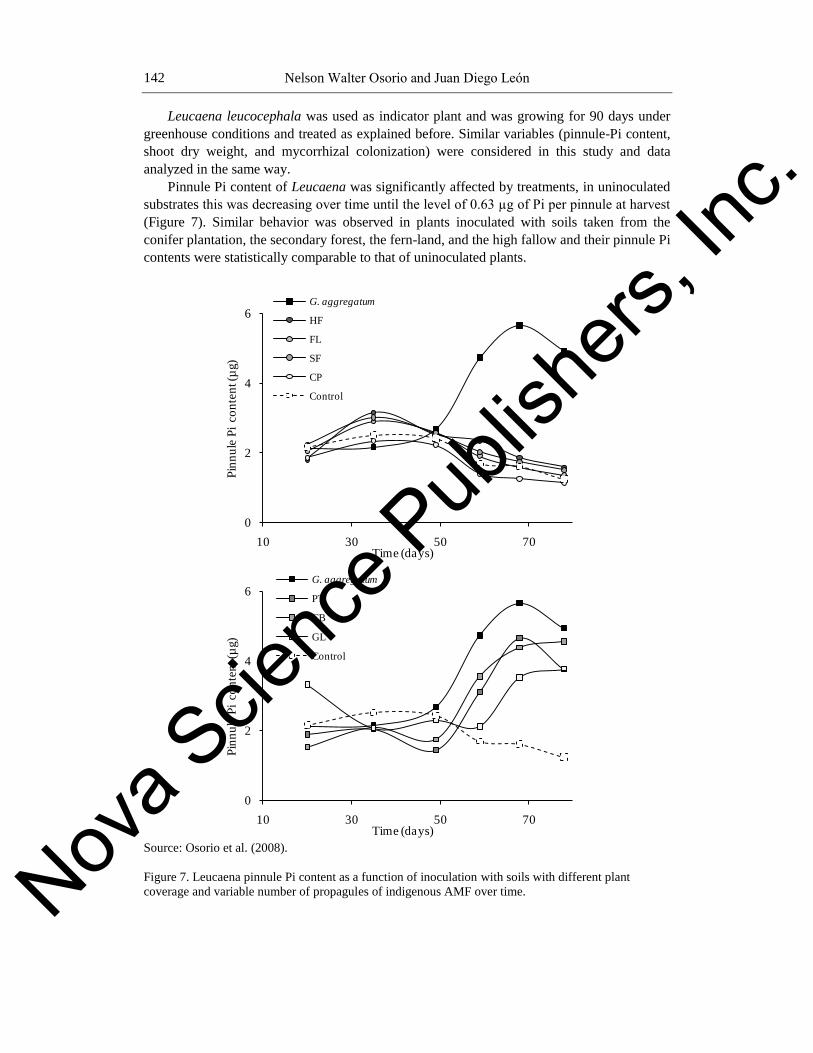
Nelson Walter Osorio and Juan Diego León 142
Leucaena leucocephala was used as indicator plant and was growing for 90 days under
greenhouse conditions and treated as explained before. Similar variables (pinnule-Pi content,
shoot dry weight, and mycorrhizal colonization) were considered in this study and data
analyzed in the same way.
Pinnule Pi content of Leucaena was significantly affected by treatments, in uninoculated
substrates this was decreasing over time until the level of 0.63 µg of Pi per pinnule at harvest
(Figure 7). Similar behavior was observed in plants inoculated with soils taken from the
conifer plantation, the secondary forest, the fern-land, and the high fallow and their pinnule Pi
contents were statistically comparable to that of uninoculated plants.
Source: Osorio et al. (2008).
Figure 7. Leucaena pinnule Pi content as a function of inoculation with soils with different plant
coverage and variable number of propagules of indigenous AMF over time.
0
2
4
6
10 30 50 70
Pin
nu
le P
i co
nte
nt (µ
g)
Time (days)
G. aggregatum
HF
FL
SF
CP
Control
0
2
4
6
10 30 50 70
Pin
nu
le P
i co
nte
nt (µ
g)
Time (days)
G. aggregatum
PT
CB
GL
Control
Nova S
cienc
e Pub
lishe
rs, In
c.
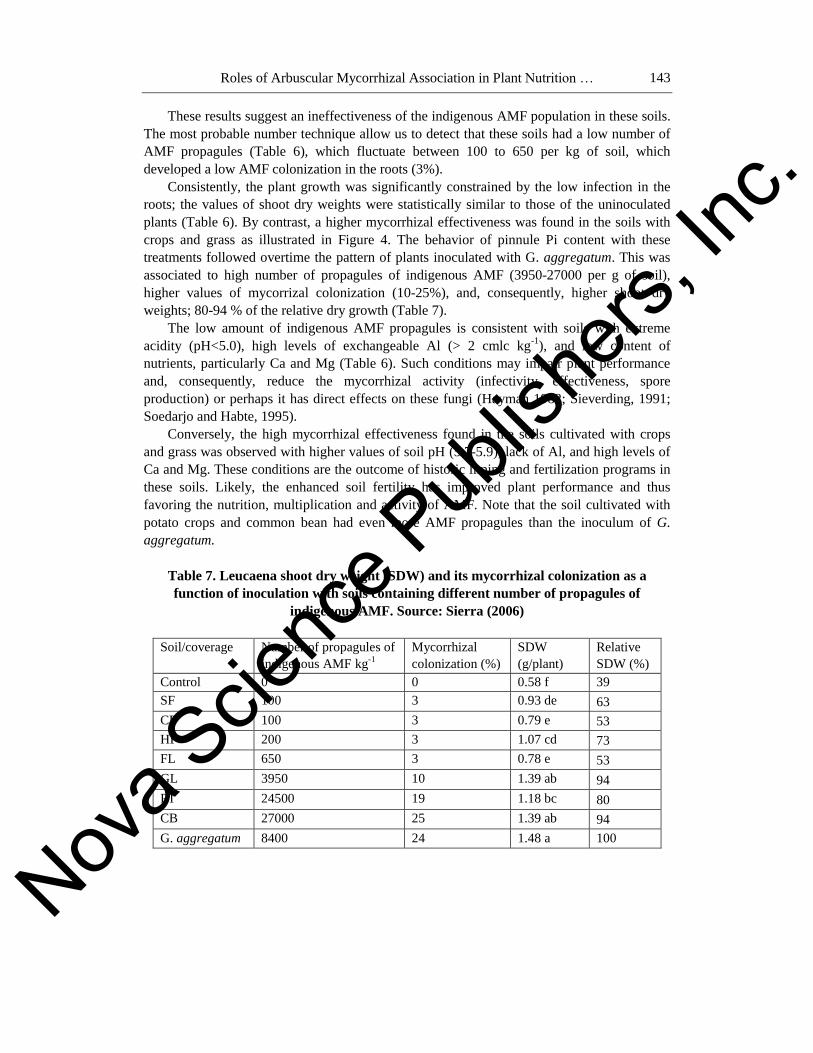
Roles of Arbuscular Mycorrhizal Association in Plant Nutrition … 143
These results suggest an ineffectiveness of the indigenous AMF population in these soils.
The most probable number technique allow us to detect that these soils had a low number of
AMF propagules (Table 6), which fluctuate between 100 to 650 per kg of soil, which
developed a low AMF colonization in the roots (3%).
Consistently, the plant growth was significantly constrained by the low infection in the
roots; the values of shoot dry weights were statistically similar to those of the uninoculated
plants (Table 6). By contrast, a higher mycorrhizal effectiveness was found in the soils with
crops and grass as illustrated in Figure 4. The behavior of pinnule Pi content with these
treatments followed overtime the pattern of plants inoculated with G. aggregatum. This was
associated to high number of propagules of indigenous AMF (3950-27000 per g of soil),
higher values of mycorrizal colonization (10-25%), and, consequently, higher shoot dry
weights; 80-94 % of the relative dry growth (Table 7).
The low amount of indigenous AMF propagules is consistent with soils with extreme
acidity (pH<5.0), high levels of exchangeable Al (> 2 cmlc kg-1
), and low content of
nutrients, particularly Ca and Mg (Table 6). Such conditions may impair plant performance
and, consequently, reduce the mycorrhizal activity (infectivity, effectiveness, spore
production) or perhaps it has direct effects on these fungi (Hayman 1982; Sieverding, 1991;
Soedarjo and Habte, 1995).
Conversely, the high mycorrhizal effectiveness found in the soils cultivated with crops
and grass was observed with higher values of soil pH (5.7-5.9), lack of Al, and high levels of
Ca and Mg. These conditions are the outcome of historic liming and fertilization programs in
these soils. Likely, the enhanced soil fertility has improved plant performance and thus
favoring the nutrition, multiplication and activity of AMF. Note that the soil cultivated with
potato crops and common bean had even more AMF propagules than the inoculum of G.
aggregatum.
Table 7. Leucaena shoot dry weight (SDW) and its mycorrhizal colonization as a
function of inoculation with soils containing different number of propagules of
indigenous AMF. Source: Sierra (2006)
Soil/coverage Number of propagules of
indigenous AMF kg-1
Mycorrhizal
colonization (%)
SDW
(g/plant)
Relative
SDW (%)
Control 0 0 0.58 f 39
SF 100 3 0.93 de 63
CP 100 3 0.79 e 53
HF 200 3 1.07 cd 73
FL 650 3 0.78 e 53
GL 3950 10 1.39 ab 94
PT 24500 19 1.18 bc 80
CB 27000 25 1.39 ab 94
G. aggregatum 8400 24 1.48 a 100
Nova S
cienc
e Pub
lishe
rs, In
c.
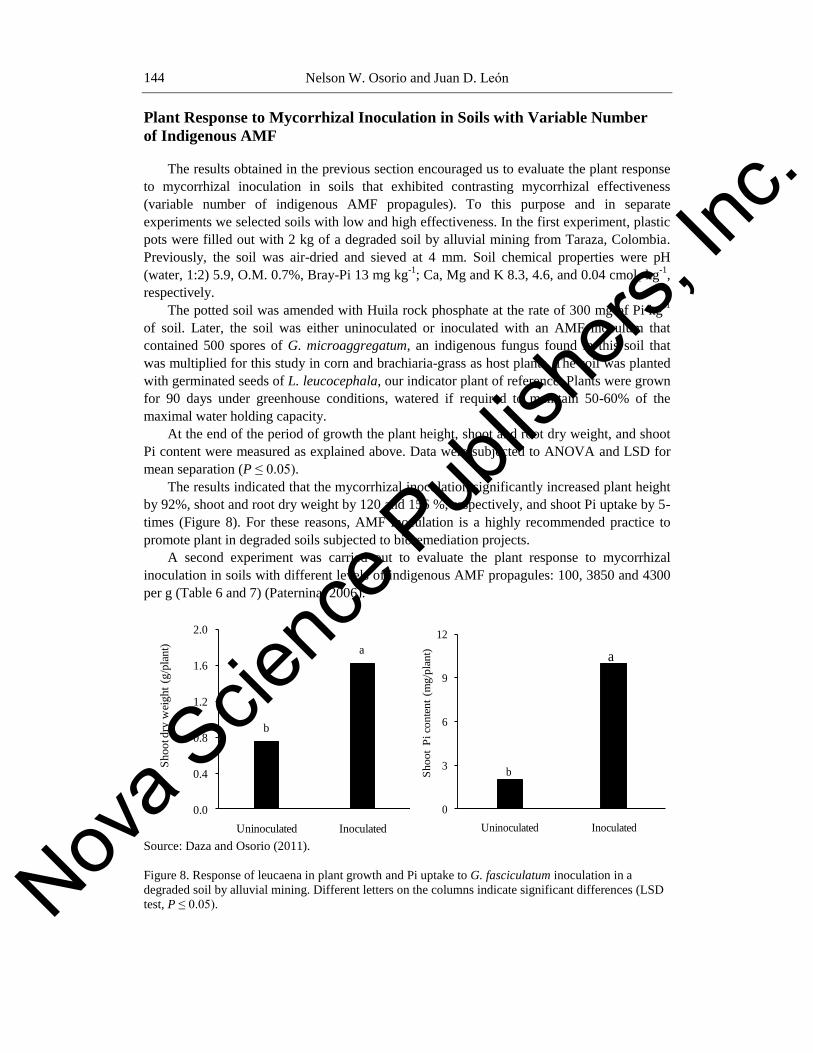
Nelson W. Osorio and Juan D. León 144
Plant Response to Mycorrhizal Inoculation in Soils with Variable Number
of Indigenous AMF
The results obtained in the previous section encouraged us to evaluate the plant response
to mycorrhizal inoculation in soils that exhibited contrasting mycorrhizal effectiveness
(variable number of indigenous AMF propagules). To this purpose and in separate
experiments we selected soils with low and high effectiveness. In the first experiment, plastic
pots were filled out with 2 kg of a degraded soil by alluvial mining from Taraza, Colombia.
Previously, the soil was air-dried and sieved at 4 mm. Soil chemical properties were pH
(water, 1:2) 5.9, O.M. 0.7%, Bray-Pi 13 mg kg-1
; Ca, Mg and K 8.3, 4.6, and 0.04 cmolc kg-1
,
respectively.
The potted soil was amended with Huila rock phosphate at the rate of 300 mg of Pi kg-1
of soil. Later, the soil was either uninoculated or inoculated with an AMF inoculum that
contained 500 spores of G. microaggregatum, an indigenous fungus found in this soil that
was multiplied for this study in corn and brachiaria-grass as host plants. The soil was planted
with germinated seeds of L. leucocephala, our indicator plant of reference. Plants were grown
for 90 days under greenhouse conditions, watered if required to maintain 50-60% of the
maximal water holding capacity.
At the end of the period of growth the plant height, shoot and root dry weight, and shoot
Pi content were measured as explained above. Data were subjected to ANOVA and LSD for
mean separation (P ≤ 0.05).
The results indicated that the mycorrhizal inoculation significantly increased plant height
by 92%, shoot and root dry weight by 120 and 156 %, respectively, and shoot Pi uptake by 5-
times (Figure 8). For these reasons, AMF inoculation is a highly recommended practice to
promote plant in degraded soils subjected to bioremediation projects.
A second experiment was carried out to evaluate the plant response to mycorrhizal
inoculation in soils with different levels of indigenous AMF propagules: 100, 3850 and 4300
per g (Table 6 and 7) (Paternina, 2006).
Source: Daza and Osorio (2011).
Figure 8. Response of leucaena in plant growth and Pi uptake to G. fasciculatum inoculation in a
degraded soil by alluvial mining. Different letters on the columns indicate significant differences (LSD
test, P ≤ 0.05).
0.0
0.4
0.8
1.2
1.6
2.0
Uninoculated Inoculated
Shoo
t dry
wei
ght
(g/p
lant) a
b
0
3
6
9
12
Uninoculated Inoculated
Sh
oo
t P
i co
nte
nt
(mg
/pla
nt) a
b
Nova S
cienc
e Pub
lishe
rs, In
c.

Roles of Arbuscular Mycorrhizal Association in Plant Nutrition … 145
To this aim, leucaena plants were grown under greenhouse conditions in three potted
soils (900 g per pot) either uninoculated or inoculated with the mycorrhizal fungus G.
fasciculatum (25 g kg-1
) that contained 43000 AMF propagules per kg. We measured the
plant response in terms of the relative plant Pi uptake and growth with and without the
inoculation.
The results also showed that the magnitude of the response to the mycorrhizal inoculation
decreased as the number of indigenous propagules of AMF in the soil increased (Figure 9).
When the soil had 100 AMF propagules per kg the response was highly significant (P<0.01)
and nil when the soil had 4300 propagules per kg. These results confirmed the hypothesis
derived from the experiment conducted by Sierra (2006) (Figure 7 and Table 7). In this way,
plant derived benefits from the AMF inoculation if the target plant is mycorrhiza-dependent,
the soil had a low level of available Pi, and the soil had a low number of indigenous AMF
propagules.
Source: Osorio et al. (2008).
Figure 9. Relative response of leucaena in plant growth and Pi uptake to G. fasciculatum inoculation in
three soils with different levels of indigenous AMF propagules.
CONCLUSION
Our study reaffirms the importance of mycorrhizal association in the establishment of
plant species in tropical soils. The roles that AMF play in plant growth and Pi uptake are so
relevant that their use through biofertlization is feasible and cost-effectively practice in
tropical cropping, agroforestry, and forestry systems. Mycorrhiza-forming plants can grow
with only a fraction of the Pi required for growth compared to mycorrhizal-free plants.
Maximal benefits of AMF inoculation can be obtained with inoculum of good quality and
when plant and soil conditions are favorable for AMF functioning. The use of AMF is
recommendable if: (i) the target plant species exhibits mycorrhizal dependency, (ii) the soil
soluble Pi level is low, and (iii) the effectiveness of soil indigenous AMF is low. The
potential role of mycorrhiza at the ecosystem-level is significant; particularly in the
reestablishment of soil Pi cycling in degraded soils as well as in forestry and agroforestry
ecosystems.
0
20
40
60
80
100
100 3850 4300
Rela
tiv
e p
lan
t gro
wth
(%
)
Number of indigenous AMF propagules per kg
Uninoculated Inoculated
0
20
40
60
80
100
100 3850 4300
Rela
tiv
e P
up
tak
e (
%)
Number of indigenous AMF propagules per kg
Uninoculated Inoculated
Nova S
cienc
e Pub
lishe
rs, In
c.
Nelson W. Osorio and Juan D. León 146
ACKNOWLEDGMENTS
We thank the Universidad Nacional de Colombia for financial support of the Project
“Restoration of lands in a process of desertification with Neem (Azadirachta indica)
plantations in Western Antioquia” (project No. 9388).
REFERENCES
Abbot, L.K., Robson, A.D., (1984). The effect of VA mycorrhizae in plant growth. In: C.L.
Powell, and D.J. Bagyaraj (Eds.), VA mycorrhiza (pp.113-130). Boca Raton, FL: CRC
Press.
Aerts, R., (1997). Climate, leaf litter chemistry and leaf litter decomposition in terrestrial
ecosystems: a triangular relationship. Oikos 79, 439-449.
Allen, E.B, Allen, M.F., Helm, D.J., Trappe, J.M., Molina, R., Rincón, E., (1995). Patterns
and regulation of mycorrhizal plant and fungal diversity. Plant Soil 170, 47-62.
Allen, E.B., Rincon, E., Allen, M.F., Perez-Jimenez, A., Huante, P., (1998). Disturbance and
seasonal dynamics of mycorrhizae in a tropical deciduous forest in Mexico. Biotropica
30, 261-274.
Alvarado, B., (1988). Determinación de micorrizas en Cupressus sp. In: F.H. Orozco (Ed.),
Investigaciones sobre micorrizas en Colombia (2nd
edition, pp. 111-117). Medellín,
Colombia: Sociedad Colombiana de la Ciencia del Suelo.
Andrade, A.G., Costa, G.S., Faria, S.M., (2000). Deposition and decomposition of litter of
four years old Mimosa caesalpinifolia, Acacia mangium and Acacia holosericaea in a
Planosol. Rev. Bras.Cienc. Solo 24, 777-785.
Anino, E.O., (1992). Natural ecto-mycorrhiza of Acacia mangium. Nitrogen fixing tree
Research Reports 10, 96-97.
Aziz, T., Habte, M., (1987). Determining vesicular-arbuscular mycorrhizal effectiveness by
monitoring P status of leaf disks. Can. J. Microbiol. 33, 1097–1101.
Ba, A.M., Dalpé, Y., Guissou, T., (1996). Les Glomales d´ Acacia holosericea y Acacia
mangium. Bois et Forests des Tropiques 250, 5-18.
Bago, B., Azcon-Aguilar, C., (1997). Changes in the rhizosphere pH induced by arbuscular
mycorrhiza formation in onion (Allium cepa). Z. Pflanz. Bodenkunde 160, 333–339.
Baon, J.B., Smith, S.E., Alston, A.M., (1993). Mycorrhizal response of barley cultivars
differing in P efficiency. Plant Soil 157, 97–105.
Barber, S.A., (1995). Soil nutrient bioavailability: a mechanistic approach. New York, NY:
John Wiley and Sons.
Barreto, L.H., (2005). Estudio exploratorio del compartimento edáfico de ecosistemas
forestales altoandinos de Piedras Blancas, Antioquia. Tesis Ingeniería Forestal,
Universidad Nacional de Colombia, Medellín.
Barreto, L.H., León, J.D., (2005). Masa de raíces finas en ecosistemas forestales (Quercus
humboldtii, Pinus patula y Cupressus lusitanica) de Piedras Blancas, Antioquia. Rev.
Fac. Nac. Agron Med. 58, 2907-2929. Nova S
cienc
e Pub
lishe
rs, In
c.

Roles of Arbuscular Mycorrhizal Association in Plant Nutrition … 147
Bethlenfalvay, G.J., (1992). Mycorrhiza and crop productivity. In: G.J. Bethlenfalvay, R.G.
Linderman (Eds.), Mycorrhizae in sustainable agriculture (pp.1-27). Madison, WI: ASA,
CSSA, SSSA.
Bethlenfalvay, G.J., Cantrell, I.C., Mihara, K.L., Schreiner, R.P., (1998). Relationship
between soil aggregation and mycorrhiza as influenced by soil biota and nitrogen. Biol.
Fertil. Soils 28, 356– 363.
Bolan, N.S., (1991). A critical review on the role of mycorrhizal fungi in the uptake of
phosphorus by plants. Plant Soil 134,189–207.
Brady, N.C., Weil, R.R., (2002). The nature and properties of soils. Upper Saddle River, NJ:
Prentice Hall.
Brundrett, M., Bougher, N., Dell, B., Grove, T., Malajczuk, N., (1996). Working with
mycorrhizas in forestry and agriculture. Canberra, Australia: Australian Centre for
International Agricultural Research.
Buol, S., Hole, F.D., McCraken, R.J., Southard, R.J., (1997). Soil Genesis and Classification.
Ames, IA: Iowa State University Press.
Cardoso, I., Boddington, C.L., Janssen, B.H., Oenema, O., Kuyper, T., (2006). Differential
acces to phosphorus pool of an Oxisol by mycorrhizal and non-mycorrhizal maize.
Commun. Soil Sci. Plan. 37, 1537-1552.
Castellanos-Barliza, J., León, J.D., (2010). Caída de hojarasca y dinámica de nutrientes en
plantaciones de Acacia mangium (Mimosaceae) de Antioquia, Colombia. Acta Biol.
Colomb. 15, 289-308.
Castellanos-Barliza, J., León, J.D., (2011). Descomposición de hojarasca y liberación de
nutrientes en plantaciones de Acacia mangium (Fabales: Mimosaceae) establecidas en
suelos degradados de Colombia. Rev. Biol. Trop. 59, 113-128.
Clark, F.E., Paul, E.A., (1989). Soil Microbiology and Biochemistry. San Diego, CA:
Academic Press.
Cooper, K.M., Grandison, G.S., (1986). Interaction of vesicular-arbuscular mycorrhizal fungi
and root knot nematode on cultivars of tomato and white clover susceptible to
Meloidogyne hapla. Annals Appl. Biol. 108, 555–565.
Culley, J.L.B., Bolton E.F., Bernyk B., (1983). Suspended solids and phosphorus loads from
a clay soil; I. Plot studies. J. Environ. Qual. 12, 493–503.
Daza, P.C., Osorio, N.W., (2011). Plant growth and phosphorus uptake promotion in leucena
by a mycorrhizal fungus in leucaena grown in a degraded soil by alluvial mining. Suelos
Ecuat. 41, 144-149.
Dehne, H.W., (1982). Interaction between vesicular-arbuscular mycorrhizal fungi and plant
pathogens. Phytopathology 72, 1115-1119.
Diez, M.C., (2006). Dependencia micorrizal de pino romerón, Retrophyllum rospigliosii
(Pilg.) C.N. Page (Podocarpaceae) bajo diferentes regímenes lúminicos. Tesis M.Sc.,
Universidad Nacional de Colombia, Medellín.
Diez, M.C., Osorio, N.W., Moreno, F.H., (2008). Evaluation of mycorrhizal dependency of
romeron pine (Nageia rospigliosii Pilger) under contrasting light conditions. Rev. Fac.
Nac. Agron. Med. 61, 4554-4563.
Do Carmo Harta, M., Torrent, J., (2007). Phosphorus desorption kinetics in relation to
phosphorus forms and sorption properties of Portuguese acid soils. Soil Sci. 172, 631-
638. Nova S
cienc
e Pub
lishe
rs, In
c.

Nelson W. Osorio and Juan D. León 148
Duponnois, R., Ba, A.M., (1999). Growth stimulation of Acacia mangium Willd by Pisolithus
sp. in some Senegal soils. Forest Ecol.Manag. 119: 209-215.
Farsi, B., Fontana, A., (1962). Micorrize ectotrofiche di Brachystegia laurentii e di alcune
altre di Caesalpiniaceae minori del Congo. Allionis 8, 21-131.
Fox, R.L., (1979). Comparative responses of field grown crops to phosphate concentrations in
soil solutions. In: H. Munsell, and R. Staples (Eds.), Stress Physiology in Crop Plants
(pp. 81-106). New York, NY: John Wiley and Sons.
Fox, R.L., Kamprath, E.J., (1970). Phosphate solution isotherms for evaluating the phosphate
requirements of soils. Soil Sci. Soc. Am. Pro. 34,902–907.
Galiana, A., Prin, Y., Mallet, B., Gnahoua, G.M., Poitel, M., Diem, H.G., (1994). Inoculation
of Acacia mangium with alginate beads containing selected Bradyrhizobium strains under
field conditions: Long-term effect on plant growth and persistence of the introduced
strains in soil. Appl. Environ. Microbiol.60, 3974-3980.
Gavito, M.F., Miller, M.H., (1998). Early phosphorus nutrition, mycorrhizal development,
dry matter partitioning and yield of maize. Plant Soil 199, 177–186.
Gemma, J.N., Koske R.E., Habte, M., (2002). Mycorrhizal dependency of some endemic and
endangered Hawaiian plant species. Am. J. Bot. 89, 337-345.
Gerdemann, J.W., (1975). Vesicular-arbuscular mycorrhiza. In: J.G. Torrey, and D.T.
Clarkson (Eds.), The development and functions of roots (pp. 575-591). London, UK:
Academic Press.
Giovannetti, M, Mosse, B., (1980). An evaluation of techniques for measuring vesicular-
arbuscular mycorrhizal infection in roots. New Phytol. 84, 489–500.
Gohre, V., Paszkowski, U., (2006). Contribution of the arbuscular mycorrhizal symbiosis to
heavy metal phytoremediation. Planta 223, 1115–1122.
Habte, M., (1989). Impact of simulated erosion on the abundance and activity of indigenous
vesicular arbuscular mycorrhizal endophytes in an Oxisol. Biol. Fert. Soils 7, 164–167.
Habte, M., (1995). Dependency of Cassia siamea on vesicular arbuscular mycorrhizal fungi.
J. Plant Nutr. 18, 2191-2198.
Habte, M., Fox, R.L., (1993). Effectiveness of VAM fungi in nonsterile soils before and after
optimization of P in soil solution. Plant Soil 151, 219–226.
Habte, M., Fox, R.L., Huang, R.S., (1987). Determining vesicular-arbuscular mycorrhizal
effectiveness by monitoring P status of subleaflets of an indicator plant. Commun. Soil
Sci. Plan.18, 1403–1420.
Habte, M., Manjunath, A., (1991). Categories of vesicular-arbuscular mycorrhizal
dependency of host species. Mycorrhiza 1, 3-12.
Habte, M., Osorio. N.W., (2001). Arbuscular mycorrhizas: producing and applying
arbuscular mycorrhizal inoculum. Honolulu, HI: University of Hawaii.
Habte, M., Turk, D., (1991). Response of two species of Cassia and Gliricidia sepium to
vesicular arbuscular infection. Commun. Soil Sci. Plan. 22, 1861–1872.
Hamel, C., (2004). Impact of arbuscular mycorrhizal fungi on N and P cycling in the root
zone. Can. J. Soil Sci. 84, 383-395.
Harley, J.L., Smith, S.E., (1983). Mycorrhizal symbiosis. New York, NY: Academic Press.
Hattingh, M.J., Gray, L.E., Gerdemann, J.W., (1973). Uptake and translocation of 32
P-labeled
phosphate to onion roots by endomycorrhizal fungi. Soil Sci. 116, 383-387.
Havlin, J., Beaton, J., Tisdale, S.L., Nelson W., (1999). Soil Fertility and Fertilizers: an
introduction to nutrient management. Upper Saddle River, NJ: Prentice Hall. Nova S
cienc
e Pub
lishe
rs, In
c.
Roles of Arbuscular Mycorrhizal Association in Plant Nutrition … 149
Hayman, D.S., (1982). Influence of soils and fertility on the activity and survival of
arbuscular mycorrhizal fungi. Phytopathology 72, 1119–1125.
Hayman, D.S., (1983). The physiology of vesiculararbuscular endomycorrhizal symbiosis.
Can. J. Bot. 61, 944–963.
Hetrick, B.A.D., (1991). Mycorrhizas and root architecture. Experientia 47, 355-362.
Hetrick, B.A.D., Kitt, D.G., Wilson, G.T., (1988). Mycorrhizal dependence and growth habits
of warm-season and cool-season tall grass prairie plants. Can. J. Bot. 66, 1376–1380.
Hogberg, P., (1982). Mycorrhizal association in some woodland and forest trees and shrubs in
Tanzania. New Phytol. 92, 407-415.
Hogberg, P., Nylund, J., (1981). Ectomycorrhizae in coastal Biombo woodland of Tanzania.
Plant Soil 63, 283-289.
Holford, I.C.R., (1997). Soil phosphorus: its measurement, and its uptake by plants. Aust. J.
Soil Res. 35, 227-39.
Hooker, J.E., Jaizme-Vegas, M., Atkinson, D., (1994). Biocontrol of plant pathogens using
arbuscular mycorrhizal fungi. In: S. Gianinazzi, and H. Schuepp (Eds.), Impacts of
arbuscular mycorrhizal on sustainable agriculture and natural ecosystems (pp. 191-199).
Basel, Switzerland: Birkhauser Verlag.
Howeler, R.H., Edwards, D.G., Asher, C.J., (1981). Applications of the flowing solution
culture techniques to study involving mycorrhizas. Plant Soil 59, 179–183.
Huante, P., Rincon, E., Allen, E.B., (1993). Effect of vesicular-arbuscular mycorrhizae on
seedling growth of four tree from the deciduous tropical forest in Mexico. Mycorrhiza 2,
141-145.
Hue, N.V., Fox, R., (2010). Predicting plant phosphorus requirements for Hawaii soils using a
combination of phosphorus sorption isotherms and chemical extraction methods.
Commun. Soil Sci. Plan. 41, 133–143.
Jacobsen, I., Abbott, L.K., Robson, A.D., (1992). External hyphae of vesicular-arbuscular
mycorrhizal fungi associated with Trifolium subterraneum L. New Phytol. 120, 371-380.
Jakobsen, I., Jones, E.J., Larse, J., (1994). Hyphal phosphorus transport, a keystone to
mycorrhizal enhancement of plant growth. In: S. Gianinazzi, and S. Schuepp (Eds.),
Impacts of arbuscular mycorrhizal on sustainable agriculture and natural ecosystems
(pp. 133-146). Basel, Switzerland: Birkhauser Verlag.
Janos, D.P., (1980a). Mycorrhizae influence tropical succession. Biotropica 12, 56-64.
Janos, D.P., (1980b). Vesicular-arbuscular mycorrhizae affect lowland tropical rainforest
plant growth. Ecology 61, 151-162.
Janos, D.P., (1988). Mycorrhiza applications in tropical forestry: are temperate-zone
approaches appropriate? In: Trees and mycorrhiza, Proceedings of the Asian Seminar
(pp. 133-188). Kuala Lumpur, Malaysia: Malaysian Forest Research Institute.
Jaramillo, S., Osorio, N.W., (2005). Factors that determine the mycorrhizal dependence of
plants. Suelos Ecuat. 35, 34-40.
Jaramillo, S.P., Silva J.M., Osorio, N.W., (2004). Potential simbiotic and mycorrhizal
effectiveness of three soils subjected to different uses. Rev. Fac. Nac. Agron. Med. 57,
2203-2214.
Jeffries, P., Gianinazzi, S., Perotto, S., Turnau, K., Barea, J.M., (2003). The contribution of
arbuscular mycorrhizal fungi in sustainable maintenance of plant health and soil fertility.
Biol. Fert. Soils 37, 1-16. Nova S
cienc
e Pub
lishe
rs, In
c.
Nelson W. Osorio and Juan D. León 150
Johnson, N.C., Wedin, D.A., (1997). Soil carbon, nutrients and mycorrhizae during
conversion of dry tropical forest to grassland. Ecol. Appl. 7, 171-182.
Kabir, Z., O‟Halloran, I.P., Hamel, C., (1999). Combined effects of soil disturbance and
fallowing on plant and fungal components of mycorrhizal corn (Zea mays L.). Soil Biol.
Biochem. 31, 307–314.
Khalil, S., Loynachan, T.E., Tabatabai, M.A., (1999). Plant determinants of mycorrhizal
dependency in soybean. Agron. J. 91, 135–141.
Koide, R.T., Schreiner, R.P., (1992). Regulation of the vesicular-arbuscular mycorrhizal
symbiosis. Ann. Rev. Plant Physiol. Plant Mol. Biol. 43, 557–581.
Kormanik, P.P., McGraw, A.C., Shultz, R.C., (1980). Procedures and equipment for staining
large numbers of plant roots for endomycorrhizal assay. Can. J. Microbiol. 26, 536–538.
Kottke, I., (2002). Mycorrhizae-rhizosphere determinants of plant comunities. In: Y. Waisel,
A. Eshel, and U. Kakkafi (Eds.), Plant roots: the hidden half (3rd
ed., pp. 919-932). New
York, NY: Marcel Dekker.
Kuo, S., (1996). Phosphorus. In: D.L. Sparks (Ed.), Methods of Soil Analysis: Chemical
Methods (pp. 869-919). Madison, WI: Soil Sci. Soc. Am. and Am. Soc. Agron.
Langley, J.A., Hungate, B.A., (2003). Mycorrhizal control on belowground litter quality.
Ecology 84, 2302-2312.
Lee, D.K., Nguyen, H.N., (1991). Growth of some Acacia species in Vietman. In: J.W.
Turnbull (Ed.), Australian Acacias in developing countries (pp. 173-176). Canberra,
Australia: Australian Centre for International Agricultural Research.
León, J.D., (2007). Contribución al conocimiento del ciclo de nutrientes en bosques montanos
naturales de Quercus humboldtii y reforestados (Pinus patula y Cupressus lusitanica) de
la región de Piedras Blancas, Antioquia (Colombia). Tesis Doctoral, Universidad de
Salamanca, Salamanca, España.
León, J.D., González, M.I., Gallardo, J.F., (2009). Retranslocación y eficiencia en el uso de
nutrientes en bosques del centro de Antioquia. Colombia Forestal 12, 119-140.
León, J.D., Osorio, N.W., Castellanos, J., Osorio, L.F., (2010). Recuperación de suelos
degradados por minería aluvial de oro con plantaciones de Acacia en la región del Bajo
Cauca (Antioquia, Colombia). Suelos Ecuat. 50: 62-67.
León, J.D., Osorio, N.W., Díez, M.C., Castellanos, J., Osorio, L.F., Marín, N., (2008). Grupos
funcionales de microorganismos en suelos degradados por minería de aluvión plantados
con Acacia mangium. Suelos Ecuat. 38, 75-80.
Li, X., Ecckhard, G., Marschner, H. (1991). Phosphorus depletion and pH decrease at the
root-soil and hypha-soil interfaces of VA mycorrhizal white clover fertilized with
ammonium. New Phytol. 119, 397-404.
Linderman, R.G., (1988). Mycorrhizal interaction with the rhizosphere microflora: the
mycorhizosphere effect. Phytopathology 78, 366-371.
Lindsay, W.L., (2001). Chemical equilibria in soils. Caldwell, NJ: The Blackburn Press.
Louis, I., Lim, G., (1987). Spore density and root colonization of vesicular-arbuscular
mycorrhizal in tropical soil. T. Brit. Mycol. Soc. 88, 207-212.
Lynch, J.P., Ho, M.D., (2005). Rhizoeconomics: carbon costs of phosphorus acquisition.
Plant Soil 269, 45-56.
Manjunath, A., Habte, M., (1988). The development of vesicular-arbuscular mycorrhizal
infection and the uptake of immobile nutrients in Leucaena leucocephala. Plant Soil 106,
97–103. Nova S
cienc
e Pub
lishe
rs, In
c.
Roles of Arbuscular Mycorrhizal Association in Plant Nutrition … 151
Manjunath, A., Habte, M., (1991). Root morphological characteristics of host species having
distinct mycorrhizal dependency. Can. J. Bot. 69, 671–676.
Marschner, H., (1995). Mineral nutrition of higher plants. London, UK: Academic Press.
McCully, M., (1999). Roots in soil: unearthing the complexities of roots and their
rhizospheres. Ann. Rev. Plant Physiol. Plant Mol. Biol. 50, 695-718.
Medina, E., Cuevas, E., (1993). Mineral nutrition: humid tropical forests. Prog. Bot. 55, 115-
129.
Medina, E., García, V., Cuevas, E., (1990). Sclerophylly and oligotrophic environments:
relationships between leaf structure, mineral nutrient content, and drought resistance in
tropical rain forest of the upper Rio Negro region. Biotropica 22, 51-64.
Medina, M., (1999). Caracterización molecular por RAPDs de cepas nativas de hongos
endomicorrícicos de suelos de una zona de minería en el Bajo Cauca Antioqueño. Tesis
Maestría de Microbiología, Universidad Nacional de Colombia, Bogotá.
Miyasaka, S.C., Habte, M., (2001). Plant mechanisms and mycorrhizal symbioses to increase
phosphorus uptake efficiency. Commun. Soil Sci. Plan. 32, 1101-1147.
Miyasaka, S.C., Habte, M., Friday, J.B., Johnson, E.V., (2003). Manual on arbuscular
mycorrhizal fungus production and inoculation techniques. Honolulu, HI: University of
Hawaii. (Soil and crop management No. 5).
Miyasaka, S.C., Habte, M., Matsuyama, D.T., (1993). Mycorrhizal dependency of two
Hawaiian endemic tree species: koa and mamane. J. Plant Nutr. 16, 1339-1356.
Mosse, B., (1981). Vesicular-arbuscular mycorrhiza research for tropical agriculture.
Honolulu, HI: University of Hawaii (Research Bulletin No. 194).
Murphy, J., Riley, J.P., (1962). A modified single solution method for the determination of
phosphate in natural waters. Anal. Chim. Acta 27, 31–36.
Musoko,M., Last, F.T., Mason, P.A., (1994). Populations of spores of vesicular-arbuscular
mycorrhizal fungi in undisturbed soils of secondary semideciduous moist tropical forest
in Cameroon. Forest Ecol. Manag. 63, 359-377.
Newsham, K.K., Fitter, A.H., Watkinson, A.R., (1994). Root pathogenic and arbuscular
mycorrhizal fungi determine fecundity of asymptomatic plants in the field. J. Ecol. 82,
805–814.
Nye, P.H., Tinker, P.B., (1977). Solute movement in the soil-root system. Oxford, UK:
Blackwell Scientific Publications.
Onguene, N.A., Kuyper, T.W., (2001). Micorrhizal association in the rain forest of south
Cameroon. Forest Ecol. Manag. 140, 227-287.
Osorio, N.W., (2012). Manejo de nutrientes en suelos del trópico. Medellín, Colombia:
Universidad Nacional de Colombia.
Osorio, N.W., Diez, M.C., Sierra, J., Paternina, L., (2008). Consideraciones ecológicas sobre
la asociación micorrizal en suelos de la región altoandina. In: J.D. León (Ed.) Ecología de
bosques andinos: experiencias de investigación (pp. 179-196). Medellín, Colombia:
Universidad Nacional de Colombia.
Pacovsky, R.S., (1986). Micronutrient uptake and distribution in mycorrhizal or phosphorus-
fertilized soybeans. Plant Soil 95, 379–388.
Parfitt, R.L., (1989). Phosphate reactions with natural allophane, ferrihydrite and goethite. J.
Soil Sci. 40, 359-369. Nova S
cienc
e Pub
lishe
rs, In
c.
Nelson W. Osorio and Juan D. León 152
Paternina, L., (2006). Effect of arbuscular mycorrhizal inoculation on soils with different
mycorrhizal symbiotic potentials by monitoring leucaena seedling growth and
phosphorus status. Thesis, Universidad Nacional de Colombia, Medellin.
Phillips, J.M., Hayman, D.S., (1970). Improved procedures for clearing and staining parasitic
and vesicular-arbuscular mycorrhizal fungi for rapid assessment of infection. T. Brit.
Mycol. Soc. 55, 158–161.
Picone, C., (2002). Diversity and abundance of arbuscular-mycorrhizal fungus spores in
tropical forest and pasture. Biotropica 32, 734-750.
Plenchette, C., Fortin, J.A., Furlan, V., (1983). Growth response off several plant species to
mycorrhiza in a soil of moderate P fertility I. Mycorrhizal dependency under field
conditions. Plant Soil 70, 191–209.
Pope, P.E., Chaney, W.R., Rhodes, J.D., Woodhead, S.H., (1983). The mycorrhizal
dependency of four hardwood tree species. Can. J. Bot. 61, 412–417.
Porter, W., (1979). The “Most Probable Number” method for ennumerating infective
propagules of vesicular arbuscular micorrizal fungi in soil. Aust. J. Soil Res. 17, 515-519.
Pypers, P., Delrue, J., Diels, J., Smolders, E., Merckx, R., (2006). Phosphorus intensity
determines short term P uptake by pigeon pea (Cajanus cajan L.) grown in soils with
different P buffering capacity. Plant Soil 284, 217-227.
Radersma, S., Grierson, P., (2004). Phosphorus mobilization in agroforestry: organic anions,
phosphatase activity and phosphorus fractions in the rhizophere. Plant Soil 259, 209-219.
Read, D.J., (1991). Mycorrhizas in ecosystems. Experientia 47, 376-391.
Ren, H., Yu, Z., (2008). Biomass changes of an Acacia mangium plantation in southern
China. J. Trop. For. Sci. 20, 105-110.
Rilling, M.C., Wright, S.F., Nichols, K.A., Schmidt, W.F., Torn, M.S., (2001). Large
contribution of arbuscular mycorrhizal fungi to soil carbon pools in tropical forest soils.
Plant Soil 233, 167-177.
Sanchez, P., (1976). Properties and Management of Soils in the Tropics. New York, NY:
John Wiley and Sons.
Sanchez, P., Logan, T., (1992). Myths and Science about the chemistry and fertility of soils in
the tropics. In: R. Lal and P. Sanchez (Eds.), Myths and Science of Soils of the Tropics
(pp. 35-46). Madison, WI: Soil Sci. Soc. Am.
Sanchez, P., Uehara, G., (1980). Management considerations for acid soils with high
phosphorus fixation capacity. In: F.E. Khasawneh (Ed.), The Role of Phosphorus in
Agriculture (pp. 471-514). Madison, WI: Soil Sci. Soc. Am.
Schachtman, D.P., Reid, R., Ayling, S.M., (1998). Phosphorus uptake by plants: from soil to
cell. Plant Physiol. 116, 447-453.
Schübler, A., Schwarzott, D., Walker, C., (2001). A new fungal phylum, the Glomeromycota:
phylogeny and evolution. Mycol. Res. 105, 1413-1421.
Sharpley, A.N., Smith, S.J., Jones, O.R., Berg, W.A., Coleman, G.A., (1992). The transport
of bioavailable phosphorus in agricultural run-off. J. Environ. Qual. 21, 30–35.
Shoji, S., Nanzyo, M., Dahlgren, R.A., (1993). Volcanic ash soils-genesis, properties, and
utilization. Amsterdam, Netherlands: Elsevier Publishing.
Sierra, J.A., (2006). Micorrhizal dependency of some forestry trees and mycorrhizal
effectiveness in highland-soils from Eastern Antioquia. Thesis M.Sc., Universidad
Nacional de Colombia, Medellin. Nova S
cienc
e Pub
lishe
rs, In
c.
Roles of Arbuscular Mycorrhizal Association in Plant Nutrition … 153
Sierra, J.A., Castro, D., Osorio, N.W., (2009). Mycorrhizal dependency of laurel. Rev.
Colomb. For. 12, 17-24.
Sierra, J.A., Castro, D., Osorio, W., (2012). Mycorrhizal dependence of barcino (Clusiaceae:
Calophyllum brasiliense Cambess). Actualidades Biológicas 34, 199-206.
Sieverding, E., (1991). Vesicular-arbuscular mycorrhiza management in tropical
agroecosystems. Eschborn, Germany: Deutsche Gesellschaft Technische Zusammenabeit
(GTZ).
Siqueira, J.O., Saggin-Júnior, O.J., (2001). Dependency on arbuscular mycorrhizal fungi and
responsiveness of some Brazilian native woody species. Mycorrhiza 11, 245–255.
Smeck, N.E., (1985). Phosphorus dynamics in soils and landscapes. Geoderma 36, 185-199.
Smith, F.W., (2002). The phosphate uptake mechanism. Plant Soil, 245:105-114.
Smith, F.W., Mudge, S.R., Rae, A.L., Glassop, D., (2003). Phosphate transport in plants.
Plant Soil 248, 71-83.
Smith, F.W., VandenBerg, P.J., Gonzalez, A., Andrew, C.S., Pieters, W.H.J., (1992). Foliar
symptoms of nutrient disorders in the tropical shrub legume Leucaena leucocephala. St.
Lucia, Queensland, Australia: CSIRO, Division of tropical crops and pastures (Technical
paper No.32).
Smith, S.E., Read, D.J., (1997). Mycorrhizal symbiosis. San Diego, CA: Academic Press.
Soedarjo, M., Habte, M., (1995). Mycorrhizal and nonmycorrhizal host growth in response to
changes in pH and P concentration in a manganiferous Oxisol. Mycorrhiza 5, 337–345.
Stahl, P.D., Williams, S.E., Christensesn, M., (1988). Efficacy of native vesicular-arbuscular
mycorrhizal fungi after severe soil disturbance. New Phytol. 110, 347–354.
Stevenson, F.J., (1986). Cycles of soil. New York, NY: John Wiley and Sons.
Swift, M.J., Heal, O.W., Anderson, J.M., (1979). Decomposition in terrestrial ecosystems.
Oxford, UK: Blackwell scientific publications.
Sylvia, D.M., (1999). Mycorrhizal symbiosis. In: D.M. Sylvia, J. Furhrmann, P. Hartel and D.
Zuberer (Eds.), Principles and applications of soil microbiology (pp. 408–426). Upper
Saddle River, NJ: Prentice Hall.
Taylor, D.L., (2000). A new dawn: the ecological genetics of mycorrhizal fungi. New Phytol.
147, 236-239.
Tinker, P.B., Gildon, A., (1983). Mycorrhizal fungi and ion uptake. In: D.A. Rob and W.S.
Pierpoint (Eds.), Metals and micronutrients, uptake and utilization by plants (pp. 21–32).
London, UK: Academic Press.
Trappe, J.T., (1987). Phylogenetic and ecologic aspects of mycotrophy in the angiosperms
from an evolutionary stand-point. In: G.R. Safir (Ed.), Ecophysiology of VA mycorrhizal
plants (pp. 5-25). Boca Raton, Florida: CRC Press.
Trotta, A., Varese, G.C., Gnavi, E., Fusconi, A., Sampo, S., Berta, G., (1996). Interaction
between the soil-borne root pathogen Phytophthora nicotianae var. parasitica and the
arbuscular mycorrhizal fungus Glomus mosseae in tomato plants. Plant Soil 185, 199–
209.
Turner, B.L., Frossard, E., Oberson, A., (2006). Enhancing phosphorus availability in low-
fertility soils. In: N. Uphoff (Ed.) Biological approaches to sustainable soil systems (pp.
191-206). Boca Raton, FL: CRC Press.
Uphoff, N., Ball, A.S., Fernandes, E.C.M., Herren, H., Husson, O., Palm, C., Pretty, J.,
Sanginga, N., Thies, J. E., (2006). Understanding the functioning and management of soil Nova S
cienc
e Pub
lishe
rs, In
c.
Nelson W. Osorio and Juan D. León 154
systems. In: N. Uphoff (Ed.), Biological approaches to sustainable soil systems (pp. 3-
13). Boca Raton, FL: CRC Press.
Van Der Heijden, M.G., Klironomos, J.N., Ursic, M., Mouroglis, P., Strettwolf-Engel, R.,
Boller, T., Wiemken, A., Sanders, I.R., (1998). Mycorrhizal fangal diversity determines
plant biodiversity, ecosystem variability, and productivity. Nature 396, 69-72.
Vitousek, P.M., Sanford, R.L., (1986). Nutrient cycling in moist tropical forest. Annu. Rev.
Ecol. Syst. 17, 137-167.
Wilson, J., Ingleby, K., Mason, P.A., Ibrahim, K., Lawson, G.J., (1992). Long-term changes
in vesicular-arbuscular mycorrhizal spore populations in Terminalia plantations in Cote
d‟Ivore. In: D.J. Read, D.H. Lewis, A.H. Fitter and I.J. Alexander (Eds.), Mycorrhizas in
ecosystems (pp. 268-275). Wallingford, UK: CAB International.
Wright, S.F., Upadhyaya, A., (1996). Extraction of an abundant and unusual protein from soil
and comparsion of hyphal protein of arbuscular mycorrhizal fungi. Soil Sci. 161, 575–
586.
Wright, S.F., Upadhyaya, A., (1998). A survey of soils for aggregate stability and glomalin, a
glycoprotein produced by hyphae of arbuscular mycorrhizal fungi. Plant Soil 198, 97–
107.
Nova S
cienc
e Pub
lishe
rs, In
c.
In: Plantations ISBN: 978-1-60876-576-8
Editor: Ren Hai © 2013 Nova Science Publishers, Inc.
Chapter 9
ALLUVIAL GOLD-MINING DEGRADED
SOILS RECLAMATION USING ACACIA MANGIUM
PLANTATIONS: AN EVALUATION
FROM BIOGEOCHEMISTRY
Juan D. León,1 Jeiner Castellanos,
1 Maria Casamitjana,
2
Nelson W. Osorio1 and Juan C. Loaiza
1,3,
1Universidad Nacional de Colombia, Departmento de Ciencias
Forestales y Departamento de Biociencias, Columbia 2Universitat de Girona, Geosciencies Department, Girona, Spain
3Centre Tecnologic Forestal de Catalunya, Solsona, Spain
ABSTRACT
A study was carried out to evaluate the use of Acacia mangium plantations in
reactivating biogeochemical cycles of soil nutrients in a soil degraded by alluvial gold-
mining. Fine litterfall production was 10.4 Mg ha-1
yr-1
and it was dominated by the leaf
fraction 5.7 Mg ha-1
(55%). The highest nutrient return found corresponded to nitrogen
(N) (69 kg ha-1
) and the lowest to phosphorus (P) (0.5 kg ha-1
).
The results of a litter-bag study indicated that the annual decomposition constant (k)
ranged from 1.25 to 1.80. Chemical composition of the leaf litter (e.g., N and P
concentrations, C/N and N/P ratios, and phenols content) and rainfall play an important
role in the decay process, which was characterized by a slow release of N, Ca, and Mg
from the leaf litter, while P was immobilized. The C return to soil from the
decomposition of the leaf litterfall oscillated between 2.0 and 2.4 Mg ha-1
, which was
lower than expected, likely because the mesh size of the litter bags restricted our
observation only for the leaf fraction. The A. mangium plantations showed a great
potential in the reclamation of these degraded soils due to the high values of fine litter
production and nutrient return, which contributed to the reactivation of biogeochemical
cycles.
Corresponding autor: Juan C. Loaiza. Universidad Nacional de Colombia, Departmento de Biociencias, Calle 59A
No. 63-20, Office 14-208, 050034, Medellín, Colombia. E-mail: [email protected]. Nova S
cienc
e Pub
lishe
rs, In
c.

Juan D. León, Jeiner Castellanos, Maria Casamitjana et al. 156
Therefore, the soil under this plantation showed significant increases in chemical and
physical properties respect to unplanted soil: nitrogen content (0.24 vs. 0.5%), available P
(2.48 vs. 6.53 mg kg-1
), cation exchange capacity (6.12 vs. 11.19 cmolc kg-1
), organic
matter content (6.14 vs. 18.66%, and aggregate stability (73.0 vs. 85.35%). A. mangium
plantations have a high potential to remediate soils degraded by alluvial gold-mining.
Keywords: Soil bioremediation, biogeochemical fluxes, soil physics, Acacia mangium, soil
degradation
INTRODUCTION
In tropical forests the fine litterfall production is the main process that determines the
potential return of organic matter and nutrients onto the soil, which support plant
development and soil biota (Proctor 1983, Spain 1984, Vitousek and Sanford 1986,
Landsberg and Gower 1997; Norgrove and Hauser 2000, Kumar and Agrawal 2001).
However, nutrient recycling is achieved when the leaf litterfall is decomposed by soil biota, a
key process in forestry systems that determines soil fertility and forest primary productivity
(Wang et al. 2008). If the nutrients are quickly released, they could be lost by leaching or
volatilization (Palma et al. 1998, Schlesinger 2000). If the decomposition occurs slowly, the
nutrient supply to plant roots will be insufficient, thus limiting plant growth and development
(Jordan 1985, Swift and Anderson 1989, and Bubb et al. 1998, Montagnini and Jordan 2002).
For these reasons, the rates at which litter decomposition and subsequent nutrient release
occur constitute key factors of the ecosystem functioning.
In the case of degraded lands by superficial mining activities, the lost of plant coverage
on the soil surface disrupt these biogeochemical cycles (León et al. 2008). Land reclamation
of these soils may be achieved by establishing forestry species, which must chosen based on
their ability to adapt to extreme and restrictive soil conditions. Several studies have
demonstrated that forestry plantations play an important role in the improvement of soil
fertility, due to their capacity to induce ecological and physicochemical changes in the soil
(Lugo et al. 1990, Parrota 1992, Lugo 1997, Garten 2002, Singh et al. 2002).
Species of the Acacia genus such as A. albida, A. Senegal and A. mangium are commonly
employed for forestry and land reclamation in the tropics (Laclau et al. 2000). A. mangium
grows quickly and has a high capacity to adapt to nutrient-poor acidic soils, due to its
capacity to establish symbiotic associations with N2 fixing bacteria (Ribet and Drevon 1996,
Higa and Higa 2000, Garay et al. 2004) and mychorrizal fungi (Lim 1988, Duponnois and Ba
1999). In extremely nutrient-poor soil A. mangium has exhibited an outstanding growth rate
higher than other plant species such as Eucalyptus sp. and Gmelina arborea.
In Colombia, at the beginning of the 1990s, A. mangium was succesfully introduced in
the Bajo Cauca Antioqueño region (Departments of Cordoba and Antioquia, Colombia) for
forestry use and land restoration (Torres and del Valle 2007, León et al. 2008). Although,
several plantations were established and currently they cover more than 700 ha, little is
known about the functioning of these restored ecosystems.
The main purpose of this chapter was to evaluate the nutrient dynamics in the fine
litterfall and its decomposition in established A. mangium plantations in soils degraded by
alluvial mining. Nova S
cienc
e Pub
lishe
rs, In
c.
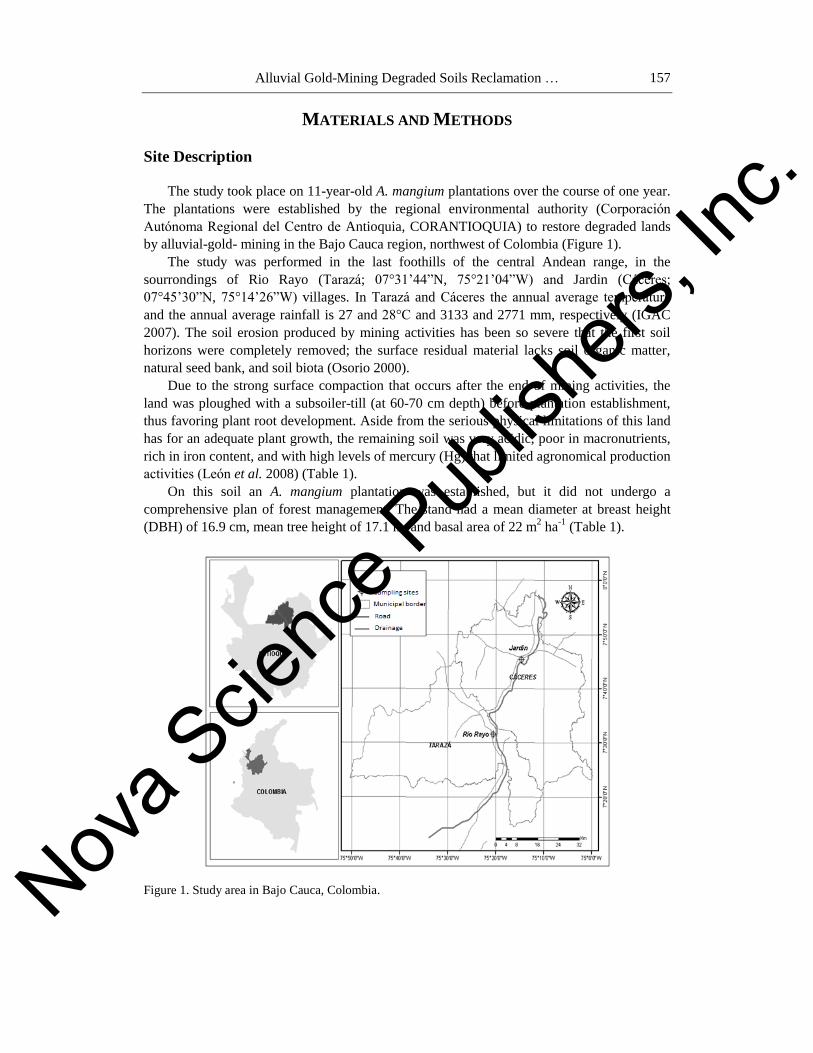
Alluvial Gold-Mining Degraded Soils Reclamation … 157
MATERIALS AND METHODS
Site Description
The study took place on 11-year-old A. mangium plantations over the course of one year.
The plantations were established by the regional environmental authority (Corporación
Autónoma Regional del Centro de Antioquia, CORANTIOQUIA) to restore degraded lands
by alluvial-gold- mining in the Bajo Cauca region, northwest of Colombia (Figure 1).
The study was performed in the last foothills of the central Andean range, in the
sourrondings of Rio Rayo (Tarazá; 07þ31‟44”N, 75þ21‟04”W) and Jardin (Cáceres;
07þ45‟30”N, 75þ14‟26”W) villages. In Tarazá and Cáceres the annual average temperature
and the annual average rainfall is 27 and 28þC and 3133 and 2771 mm, respectively (IGAC
2007). The soil erosion produced by mining activities has been so severe that the first soil
horizons were completely removed; the surface residual material lacks soil organic matter,
natural seed bank, and soil biota (Osorio 2000).
Due to the strong surface compaction that occurs after the end of mining activities, the
land was ploughed with a subsoiler-till (at 60-70 cm depth) before plantation establishment,
thus favoring plant root development. Aside from the serious physical limitations of this land
has for an adequate plant growth, the remaining soil was very acidic, poor in macronutrients,
rich in iron content, and with high levels of mercury (Hg) that limited agronomical production
activities (León et al. 2008) (Table 1).
On this soil an A. mangium plantation was established, but it did not undergo a
comprehensive plan of forest management. The stand had a mean diameter at breast height
(DBH) of 16.9 cm, mean tree height of 17.1 m, and basal area of 22 m2 ha
-1 (Table 1).
Figure 1. Study area in Bajo Cauca, Colombia. Nova S
cienc
e Pub
lishe
rs, In
c.
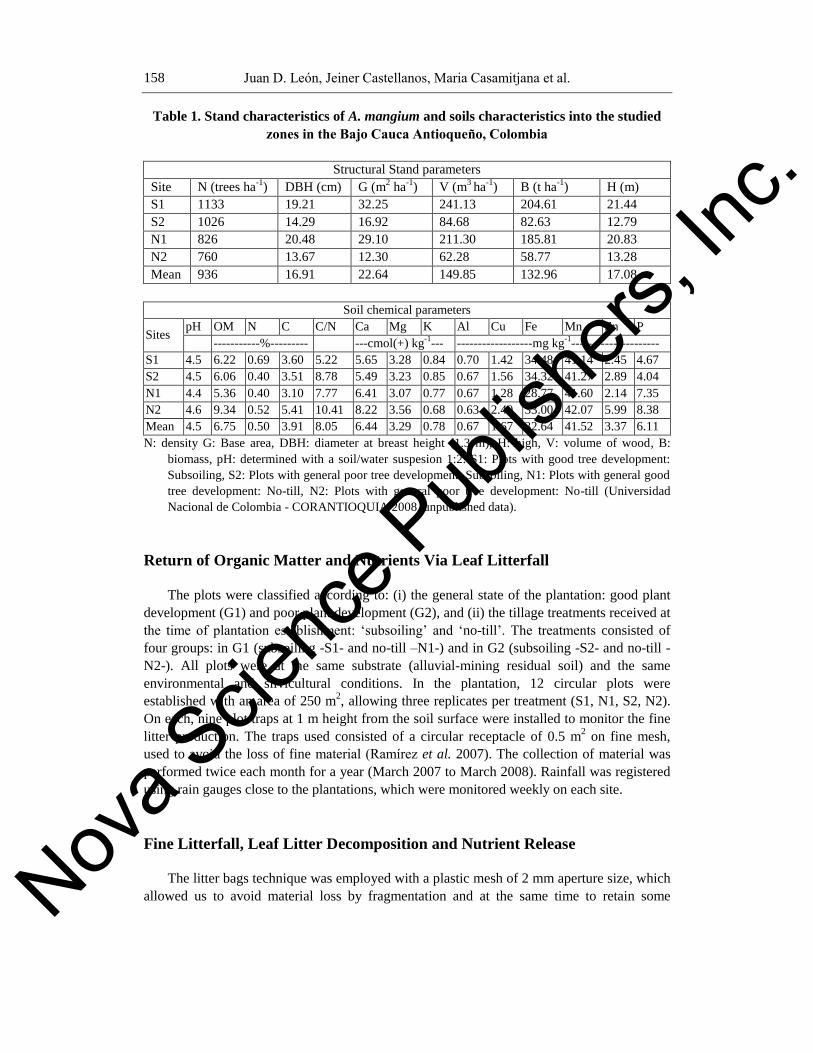
Juan D. León, Jeiner Castellanos, Maria Casamitjana et al. 158
Table 1. Stand characteristics of A. mangium and soils characteristics into the studied
zones in the Bajo Cauca Antioqueño, Colombia
Structural Stand parameters
Site N (trees ha-1
) DBH (cm) G (m2 ha
-1) V (m
3 ha
-1) B (t ha
-1) H (m)
S1 1133 19.21 32.25 241.13 204.61 21.44
S2 1026 14.29 16.92 84.68 82.63 12.79
N1 826 20.48 29.10 211.30 185.81 20.83
N2 760 13.67 12.30 62.28 58.77 13.28
Mean 936 16.91 22.64 149.85 132.96 17.08
Soil chemical parameters
Sites pH OM N C C/N Ca Mg K Al Cu Fe Mn Zn P
-----------%--------- ---cmol(+) kg-1
--- ------------------mg kg-1
---------------------
S1 4.5 6.22 0.69 3.60 5.22 5.65 3.28 0.84 0.70 1.42 34.48 41.14 2.45 4.67
S2 4.5 6.06 0.40 3.51 8.78 5.49 3.23 0.85 0.67 1.56 34.32 41.27 2.89 4.04
N1 4.4 5.36 0.40 3.10 7.77 6.41 3.07 0.77 0.67 1.28 28.77 41.60 2.14 7.35
N2 4.6 9.34 0.52 5.41 10.41 8.22 3.56 0.68 0.63 2.40 33.00 42.07 5.99 8.38
Mean 4.5 6.75 0.50 3.91 8.05 6.44 3.29 0.78 0.67 1.67 32.64 41.52 3.37 6.11
N: density G: Base area, DBH: diameter at breast height (1.3 m), H: high, V: volume of wood, B:
biomass, pH: determined with a soil/water suspesion 1:2. S1: Plots with good tree development:
Subsoiling, S2: Plots with general poor tree development: Subsoiling, N1: Plots with general good
tree development: No-till, N2: Plots with general poor tree development: No-till (Universidad
Nacional de Colombia - CORANTIOQUIA 2008, unpublished data).
Return of Organic Matter and Nutrients Via Leaf Litterfall
The plots were classified according to: (i) the general state of the plantation: good plant
development (G1) and poor plant development (G2), and (ii) the tillage treatments received at
the time of plantation establishment: „subsoiling‟ and „no-till‟. The treatments consisted of
four groups: in G1 (subsoiling -S1- and no-till –N1-) and in G2 (subsoiling -S2- and no-till -
N2-). All plots were at the same substrate (alluvial-mining residual soil) and the same
environmental and silvicultural conditions. In the plantation, 12 circular plots were
established with an area of 250 m2, allowing three replicates per treatment (S1, N1, S2, N2).
On each, nine plot traps at 1 m height from the soil surface were installed to monitor the fine
litter production. The traps used consisted of a circular receptacle of 0.5 m2 on fine mesh,
used to avoid the loss of fine material (Ramírez et al. 2007). The collection of material was
performed twice each month for a year (March 2007 to March 2008). Rainfall was registered
using rain gauges close to the plantations, which were monitored weekly on each site.
Fine Litterfall, Leaf Litter Decomposition and Nutrient Release
The litter bags technique was employed with a plastic mesh of 2 mm aperture size, which
allowed us to avoid material loss by fragmentation and at the same time to retain some Nova S
cienc
e Pub
lishe
rs, In
c.
Alluvial Gold-Mining Degraded Soils Reclamation … 159
important undecomposed materials (Wieder and Lang 1982, Sundarapandian and Swamy
1999). On each study site, 18 bags (20 x 20 cm size) containing 10 g of oven-dried leaf litter
were distributed in three groups, with six bags per tree (a total of 54 sample bags). To
evaluate the first factor (subsoiling), different sites were established with the same climatic
conditions, but different soil pre-treatments (JS: Jardin subsoiling; JNS: Jardin no-till). To
evaluate the impact of rainfall, the study was divided into sites with different pluviometric
registers (RS: Río Rayo subsoiling; JS: Jardín subsoiling).
Each month, three bags were removed, with a total of nine bags per sampling. The bags
were opened and the litter materials were air dried, brushed gently to remove soil particles,
oven-dried at 65ºC, and weighed. The residual dry matter (RDM) was estimated at each
sampling date.
Soil Sampling
The soil samples were taken at a 20 cm depth on each study site in order to analyze some
soil physical and chemical properties. Subsamples were taken in a zig-zag pattern, making a
diametric trajectory in a northerly direction (Osorio and Casatmijana 2011). Samples of
undisturbed soil were taken as well, in order to analyze aggregate stability. Six sites were
selected as control plots where A. mangium was unplanted and without interventions. The
samples were conserved hermetically and cooled at 5ºC in the field until they were processed
in the laboratory of biogeochemistry of the Universidad Nacional de Colombia at Medellin.
Laboratory Analysis
The collected material was separated into several components: leaves of A. mangium (L),
leaves of other species (OL), woody fraction (W), reproductive material (RM), and other rests
(OR). The litter bag material was extracted and cleaned manually to eliminate roots,
invertebrates, and soil. Subsequently, the material was dried at 65ºC until reaching constant
weight.The leaves were milled and heated to 600ºC for elemental analysis (Ca, Mg and K
content per dry dissolution and atomic absorption spectrophotometry); leaf P content was
determined using acid dissolution and visible spectrophotometry; N content by micro-
Kjeldahl (Benton et al. 1991); C content was determined by dry combustion by means of an
analyzer LECO CNS-2000; lignin content was determined by acid detergent and KMnO4
(Horwitz 2003, Tejada 1992). Phenols were extracted by means of methanol over the course
of five days, and were analyzed with the colorimetric Folin-Ciocalteu assay (Singleton and
Rossi 1965). Results were expressed as mg of Gallic acid per 100 g of extract.
Soil samples were air dried and sieved (≤ 2 mm). Soil pH was measured in a soil: water
suspension (1:2 ratio) with a pH electrode (Beckman 601). Labile soil P was determined
according to the method of Kalra and Maynard (1991) using spectrophotometry (Baush and
Lamb Milton Roy 601) at 660-nm wavelength. Exchangeable Ca, Mg, and K were extracted
with neutral 1 M ammonium acetate and measured with atomic absorption spectrophotometry.
Total N was measured using the micro-Kjeldahl method.
Additionally, the mean weight diameter (MWD) of soil aggregates and the soil aggregate
stability (AE) were determined by the Yoder method. Nova S
cienc
e Pub
lishe
rs, In
c.

Juan D. León, Jeiner Castellanos, Maria Casamitjana et al. 160
Data Analysis
Nutrient return per treatment was calculated based on fine litter production values and
elemental concentrations. The residual amount of nutrients at each sampling was calculated as
the product of the RDM and the elemental concentration, and then divided by 100. The
residual dry matter (RDM) evolution or remaining dry matter in the litter bags and the
nutrient release dynamics were compared among sites through a one-way ANOVA, checking
the statistical normality and the data homocedasticity beforehand.
When the treatment had significant effects, the mean separation was made using the
Tukey test (P≤0.05).
To determine the association between RDM and other factors such as total rainfall,
subsoil treatment, and substrate quality, Pearson correlation coefficients were obtained
(P≤0.05). To describe RDM evolution, the negative exponential simple model (nonlinear),
was adjusted according to Equation 1 (Olson 1963).
Xt / Xo = e-kt
(1)
where, Xt: dry weight of the remaining material at time t (g), Xo: initial dry weight (g), k:
decomposition constant, t: time spent (days).
From this constant, we calculated the mean life or necessary time to reach leaf litter
decomposition of 50% (t0.5) and 99% (t 0.99): t0.5= -0.693/k and t0.99= -4.605/k (Olson 1963,
Arunachalam and Singh 2002).
The indicators used to choose the model were: the determination coefficient (R2), the
Durbin-Watson statistic, and the sum of squares of error. The Mann-Whitney test was used
between two groups (P≤0.05) to check the soil parameter values between unplanted plots
(control) and plantations (Wilcoxon). The statistical analysis was performed with Statgraphics
Centurion XV (StatPoint Technologies, Inc).
RESULTS
Fine Litter Production
Annual fine litterfall was 10350 kg ha-1
yr-1
, the monthly amount lessening during the
rainy months. Among treatments the greatest values were represented by S1 and N1. Fine
litterfall was dominated by leaf fraction (5543 kg ha-1
yr-1
) and reproductive materials (2462
kg ha-1
yr-1
). The values registered in OR and OL fractions were 577.7 and 153.3 kg ha-1
yr-1
,
respectively. The annual fine litter production did not show significant differences among
treatments (P=0.21) (Figure 2).
On the other hand, significant correlations (P≤0.05) between total rainfall and fine
litterfall were not detected in any treatment. The variation coefficients were quite low in all
the fractions under all treatments, with the exception of the OL fraction (Table 2).
Nova S
cienc
e Pub
lishe
rs, In
c.
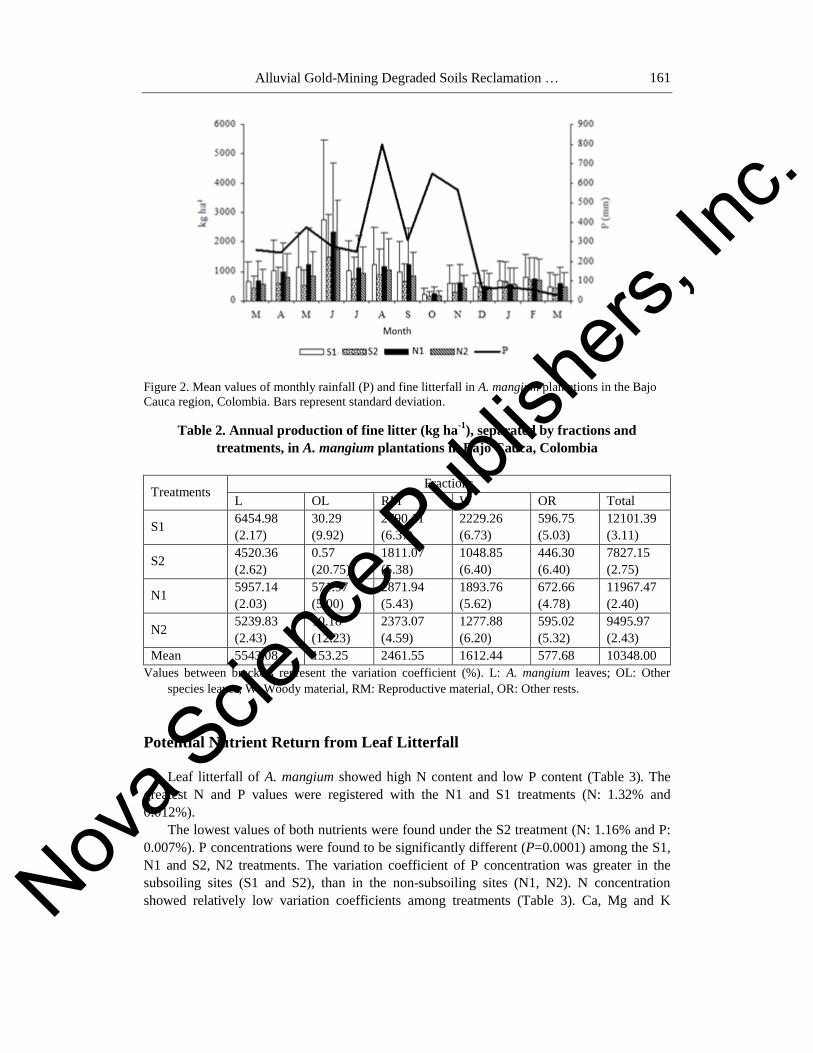
Alluvial Gold-Mining Degraded Soils Reclamation … 161
Figure 2. Mean values of monthly rainfall (P) and fine litterfall in A. mangium plantations in the Bajo
Cauca region, Colombia. Bars represent standard deviation.
Table 2. Annual production of fine litter (kg ha-1
), separated by fractions and
treatments, in A. mangium plantations in Bajo Cauca, Colombia
Treatments Fractions
L OL RM W OR Total
S1 6454.98
(2.17)
30.29
(9.92)
2790.11
(6.37)
2229.26
(6.73)
596.75
(5.03)
12101.39
(3.11)
S2 4520.36
(2.62)
0.57
(20.75)
1811.07
(5.38)
1048.85
(6.40)
446.30
(6.40)
7827.15
(2.75)
N1 5957.14
(2.03)
571.97
(5.00)
2871.94
(5.43)
1893.76
(5.62)
672.66
(4.78)
11967.47
(2.40)
N2 5239.83
(2.43)
10.18
(12.23)
2373.07
(4.59)
1277.88
(6.20)
595.02
(5.32)
9495.97
(2.43)
Mean 5543.08 153.25 2461.55 1612.44 577.68 10348.00
Values between brackets represent the variation coefficient (%). L: A. mangium leaves; OL: Other
species leaves, W: Woody material, RM: Reproductive material, OR: Other rests.
Potential Nutrient Return from Leaf Litterfall
Leaf litterfall of A. mangium showed high N content and low P content (Table 3). The
greatest N and P values were registered with the N1 and S1 treatments (N: 1.32% and
0.012%).
The lowest values of both nutrients were found under the S2 treatment (N: 1.16% and P:
0.007%). P concentrations were found to be significantly different (P=0.0001) among the S1,
N1 and S2, N2 treatments. The variation coefficient of P concentration was greater in the
subsoiling sites (S1 and S2), than in the non-subsoiling sites (N1, N2). N concentration
showed relatively low variation coefficients among treatments (Table 3). Ca, Mg and K Nova S
cienc
e Pub
lishe
rs, In
c.

Juan D. León, Jeiner Castellanos, Maria Casamitjana et al. 162
concentrations decreased considerably beginning in September and increased gradually until
February; this trend was due to the transition between rainy periods and drier periods (Figure
3). N and P concentrations showed consistent trends under all treatments; however, some
peaks in concentration were observed in N during September, coinciding with a decrease in
rain (Figure 2).
P concentration peaked during June and September, months which also corresponded to a
drier weather; the increase was most evident under the S1 treatment. The highest potential
nutrient return via leaf litterfall were observed with N (69.1 kg ha-1
yr-1
) and Ca (30.0 kg ha-1
yr-1
), and the lowest with P (0.6 kg ha-1
yr-1
).
Non-significant differences in nutrient return among treatments were observed in the
following nutrients: N, Ca, Mg and K. In contrast, significant differences were observed in P
return among the S2, S1 and N1 treatments.
Table 3. Mean values of leaf nutrient concentration (%± SD) and annual nutrient return
via leaf litterfall (kg ha-1
yr-1
± SD) in A. mangium plantations in Bajo Cauca region
(Colombia)
Nutrient concentration (%)
Treatments ---------P-------- --------N--------- -------Ca------ -------Mg------- --------K--------
S1 0.012±0.005 b
(40.86)
1.245±0.148ab
(11.86)
0.511±0.152a
(29.68)
0.131±0.031a
(23.54)
0.147±0.054a
(36.78)
S2 0.007±0.002a
(23.35)
1.158±0.095a
(8.22)
0.493±0.152a
(30.83)
0.118±0.027a
(23.01)
0.141±0.075a
(53.10)
N1 0.011±0.002b
(16.95)
1.316±0.131b
(9.94)
0.489±0.138a
(28.23)
0.123±0.030a
(24.40)
0.203±0.075a
(36.85)
N2 0.009±0.001a
(16.82)
1.249±0.121ab
(9.72)
0.525±0.167a
(31.78)
0.121±0.026a
(21.36)
0.164±0.059a
(35.89)
Mean 0.010 1.242 0.505 0.123 0.164
Nutrient return (kg ha-1
yr-1
)
Treatments --------P--------- ---------N------- --------Ca----- -------Mg----- ---------K-------
S1 0.8±0.036ac
(4.76)
80.5±2.790a
(3.46)
35.1±1.623a
(4.62)
8.9±0.360a
(4.06)
9.9±0.418a
(4.21)
S2 0.3±0.012b
(3.82)
52.2±1.576a
(3.02)
23.9±1.121a
(4.69)
5.6±0.213a
(3.81)
7.0±0.411a
(5.89)
N1 0.7±0.025acd
(3.80)
78.0±2.416a
(3.09)
31.4±1.486a
(4.74)
7.7±0.319a
(4.16)
12.8±0.548a
(4.29)
N2 0.5±0.015bd
(3.32)
65.8±2.031a
(3.08)
29.7±1.444a
(4.86)
6.6±0.244a
(3.72)
9.3±0.421a
(4.51)
Mean 0.5 69.1 30.0 7.2 9.7
Variance coefficient (%) shown in brackets. SD: Standard deviation. For each nutrient, means followed
with different letters are significantly different (P≤0.05). S1: Plots with generally high tree
development: Subsoiling, S2: Plots with generally low tree development: Subsoiling, N1: Plots
with generally high tree development: No-till, N2: Plots with generally low tree development: No-
till.
Nova S
cienc
e Pub
lishe
rs, In
c.
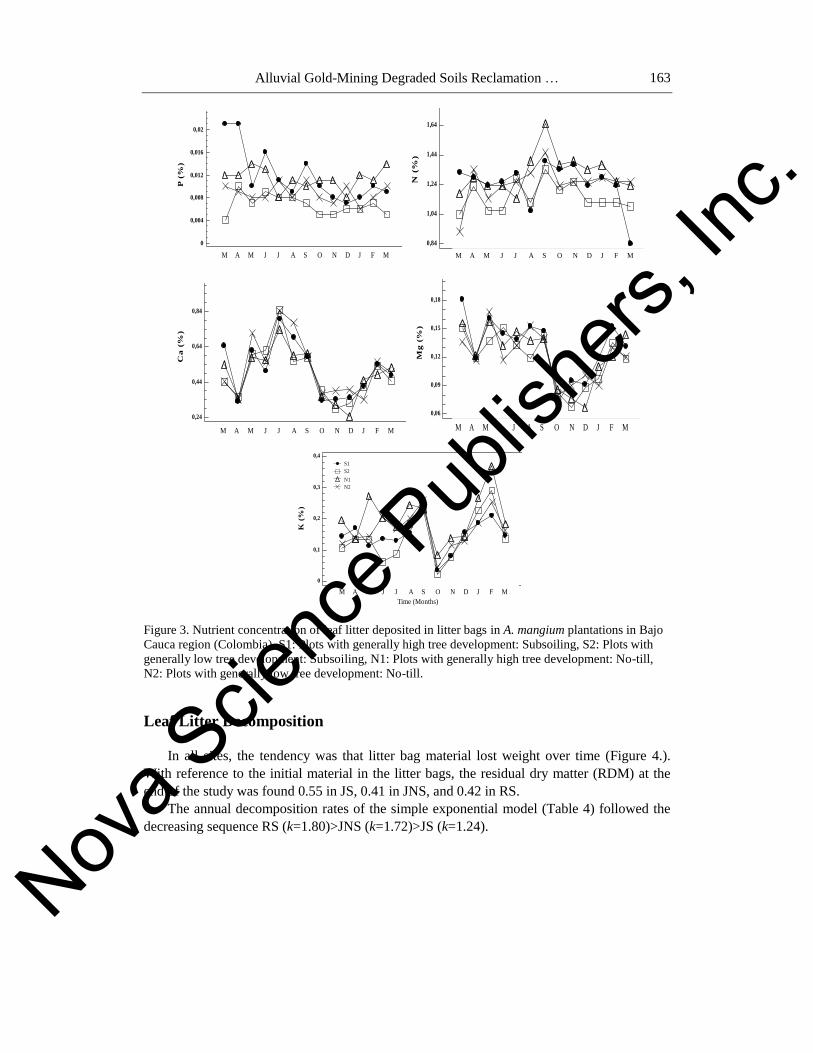
Alluvial Gold-Mining Degraded Soils Reclamation … 163
Figure 3. Nutrient concentration of leaf litter deposited in litter bags in A. mangium plantations in Bajo
Cauca region (Colombia). S1: Plots with generally high tree development: Subsoiling, S2: Plots with
generally low tree development: Subsoiling, N1: Plots with generally high tree development: No-till,
N2: Plots with generally low tree development: No-till.
Leaf Litter Decomposition
In all sites, the tendency was that litter bag material lost weight over time (Figure 4.).
With reference to the initial material in the litter bags, the residual dry matter (RDM) at the
end of the study was found 0.55 in JS, 0.41 in JNS, and 0.42 in RS.
The annual decomposition rates of the simple exponential model (Table 4) followed the
decreasing sequence RS (k=1.80)>JNS (k=1.72)>JS (k=1.24).
SA
SB
NA
NB
P (
%)
Interaction Plot
Meses
0
0,004
0,008
0,012
0,016
0,02
0,024
M A M J J A S O N D E F M M A M J J A S O N D J F M
N (
%)
Meses
SA
SB
NA
NB
Interaction Plot
0,84
1,04
1,24
1,44
1,64
1,84
M A M J J A S O N D E F MM A M J J A S O N D J F M
Ca
(%
)
Interaction Plot
Meses
0,24
0,44
0,64
0,84
1,04
M A M J J A S O N D E F M
SA
SB
NA
NB
M A M J J A S O N D J F M
Time (Months)
Mg
(%
)
SA
SB
NA
NB
Meses
Interaction Plot
0,06
0,09
0,12
0,15
0,18
0,21
M A M J J A S O N D E F MM A M J J A S O N D J F M
K (
%)
Meses
SA
SB
NA
NB
Interaction Plot
0
0,1
0,2
0,3
0,4
M A M J J A S O N D E F MM A M J J A S O N D J F M
Time (Months)
K (
%)
Meses
SA
SB
NA
NB
Interaction Plot
0
0,1
0,2
0,3
0,4
M A M J J A S O N D E F M
S1
S2
N1
N2
Nova S
cienc
e Pub
lishe
rs, In
c.
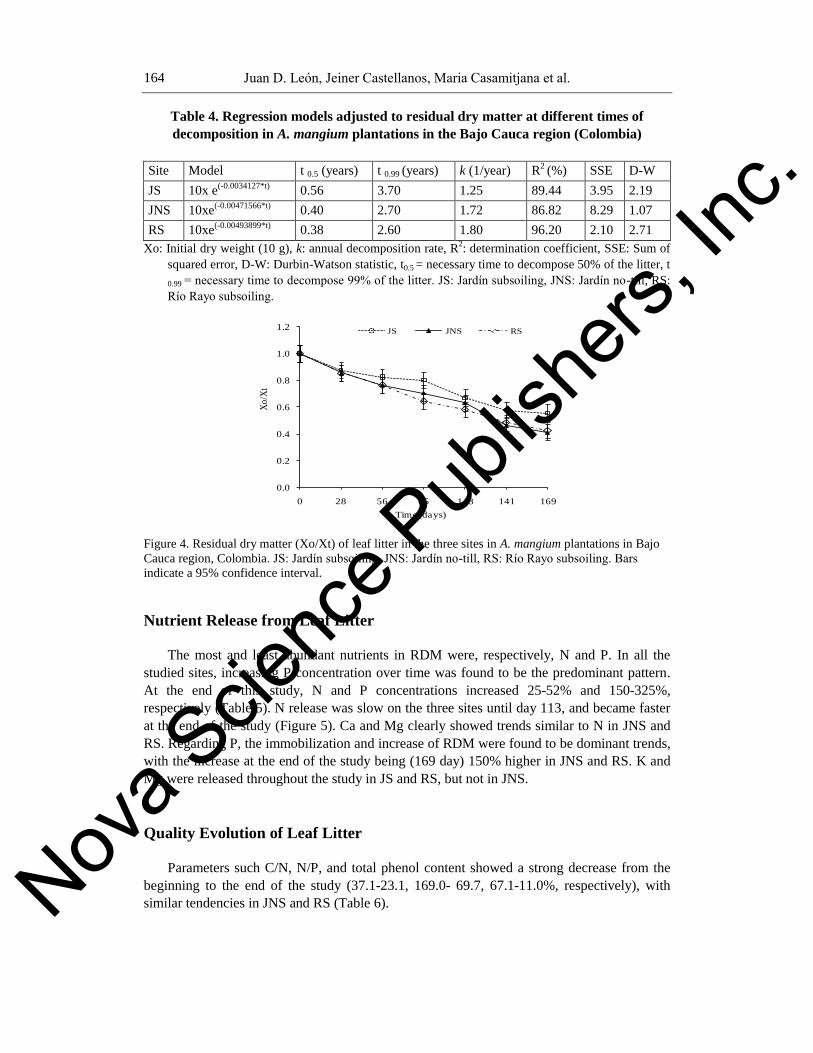
Juan D. León, Jeiner Castellanos, Maria Casamitjana et al. 164
Table 4. Regression models adjusted to residual dry matter at different times of
decomposition in A. mangium plantations in the Bajo Cauca region (Colombia)
Site Model t 0.5 (years) t 0.99 (years) k (1/year) R2 (%) SSE D-W
JS 10x e(-0.0034127*t)
0.56 3.70 1.25 89.44 3.95 2.19
JNS 10xe(-0.00471566*t)
0.40 2.70 1.72 86.82 8.29 1.07
RS 10xe(-0.00493899*t)
0.38 2.60 1.80 96.20 2.10 2.71
Xo: Initial dry weight (10 g), k: annual decomposition rate, R2: determination coefficient, SSE: Sum of
squared error, D-W: Durbin-Watson statistic, t0.5 = necessary time to decompose 50% of the litter, t
0.99 = necessary time to decompose 99% of the litter. JS: Jardín subsoiling, JNS: Jardín no-till, RS:
Río Rayo subsoiling.
Figure 4. Residual dry matter (Xo/Xt) of leaf litter in the three sites in A. mangium plantations in Bajo
Cauca region, Colombia. JS: Jardín subsoiling, JNS: Jardín no-till, RS: Río Rayo subsoiling. Bars
indicate a 95% confidence interval.
Nutrient Release from Leaf Litter
The most and least abundant nutrients in RDM were, respectively, N and P. In all the
studied sites, increasing P concentration over time was found to be the predominant pattern.
At the end of this study, N and P concentrations increased 25-52% and 150-325%,
respectively (Table 5). N release was slow on the three sites until day 113, and became faster
at the end of the study (Figure 5). Ca and Mg clearly showed trends similar to N in JNS and
RS. Regarding P, the immobilization and increase of RDM were found to be dominant trends,
with the increase at the end of the study being (169 day) 150% higher in JNS and RS. K and
Mg were released throughout the study in JS and RS, but not in JNS.
Quality Evolution of Leaf Litter
Parameters such C/N, N/P, and total phenol content showed a strong decrease from the
beginning to the end of the study (37.1-23.1, 169.0- 69.7, 67.1-11.0%, respectively), with
similar tendencies in JNS and RS (Table 6).
0.0
0.2
0.4
0.6
0.8
1.0
1.2
0 28 56 85 113 141 169
Xo
/Xt
Time (days)
JS JNS RS
Nova S
cienc
e Pub
lishe
rs, In
c.
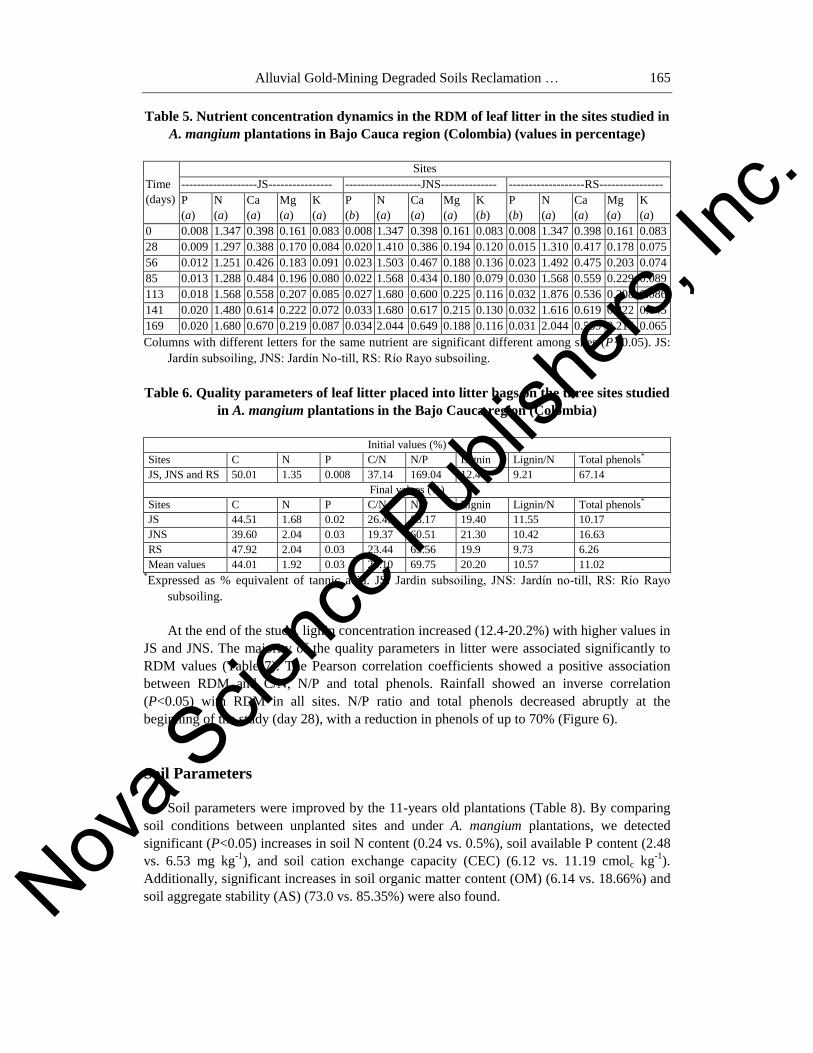
Alluvial Gold-Mining Degraded Soils Reclamation … 165
Table 5. Nutrient concentration dynamics in the RDM of leaf litter in the sites studied in
A. mangium plantations in Bajo Cauca region (Colombia) (values in percentage)
Time
(days)
Sites
-------------------JS---------------- -------------------JNS-------------- -------------------RS----------------
P
(a)
N
(a)
Ca
(a)
Mg
(a)
K
(a)
P
(b)
N
(a)
Ca
(a)
Mg
(a)
K
(b)
P
(b)
N
(a)
Ca
(a)
Mg
(a)
K
(a)
0 0.008 1.347 0.398 0.161 0.083 0.008 1.347 0.398 0.161 0.083 0.008 1.347 0.398 0.161 0.083
28 0.009 1.297 0.388 0.170 0.084 0.020 1.410 0.386 0.194 0.120 0.015 1.310 0.417 0.178 0.075
56 0.012 1.251 0.426 0.183 0.091 0.023 1.503 0.467 0.188 0.136 0.023 1.492 0.475 0.203 0.074
85 0.013 1.288 0.484 0.196 0.080 0.022 1.568 0.434 0.180 0.079 0.030 1.568 0.559 0.229 0.089
113 0.018 1.568 0.558 0.207 0.085 0.027 1.680 0.600 0.225 0.116 0.032 1.876 0.536 0.208 0.086
141 0.020 1.480 0.614 0.222 0.072 0.033 1.680 0.617 0.215 0.130 0.032 1.616 0.619 0.222 0.045
169 0.020 1.680 0.670 0.219 0.087 0.034 2.044 0.649 0.188 0.116 0.031 2.044 0.559 0.214 0.065
Columns with different letters for the same nutrient are significant different among sites (P<0.05). JS:
Jardín subsoiling, JNS: Jardín No-till, RS: Río Rayo subsoiling.
Table 6. Quality parameters of leaf litter placed into litter bags on the three sites studied
in A. mangium plantations in the Bajo Cauca region (Colombia)
Initial values (%)
Sites C N P C/N N/P Lignin Lignin/N Total phenols*
JS, JNS and RS 50.01 1.35 0.008 37.14 169.04 12.40 9.21 67.14
Final values (%)
Sites C N P C/N N/P Lignin Lignin/N Total phenols*
JS 44.51 1.68 0.02 26.49 83.17 19.40 11.55 10.17
JNS 39.60 2.04 0.03 19.37 60.51 21.30 10.42 16.63
RS 47.92 2.04 0.03 23.44 65.56 19.9 9.73 6.26
Mean values 44.01 1.92 0.03 23.10 69.75 20.20 10.57 11.02 *Expressed as % equivalent of tannic acid. JS: Jardin subsoiling, JNS: Jardín no-till, RS: Río Rayo
subsoiling.
At the end of the study, lignin concentration increased (12.4-20.2%) with higher values in
JS and JNS. The majority of the quality parameters in litter were associated significantly to
RDM values (Table 7). The Pearson correlation coefficients showed a positive association
between RDM and C/N, N/P and total phenols. Rainfall showed an inverse correlation
(P<0.05) with RDM in all sites. N/P ratio and total phenols decreased abruptly at the
beginning of the study (day 28), with a reduction in phenols of up to 70% (Figure 6).
Soil Parameters
Soil parameters were improved by the 11-years old plantations (Table 8). By comparing
soil conditions between unplanted sites and under A. mangium plantations, we detected
significant (P<0.05) increases in soil N content (0.24 vs. 0.5%), soil available P content (2.48
vs. 6.53 mg kg-1
), and soil cation exchange capacity (CEC) (6.12 vs. 11.19 cmolc kg-1
).
Additionally, significant increases in soil organic matter content (OM) (6.14 vs. 18.66%) and
soil aggregate stability (AS) (73.0 vs. 85.35%) were also found. Nova S
cienc
e Pub
lishe
rs, In
c.

Juan D. León, Jeiner Castellanos, Maria Casamitjana et al. 166
Table 7. Pearson correlation coefficients between RDM, rainfall and quality parameters
of the leaf litter in the three sites studied on the A. mangium plantations in the Bajo
Cauca region (Colombia)
Parameters JS JNS RS
N -0.76 -0.87 -0.83
P -0.94 -0.93 -0.93
C/N 0.81 0.91 0.89
N/P 0.86 0.72 0.78
Lignin -0.74 -0.89 -0.78
Lignin/N -0.24* -0.38
* 0.04
*
Total phenols 0.71 0.64 0.74
Total rainfall -0.70 -0.75 -0.46 *No significant (P>0.05). JS: Jardín subsoiling, JNS: Jardín no-till, RS: Río Rayo subsoiling.
Table 8. Mean values of the soil parameters of the plots located in the stands and outside
the stands (unplanted plots) of A. mangium plantations in the Bajo Cauca region,
Colombia. (Standard deviation is shown in brackets)
Parameters Sites
Plantation (n=12) Unplanted (Control) (n=6)
pHa (1:1) 4.50 (0.18) 5.39 (0.53)
OMa (%) 18.66 (7.60) 6.14 (0.67)
ASa (%) 85.35 (7.49) 73.00 (12.78)
MWDb (mm) 2.85 (0.64) 2.12 (0.78)
Na (%) 0.50 (0.17) 0.24 (0.05)
Pa (mg kg-1) 6.53 (3.57) 2.48 (0.23)
CECa (cmolc kg-1) 11.19 (2.64) 6.12 (0.35)
OM: Organic matter content, AS: Aggregate stability, MWD: mean weight diameter of soil aggregates,
N: nitrogen, P: phosphorous, CEC: Cation Exchange Capacity. a and b denote the existence and
inexistence, respectively, of significant differences (Mann-Whitney, P<0.05).
0.0
0.5
1.0
1.5
2.0
2.5
0 28 56 85 113 141 169
Resi
du
al-
N (
g/g
)
0.0
0.5
1.0
1.5
2.0
2.5
0 28 56 85 113 141 169
Resi
du
al-
P (
g/g
)
Nova S
cienc
e Pub
lishe
rs, In
c.
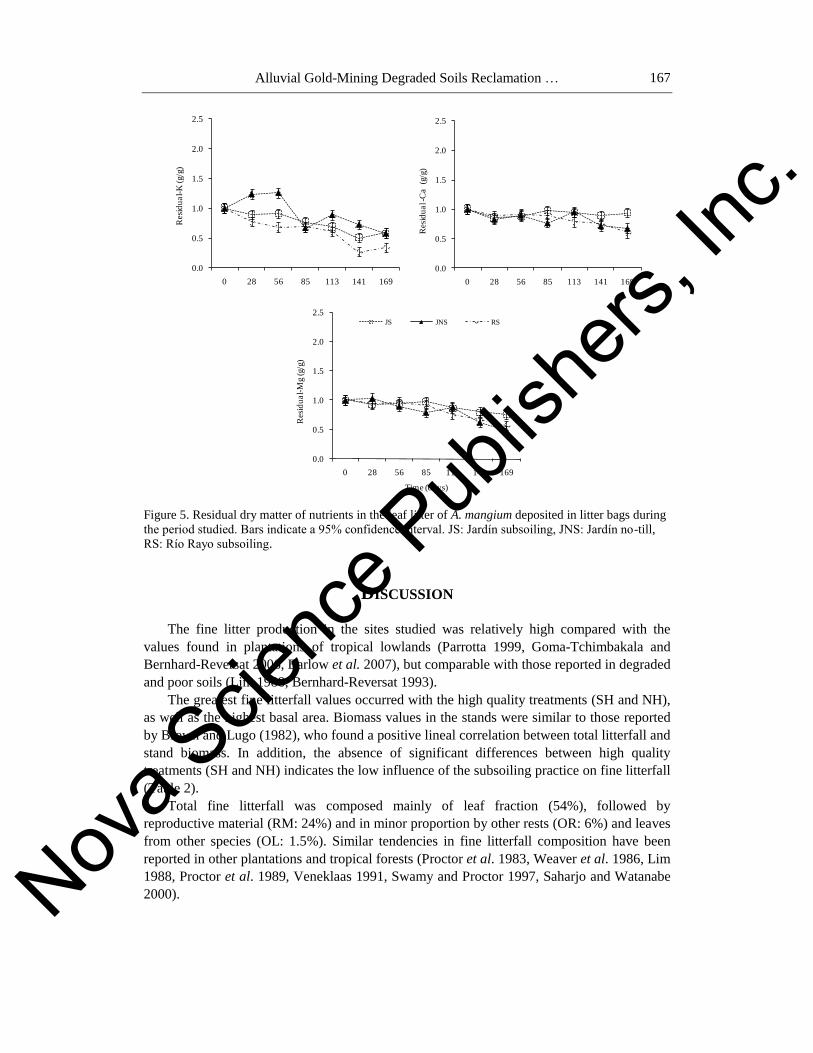
Alluvial Gold-Mining Degraded Soils Reclamation … 167
Figure 5. Residual dry matter of nutrients in the leaf litter of A. mangium deposited in litter bags during
the period studied. Bars indicate a 95% confidence interval. JS: Jardín subsoiling, JNS: Jardín no-till,
RS: Río Rayo subsoiling.
DISCUSSION
The fine litter production in the sites studied was relatively high compared with the
values found in plantations of tropical lowlands (Parrotta 1999, Goma-Tchimbakala and
Bernhard-Reversat 2006, Barlow et al. 2007), but comparable with those reported in degraded
and poor soils (Lim 1988, Bernhard-Reversat 1993).
The greatest fine litterfall values occurred with the high quality treatments (SH and NH),
as well as the highest basal area. Biomass values in the stands were similar to those reported
by Brown and Lugo (1982), who found a positive lineal correlation between total litterfall and
stand biomass. In addition, the absence of significant differences between high quality
treatments (SH and NH) indicates the low influence of the subsoiling practice on fine litterfall
(Table 2).
Total fine litterfall was composed mainly of leaf fraction (54%), followed by
reproductive material (RM: 24%) and in minor proportion by other rests (OR: 6%) and leaves
from other species (OL: 1.5%). Similar tendencies in fine litterfall composition have been
reported in other plantations and tropical forests (Proctor et al. 1983, Weaver et al. 1986, Lim
1988, Proctor et al. 1989, Veneklaas 1991, Swamy and Proctor 1997, Saharjo and Watanabe
2000).
0.0
0.5
1.0
1.5
2.0
2.5
0 28 56 85 113 141 169
Resi
du
al-
K (
g/g
)
0.0
0.5
1.0
1.5
2.0
2.5
0 28 56 85 113 141 169
Resi
du
al -
Ca
(g
/g)
0.0
0.5
1.0
1.5
2.0
2.5
0 28 56 85 113 141 169
Resi
du
al-
Mg (
g/g
)
Time (days)
JS JNS RS
Nova S
cienc
e Pub
lishe
rs, In
c.

Juan D. León, Jeiner Castellanos, Maria Casamitjana et al. 168
Figure 6. Evolution of RDM quality parameters in the three A. mangium plantation sites in the Bajo
Cauca region (Colombia) during the period studied. JS: Jardín subsoiling, JNS: Jardín no-till, RS: Río
Rayo subsoiling. Bars indicate a 95% confidence interval.
However, although a high fine litter production was registered during the drier periods
(March-June 2007), rainfall did not significantly correlate to litterfall in any treatment. Since
rain water was available along the year, even in the driest months, likely other factors
determined fine litter production (soil conditions or stand structure) in these plantations (Mall
et al. 1991).
The high leaf litter N concentration reflects the ability A. mangium to form symbiosis
with N2 fixing bacterica, particularly in a soil with low contents of N at the time of the
plantation establishment. N concentrations in leaf litterfall coincided with the values reported
in forests and plantations in tropical lowlands. However, our values were low compared to
those reported by Seneviratne et al. (1998) and Ngoran et al. (2006) in young and mature A.
mangium plantations in India and Africa, respectively. In general, leaf concentrations of P, K
and Mg were lower than the reported values in forests and plantations in tropical lowlands.
This situation could reflect a low nutrient demand by the species and/or low soil nutrient
availability. In particular, low leaf concentrations of P represent a major limiting factor in
nutrient cycling and plant nutrition.
According to Aerts (1997) the critical value of the N/P ratio in leaf litterfall is 11.9, in
this study it was considerably higher (N/P= 124), which indicates a serious deficit in P. This
0
40
80
120
160
200
0 29 57 86 114 141 169
N/P
ra
tio
0
10
20
30
40
50
0 29 57 86 114 141 169
C/N
ra
tio
0.0
0.3
0.6
0.9
1.2
1.5
0 28 56 85 113 141 169
Resi
du
al l
ign
in
Time (days)
0.0
0.3
0.6
0.9
1.2
1.5
0 28 56 85 113 141 169
Resi
du
al p
hen
ols
Time (days)
JS JNS RS
Nova S
cienc
e Pub
lishe
rs, In
c.
Alluvial Gold-Mining Degraded Soils Reclamation … 169
confirms the experimental findings regarding the biological immobilization of this nutrient
and its retranslocation in the trees (Castellanos-Barliza and León 2010). The leaf P
concentration differed between the S1-N1 treatments and the S2-N2 treatments, indicating the
influence of plantation quality on plant P concentration.
Significant differences were observed in N leaf litter concentration between treatments
S1 and N1; however, neither the subsoiling influence nor the plantation quality influence was
completely clear (Table 3). K showed higher variability among treatments, likely as a result
of its high mobility this is easily removed from leaf organs by rainfall (Hagen-Thorn et al.
2006). N concentration had a minimum variability, which implies a higher stability and
suggests that its presence in the leaves fluctuated in a narrow rank during this study. Also, the
variability found in leaf litter P concentration was high. Leaf litter nutrient concentrations
were generally higher during the drier months, a time period that also corresponded to the
peak of fine litter production. The highest nutrient return was found with the high quality
treatments (S1 and N1). With respect to N, Ca, Mg and K returns, no significant differences
were found, but a correspondence between high quality treatments (S1 and N1) and high
values of these nutrient returns was evident. Nutrient return had low variability in all
treatments; N, Ca, and K returns corresponded to those reported in forests and plantations in
low tropical lands, in contrast with P and Mg returns, which presented lower values.
RDM evolution in the three sites showed a first stage in which the loss of weight was
higher until day 141. A higher weight loss in the first stages of the decomposition process was
also reported by Arellano et al. (2004) and Goma-Tchimbakala and Bernhard-Reversat
(2006). These losses were produced as a result of the splitting and use of labile compound in
litterfall by decomposers. The k values in these degraded soils were higher than the values
reported by McGrath et al. (2000) in Theobroma grandiflorum plantations in the Brazilian
Amazon (k=0.4). The mean life (t0.5) found here was similar to that reported by Singh et al.
(1999) in India with Dalbergia sissoo leaf litter (t0.5=0.41 years). The time needed for 99% of
the leaf litter to disappear (t0.99) was about 2.6-3.7 years, which is similar to the reports of Del
Valle (2003) in the Colombian Pacific flood forests, considered to be intermediate tropical
forests.
This first stage was followed by a second stage in which decomposition was slower,
likeley occasioned by the dominance of recalcitrant materials. In searching for a possible
association between rainfall and material weight loss in the litter bags, an inverse correlation
was found being this stronger in Jardin sites with lower rainfall regime (JS and JNS) (Table
7). However, this relatioship was not found in the ANOVA with previous subsoiling
treatments. This likely means that other factors such as: weather, chemical litter composition,
and microorganism activity influenced litter decomposition on these sites (Swift et al. 1989,
Aerts and Chapin 2000).
We found that litter quality indexes (lignin, phenols N, C, P content, C/N and C/P ratios)
were good predictors of litter decomposition as reported by several authors (Xuluc-Tolosa et
al. 2003, Ngoran et al. 2006, Martínez-Yerízar et al. 2007, Prause and Fernández 2007).
Organic substrate mineralization generally can be predicted from the N content and the C/N
ratio. For instance, when the N content are between 1.0 and 2.5% and the C/N ratio is < 25-
40, organic matter decomposition and N mineralization occur rapidly (Seneviratne et al.
1998, Torreta and Takeda 1999, Ngoran et al. 2006), particularly when the lignin contents are
low (Ribeiro et al. 2002). The values of these parameters in the leaf litter, led us to expect a
low decomposition rate and scarce N release (Bubb et al. 1998). Nova S
cienc
e Pub
lishe
rs, In
c.
Juan D. León, Jeiner Castellanos, Maria Casamitjana et al. 170
However, this relative rapid decomposition rate did occur. In other complementary
studies (León et al., 2008) found active soil functional groups that play an important role in
the biochemical cycle (N2 fixing bacteria in rhizobial nodules, phosphorous solubilizing
microorganisms, and mycorrhizal arbuscular fungi).
N and P concentration showed a strong inverse correlation with RDM (Table 7), which
denote their individual influence on decomposition. Leaf litter P concentration was lower than
in other tropical leguminous plants (Palm and Sánchez 1990), which probably indicates its
low circulation in the plant-soil systems due to (i) scarce availability in these mining-
degraded soils and (ii) a high mobility inside the plants.
On the other hand, lignin content in the litter bag materials was lower than that reported
in other tropical and subtropical plantations of A. mangium (Bernhard-Reversat and Schwartz
1997, Kadir et al. 2001). Although lignin content may regulate the decomposition rate
(Bernhard-Reversat 1993), this did not ocurr in our study. The negative correlation between
lignin and RDM suggests that a higher decomposition rate leads to higher lignin content,
which contrasts with the recalcitrant character of this compound; making the degradation of
organic matter more difficult to achieve (Meentemeyer 1978, Arunachalam and Singh 2002,
Prause and Fernández 2007). In fact, at the end of this study we detected an increase in
lignine concentration respect to intial values (Table 6). This suggests that recalcitrant
compounds increase over time. Despite of that, this apparently did not affect the leaf litter
weight loss in the litter bags (Figure 4).
Palm and Sánchez (1990) indicated that low soluble phenol concentration in a leaf litter
produced a faster decomposition than materials with high phenol values. The phenol content
found in this study was higher than that reported by Kadir et al. (2001) and Palm and Sánchez
(1990) in A. mangium and other tropical leguminous plants (Table 7). Decomposition rates
obtained on this study according to the simple exponential model corresponded to
intermediate values of the reported interval in tropical forest and plantations (k=0.1-4.8)
(Sundarapandian and Swamy 1999, Singh et al. 1999, Kurzatkowski et al. 2004). These
results could have important repercussions from the perspective of degraded land restoration,
since the decomposition rates found indicate that litterfall contribute in the process with high
levels of organic matter and nutrients, which in turn contributes to the reestablishment of the
soil physicochemical properties as well as biological activity (León et al. 2010).
RDM nutrient concentration showed a decreasing sequence: N>Ca>Mg>K>P, which is
coincident with previous reports regarding A. mangium plantations (Ngoran et al. 2006; Singh
et al. 2004). Among other factors, this situation may be found to be the result of atmospheric
depositions washed from the canopy on the soil surface, leaf washing, mycelial invasion, and
abundant microorganism presence in the topsoil. Nutrient release followed the decreasing
sequence K>N>Mg>Ca>P (Figure 5). Rapid release of K is widely reported due to its mobile
condition. For example, Villela and Proctor (2002) reported that in tropical forests in Pará
(Brasil), K loss of 70% was found in Ecclinusa guianensis leaves. Similar tendencies were
reported by Ngoran et al. (2006) in A. mangium, reaching a K loss over 80%.
Three phases were distinguished in N release: an initial slow phase (until day 113), a fast
phase (day 141) and a final phase dominated by immobilization (Figure 5). This N release
pattern was different than that found in other studies (Bubb et al. 1998) and suggests that N
release are regulated by site conditions, fundamentally by microbial activity and litterfall
quality (Gallardo-Lancho 2000). A slow N liberation possibly resulted from low soil microbe
levels. Nova S
cienc
e Pub
lishe
rs, In
c.
Alluvial Gold-Mining Degraded Soils Reclamation … 171
It is outstanding the increase in the soil organic matter, N, and P contents; as well as the
improvement in soil physical parameters. N concentration in the soil was quite high in the
plantations (with a mean of 0.5%), more than two times the values found on the unplanted
plots, likely as a result of symbiotic associations established by the species with bacteria
fixing atmospheric nitrogen. Undoubtedly, these changes in soil parameters, after 11-years,
support our hypothesis that A. mangium plantations help to remediate soil conditions in these
degraded lands.
The positive effect of the N content of leguminous species on soil has been highly
recognized (Pearson and Vitousek 2001). In the Acacia genus, there have been reports on A.
albida in arid soils in the Oriental Africa and Center-Sur Africa, where Acacia has often been
introduced as part of desertification control programs. There, Dunham (1991) encountered N
concentrations from 0.08% to 0.15% on sites outside the plantations, with all of these values
being inferior to the findings of this study. The species‟ capacity to establish symbiotic
relationships with bacteria-fixing atmospheric nitrogen offers edaphic N the independency to
grow and develop, reaching higher leaf concentrations with a mean value of 6.4% (León et al.
2010). P increased significantly in the soils in the plantations in front of the unplanted plots
(Table 8). Dunham (1991) found statistically significant increases in soil P under Acacia
albida plantations – as much as 60% higher than on unplanted plots. The limited availability
of P in the soil was reflected in its concentration in leaves, especially in the plantation‟s
mature leaves, which according to León et al. (2010) ranged between 0.036% and 0.047%.
Soil organic matter and aggregate stability were improved by the plantation‟s
development. This was likely produced as a result of (i) a better aggregate soil structure by
fine roots that occupy the top soil, and (ii) contributions of organic matter derived from fine
litter decomposition.
As a consequence of the later process, higher soil acidity can be developed as found in
the plantation soils, due probably to the fact that during the decomposition process organic
acids are liberated and acidic compounds are also produced by the roots (Marschner 1997).
CONCLUSION
The results of this study clearly show that A. mangium plantations have a great capacity
to reestablish the biogeochemical cycles in soils degraded by mining activities and to improve
soil physicochemical and biological parameters. The large amount of fine litterfall in these
plantations represented a potential source of organic matter and nutrients. Litter
decomposition was considered rapid and may be predicted at least partially from some litter
quality indexes and rainfall. The annual decomposition constant (k) ranged between 1.25 and
1.80, the C return onto the soil fluctuated between 2.0 and 2.4 Mg ha-1
. These return rates
measured were probably lower than the real values, due to the restrictive conditions imposed
by the litter bags and because only the leaf fraction of the fine litterfall was considered in this
estimate. The contributions of organic matter, carbon, and nutrient release from fine litter
decomposition substantially improved some soil properties (soil organic matter, N and P) by
2-3 times respect to unplanted sites. In general, effective release of Ca, Mg and K was
registered with similar patterns. P was the most restrictive element in the decomposition leaf
litter and plantation productivity. Nova S
cienc
e Pub
lishe
rs, In
c.

Juan D. León, Jeiner Castellanos, Maria Casamitjana et al. 172
The high contributions of organic matter and nutrients via fine litterfall and
decomposition indicate that even without forestry management practices, the biogeochemical
cycles could be reactivated and soil improved.
REFERENCES
Aerts, R., 1997. Climate, leaf litter chemistry and leaf litter decomposition in terrestrial
ecosystems: a triangular relationship. Oikos 7, 439-449.
Aerts, R. and Chapin, F. S., 2000. The mineral nutrition of wild plants revisited: a re-
evaluation of processes and patterns. Adv. Ecol. Res. 30, 1-67.
Arellano, R., Paolini, J., Vásquez, L., Mora, E., 2004. Producción y descomposición de
hojarasca en tres agroecosistemas de café en el estado de Trujillo, Venezuela. Rev.
Forest. Ven. 48, 7-14. (In Spanish).
Arunachalam, A. and Singh, N. D., 2002. Leaf litter decomposition of evergreen and
deciduous Dillenia species in humid tropics of north-east India. J. Trop. Forest Sci. 14,
105-115.
Barlow, J., Gardner, T. A., Ferreira, L. V., Peres, C. A., 2007. Litter fall and decomposition in
primary, secondary and plantation forests in the Brazilian Amazon. Forest Ecol. Manag.
247, 91-97.
Benton, J. J., Wolf, J. B., Mills, H. A., 1991. Plant Analysis Handbook: A Practical Sampling,
Preparation, Analysis and Interpretation Guide. Micro-Macro Publishing.
Bernhard-Reversat, F., 1993. Dynamics of litter and organic matter at the soil-litter interface
in fast-growing tree plantations on sandy ferrallitic soils (Congo). Acta Oecol. 14(2), 179-
195.
Bray, R. H. and Kurtz, L. T., 1945. Determination of total, organic, and available forms of
phosphorus in soil. Soil Sci. 59, 39-45.
Brown, S. and Lugo, A. E., 1982. The storage and production of organic matter in tropical
forests and their role in the global carbon cycle. Biotropica. 14, 161-187.
Bubb, K. A., Xu, Z. H., Simpson, J. A., Safigna, P. G., 1998. Some nutrient dynamics
associated with litterfall and litter decomposition in hoop pine plantations of southeast
Queensland, Australia. Forest Ecol. Manag. 110, 343-352.
Castellanos-Barliza, J. and León, J. D., 2010. Caída de hojarasca y dinámica de nutrientes en
plantaciones de Acacia mangium (Mimosaceae) de Antioquia, Colombia. Acta Biol.
Colomb. 15, 289-308. (In Spanish).
Del Valle, J. I., 2003. Cantidad, calidad y nutrientes reciclados por la hojarasca fina en
bosques pantanosos del Pacífico Sur Colombiano. Interciencia. 28, 443-449. (In
Spanish).
Dunham, K. M., 1991. Comparative effects of Acacia albida and Kigelia africana trees on soil
characteristics in Zambezi Riverine woodlands. J. Trop. Ecol. 7, 215-220.
Duponnois, A. and Ba, A. M., 1999. Growth stimulation of Acacia mangium Willd by
Pisolithus sp. in some Senegalese soils. Forest Ecol. Manag. 119, 209-215.
Ewel, J. J., 1976. Litter fall and leaf decomposition in a tropical forest succession in eastern
Guatemala. J. Ecol. 64, 293-308. Nova S
cienc
e Pub
lishe
rs, In
c.
Alluvial Gold-Mining Degraded Soils Reclamation … 173
Gallardo-Lancho, J. F., 2000. Biogeochemistry of Mediterranean forest ecosystems, a case
study. En: J. M. Bollag and G. Stotzky (eds). Soil Biochemistry 10, Marcel Dekker,
Nueva York. 423-60.
Garay, I., Pellens, R., Kindel, A., Barros, E., Franco, A., 2004. Evaluation of soil conditions
in fast-growing plantations of Eucalyptus grandis and Acacia mangium in Brazil: a
contribution to the study of sustainable land use. Applied Soil Ecology. 27, 177-187.
Garten, C., 2002. Soil carbon storage beneath recently established tree plantations in
Tennessee and South Carolina, US. Biomass and Bioenergy. 23, 93-102.
Goma-Tchimbakala, J. and Bernhard-Reversat, F. 2006. Comparison of litter dynamics in
three plantations of an indigenous timber-tree species (Terminalia superba) and a natural
tropical forest in Mayombe, Congo. Forest Ecol. Manag. 229, 304–313.
Hagen-thorn, A., Varnagiryte, I., Nihlgard, B., Armolaitis, K., 2006. Autumn nutrient
resorption and losses in four deciduous forest tree species. Forest Ecol. Manag. 228,33-
39.
Higa, A. R. and Higa, R. C. V., 2000. Indicações de espécies para o reflorestamento. In:
Galvão, A. P. M. (Org.), Reflorestamento de Propriedades Rurais para Fins Produtivos e
Ambientais. Um Guia para Ações Municipais e Regionais. Embrapa Comunicação para
Transferencia de Tecnologia e Embrapa Florestas, Brasilia, Colombo. 101–124.
Horwitz, W., 2003. Official methods of analysis of AOAC International. Association of
official analytical chemists. Arlington, VA, US.
IGAC., 2007. Estudio general de suelos y zonificación de tierras del Departamento de
Antioquia. Instituto Geografico Agustin Codazzi. Gobernación de Antioquia. (In
Spanish).
Jordan, C. F., 1985. Nutrient cycling in tropical forest ecosystems. Principles and their
application in management and conservation. John Wiley and Sons, Chichester.
Kadir, W. R., Cleemput, O. V., Zaharah, A. R., 2001. Microbial respiration and nitrogen
release patters of decomposing Acacia mangium leaf litter from Kemasul forest reserve,
Malaysa. J. Trop. Forest Sci. 13, 1-12.
Kalra, Y. and Maynard, D., 1991. Methods manual for forest soil and plant analysis.
Information Report NOR-X-319, Northern Forestry Centre, Alberta, Canadá, 113 p.
Kumar, R. and Agrawal, M. 2001. Litterfall, litter decomposition and nutrient release in five
exotic plant species planted on coal mine spoils. Pedobiologia. 45, 298-312.
Kurzatkowski, D., Martius, C., Höfer, H., Garcia, M., Förster, B., Beck, L., Vlek, P., 2004.
Litter decomposition, microbial biomass and activity of soil organisms in three
agroforestry sites in central Amazonia. Nutr. Cycling Agroecosyst. 69, 257-267.
Laclau, J. P., Bouillet, J. P., Ranger, J., 2000. Dynamics of biomass and nutrient
accumulation in a clonal plantation of Eucalyptus in Congo. Forest Ecol. Manag. 128,
181-196.
Landsberg, J. J. and Gower, S. T., 1997. Applications of physiological ecology to forest
management. New York: Academic Press.
León, J. D., Díez, M. C., Castellanos, J., Osorio, L. F., Marín, N., 2008. Grupos funcionales
de microorganismos en suelos degradados por minería de aluvión plantados con Acacia
mangium. Suelos Ecuat. 38, 75-80. (In Spanish).
León, J. D., Osorio, N. W., Castellanos, J., Osorio, L. F., 2010. Recuperación de suelos
degradados por minería aluvial de oro con plantaciones de Acacia en la región del Bajo
Cauca (Antioquia, Colombia). Suelos Ecuat. 40, 62-67. (In Spanish). (In Spanish). Nova S
cienc
e Pub
lishe
rs, In
c.
Juan D. León, Jeiner Castellanos, Maria Casamitjana et al. 174
Liao, J. H., Wang, H. H., Tsai, C. H., Hseu, Z. Y., 2006. Litter production, decomposition and
nutrient return of uplifted Coral Reef tropical forest. Forest Ecol. Manag. 235, 4-185.
Lim, M. T., 1988. Studies on Acacia mangium in Kemasul forest, Malaysia. I. Biomass and
productivity. J. Trop. Ecol. 4, 293-302.
Lugo, A., Cuevas, E., Sánchez, M., 1990. Nutrients and mass in litter and top soil of ten
tropical tree plantations. Plant Soil. 125, 263-280.
Lugo, A., 1997. The apparent paradox of reestablishing species richness on degraded lands
with tree monocultures. Forest Ecol. Manag. 99, 9-19.
Mall, L. P., Singh, V. P., Garge, A., 1991. Study of biomass, litter fall, litter decomposition
and soil respiration in monogeneric mangrove and mixed mangrove forest of
AndamanIsland. Trop. Ecol. 32, 144-152.
Marschner, H., 1997. Mineral nutrition of higher plants. Academic Press, San Diego,
California. 889 p.
Martínez-Yrízar, A., Nuñez, S., Búrquez, A., 2007. Leaf litter decomposition in a southern
sonoran desert ecosystem, northwestern México: Effects of habitat and litter quality. Acta
Oecol. 32, 291-300.
McGrath, A. D., Comerford, N. B., Duryea, M. L., 2000. Litter dynamics and monthly
fluctuations in soil phosphorus availability in an Amazonian agroforest. Forest Ecol.
Manag. 131, 167-181.
Meentemeyer, V., 1978. Macroclimate the lignin control of litter decomposition rates.
Ecology. 59, 465-472.
Montagnini, F. and Jordan, C. F., 2002. Reciclaje de nutrientes. En: M. R. Guariguata and G.
Kattan (eds). Ecología y conservación de bosques neotropicales. Cartago, Costa Rica.
167-191. (In Spanish).
Ngoran, A., Zakra N., Ballo, K., Kouamé, C., Zapata, F., Hofman, G., Van Cleemput, O.,
2006. Litter decomposition of Acacia auriculiformis Cunn. Ex Benth. and Acacia
mangium Willd. under coconut trees on quaternary sandy soils in Ivory Coast. Biol.
Fertil. Soils. 43, 102-106.
Norgrove, L. and Hauser, S., 2000. Production and nutrient content of earthworm casts in a
tropical agrisilvicultural system. Soil Biol. and Biochem. 32, 1651-1660.
Olson, J. S., 1963. Energy storage and the balance of producers and decomposers in
ecologycal systems. Ecology. 44, 322-331.
Osorio, N. W. and Casamitjana, M. 2011. Toma de muestras de suelos para evaluar la
fertilidad del suelo. Suelos Ecuatoriales 41, 23-28.
Osorio, P. I., 2000. Efecto de la Acacia mangium en algunas propiedades físicas y químicas
en suelos degradados por minería de aluvión en el Bajo Cauca Antioqueño. Trabajo de
grado en la Maestría de Bosques y Conservación Ambiental. Facultad de Ciencias
Agropecuarias, Universidad Nacional de Colombia, Medellín, 97 p. Msc Thesis. (In
Spanish).
Palm, C. A. and Sánchez, P. A., 1990. Decomposition and nutrient release patterns of the
leaves of three tropical legumes. Biotropica. 22, 330-338.
Palma, R. M., Prause, J., Fontanive, A. V., Jimenez, M. P., 1998. Litterfall and litter
decomposition in a forest of the Parque Chaqueño Argentino. Forest Ecol. Manag. 106,
205-210.
Parrota, J., 1992. The role of plantation forests in rehabiliting degraded ecosystems. Agric.
Ecosyst. Environ. 41, 115-133. Nova S
cienc
e Pub
lishe
rs, In
c.
Alluvial Gold-Mining Degraded Soils Reclamation … 175
Parrotta, J., 1999. Productivity, nutrient cycling, and succession in single and mixed species
plantations of Casuarina equisetifolia, Eucalyptus robusta, and Leucaena leucocephala in
Puerto Rico. Forest Ecol. Manag. 124: 45 -77.
Pearson, H. and Vitousek, P. 2001. Stand dynamics, nitrogen accumulation and symbiotic
nitrogen fixation in regenerating stands of Acacia koa. Ecol. Appl. 11, 1381-1394.
Prause, J. and Fernández, C., 2007. Litter decomposition and lignin/cellulose and lignin/total
nitrogen rates of leaves in four species of the Argentine Subtropical forest. Agrochimica.
51, 294-300.
Proctor, J., Phillips, C., Duff, G. K., Heaney, A., Robertson, F. M., 1989. Ecological studies
on Gunung Silam, a small ultrabasic mountain in Sabah, Malaysia. Some forest
processes. J. Ecol. 77, 317-331.
Proctor, J., 1983. Tropical forest litterfall. I. Problems of data comparison. En: Sutton, S. L.,
Whitmore, T. C. and Chadwick, A. C., editors. Tropical rain forest. Oxford, Blackwell
Scientific Publications. 267-273.
Ramírez, J. A., Zapata, C. M., León, J. D., González, M. I., 2007. Caída de hojarasca y
retorno de nutrientes en bosques montanos andinos de Piedras Blancas, Antioquia,
Colombia. Interciencia. 32 (5), 303-311. (In Spanish).
Ribeiro, C., Madeira, M., Araújo, M. C., 2002. Decomposition and nutrient release from leaf
litter of Eucalyptus globulus grown under different water and nutrient regimes. Forest
Ecol. Manag. 171, 31-41.
Ribet, J. and Drevon, J. J., 1996. The phosphorus requirement of N2 fixing and urea-fed
Acacia mangium. New Phytol. 132, 383–390.
Saharjo, B. H. and Watanabe, H., 2000. Estimation of litter fall and seed production of Acacia
mangium in a forest plantation in south Sumatra, Indonesia. Forest Ecol. Manag. 130,
265-268.
Schlesinger, W. H., 2000. Biogeoquímica: un análisis global. Ariel Ciencia. Barcelona. (In
Spanish).
Seneviratne, G., Van Holm, L. H. J., Kulasooriya, S. A., 1998. Quality of different mulch
materials and their decompositionand N release under low moisture regimes. Biol. and
Fertil. Soils. 26, 136-140.
Singh, G., Singh, B., Kuppusamy, V., Vala, N., 2002. Variations in foliage and soil nutrient
composition in Acacia tortilis plantations of different ages in North-Western Rajashtan.
Indian Forester. 128, 514-521.
Singh, K. P., Singh, P. K., Tripathi, S. K., 1999. Litterfall, litter decomposition and nutrient
release patterns in four native tree species raised on coal mine spoil at Singrauli, India.
Biol. and Fertil. Soils. 29, 371-378.
Singh, R., Kumar, R., Agrawal, M., 2004. Litter decomposition and nutrient release in
relation to atmospheric deposition of S and N in a dry tropical region. Pedobiologia. 48,
305-311.
Singleton, V. L., Rossi, J. A., 1965. Colorimetry of total phenolics with phosphomolybdic-
phosphotungstic acid reagents. Am. J. Enol. Vitic. 16, 144-158.
Spain, A. V., 1984. Litterfall and the standing crop of litter in three tropical Australian
rainforests. J. Ecol. 72, 947-961.
Sundarapandian, S. M. and Swamy, P. S., 1999. Litter production and leaf-litter
decomposition of selected tree species in a tropical forest at Kodayar in the western
Ghats, India. Forest Ecol. Manag. 123, 231-244. Nova S
cienc
e Pub
lishe
rs, In
c.

Juan D. León, Jeiner Castellanos, Maria Casamitjana et al. 176
Swamy, S. and Proctor, J., 1997. Fine litterfall and its nutrients in plantation of Acacia
auriculiformis, Eucalyptus tereticornis and Tectona grandis in the Chikmagalur district of
the western Ghats, India. J. Trop. Forest Sci. 10(1), 73-85.
Swift, M. J. and Anderson, J. M., 1989. Decomposition. In: H. Lieth and M. J. A. Werger
(eds). Tropical rain forest ecosystems: Biogeographical and ecological studies.
Ecosystems of the world 14A. Elsevier Science, Nueva York, Nueva Cork. 547-569.
Tejada, I., 1992. Control de calidad y análisis de alimentos para animales. Secretaría de
Educación Pública. Dirección General de Derechos de Autor. Número de registro 17222.
México D.F. (In Spanish)
Torres, D. A. and Del Valle, J. I., 2007. Growth and yield modelling of Acacia mangium in
Colombia. New Forest. 34, 293-305.
Torreta, N. K. and Takeda, H., 1999. Carbon and nitrogen dynamics of decomposing leaf
litter in a tropical hill evergreen forest. Eur. J. Soil Biol. 35, 57-63.
Veneklaas, E. J., 1991. Litterfall and nutrient fluxes in two montane tropical rain forests,
Colombia. J. Trop. Ecol. 7, 319-336.
Villela, D. M. and Proctor, J., 2002. Leaf litter decomposition and monodominance in the
Peltogyne forest of Maracá island, Brazil. Biotropica. 34, 334-347.
Vitousek, P. M., Sanford, R. L., 1986. Nutrient cycling in moist tropical forest. Annu. Rev.
Ecol. Syst. 17, 137-167.
Wang, Q., Wang, S., Huang, Y., 2008. Comparisons of litterfall, litter decomposition and
nutrient return in a monoculture Cunninghamia lanceolata and a mixed stand in southern
China. For. Ecol. Manage. 255, 1210-1218.
Weaver, P. L., Medina, E., Pool, D., Dugger, K., González-Liboy, J., Cuevas, E., 1986.
Ecological observations in the dwarf cloud forest of the Luquillo mountains in Puerto
Rico. Biotropica. 18, 79-85.
Wieder, R. K. and Lang, G. E., 1982. A critique of the analytical methods used in examining
decomposition data obtained from litter bags. Ecology. 63, 1636-1642.
Xuluc-Tolosa, F. J., Vestera, H. F. M., Ramírez-Marcial, N., Castellanos-Albores, J.,
Lawrence, D., 2003. Leaf litter decomposition of tree species in three successional phases
of tropical dry secondary forest in Campeche, México. Forest Ecol. Manag. 174, 401-
412.
Yoder, R., 1936. A direct method of aggregate analysis of soils and a study of the physical
nature of erosion losses. J. Amer. Soc. Agron. 28, 337-351.
Nova S
cienc
e Pub
lishe
rs, In
c.
In: Plantations ISBN: 978-1-60876-576-8
Editor: Ren Hai © 2013 Nova Science Publishers, Inc.
Chapter 10
EFFECTS OF INCORPORATING FURCRAEA SPECIES
BIOMASS INTO ACIDIC ANDISOLS
Adriana M. Quinchía Figueroa1*, Juliana Uribe Castrillón
1
and Carolina Mesa Muñoz1
1 Escuela de ingeniería de Antioquia (EIA).Unidad Académica Ing. Civil, Industrial y
Ambiental. Sede de Las Palmas, Antioquia, Colombia
ABSTRACT
Furcraea species are native to the Andes mountain region of Colombia and
Venezuela, and are known by the names hemp, sisal, stalk, cabuya, or maguey. These
species grow at any altitude, but they grow best between 1000 and 2000 meters above sea
level. Furcraea spp. are considered effective at rehabilitating poor-quality and eroded
soil, at retaining moisture in their fleshy leaves, thus requiring little water, and at
capturing CO2. However, the process of extracting the long fibers of Furcraea spp.
produces a high volume of biomass waste with high concentrations of saponins,
sapogenins, and steroids, substances that are toxic to some organisms. Therefore, it is
important to evaluate the specific effects of incorporating biomass waste into soils
according to the region where it is grown and processed. This chapter evaluates the
effects of incorporating Furcraea spp. biomass generated during the artisanal extraction
of long sisal fibers on the physical and microbiological properties and chemical
conditions of andisols. The biomass was analyzed for its composition, and significant
amounts of lignin and cellulose, both of which are important in the generation of labile
organic matter, were found. The experiment was conducted in separate reactors with
biomass mixtures and sisal soils in proportions ranging between 10% and 40% (w/w).
The tests showed that biomass generates a positive change in soil porosity, organic matter
levels, and cation exchange capacity (CEC), with mean increases of 40%, 6% and 10
CEC Cmol kg-1
, respectively.
Keywords: Furcraea spp., Biomass, Andisol, Soil properties, Native forest
* Corresponding Author. Escuela de Ingeniería de Antioquia (EIA).Calle 25 sur # 42 -73 Envigado – Antioquia –
Colombia. Email: [email protected]. Nova S
cienc
e Pub
lishe
rs, In
c.
Adriana M. Quinchía Figueroa, Juliana Uribe Castrillón and Carolina Mesa Muñoz 178
INTRODUCTION
Plants of the genus Furcraea originate from tropical regions of South and Central
America, with the Furcraea andina species originating in the Andean region of Colombia and
Venezuela. The plants have long been used by indigenous inhabitants as living fences, for the
production of alcoholic beverages, and as medicine (Aristizabal & Zapata, 1990). The genus
Furcraea includes nearly 20 species and belongs to the family Agavaceae, the calss
Monocotyledonae and the Angiosperm (Montoya & Tobón, 1979). These rugged plants can
adapt to many climates. They are found from 0 to 3000 meters above sea level and grow in
soils derived from volcanic ash, as well as gravelly and loose soils, although they prefer
porous and moderately acidic soils. Furcraea species have deep perennial root systems that
bind loose soils together, allowing them to fix atmospheric nitrogen and to assist in the
regeneration of eroded soils with low fertility (Bonilla et al., 2000, Jimenez, 1968). Furcraea
leaves are persistent, lanceolate, and generally ten times longer than they are wide, often with
entire margins serrated or festooned. When the leaves are developed, they are fleshy, with
parallel veins, and in their mature stage some species exhibit leaves that can measure up to
three meters in length and produce long, commercially attractive fibers (SDAFE, 2002)
(Figure 1).
Figure 1. Sisal cultivation in the Andean region of Colombia.
From the sisal leaf, known colloquially in Colombia as “fique”, a long, natural and
biodegradable fiber known locally as “cabuya” is extracted and used in the manufacture of
nets, ropes, bags, and facial tissues. Besides having a positive effect on mitigating soil
erosion, the plant retains soil moisture and fixes atmospheric CO2. In the plant biomass, the
stored carbon is transformed into substances such as lignin, cellulose, hemicellulose, protein,
and sugar. During the process of manufacturing products, a significant amount of biomass
waste is generated, including the approximately 96% of leaf biomass that is discarded after
defibration. This can generate environmental hazards (particularly for aquatic organisms) due
to the waste‟s high content of sapogenic substances, proteins, steroids, and toxic minerals
(MAVDT, 2006).
Biomass production and decomposition are two important processes that aid soils by
providing organic matter, regulating nutrient cycling, improving physical properties and
providing protection against the effects of climatic changes and land degradation (Singh et al.,
1999; Weltzin et al., 2005). Biomass quality and composition vary among species and Nova S
cienc
e Pub
lishe
rs, In
c.
Effects of Incorporating Furcraea Species Biomass into Acidic Andisols 179
locations depending on the soil‟s physio-chemical properties, climatic conditions, and
microbial activity in the soil (Polyakova and Billor, 2007; Wang et al., 2008). Differences in
these factors influence biomass pools. Forest ecosystems have been widely recognized as a
key factor in nutrient cycling in global terrestrial ecosystems (Meentemeyer, 1978; Vitousek,
1982; Van Vuuren et al., 1993; Vitousek et al., 1994; Aerts and De Caluwe, 1997; Aerts and
Chapin, 2000). In Colombia, large expanses of the Andean forest highlands have been
removed for agricultural land use (Etter et al., 2006), and forestry plantations have altered
both biodiversity and endemism in the region (Gentry & Dodson, 1987; Henderson et al.,
1991).
Some of the current problems of applied ecology include a lack of effectiveness and
environmental safety in the process of waste reduction and disposal, as well as the
environmental impact of the waste. In this regard, the “fique” crop‟s plantroot provides
physical environmental benefits that increase the soil‟s ability to retain the low-mobility
carbon present in the lignocellulosic material originating from the leaf biomass. Additionally,
the plantroot can improve the physical and chemical properties of these soils.
This study examines the effect of applying Furcraea Andina Trel biomass produced
during the manual extraction of natural fibers to acidic andisols. The biomass, as an important
source of fixed carbon originating from atmospheric CO2, was analyzed to determine its
chemical composition and cellulose, hemicellulose and lignin contents. Changes in physical,
chemical and biological properties in an andisol (source of the test) as a result of biomass
application were studied for a period of four months under controlled conditions.
METHODS
This study used an andisol located in the northern region of the Central Cordillera of the
Colombian Andes at 2230 meters above sea level (6º 22‟ 2019,75‟‟N – 75º 21‟ 38,91‟‟W).
The study took place in the municipalities of San Vicente and Barbosa in the Antioquia
department. The annual average temperature is 25þC and the annual average rainfall is 2800
mm (IGAC, 2007) (Figure 2). The soil of this region is characterized as acidic, and was
physically, chemically and biologically analyzed to determine its initial conditions. The
residual biomass resulting from fiber extraction was supplied by farmers from the same
region, and its chemical composition was analyzed as well. Physical, chemical,
microbiological, bromatolological and infrared analyses, as well as scanning electron
microscopy, were carried out in the laboratories of the National University of Colombia-
Medellín and the Engineering School of Antioquia (UN-EIA).
The experiment consisted of five tests that used superficial soil mixtures and fique
biomass in different proportions. The tests were based on a univariate experimental design
(analysis of variance). Four samples consisting of fique biomass proportions of 10, 20, 30 and
40%, were analyzed. The tests, which were carried out over the course of four months,
assessed changes in the soil properties. The average temperature throughout the test was 27 ±
2þC. For each sample, a control corresponding to the soil was used with no addition of fique
bagasse. All tests were performed in triplicate.
Nova S
cienc
e Pub
lishe
rs, In
c.
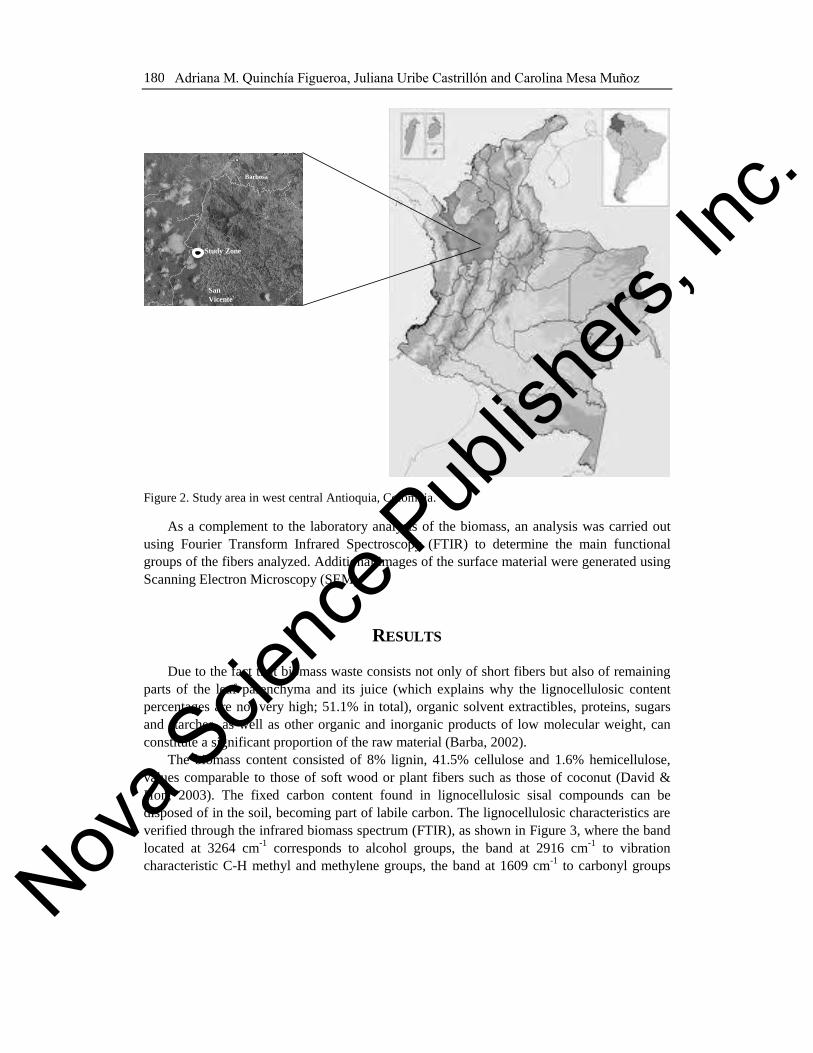
Adriana M. Quinchía Figueroa, Juliana Uribe Castrillón and Carolina Mesa Muñoz 180
Figure 2. Study area in west central Antioquia, Colombia.
As a complement to the laboratory analysis of the biomass, an analysis was carried out
using Fourier Transform Infrared Spectroscopy (FTIR) to determine the main functional
groups of the fibers analyzed. Additional images of the surface material were generated using
Scanning Electron Microscopy (SEM).
RESULTS
Due to the fact that biomass waste consists not only of short fibers but also of remaining
parts of the leaf parenchyma and its juice (which explains why the lignocellulosic content
percentages are not very high; 51.1% in total), organic solvent extractibles, proteins, sugars
and starches, as well as other organic and inorganic products of low molecular weight, can
constitute a significant proportion of the raw material (Barba, 2002).
The biomass content consisted of 8% lignin, 41.5% cellulose and 1.6% hemicellulose,
values comparable to those of soft wood or plant fibers such as those of coconut (David &
Hon, 2003). The fixed carbon content found in lignocellulosic sisal compounds can be
disposed of in the soil, becoming part of labile carbon. The lignocellulosic characteristics are
verified through the infrared biomass spectrum (FTIR), as shown in Figure 3, where the band
located at 3264 cm-1
corresponds to alcohol groups, the band at 2916 cm-1
to vibration
characteristic C-H methyl and methylene groups, the band at 1609 cm-1
to carbonyl groups
San
Vicente
Barbosa
Study Zone
Nova S
cienc
e Pub
lishe
rs, In
c.
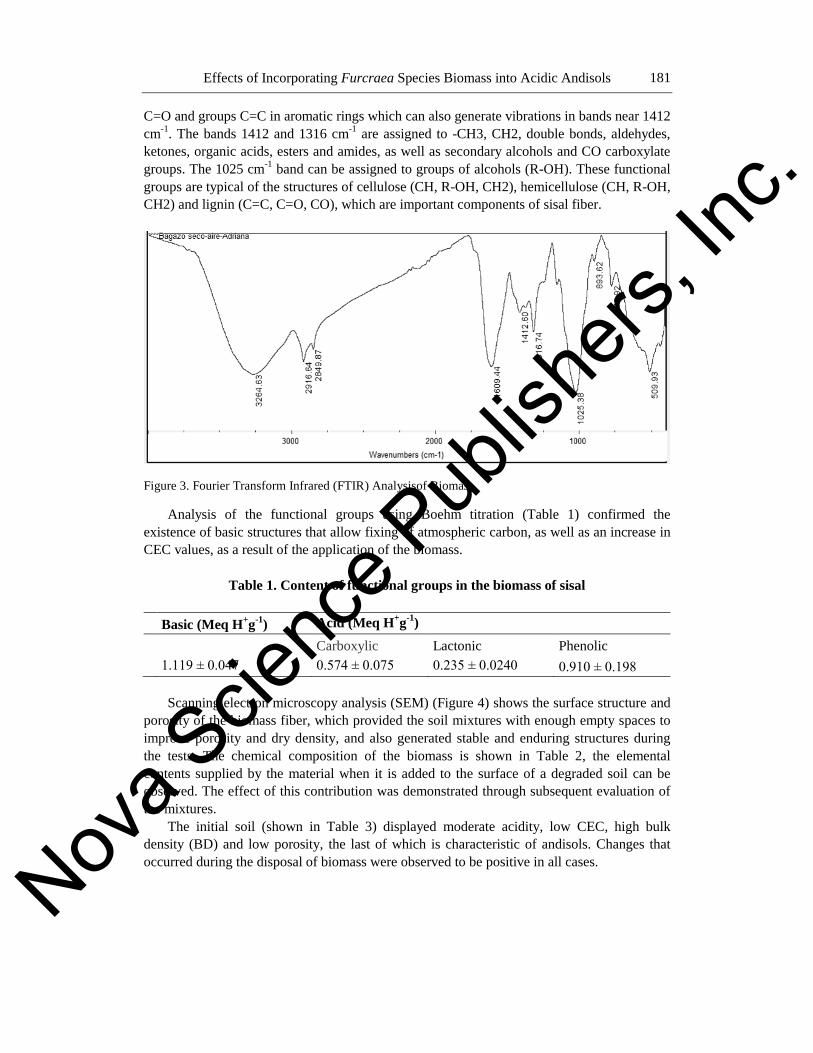
Effects of Incorporating Furcraea Species Biomass into Acidic Andisols 181
C=O and groups C=C in aromatic rings which can also generate vibrations in bands near 1412
cm-1
. The bands 1412 and 1316 cm-1
are assigned to -CH3, CH2, double bonds, aldehydes,
ketones, organic acids, esters and amides, as well as secondary alcohols and CO carboxylate
groups. The 1025 cm-1
band can be assigned to groups of alcohols (R-OH). These functional
groups are typical of the structures of cellulose (CH, R-OH, CH2), hemicellulose (CH, R-OH,
CH2) and lignin (C=C, C=O, CO), which are important components of sisal fiber.
Figure 3. Fourier Transform Infrared (FTIR) Analysisof Biomass.
Analysis of the functional groups using Boehm titration (Table 1) confirmed the
existence of basic structures that allow fixing of atmospheric carbon, as well as an increase in
CEC values, as a result of the application of the biomass.
Table 1. Content of functional groups in the biomass of sisal
Basic (Meq H+g
-1) Acid (Meq H
+g
-1)
Carboxylic Lactonic Phenolic
1.119 ± 0.047 0.574 ± 0.075 0.235 ± 0.0240 0.910 ± 0.198
Scanning electron microscopy analysis (SEM) (Figure 4) shows the surface structure and
porosity of the biomass fiber, which provided the soil mixtures with enough empty spaces to
improve porosity and dry density, and also generated stable and enduring structures during
the tests. The chemical composition of the biomass is shown in Table 2, the elemental
contents supplied by the material when it is added to the surface of a degraded soil can be
observed. The effect of this contribution was demonstrated through subsequent evaluation of
the mixtures.
The initial soil (shown in Table 3) displayed moderate acidity, low CEC, high bulk
density (BD) and low porosity, the last of which is characteristic of andisols. Changes that
occurred during the disposal of biomass were observed to be positive in all cases.
Nova S
cienc
e Pub
lishe
rs, In
c.
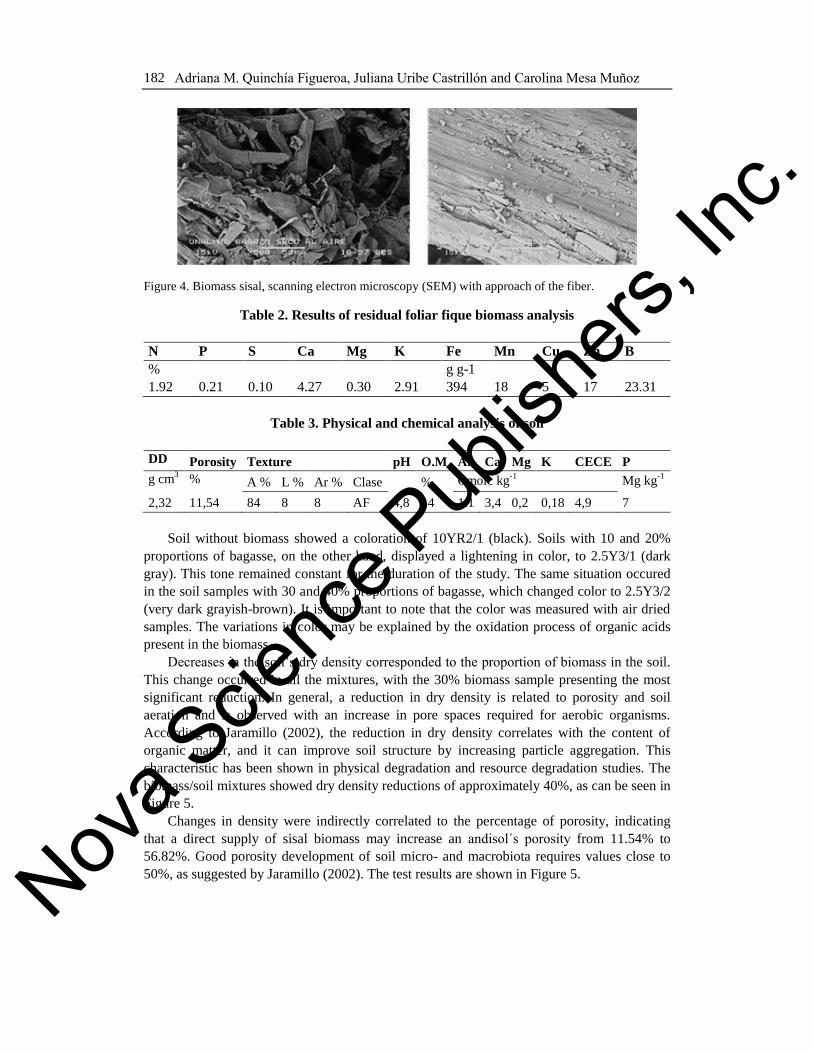
Adriana M. Quinchía Figueroa, Juliana Uribe Castrillón and Carolina Mesa Muñoz 182
Figure 4. Biomass sisal, scanning electron microscopy (SEM) with approach of the fiber.
Table 2. Results of residual foliar fique biomass analysis
N P S Ca Mg K Fe Mn Cu Zn B
% g g-1
1.92 0.21 0.10 4.27 0.30 2.91 394 18 5 17 23.31
Table 3. Physical and chemical analysis of soil
DD Porosity Texture pH O.M Al Ca Mg K CECE P
g cm3 % A % L % Ar % Clase % Cmolc kg
-1 Mg kg
-1
2,32 11,54 84 8 8 AF 4,8 14 1.1 3,4 0,2 0,18 4,9 7
Soil without biomass showed a coloration of 10YR2/1 (black). Soils with 10 and 20%
proportions of bagasse, on the other hand, displayed a lightening in color, to 2.5Y3/1 (dark
gray). This tone remained constant for the duration of the study. The same situation occured
in the soil samples with 30 and 40% proportions of bagasse, which changed color to 2.5Y3/2
(very dark grayish-brown). It is important to note that the color was measured with air dried
samples. The variations in color may be explained by the oxidation process of organic acids
present in the biomass.
Decreases in the soil‟s dry density corresponded to the proportion of biomass in the soil.
This change occurred in all the mixtures, with the 30% biomass sample presenting the most
significant reduction. In general, a reduction in dry density is related to porosity and soil
aeration and is observed with an increase in pore spaces required for aerobic organisms.
According to Jaramillo (2002), the reduction in dry density correlates with the content of
organic matter, and it can improve soil structure by increasing particle aggregation. This
characteristic has been shown in physical degradation and resource degradation studies. The
biomass/soil mixtures showed dry density reductions of approximately 40%, as can be seen in
Figure 5.
Changes in density were indirectly correlated to the percentage of porosity, indicating
that a direct supply of sisal biomass may increase an andisol´s porosity from 11.54% to
56.82%. Good porosity development of soil micro- and macrobiota requires values close to
50%, as suggested by Jaramillo (2002). The test results are shown in Figure 5.
Nova S
cienc
e Pub
lishe
rs, In
c.

Effects of Incorporating Furcraea Species Biomass into Acidic Andisols 183
Figure 5. Changes in a) dry density of soil (g/cm3), b) porosity of soil (%), c) CEC of soil (cmol/kg), d)
pH of soil and e) O.M. of soil (%) applying different percentages of biomass.
The tests also showed an increase in the Cationic Exchange Capacity (CEC) of the
mixtures when sisal biomass was applied. Using the initial soil CEC as a reference, Figure 6
shows the level of change with respect to the percentages of biomass applied. The soil with
10 and 20% biomass proportions maintained CEC values between 8 and 10 cmol kg-1
over
time, while the values for soil with 30 to 40% proportions varied between 16 and 26 cmol kg-
1, a figure consistent with the greater amount of organic matter added. Carboxylic groups and
amino and OH radicals present in biomass (Figure 3) provide a significant quantity of pH-
dependent negative charge, which can increase a soil´s total CEC. This change enhances the
absorption of elements by biota and the retention of nutrients needed to maintain the
environmental conditions of the soil as a natural resource.
One of the most important results of this study was the change in soil pH following the
addition of sisal biomass. On average, pH increased from an initial value of 4.8 to a post-
biomass addition value of 6.5 units. In the mixtures with 30 and 40% residual biomass, soil
pH appeared to increase by almost 30% compared to its initial value. As in the case of the
CEC, the pH of the mixtures tended to stabilize over time during the tests, depending on the
buffering capacity of the soil (SCCS 2000). Figure 4 shows the magnitude of pH change.
0
0.5
1
1.5
2
2.5
10 20 30 40
g/c
m3
percentage of Biomass
Final Dry
Density
with
biomass
a) b)
Nova S
cienc
e Pub
lishe
rs, In
c.
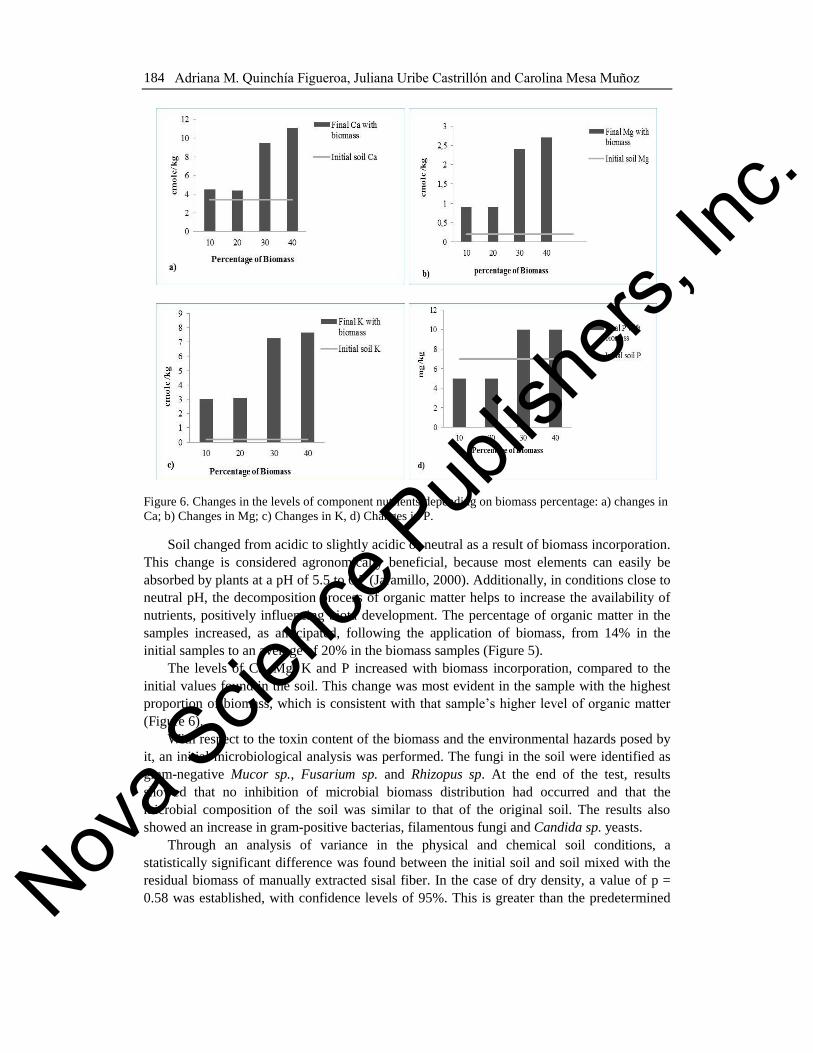
Adriana M. Quinchía Figueroa, Juliana Uribe Castrillón and Carolina Mesa Muñoz 184
Figure 6. Changes in the levels of component nutrients depending on biomass percentage: a) changes in
Ca; b) Changes in Mg; c) Changes in K, d) Changes in P.
Soil changed from acidic to slightly acidic or neutral as a result of biomass incorporation.
This change is considered agronomically beneficial, because most elements can easily be
absorbed by plants at a pH of 5.5 to 6.7 (Jaramillo, 2000). Additionally, in conditions close to
neutral pH, the decomposition process of organic matter helps to increase the availability of
nutrients, positively influencing biota development. The percentage of organic matter in the
samples increased, as anticipated, following the application of biomass, from 14% in the
initial samples to an average of 20% in the biomass samples (Figure 5).
The levels of Ca, Mg, K and P increased with biomass incorporation, compared to the
initial values found in the soil. This change was most evident in the sample with the highest
proportion of biomass, which is consistent with that sample‟s higher level of organic matter
(Figure 6).
With respect to the toxin content of the biomass and the environmental hazards posed by
it, an initial microbiological analysis was performed. The fungi in the soil were identified as
gram-negative Mucor sp., Fusarium sp. and Rhizopus sp. At the end of the test, results
showed that no inhibition of microbial biomass distribution had occurred and that the
microbial composition of the soil was similar to that of the original soil. The results also
showed an increase in gram-positive bacterias, filamentous fungi and Candida sp. yeasts.
Through an analysis of variance in the physical and chemical soil conditions, a
statistically significant difference was found between the initial soil and soil mixed with the
residual biomass of manually extracted sisal fiber. In the case of dry density, a value of p =
0.58 was established, with confidence levels of 95%. This is greater than the predetermined Nova S
cienc
e Pub
lishe
rs, In
c.
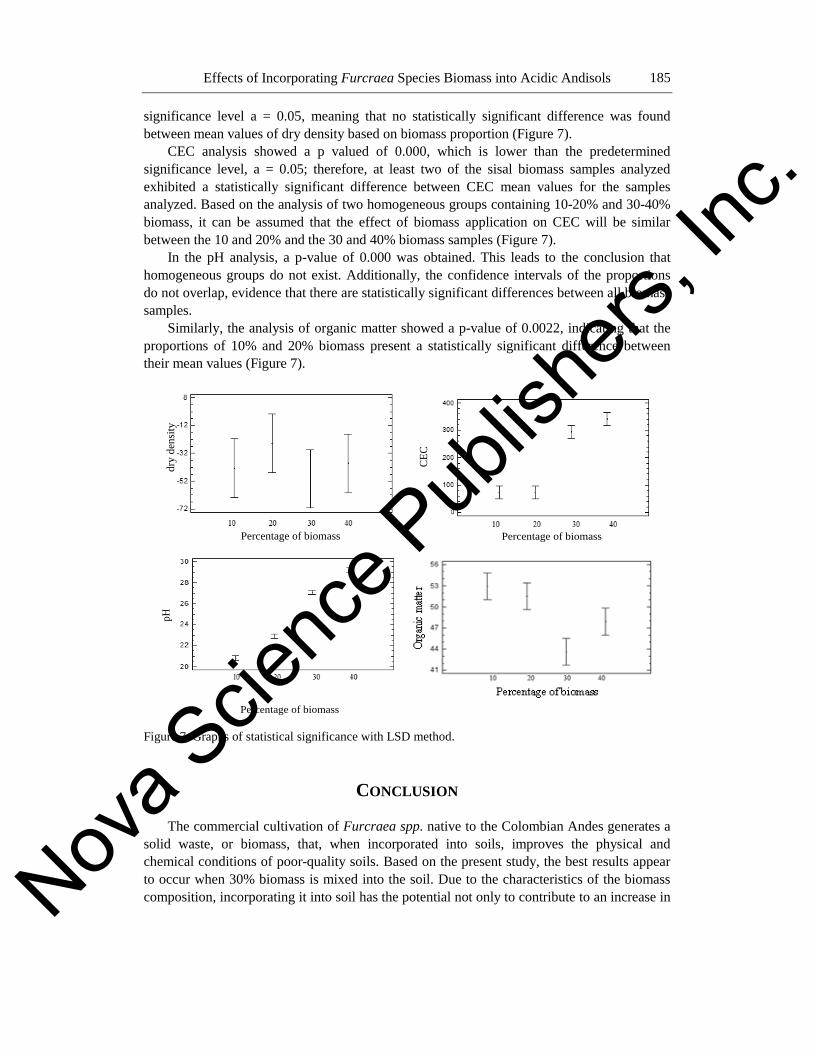
Effects of Incorporating Furcraea Species Biomass into Acidic Andisols 185
significance level a = 0.05, meaning that no statistically significant difference was found
between mean values of dry density based on biomass proportion (Figure 7).
CEC analysis showed a p valued of 0.000, which is lower than the predetermined
significance level, a = 0.05; therefore, at least two of the sisal biomass samples analyzed
exhibited a statistically significant difference between CEC mean values for the samples
analyzed. Based on the analysis of two homogeneous groups containing 10-20% and 30-40%
biomass, it can be assumed that the effect of biomass application on CEC will be similar
between the 10 and 20% and the 30 and 40% biomass samples (Figure 7).
In the pH analysis, a p-value of 0.000 was obtained. This leads to the conclusion that
homogeneous groups do not exist. Additionally, the confidence intervals of the proportions
do not overlap, evidence that there are statistically significant differences between all biomass
samples.
Similarly, the analysis of organic matter showed a p-value of 0.0022, indicating that the
proportions of 10% and 20% biomass present a statistically significant difference between
their mean values (Figure 7).
Figure 7. Graphs of statistical significance with LSD method.
CONCLUSION
The commercial cultivation of Furcraea spp. native to the Colombian Andes generates a
solid waste, or biomass, that, when incorporated into soils, improves the physical and
chemical conditions of poor-quality soils. Based on the present study, the best results appear
to occur when 30% biomass is mixed into the soil. Due to the characteristics of the biomass
composition, incorporating it into soil has the potential not only to contribute to an increase in
Percentage of biomass
dry
den
sity
CE
C
Percentage of biomass
pH
Percentage of biomass
Nova S
cienc
e Pub
lishe
rs, In
c.
Adriana M. Quinchía Figueroa, Juliana Uribe Castrillón and Carolina Mesa Muñoz 186
organic matter content, but also to provide a carbon retention mechanism present in the
lignocellulosic structure of this residue. Based on the results obtained, the use of 30% and
40% proportions of biomass appear to cause the most significant positive changes in the
properties analyzed, creating benefits such as green manure, soil recovery and the fixing of
atmospheric carbon.
ACKNOWLEDGEMENTS
The authors gratefully acknowledge the financial support of the EIA; Dr. Prof. Juan
Carlos Loaiza, National University of Colombia and Ing. Prof. Santiago Ortega EIA.
REFERENCES
Aerts, R., Chapin, F.S. 2000. The mineral nutrition of wild plants revisited: are-evaluation of
processes and patterns. AdvEcolRes 30: 1-67
Aerts, R., De Caluwe, H. 1997. Nutritional and plant-mediated controls on leaf litter
decomposition of Care species. Ecology 78: 244-260
Aristizabal, A & Zapata, A. 1990. Diagnóstico agrotecnológico del cultivo de fique (Furcraea
spp.) en dos núcleos veredales del departamento de Antioquia. Universidad Nacional de
Colombia. Facultad de Ciencias Agropecuarias. MscThesis. 144p. (In Spanish)
Bakouri Hicham, et al. Potential use of organic waste substances as an ecological technique to
reduce pesticide ground water contamination. Journal of Hydrology. 2008. vol. 353, p.
335 – 342.
Barba, C. 2002. Síntesis de carboximetilcelulosa (CMC) a partir de pastas de pantas anuales.
UniversitatRivira I Virgili. Departament, dÉnginyeria. Tarragona.(In Catalan).
Bonilla, J., Peinado, J; Urdaneta, M., Carrascal E. 2000. Informe nacional sobre uso y manejo
de plaguicidas en Colombia Tendiente a identificar y proponer alternativas para reducir el
escurrimiento de plaguicidas al mar Caribe. Ministerio de Medio Ambiente de Colombia.
Bogota. 108p. (In Spanish).
David, N &S.Hon. 2003. Chemical Modification of Lignocellulosic Materials. Clemson
University. United States of America. ISBN 0-8247-9472-9. 370 p
Etter, A., McAlpine, C., Wilson, K., Phinn, S., Possingham, H. 2006. Regional patterns of
agricultural land use and deforestation in Colombia. Agriculture, Ecosystems and
Environment 114: 369–386.
Gentry, A., Dodson, D. 1987. Contribution of nontrees to species richness of a tropical
rainforest. Biotropica 19:149-156
Henderson, A., Churchill, S.P., Luteyn, J.L. 1991. Neotropical plant diversity. Nature 351:21-
22
IGAC., 2007. Estudio general de suelos y zonificación de tierras del Departamento de
Antioquia. Instituto Geografico Agustin Codazzi. Gobernación de Antioquia. (In
Spanish).
Jaramillo, D. 2002. Introducción a la ciencia del suelo. Universidad Nacional de Colombia.
Leo digital. 53 p. (In Spanish). Nova S
cienc
e Pub
lishe
rs, In
c.

Effects of Incorporating Furcraea Species Biomass into Acidic Andisols 187
Jiménez, G. 1968. Estudio general del fique (Furcraea spp.). Universidad Nacional de
Colombia. Facultad de Ciencias Agrícolas. Medellín. Msc Thesis. 63p. (In Spanish).
MAVDT. 2006. Guia ambiental para el subsector fiquero. Ministerio de Ambiente, Vivienda
y Desarrollo Territorial; Ministerio de Agricultura y Desarrollo Rural de Colombia. 2006.
121 p. ISBN 958-97785-3-4. (In Spanish).
Meentemeyer, V. 1978. Macroclimate and lignin control of litter decomposition rates.
Ecology 59: 465-472
Montgomery, Douglas C. Design and analysis of experiments. Arizona State University. 5th
ed. 2001. ISBN 0-471-31649-0.
Montoya, R.Á., Tobón-D, H. 1979. Algunos aspectos sobre el cultivo de fique (Furcraea
spp.) y control de la calidad de la fibra. Universidad Nacional de Colombia. Facultad de
Agronomía. MSc Thesis. 63p. (In Spanish).
Polyakova, O., Billor, N. 2007. Impact of deciduous tree species on litterfall quality,
decomposition rates and nutrient circulation in pine stands. For Ecol Manage 253: 11-18
Said, A.El-Aziz; Ludwick, A. G. and Aglan, H. A. Usefulness of raw bagasse for oil
absorption: a comparison of raw and acylated bagasse and their components. Bioresource
Technology. 2009. vol. 100, p. 2219-2222
SCCS.2000.Fundamentos para la interpretación de análisis de suelos, plantas y aguas para
riego. Sociedad Colombiana de la Ciencia del Suelo. Colombia. 324 p. ISBN 958-95299-
1-7.(In Spanish).
SDAFE. 2002. Comité Cadena Productiva del Fique. Cadena productiva del fique. Secretaría
de Desarrollo Agropecuario y Fomento Économico. Caldas – Colombia. [Cited 19 abril
2008]. http://www.ces.unicauca.edu.co/archivos/aspectos_del_cultivo_del_fique.doc. (In
Spanish).
Shen, W; LI, Z. and LUI, Y. Surface Chemical Functional Groups Modification of Porous
Carbon. Recent patents on Chemical Engineering 2008. vol.1, p.27-40
Silverstein R. and Webster F., Spectrometric Identification of Organic Compounds, John
Wiley and Sons, New York, Sixth edition, 1998, ISBN 0-471-13457-0, p. 482
Singh, K.P., Singh, P.K., Tripathi, S.K. 1999. Litterfall, litter decomposition and nutrient
release patterns in four native tree species raised on coal mine spoil at Singrauli, India.
Biol Fert Soils 29: 371-378
Van Vuuren, M.M., Berendse, F., De Visser, W. 1993. Species and site differences in the
decomposition of litter and roots from wet heatlands. Can J Bot 71: 167-173.
Vitousek, P.M. 1982. Nutrient cycling and nutrient use efficiency. Amer Nat 119: 553-572
Vitousek, P.M., Turner, D.R., Parton, W.J., Sanford, R.L. 1994. Litter decomposition on the
Mauna Loa environmental matrix, Hawaii: patterns, mechanisms and models. Ecology
75: 418-429
Wang, Q., Wang, S., Huang, Y. 2008. Comparisons of litterfall, litter decomposition and
nutrient return in a monoculture Cunninghamia lanceolata and a mixed stand in southern
China. For Ecol Manage 255: 1210-1218
Weltzin, J.F., Keller, J.K., Bridgham, S.D., Paster, J., Allen, B.P., Chen, J. 2005. Litter
controls plant community composition in a northern fen. Oikos 110: 537–546.
Nova S
cienc
e Pub
lishe
rs, In
c.

Nova S
cienc
e Pub
lishe
rs, In
c.
In: Plantations ISBN: 978-1-60876-576-8
Editor: Ren Hai © 2013 Nova Science Publishers, Inc.
Chapter 11
EFFECTS OF FOREST PRACTICES ON TORTOISES
WILD POPULATION IN A FOREST AREA
Maria Casamitjana-Causa,1
Juan C. Loaiza2
and Pere Frigola Vidal3
1Universitat de Girona, LEQUIA Laboratory of Chemical and Environmental
Engineering. Girona, Spain 2Biosciences School, National University of Colombia, Medellin,
Colombia. Forestry and Technology Centre of Catalonia, Solsona, Spain 3Departament d‟Agricultura, Ramaderia, Pesca, Alimentació i Medi
Natural, Catalan Governement, Spain
ABSTRACT
Forestry management effects has been studied by means of radiotracking 21 wild
adult tortoises Testudo hermanni hermanni on three different forestry treatments during 6
months (July 2009 - January 2010). During the study, the main characteristics of the
home range, as well as the interactions between individuals, vegetation, and climate were
studied. Results show that tortoises were present in open areas (pastures, sparse corks) for
30 % of locations, whereas mostly (70%) in dense forest and heath scrubland. Tortoises
mortality for manual forestry methods was found to be lower than mechanized forestry
practices, both of which are lower than mortalities associated with forest fires.
Keywords: Forest Management, Mountain tortoises, Biodiversity, Conservation, Ecological
Interaction
Corresponding autor: Maria Casamitjana Causa. Universitat de Girona LEQUIA, Spain. Carrer Puig Salner 14,
17486. Castello D'Empuries, Spain. E-mail: [email protected]. Nova S
cienc
e Pub
lishe
rs, In
c.
Maria Casamitjana-Causa, Juan C. Loaiza and Pere Frigola Vidal 190
INTRODUCTION
Hermann‟s tortoise (Testudo hermanni hermanni) has an isolated distribution in several
Mediterranean countries: Spain, France, Italy, Balearic Islands, Corsica, Sardinia and Sicily
(Sos et al., 2008). Several studies have determined population distributions, densities and sex-
ratios of this species (Fèlix et al., 1990, Franch and Oller, 1998, Budo et al., 2003; Bertolero,
2010), as well as the size of its home range (Hailey, 1989; Calzolai and Chelazzi, 1991;
Bertolero, 2010). Complete population estimates are difficult to compile, particularly in some
areas such as the Albera Natural Park, due to their crypsis and that a high percentage of the
year they are neither active nor visible, as they dig themselves in for hibernation (winter), or
for a period of aestivation when hot in midsummer (Franch and Oller, 1998, Budo et al.,
2003, Bertolero, 2010). Key to the conservation of some species is a requirement to retain an
ability to detect a trend (usually a decline) in a population over time (Anon, 2002). The
Hermann‟s tortoise has survived probably due to the fact that some areas were an effective
refuge for Testudo during periods of climatic shifts (Morales and Sanchis, 2009). The only
remaining native populations of the tortoise in the Iberian Peninsula are found in the Albera
massif, a protected area in the Eastern Pyrenees, Catalonia, Spain (Llorente et al., 2002;
Vilardell et al., 2008). At present, in the Albera mountain range, it is estimated that the
population of Hermann‟s tortoise is between 6000 and 7000 specimens (Martinez and Soler,
2005). As a result of human pressure (land use changes, wildfires, illegal harvesting, and
forest management) and predation, the subspecies T. h. hermanni has disappeared from most
regions, and is currently considered to be globally endangered (Madec, 1996; Guyot and
Clobert. 1997; Budo et al., 2003). Egg predation by junior tortoises or adults can occur, or by
several mammals and bird species (Budo et al., 2003; Vilardell et al., 2008; Bertolero, 2010).
One factor affecting the recovery of this species is of the effect of forest fires (Cheylan,
1981), as well as the development of dense scrub in forestry zones (Bertolero, 2010). Some
studies in the south of France report up to 85% of tortoise mortality associated with forest
fires (Cheylan, 1984). Studies in a northern Greek zone (Alyki Lake) report fire mortalities of
46 % and 70 %, respectively (Stubbs et al., 1981; Hailey, 2000). During the forest fires in the
summers of 1986 and 1994 in the Albera Natural Park and in the Garraf massif in Spain, a
mortality of 30.4% and 76 % were estimated respectively (Fèlix et al. 1990; Martínez and
Soler, 1998). The high mortality of Testudo species after a fire is because of difficulties of
thermoregulation, land aridification, deforestation, burrow absence, food scarcity, inhalation
of toxic fumes and some with burns (Merchán and Martínez, 1999; Martinez and Soler,
2005).
On one hand, Mediterranean forests need appropriate silvicultural and management
strategies for effective forest conservation in the region; otherwise it is impossible to control
forest fires and landscape degradation (Scarascia et al., 2000).
On the other hand, studies particularly in mountainous areas showed that forestry
management practices have negative impacts on amphibians and reptiles (Ash 1997;
deMaynadier and Hunter 1998; Yahner et al., 2001). The direct influence of forestry practices
on Hermann‟s tortoise and its influence on his home range have not been studied.
The primary aim of this chapter was to determine the effect of the change of vegetation
on tortoises home range, (resulting three different vegetation treatment plots: bushes totally
cut plot, scrub cut only 3m around the trees and no actuation plot). To achieve this radio Nova S
cienc
e Pub
lishe
rs, In
c.
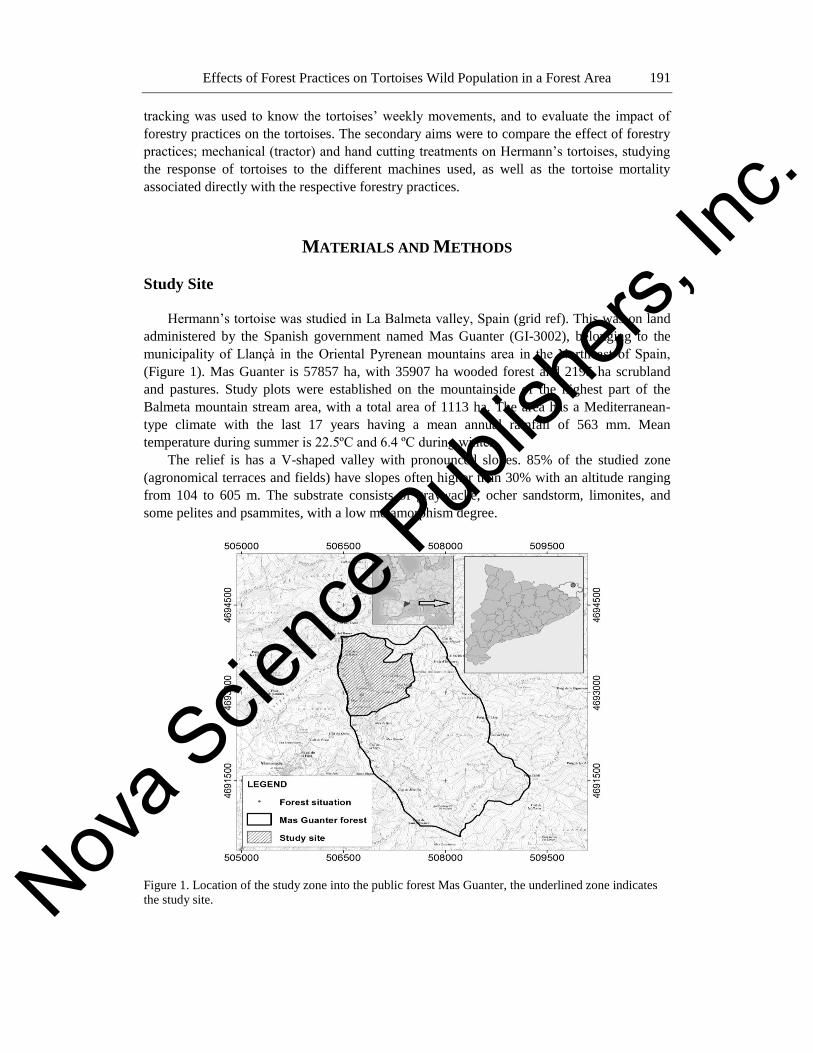
Effects of Forest Practices on Tortoises Wild Population in a Forest Area 191
tracking was used to know the tortoises‟ weekly movements, and to evaluate the impact of
forestry practices on the tortoises. The secondary aims were to compare the effect of forestry
practices; mechanical (tractor) and hand cutting treatments on Hermann‟s tortoises, studying
the response of tortoises to the different machines used, as well as the tortoise mortality
associated directly with the respective forestry practices.
MATERIALS AND METHODS
Study Site
Hermann‟s tortoise was studied in La Balmeta valley, Spain (grid ref). This was on land
administered by the Spanish government named Mas Guanter (GI-3002), belonging to the
municipality of Llançà in the Oriental Pyrenean mountains area in the Northeast of Spain,
(Figure 1). Mas Guanter is 57857 ha, with 35907 ha wooded forest and 2195 ha scrubland
and pastures. Study plots were established on the mountainside of the highest part of the
Balmeta mountain stream area, with a total area of 1113 ha. The area has a Mediterranean-
type climate with the last 17 years having a mean annual rainfall of 563 mm. Mean
temperature during summer is 22.5ºC and 6.4 ºC during winter.
The relief is has a V-shaped valley with pronounced slopes. 85% of the studied zone
(agronomical terraces and fields) have slopes often higher than 30% with an altitude ranging
from 104 to 605 m. The substrate consists of graywacke, ocher sandstorm, limonites, and
some pelites and psammites, with a low metamorphism degree.
Figure 1. Location of the study zone into the public forest Mas Guanter, the underlined zone indicates
the study site. Nova S
cienc
e Pub
lishe
rs, In
c.

Maria Casamitjana-Causa, Juan C. Loaiza and Pere Frigola Vidal 192
The soils at the experimental sites are classified as Lithic and Typic Dystroxerepts (SSS,
2006). The forestry practices to avoid forest fires included firebreaks, elimination and crush
of scrublands in the roadsides (25 m close to the way), forestations with cork (Quercus suber)
and reforestations with pine.
In the wooded forests (cork) pruning was undertaken to improve tree form. To analyse
the effect of different management practices, the study area (111,3 ha) was divided into
different zones with different forestry treatments, controlling and analysing the effect of these
treatments on the tortoises populations. One zone (30 ha) had total elimination of bush below
trees (manual), and pruning of trees.
The second witness plot “untreated” (20 ha), and the third had micro plots (30 ha), where
bushes 3 m around cork trees were removed to create open zones for tortoises to sunbathe. 30
ha of firewalls (total elimination of bushes but mechanized) and river forestry clearance
practice (1.3 ha). Distribution of the treatment plots preserved the witness plot in the center of
the study zone as a possible refuge for tortoises. Percentages of the different forestry
treatments in the study zone are shown in Figure 2.
Before the start of the forestry work began, forest workers received an induction about
how to cut the bushes reducing the risk of damage to a tortoise, by first cutting horizontal 15
cm above the soil to check for tortoise presence. To ensure food zones and refuge zones for
tortoises in the valley, some protection zones were preserved mostly near elm leaf blackberry
(Rubus ulmifolius). These zones were identified as tortoise refuges (Observed data).
Capture Techniques and Radio Tracking
Radio tracking techniques were used to monitor tortoises during the implementation of
the different forestry practices with fire prevention an objective, from July 2009 to January
2010. Twenty one wild tortoises were located (June 2009) and captured by hand by walking
the forest area along mammal pathways. Tortoises were usually encountered in open grassy
areas and old mix forest (cork and shrubs).
Figure 2. Percentage distribution of the different forest treatments realized on the study site (111,3 ha). Nova S
cienc
e Pub
lishe
rs, In
c.
Effects of Forest Practices on Tortoises Wild Population in a Forest Area 193
Most individuals were captured mainly during the first hours of the day and from half
afternoon till it get dark (maximum activity moments during the summer period), in humid
zones and under blackberry bushes. 52% of individuals were males and the rest females. Each
tortoise was distinctly marked with combinations of notches on the marginal scales (Cagle,
1939).
All animals were sexed, and measurements including length, width and weight taken and
age estimated from the growth annuli on the scutes of the carapace, being one growth annuli
per year. We drew and photograph the marks and anomalies of the carapace, mainly due to
forest fires and predators. After tortoises were marked, a transmitter was attached on each,
located subsequently with a 216 MHz receptor (Panasonic, SL, PLACE). Each transmitter
(Ayama, PLACE) had a durability of 6 - 8 months, 20 mS having 40 pulsations/minute and
216 MHz frequency. Transmitters were attached with resin used for the treatment of hooves
(Demotec 90, PLACE). Location on the carapace was selected so as not to disturb the
different biologic activities of the wild tortoises (survival, reproduction, foraging,
hibernation), being between the second and third costal scute in females and on the last costal
scute in males. On 31 July 2009, the 21 studied tortoises were released with seven tortoises
per treatment (microplots, no actuation and total elimination of bushes), closest to their initial
location. Radio tracking consisted of one or two locations weekly, according to the proximity
of the forestry practice, to avoid possible damage and to evaluate the reaction of the tortoises.
Per each location were recorded type of vegetation, habitat, activity of the tortoise and the
geographical location (coordinates UTM) using a global positioning system (GPS, type,
PLACE).
Home Range
To estimate tortoises use of habitat (before the change of vegetation due to the respective
forestry practices) the fix Kernel methodology was used because approaches more than other
methodologies the reality (Powell, 2000; Kernohan et al., 2001). Location data were weighted
having more importance the values close certain value and less weight to the remote values.
On the polygons drawn on a map that resulted from this GIS technique application, is where
there is more probability to found the studied animal. The technique is based on the locations
approximation to the Kernel Gaussiana function, based on the h parameter, which determine
the data dispersion. The polygons where found using a probability function of normal
bivariant standart (equation 1), according the coordinates X, Y, founded:
(1)
Between the informatics tools that could calculate Kernel polygons, stands out Animal
Movement Extension, Biotas, Hawth‟s Tools, Home Range Extension (HRE, Supplier,
PLACE), and Kernel Home Range (Kernohan et al. 2001). Between these options the chosen
tool was HRE, due to its efficiency determining contours of home range probabilities, due to
project adjusted home ranges according to a determined h (Mitchell, 2006). Nova S
cienc
e Pub
lishe
rs, In
c.
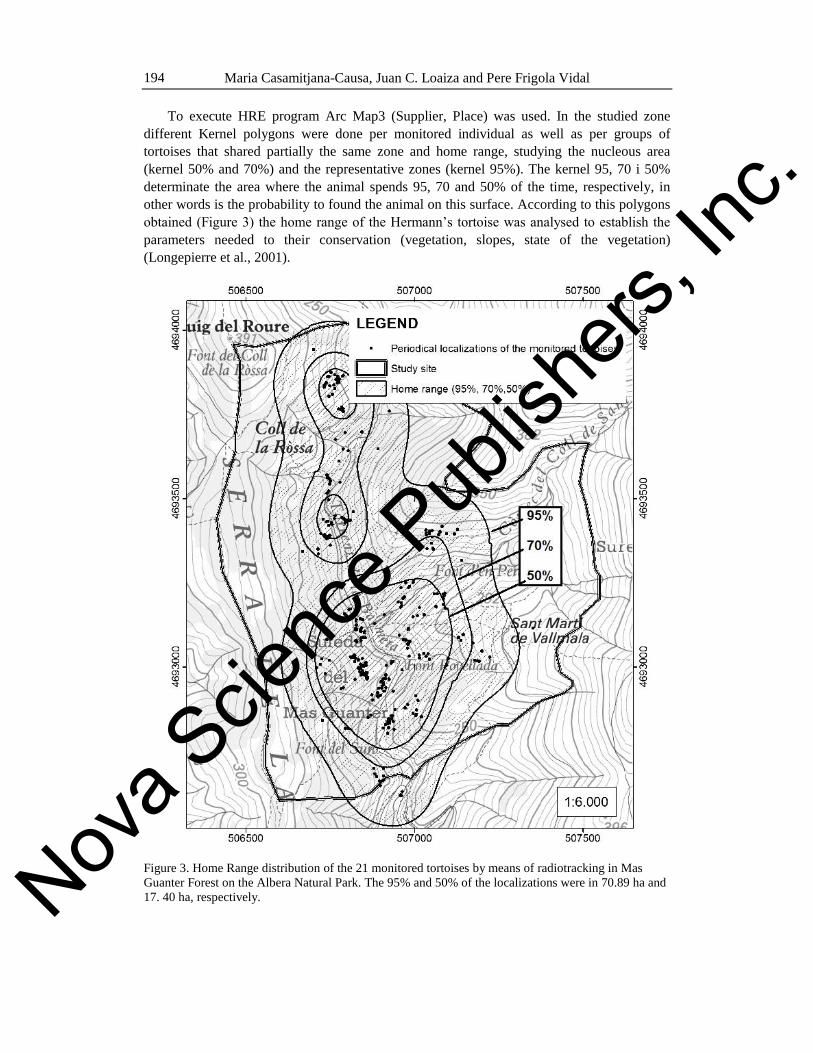
Maria Casamitjana-Causa, Juan C. Loaiza and Pere Frigola Vidal 194
To execute HRE program Arc Map3 (Supplier, Place) was used. In the studied zone
different Kernel polygons were done per monitored individual as well as per groups of
tortoises that shared partially the same zone and home range, studying the nucleous area
(kernel 50% and 70%) and the representative zones (kernel 95%). The kernel 95, 70 i 50%
determinate the area where the animal spends 95, 70 and 50% of the time, respectively, in
other words is the probability to found the animal on this surface. According to this polygons
obtained (Figure 3) the home range of the Hermann‟s tortoise was analysed to establish the
parameters needed to their conservation (vegetation, slopes, state of the vegetation)
(Longepierre et al., 2001).
Figure 3. Home Range distribution of the 21 monitored tortoises by means of radiotracking in Mas
Guanter Forest on the Albera Natural Park. The 95% and 50% of the localizations were in 70.89 ha and
17. 40 ha, respectively. Nova S
cienc
e Pub
lishe
rs, In
c.
Effects of Forest Practices on Tortoises Wild Population in a Forest Area 195
Evaluation of Damage to Tortoises by Forestry Practices
To determine the effects of the different machines used for the respective forestry
practices and their direct impact on tortoises, 60 plaster tortoises were made using mould with
similar dimensions and approximate weight to a real tortoise adult. The durability of moulds
allowed marking and damage to be registered. A statistical design was realized to evaluate the
effect of the different forestry practices (manual with brush cutters and mechanized by
tractor), as well as the influence of the vegetation and the slope as a possible parameters
correlated with the impact degree. Each sampling plot had an area of 200 m2. It was
considered three different treatments as manual work crushing the remains into small parts,
manual work cutting up into 0.5 m pieces, or mechanized work with chain tractors,
considering 3 plots per treatment. On the manual treatment the studied parameter was
according the vegetation cut, considering one plot of elm leaf blackberry, brierroot (Erica
arborea L.) and remains of mediterranean falsebrome (Brachypodium retusum), having 9
repetitions per plot. In the mechanized forestry practice with chain tractor, relief was
evaluated with one plot with gentle slope and another with moderate slope, having 9
repetitions in each. In total 24 plots with 9 repetitions each being 216 repetitions was used
with tortoise models.
In each plot the 9 model tortoises were hidden under the vegetation as a wild tortoise
does. After the workers cleared the undergrowth from the plot, according the equipments
used, an analysis of the damaged model tortoises was done, considering different levels of
damage. Data were subjected to analysis of variance (ANOVA) and Duncan test to compare
effect of the different forestry practices as well as the influence of the vegetation and the
slope as possible parameters correlated with the impact degree using a significance of 0.05.
Statistical analyses were conducted with the software Statgraphics Centurion XV (StatPoint.
Inc).
RESULTS AND DISCUSSION
Home Range
Hermann‟s tortoise had a mean home range area of 4.35 ha (SD 3,07), being higher in
males than in females. The values to Swihart Slade (2,25) and Schoener (0,22) indexes were
related to home ranges overlapped, uniform distribution and coincident localization (Figure
2). The home range area of the transmitter individuals according to the sex are showed in
Table 1. In most of cases the home ranges overlapped, resulting in 8 groups of tortoises
(Table 2). Density from home range was 0.18 (95% probability) and 0.80 tortoise per hectare
(50% probability).
The obtained data were compared by seasons, determining a seasonal effect in home
range and habitat use. Home range according to the season (summer and autumn) was 36.83
ha and 33.00 (95% probability), and 9.82 and 7.80 (50% probability), respectively. In summer
there was more movement and consequently a greater home range. In summer tortoises
concentrated in the lowest parts of the valley, whereas in autumn individuals moved to the
slopes of the valley. Nova S
cienc
e Pub
lishe
rs, In
c.

Maria Casamitjana-Causa, Juan C. Loaiza and Pere Frigola Vidal 196
Table 1. Home range surface, according to sex
Home range representative Nucleus area
mean SD mean SD
Males 5,70 3,42 1,24 0,83
Females 3,24 2,36 0,66 0,51
Total invidious 4,35 3,07 0,92 0,71
Representative zone 95% Kernel (ha); Nucleus area 50% Kernel (ha); SD: standard desviation.
Table 2. Tortoises group having coincident home range
Group Kernel 95% (ha) Density (tortoises/ha) Totoises (%)
Male Female
1 5,70 0,18 0 53
2 9,24 0,32 105 53
3 3,50 0,57 0 105
4 6,22 0,80 53 21
5 9,53 0,31 105 53
6 10,87 0,18 53 53
7 1,25 0,80 0 52
8 2,90 0,69 105 0
Habitat Use
According vegetation home range of Hermann‟s tortoises was mainly (33.7%) heather
(Erica arborea), and (33.7 %) sparse cork forests while 20.2 % was open areas under B.
retusum and pasture and the remainder (8.5%) under elm leaf blackberry and river vegetation.
During the active period, vegetation used to hide was 47% under elm leaf blackberry, 28%
under heather and 25% under B. retusum and dead vegetation. During summer, when
temperatures were high (26.7ºC mean temperature) and the rainfall low (70 mm per 3
months), tortoises chose the river zones (without water but cooler) and the blackberry to hide
in 53.8% of cases, under heather 30.3 % of cases and 15.9% of cases were in open areas with
B. retusum or herbaceous, where the insulation was higher. In comparison during autumn
tortoises sought shelter in herbaceous and more open spaces with greater sunlight, preparing
the space to hibernate. The deep hibernation (from November) was classified depending on
vegetation used: 41.7 % under B. retusum and herbs, 19.4% under E. arborea, 25% under R.
ulmifolius, and 13.9% hibernated in cleared areas as a result of forestry clearing practice.
According to sex, there was no difference between the selected vegetation in summer. In
autumn males had higher occurrence in open areas out of the river-bed, whereas most females
hibernated under R. ulmifolius, (Figure 4). Higher and lowest temperatures affect tortoises
displacements and precipitation favoured it, Figure 5. The individuals developed their activity
between 148 and 299 masl and 30 to 50% slope correspond to 77% of the area (optimal rank
of slopes), this confirming the results found by Llorente et al. (1995). However, the females
have a slight trend to go up during autumn resting there till the hibernation (lower slope sites
2%). During summer, the tortoises move on zones with a mean slope of 33,9% (SD 16,3)
whereas in autumn and winter the rank oscillates between 41,3% and 39,3% (SD=13,2 and
14,5 respectively), it doesn‟t exist significant differences between sexes. Nova S
cienc
e Pub
lishe
rs, In
c.
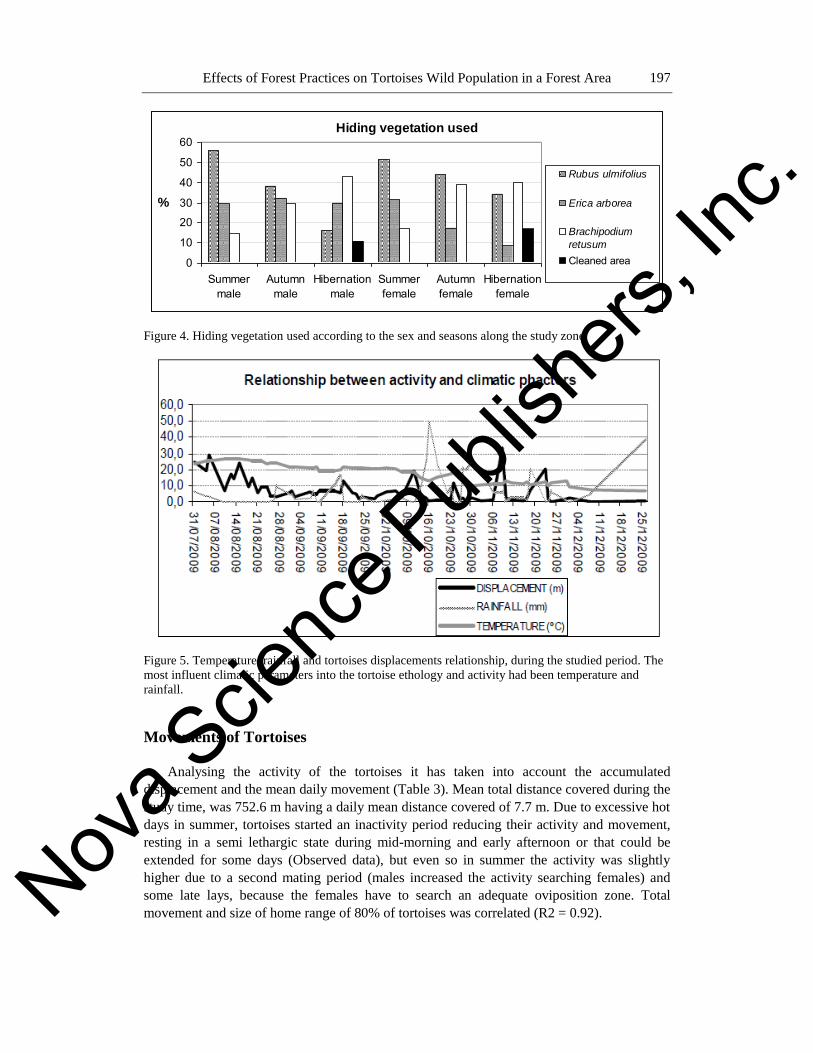
Effects of Forest Practices on Tortoises Wild Population in a Forest Area 197
Figure 4. Hiding vegetation used according to the sex and seasons along the study zone.
Figure 5. Temperature, rainfall and tortoises displacements relationship, during the studied period. The
most influent climatic parameters into the tortoise ethology and activity had been temperature and
rainfall.
Movements of Tortoises
Analysing the activity of the tortoises it has taken into account the accumulated
displacement and the mean daily movement (Table 3). Mean total distance covered during the
study time, was 752.6 m having a daily mean distance covered of 7.7 m. Due to excessive hot
days in summer, tortoises started an inactivity period reducing their activity and movement,
resting in a semi lethargic state during mid-morning and early afternoon or that could be
extended for some days (Observed data), but even so in summer the activity was slightly
higher due to a second mating period (males increased the activity searching females) and
some late lays, because the females have to search an adequate oviposition zone. Total
movement and size of home range of 80% of tortoises was correlated (R2 = 0.92).
Hiding vegetation used
0
10
20
30
40
50
60
Summermale
Autumnmale
Hibernationmale
Summerfemale
Autumnfemale
Hibernationfemale
%
Rubus ulmifolius
Erica arborea
Brachipodium
retusum
Cleaned area
Nova S
cienc
e Pub
lishe
rs, In
c.

Maria Casamitjana-Causa, Juan C. Loaiza and Pere Frigola Vidal 198
Table 3. Accumulated displacement values and average daily displacement, according to
the sex and different seasons studied
Accumulate displacement (m) Average daily displacement (m/day)
Males Females Males Females
Summer mean 642,0 477,8 14,1 10,1
SD 334,6 354,7 7,4 7,7
Autumn mean 142,9 132,8 3,7 3,6
SD 61,3 67,2 1,9 3,0
Hibernation mean 73,0 31,9 2,3 1,0
SD 97,4 24,4 3,7 0,7
Total
displacement
mean 857,9 642,4 8,3 7,0
SD 324,9 408,1 12,4 14,0
Global
displacement
mean 752,6 7,7
SD 370,4 13,2
Displacement global: Total displacement mean (males and females), SD: standard deviation.
Table 4. Accumulated turn angle between displacements according to the different
studied periods and sex
Males Females Total tortoises
Summer mean 660,4 602,3 631,3
SD 208,1 273,6 238,5
Autumn mean 642,1 681,4 661,7
SD 249,6 154,2 202,9
Hibernation mean 239,1 246,7 242,9
SD 160,1 163,9 157,7
There was a direct relation between the length of the movements and a higher explored
area. The 20 % remaining tortoises (mostly females), showed a high activity in a reduced
area. Certain movement and change in movement direction of tortoises was associated with
forestry practice (Table 4).
Forestry Practice Effects
Considering the parameters to compare different tortoise habitat established by Bertolero
(2002), the effect of the forestry practices on change of habitat was low (Table 5). The 55%
of radio monitored individuals showed no effect to forestry practice in the proximity, whereas
the other 45% did small displacements in the opposite direction of the workers. In most of
cases the rhythm of work moved forward faster than the the tortoises could. During forestry
practices, 15 tortoises were found killed with one injured that survived after healing.
Also 8 old carapaces were found without any impact, possibly due to predation.
Simulation with mould tortoises showed slight damage 5% - 10% in manual crushing remains
and serious damages 4% - 11% on manual cutting remains under B. Retusum, E. arborea and
Rubus ulmifolius, respectively. It is important to emphasize that in manual work any mold
was crushed into parts (which would equal to the death of a real individual). Nova S
cienc
e Pub
lishe
rs, In
c.
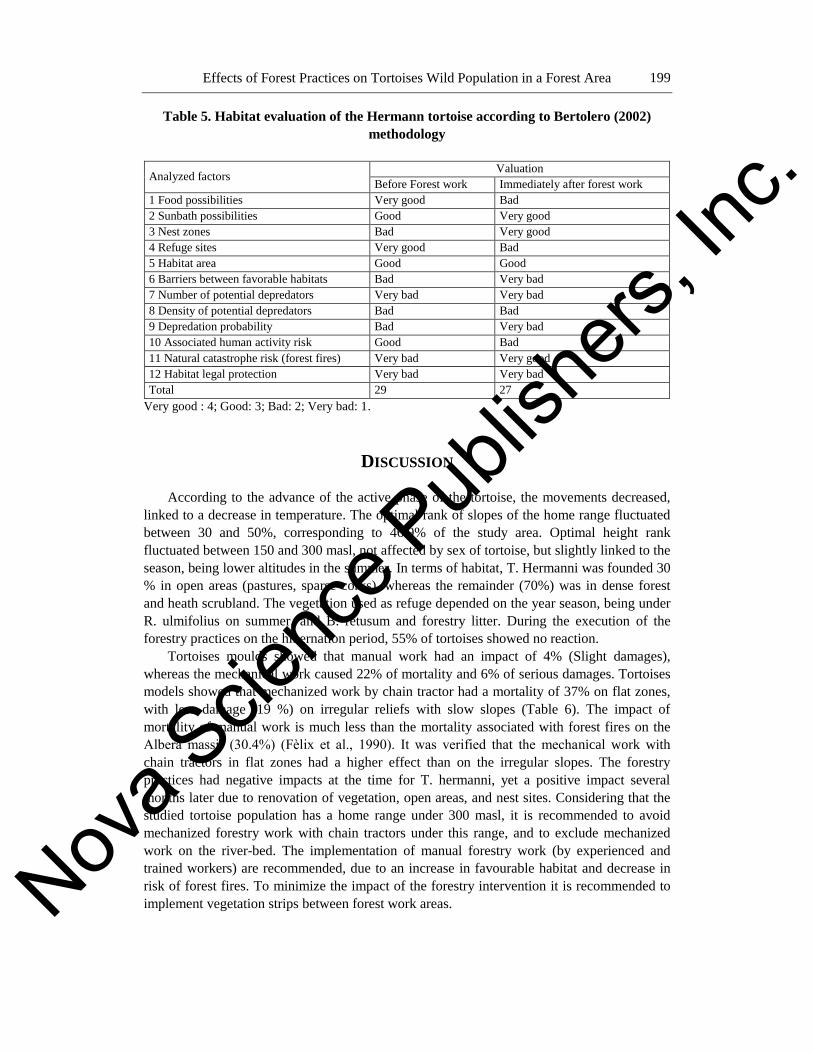
Effects of Forest Practices on Tortoises Wild Population in a Forest Area 199
Table 5. Habitat evaluation of the Hermann tortoise according to Bertolero (2002)
methodology
Analyzed factors Valuation
Before Forest work Immediately after forest work
1 Food possibilities Very good Bad
2 Sunbath possibilities Good Very good
3 Nest zones Bad Very good
4 Refuge sites Very good Bad
5 Habitat area Good Good
6 Barriers between favorable habitats Bad Very bad
7 Number of potential depredators Very bad Very bad
8 Density of potential depredators Bad Bad
9 Depredation probability Bad Very bad
10 Associated human activity risk Good Bad
11 Natural catastrophe risk (forest fires) Very bad Very good
12 Habitat legal protection Very bad Very bad
Total 29 27
Very good : 4; Good: 3; Bad: 2; Very bad: 1.
DISCUSSION
According to the advance of the active phase of the tortoise, the movements decreased,
linked to a decrease in temperature. The optimal rank of slopes of the home range fluctuated
between 30 and 50%, corresponding to 46.9% of the study area. Optimal height rank
fluctuated between 150 and 300 masl, not affected by sex of tortoise, but slightly linked to the
season, being lower altitudes in the summer. In terms of habitat, T. Hermanni was founded 30
% in open areas (pastures, sparse corks), whereas the remainder (70%) was in dense forest
and heath scrubland. The vegetation used as refuge depended on the year season, being under
R. ulmifolius on summer, and B. retusum and forestry litter. During the execution of the
forestry practices on the hibernation period, 55% of tortoises showed no reaction.
Tortoises moulds showed that manual work had an impact of 4% (Slight damages),
whereas the mechanical work caused 22% of mortality and 6% of serious damages. Tortoises
models showed that mechanized work by chain tractor had a mortality of 37% on flat zones,
with less damage (19 %) on irregular reliefs with slow slopes (Table 6). The impact of
mortality of manual work is much less than the mortality associated with forest fires on the
Albera massif (30.4%) (Fèlix et al., 1990). It was verified that the mechanical work with
chain tractors in flat zones had a higher effect than on the irregular slopes. The forestry
practices had negative impacts at the time for T. hermanni, yet a positive impact several
months later due to renovation of vegetation, open areas, and nest sites. Considering that the
studied tortoise population has a home range under 300 masl, it is recommended to avoid
mechanized forestry work with chain tractors under this range, and to exclude mechanized
work on the river-bed. The implementation of manual forestry work (by experienced and
trained workers) are recommended, due to an increase in favourable habitat and decrease in
risk of forest fires. To minimize the impact of the forestry intervention it is recommended to
implement vegetation strips between forest work areas. Nova S
cienc
e Pub
lishe
rs, In
c.
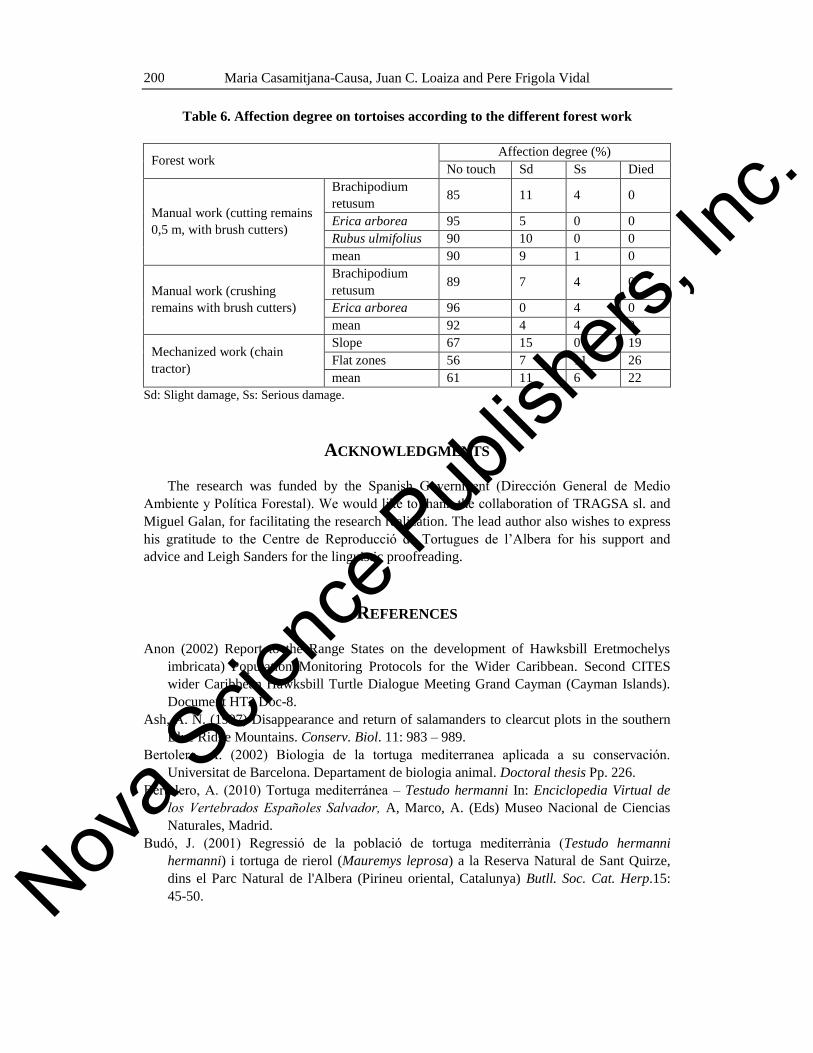
Maria Casamitjana-Causa, Juan C. Loaiza and Pere Frigola Vidal 200
Table 6. Affection degree on tortoises according to the different forest work
Forest work Affection degree (%)
No touch Sd Ss Died
Manual work (cutting remains
0,5 m, with brush cutters)
Brachipodium
retusum 85 11 4 0
Erica arborea 95 5 0 0
Rubus ulmifolius 90 10 0 0
mean 90 9 1 0
Manual work (crushing
remains with brush cutters)
Brachipodium
retusum 89 7 4 0
Erica arborea 96 0 4 0
mean 92 4 4 0
Mechanized work (chain
tractor)
Slope 67 15 0 19
Flat zones 56 7 11 26
mean 61 11 6 22
Sd: Slight damage, Ss: Serious damage.
ACKNOWLEDGMENTS
The research was funded by the Spanish Government (Dirección General de Medio
Ambiente y Política Forestal). We would like to thank the collaboration of TRAGSA sl. and
Miguel Galan, for facilitating the research realization. The lead author also wishes to express
his gratitude to the Centre de Reproducció de Tortugues de l‟Albera for his support and
advice and Leigh Sanders for the linguistic proofreading.
REFERENCES
Anon (2002) Report to the Range States on the development of Hawksbill Eretmochelys
imbricata) Population Monitoring Protocols for the Wider Caribbean. Second CITES
wider Caribbean Hawksbill Turtle Dialogue Meeting Grand Cayman (Cayman Islands).
Document HT2 Doc-8.
Ash, A. N. (1997) Disappearance and return of salamanders to clearcut plots in the southern
Blue Ridge Mountains. Conserv. Biol. 11: 983 – 989.
Bertolero, A. (2002) Biologia de la tortuga mediterranea aplicada a su conservación.
Universitat de Barcelona. Departament de biologia animal. Doctoral thesis Pp. 226.
Bertolero, A. (2010) Tortuga mediterránea – Testudo hermanni In: Enciclopedia Virtual de
los Vertebrados Españoles Salvador, A, Marco, A. (Eds) Museo Nacional de Ciencias
Naturales, Madrid.
Budó, J. (2001) Regressió de la població de tortuga mediterrània (Testudo hermanni
hermanni) i tortuga de rierol (Mauremys leprosa) a la Reserva Natural de Sant Quirze,
dins el Parc Natural de l'Albera (Pirineu oriental, Catalunya) Butll. Soc. Cat. Herp.15:
45-50. Nova S
cienc
e Pub
lishe
rs, In
c.
Effects of Forest Practices on Tortoises Wild Population in a Forest Area 201
Budó, J., Capalleras, X., Mascort, R., Fèlix, J. (2003) Estudi de la depredació de postes de
tortuga mediterrània (Testudo hermanni hermanni) a la serra de l'albera (Pirineu oriental,
Catalunya) Butll. Soc. Cat. Herp. 16 p.
Cagle, F. R. (1939) A system of marking turtles for future identification Copeia volume:170 –
172.
Calzolai, R., Chelazzi, G. (1991) Habitat use in a central Italy population of Testudo
hermanni Gmelin (Reptilia Testudinidae) Ethol. Ecol. Evol. 3:153-166.
Cheylan, M. (1981) Biologie et Ecologies de la Tortue d‟Hermann, Testudo hermanni
Gmelin. Contribution de l’espèce à la cannaissance des climats quaternaires de la
France Escole Pratique des Hautes Études Memòria i Treball de l’Institut de Montpeller
13p.
Cheylan, M. (1984) The true Status and Future of Hermann‟s Tortoise Testudo hermanni
robertmertensi WERMUTH 1952 in Western Europe. Amphibia-Reptilia 5: 17-26.
DeMaynadier, P. G., Hunter, M. L. (1998) Effects of silvicultural edges on the distribution
and abundance of amphibians in Maine. Conserv. Biol. 12: 340 – 352.
Fèlix, J., Budó, J., Capalleres, X., Farré, M. (1990) Conseqüències dels incendis forestals en
una població de tortuga mediterrània (Testudo hermanni hermanni GMELIN, 1789) de
l‟Albera Ann. Inst. Estad. Empord. 23: 13-36.
Franch, M., Oller, M. (1998) Estudi d'una població de tortuga mediterrània (Testudo
hermanni hermanni) a la serra Balmeta (L'Albera) Document CRT de l'Albera
Garriguella, Catalunya. Unpublished data.
Guyot, G., Clobert, J. (1997) Conservation measures for a population of Hermann‟s tortoise
Testudo hermanni in southern France bisected by a major highway. Biol. Conserv. 79:
251- 256.
Hailey, A. (1989) How far do animals move? Routine movements in a tortoise. Can. J. Zool.
67: 208-215.
Hailey, A. (2000) The effects of fire and mechanical habitat destruction on survival of the
tortoise Testudo hermanni in Northern Greece. Ed Elsevier. Biol. Conserv. 92: 321-333.
Kernohan, B. J., Gitzen, R. A., Millspaugh, J. J. (2001) Analysis of animal space use and
movements. Radio Tracking Animal Populations. Millspaugh, J. J. and Marzluff, J. M.
(Eds) Academic Press, PLACE.
Llorente, G. A., Montori, A., Santos, X., Carretero, M. A. (1995) Atlas dels amfibis i rèptils
de Catalunya i Andorra. Ed. El Brau, Figueres, Spain.
Llorente, G. A., Montori, A., Carretero, M. A., Santos, X. (2002) Testudo hermanni (Gmelin,
1789) Tortuga mediterránea. Atlas y libro rojo de los Anfibios y Reptiles de España
Pleguezuelos. Dirección general de Conservación de la Naturaleza – AHE. volume: 151-
153.
Longepierre, S., Hailey, A., Gernot, C. (2001) Home range area in the tortoise Testudo
hermanni in relation to habitat complexity: implications for conservation of biodiversity.
Biodivers. Conserv. volume: 1131-1140.
Madec, D. (1996) La predation dans le processus de conservation de la Tortue d'Hermann,
Testudo hermanni In: B. Devaux (ed.) Proceedings International Congress of Chelonian
Conservation OPTOM Gonfaron France: 181-183.
Martínez, A., Soler, J. (1998) Criteris de selecció de la tortuga mediterrània (Testudo
hermanni hermanni) reintroduïda al Parc Natural del Garraf. III Trobada d’estudiosos del
Garraf volume: 3-29. Nova S
cienc
e Pub
lishe
rs, In
c.
Maria Casamitjana-Causa, Juan C. Loaiza and Pere Frigola Vidal 202
Martínez, A., Soler, J. (2005) La tortuga mediterrània a Catalunya. Ed. Col·lecció Natura
núm 3: 130.
Merchán, M., Martínez-Silvestre, A. (1999) Tortugas de España. Ed. Antiquaria. Madrid
Mitchell, B. (2006) Comparison of Programs for Fixed Kernel Home Range Analysis.
University of Vermont Wildlife newsletter.
Morales, J. V., Sanchis, A. (2009) The Quaternary fossil record of the genus Testudo in the
Iberian Peninsula Archaeological implications and diachronic distribution in the western
Mediterranean. J. Arch. Sci. 36: 1152–1162.
Powell, R. A. (2000) Animal home ranges and territories and home range estimators.
Research Techniques in Animal Ecology Boitani. Columbia University Press PLACE pp:
65 – 110.
Scarascia, G., Oswald, H., Piussi, P., Radoglou, K. (2000) Forests of the Mediterranean
region: gaps in knowledge and research needs. Forest Ecol. Manag. 132: 97 – 109.
Sos, T., Daróczi, S., Zeitz, R., Pârâu, L. (2008) Notes on morphological anomalies observed
in specimens of Testudo hermanni boettgeri Gmelin, 1789 (Reptilia: Chelonia:
Testudinidae) from Southern Dobrudja. Romania North-Western J. Zool. V 4:154-160.
SSS (2006) Keys to Soil taxonomy Ninth edition SSS Soil Conservation Service Agric US
Gov. printing office Washington, DC.
Stubbs, D., Hailey, A., Tyler, W., Pulford, E. (1981) Expedition to Greece 1908. A Report
London Univ. of London Union Natural History Society.
Vilardell, A., Capalleras, X., Budó, J., Molist, F., Pons, P. (2008) Test of the efficacy of two
chemical repellents in the control of Hermann‟s tortoise nest predation. Eur. J. Wildl.
Res.: 745–748.
Yahner, R. H., Bramble, W. C., Byrnes, W. R. (2001) Effect of vegetation maintenance of an
electric transmission right-of-way on reptile and amphibian populations. J. Arb. 27(1).
Nova S
cienc
e Pub
lishe
rs, In
c.
In: Plantations ISBN: 978-1-60876-576-8
Editor: Ren Hai © 2013 Nova Science Publishers, Inc.
Chapter 12
ECOHYDROLOGY OF AMAZONIAN
RAINFOREST ECOSYSTEMS
Conrado Tobón1,* and Jan Sevink
2
1Forestry and Conservation Department,
Universidad Nacional de Colombia, Medellin, Colombia 2Institute For Biodiversity and Ecosystem Dynamics,
University of Amsterdam, Amsterdam, The Netherlands
ABSTRACT
The Amazonia rainforest is the most complex biome on earth, both in its structure
and species diversity, besides it plays an important role in the regulation of regional and
global climate. Ecohydrological studies of Amazon rainforests may serve different
purposes: to understand the transfer processes between soils, vegetation and atmosphere,
to assess the effects of deforestation on the local, regional and global climate and
biodiversity, and to evaluate the effects of deforestation. This study represents the first
long-term hydrological study for the western part of Amazonia, thus the main objective
was the assessment of the ecohydrological functioning of four forest types, representative
for this part of the Amazonia. This is achieving by describing and quantifying the
temporal and spatial dynamics of the hydrological fluxes inside forest, through a
monitoring program carried out for five years (1995-1997, 2003 - 2005) on climate and
water fluxes through the forest. Collected data showed that average annual rainfall for the
western part of the Amazonia was3400 mm, the average annual temperature 26 þC and mean
relative humidity 87%. Net precipitation appeared to be dependent on both gross rainfall
and forest structure. The presence of thick litter layer and the concentration of fine roots
determine the net rainfall partitioning into water uptake and total drainage to mineral soil.
Results pointed to differences between ecosystems in the forest floor water storage
capacity, water content and water uptake dynamics and amounts. Results indicated that
water availability in studied soils is low; however, soil water storage is high and almost
constant over the period of study. The rainfall distribution and the high water storage of
the mineral soil appeared to be the most important parameters in maintaining water
uptake or actual transpiration very similar to reference transpiration. The annual water
* E-mail: [email protected]. Nova S
cienc
e Pub
lishe
rs, In
c.

Conrado Tobón and Jan Sevink 204
balances during the four year period showed that the fraction of evaporation of
intercepted gross rainfall was about constant over this period and that there are
differences between ecosystems in their net evaporation. It is the compartment approach
which enables to identify the ecosystem compartments and processes involved in such
changes in the overall water balance.
Keywords: Ecohydrology, Amazonia forest, forest floor, soil moisture, droughts
INTRODUCTION
Amazonia rainforests are estimated to host around half of the world‟s undisturbed
tropical forest with a high level of biodiversity (Leopoldoet al., 1987), and because of its
magnitude the amount of fixed CO2 is very high. As such, conversion of Amazonia vegetation
to pastures or crops may exert a large influence on hydrology, global climate, and
biogeochemical cycles (Gash et al., 1996; Shuttleworth, 1988). The special ecohydrological
significance of this forest is due to its high total evapotranspiration, resulting largely from the
large proportion of incident rainfall that is intercepted and evaporated after interception by the
canopy (Tobón, 1999; Tobón et al., 2000a).
It is expected that the disappearance of the Amazonia forest may have important effects
on the hydrology and climate in those ecosystems lying in the eastern slope of the Andes
(Tobón et al., 2000a). Andean mountains act as a barrier blocking most of the humidity
coming from the Amazonia, which produces high precipitation on parts the Andes,which
returns water to the Amazon via the Andean river corridors (Tobón, 1999). This is a feedback
mechanism: the Andes benefits from high precipitation and partly depends on the existence of
the Amazonian forest, and at the same time acts as a barrier to prevent evaporated water
leaving the basin (Tobón et al., 2000a).
Ecohydrological studies of the Amazonia rainforests are of broad relevance: to evaluate
effects of deforestation and incorporate the hydrological forest characteristics in global
models (Salati and Vose, 1984; Sukla et al., 1990, Lesack, 1993), to understand
biogeochemical fluxes through the forest (Tobón, 1999; Tobón et al., 2000a, Vorosmarty et
al., 1989), and to analyze appropriate land uses and management. Although the Amazonia has
been the focus of global circulation model research (Nobre et al., 1991), the lack of field data
has largely restricted their application to predict local, regional, and global consequences of
deforestation (Lesack, 1993; Shuklaet al., 1990; Salati and Vose, 1984). Consequently, field
data collection research is needed to characterize important parameters and fluxes that play a
role in the regional and global climate (e.g. Gash et al., 1996).
Most of the water balance studies in the Amazonia basin have been concentrated in
central Amazonia (Ubarana, 1996; Leopoldoet al., 1995; Lesack, 1993; Shuttleworth, 1988),
although some have been carried out in eastern Amazonia (Hölscher et al., 1997; Jetten, 1996;
Wright et al., 1992). However, little attention has been paid to the forest hydrology of
ecosystem types in northwest Amazonia and the effects of forest structure on water dynamics.
This chapter describes a study designed to address this lack of knowledge by measuring
precipitation, its spatial variation and the partitioning after entering the forest canopy in four
undisturbed rainforest ecosystems in the Middle Caquetá, Colombian Amazonia. The focus is
on the analysis of long term hydrological measurements of rainfall, throughfall, stemflow, Nova S
cienc
e Pub
lishe
rs, In
c.
Ecohydrology of Amazonian Rainforest Ecosystems 205
and water dynamics in the forest floor and in the mineral soils in four forest ecosystems.
Understanding water fluxes, as the key factor in physical, chemical, and biotic processes, is
vital to understand nutrients dynamics in these ecosystems. Thus, this hydrological study at
compartment level allows for a detailed study of nutrient fluxes, contributing to the overall
understanding of the ecohydrological functioning of ecosystems.
In the northwest Amazonia (e.g. Colombian Amazonia), forest structure and tree species
composition vary considerably between ecosystems in different landscape units (Milliken et
al., 2010; Sala, 2002; Vasconcelos et al., 2000; Duivenvoorden and Lips, 1995). The structure
of the tree canopy and patterns of lower layers play a decisive role in the partitioning of gross
rainfall into throughfall, stemflow, and evaporated water (Longman and Jenik, 1990).
Amazonian soils are highly weathered and leached, with a very low cation exchange capacity
(Chauvel et al., 1991), most of which is located in the litter layer covering the mineral soil
(Lesack and Melack, 1991; Pitman, 1989). In these impoverished ecosystems, the litter layer,
here referred to as the forest floor, is the main compartment with respect to nutrient stocks
and nutrient cycling (Tobón et al., 2000b; Tiessen et al., 1994; Salati et al., 1979). Apparently
related to the concentration of available nutrients in the forest floor, fine roots of trees often
concentrate in this compartment to form a “root mat” (Jordan, 1989; Cuevas and Medina,
1988; Golley, 1983). Accordingly, the main objective of the chapter is the assessment of the
ecohydrological functioning of pristine forests in Colombian Amazonia. This was undertaken
by describing and quantifying the temporal and spatial dynamics of hydrological fluxes
through the forest compartments, identifying the parameters controlling these fluxes and
storage, and the relationship with the vegetation.
GENERAL METHODOLOGY
The study area:The study area is part of the undisturbed forest located in the Middle
Caquetá Colombia, (0 37' 23´´ N and 70 43' 18´´ W). The research sites lay approximately
200m.a.s.l. to 250m.a.s.l. The research plots are located in the four main landscapes units in
the area: the Tertiary sedimentary plain, the upland terraces of the River Caquetá (high and
low terraces), and the flood plain (Duivenvoorden and Lips, 1993). The climate of the Middle
Caquetá is wet tropical, classified as Afi(SelvaAmazónica) according to Köppen (1936). The
average annual rainfall is approximately 3400 mm; the daily average temperature is 26þC and
the mean relative humidity is 87%. Two main seasons can be distinguished: a relatively dry
period between December and February, and the rainy season lasts from March until
December.
Soils in this part of the Amazonia have a very low chemical fertility, low pH, and very
low base saturation, except for soils on the flood plain of Andean rivers, which have a
somewhat higher base saturation and are higher in weatherable minerals (Lips and
Duivenvoorden J. F. 1990). Main soil types in the research plots (according to Keys to soil
taxonomy) are: typicPaleudults, typicHapludults, typicKandiudults, and typic and
aquicfluventic Dystropepts (USDA, 2010).
The entire area is covered by mature rainforests classified by the FAO as belonging to the
group of ombrophilous tropical forest (Milliken et al., 2010; Sala, 2002; Vasconcelos et al.,
2000; Duivenvoorden, 1995). The canopy reaches to about 25 to 30 m above the forest floor Nova S
cienc
e Pub
lishe
rs, In
c.

Conrado Tobón and Jan Sevink 206
with some emergent trees reaching up to 45 m in the rarely inundated flood plain. There are
differences in the total standing biomass, species diversity and tree density between the
landscape units (Duivenvoorden and Lips, 1995). Species richness can be referred to
Leguminosae, Lauraceae, Sapotaceae, Melastomataceae and Rubiaceae, Annonaceae,
Moraceae and Araceae (Londoño, 1993, Alvarez, 1993). A more detailed description and
vegetation classification of the research sites is given by Duivenvoorden and Lips (1995),
Alvarez (1993), and Londoño (1993). The main Indigenous land use in this part of the
Amazonia was and still is “shifting cultivation”, where only small areas of native forest,
mostly less than one hectare, are cut and used for crop plantations during two or three years,
depending on the aggregated soil fertility (ashes from the burning litter). Several other types
of land use can be distinguished, part of which are connected with colonization and new
techniques: grassland and some crop plantation (Botero, 1984).
Methods: To measure the meteorological variables, an automatic weather station
(Campbell Scientific Inc.) was installed in an open area of about 20 ha, on the bank of the
River Caquetá. Parameters measured in the open were gross rainfall (mm), air temperature
(þC), air humidity (%), global solar radiation (W/m2), wind speed (m/s), wind direction and
Class A pan evaporation (mm). A CR10 datalogger (Campbell Scientific Inc.) was
programmed to measure the instruments each 30 seconds and to register mean and total
values each 20 minutes. Gross rainfall in the open area and at each forest site was measured
by means of a tipping bucket rain gauge with a resolution of 0.2 mm, giving information on
the number and duration of showers and the total precipitation.
For the ecohydrological research we selected representative areas with natural vegetation
in the main physiographical units in this part of the Amazonia basin, according to
Duivenvorrden and Lips (1993). Three subplots were selected in the Tertiary sedimentary
plain (SP) and two subplots in the high terrace (HT), the low terrace (LT) and flood plain
(FP), to measure gross rainfall above the forest canopy, throughfall and Stemflow, litter flow
and soil moisture. Throughfall was measured by means of 20 rain gauges randomly located in
each subplot of 50 by 20 m (1000 m2). Because of the large variability in throughfall due to
the forest structure, rain gauges were randomly relocated each month over the entire period.
Stemflow was measured on 15 randomly selected trees in each subplot. Collars, constructed
from 8 mm thick black polyethylene plastic, were sealed to the stems in an upward spiral
pattern and the water diverted into rain gauges on the forest floor.
Water fluxes through the forest floor (FF) were studied in the four forest types. To
determine the water storage capacity of the FF, three plots of one m2 were randomly selected
within each forest type. Plots were in-situ saturated during three consecutive days and
covered with a plastic sheet (to avoid evaporation). Subsequently, after 24 hours total FF
samples were collected and immediately weighed for wet weight. Samples were air dried until
constant weight and finally weighed, for dry weight Tobón et al., 2000b). In total 78 samples
were collected during four samples periods. The thickness of the layer was measured at
different points within the plots and the mean value was used as the best estimate. To evaluate
the FF drainage or litterflow, flux plates were used to measure the proportion of net
precipitation that passes through the FF and enters the mineral soil. Plates with an open area
of 683.5 cm2 and 5 cm depth were installed horizontally in the contact zone between the FF
and mineral soil (Tobón et al., 2000b). In the SP plot, 45 plates were installed in three Nova S
cienc
e Pub
lishe
rs, In
c.
Ecohydrology of Amazonian Rainforest Ecosystems 207
subplots (i.e. 15 per subplot) and in the HT plot, 30 plates in two subplots. Plates were
measured manually on daily basis, as were gross rainfall, throughfall, and stemflow.
For the characterization of the FF water content and the spatial and temporal FF storage
dynamics, Time Domain Reflectometry, TDR technique (Campbell Scientific Inc) was used.
Measurements were daily performed at three different depths, depending on the thickness of
the FF. In total, 31 three wire TDR sensors (50 cm length) were installed horizontally in the
FF of soil profiles where soil water content was also monitored. FF water content in the SP
was measured at six locations. In the other landscapes units, it was measured at four locations.
To measure soil moisture TDR Probes were horizontally installed in the upsweep of pits
(2.0x1.5x1.5 m). Three plots (pits) were excavated at each landscape unit. In total eight
sensors were installed in each plot at different soil depths. In the sedimentary plain and high
terrace, probes were installed at 0.1, 0.15, 0.2, 0.3, 0.5, 0.8, 1.2 and 1.6 m depth. In the low
terrace and floodplain, probes were installed at slightly different depths - 0.1, 0.15, 0.2, 0.3,
0.4, 0.6, 0.8 and 1 m. After installing the TDR probes, the pits were covered by the removed
soil, keeping the same order of soil horizons, as they were. Next to the TDR pits, eight
tensiometers were vertically installed at the same depths as the TDR probes. Plots were
randomly chosen and after one year of continuous measurements, the TDR sensors and
tensiometers were relocated. TDR travel time measurements were translated into volumetric
water content applying a calibrated regression equation deduced by Tobón (1999).
The water balance of the forest ecosystems is approached through the equation:
Δ𝑆
Δ𝑡= 𝑃𝑔 − (𝐸 + 𝑇 + Sff + Ss + Dr (Q) +)+L) (1)
Where Pg is the gross rainfall above the forest, E is the amount of water intercepted and
evaporated from the forest canopy, T is the forest transpiration, Sff is the forest floor
moisture changes, Ss is the soil moisture change, Dr is the drainage from the catchment and
L represent the amount of water as deep percolation. Basic methods for the calculation of a
water balance on a catchment basis require accurate measurements of rainfall and runoff. For
the compartment approach of the water balance see Tobón (1999). The evapotranspiration
(ET), namely evaporation of water intercepted by the forest canopy and transpiration, were
evaluated separately through the Penman Monteith equation (Monteith, 1965).
RESULTS AND DISCUSSION
Rainfall distribution differs between plots, within a landscape unit, when examining
separate storms, although annual totals are rather similar. Mean annual precipitation was 3400
mm yr-1
with storms ranging from 0.4 to 161.6 mm and durations between 20 minutes to 13
hours. Most showers (63%) fell during the afternoon and at night. Comparing our data on five
years rainfall with data from earlier years in Colombian Amazonia (Duivenvoorden and Lips,
1995) rainfall characteristics are similar to the long-term average in the studied area.
The variability of throughfall within a subplot was large and between forest type. Larger
variability was observed in small rainfall events than with major events. Throughfall
percentage ranges from zero, with events below 2 mm, to 95% in storms larger than 100 mm,
but mean throughfall varies from 50% to 93% depending on gross rainfall amounts and the Nova S
cienc
e Pub
lishe
rs, In
c.
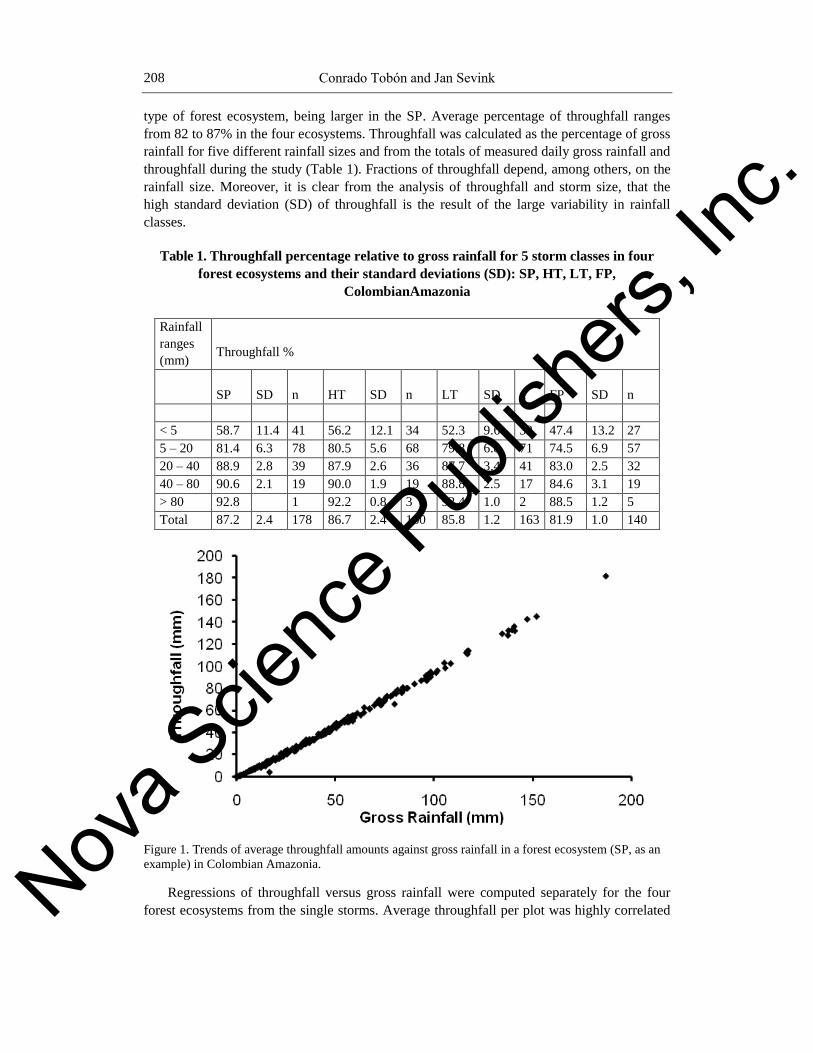
Conrado Tobón and Jan Sevink 208
type of forest ecosystem, being larger in the SP. Average percentage of throughfall ranges
from 82 to 87% in the four ecosystems. Throughfall was calculated as the percentage of gross
rainfall for five different rainfall sizes and from the totals of measured daily gross rainfall and
throughfall during the study (Table 1). Fractions of throughfall depend, among others, on the
rainfall size. Moreover, it is clear from the analysis of throughfall and storm size, that the
high standard deviation (SD) of throughfall is the result of the large variability in rainfall
classes.
Table 1. Throughfall percentage relative to gross rainfall for 5 storm classes in four
forest ecosystems and their standard deviations (SD): SP, HT, LT, FP,
ColombianAmazonia
Rainfall
ranges
(mm)
Throughfall %
SP
SD
n
HT
SD
n
LT
SD
n
FP
SD
n
< 5 58.7 11.4 41 56.2 12.1 34 52.3 9.6 32 47.4 13.2 27
5 – 20 81.4 6.3 78 80.5 5.6 68 79.8 6.8 71 74.5 6.9 57
20 – 40 88.9 2.8 39 87.9 2.6 36 87.7 3.4 41 83.0 2.5 32
40 – 80 90.6 2.1 19 90.0 1.9 19 88.8 2.5 17 84.6 3.1 19
> 80 92.8 1 92.2 0.8 3 92.4 1.0 2 88.5 1.2 5
Total 87.2 2.4 178 86.7 2.4 160 85.8 1.2 163 81.9 1.0 140
Figure 1. Trends of average throughfall amounts against gross rainfall in a forest ecosystem (SP, as an
example) in Colombian Amazonia.
Regressions of throughfall versus gross rainfall were computed separately for the four
forest ecosystems from the single storms. Average throughfall per plot was highly correlated Nova S
cienc
e Pub
lishe
rs, In
c.
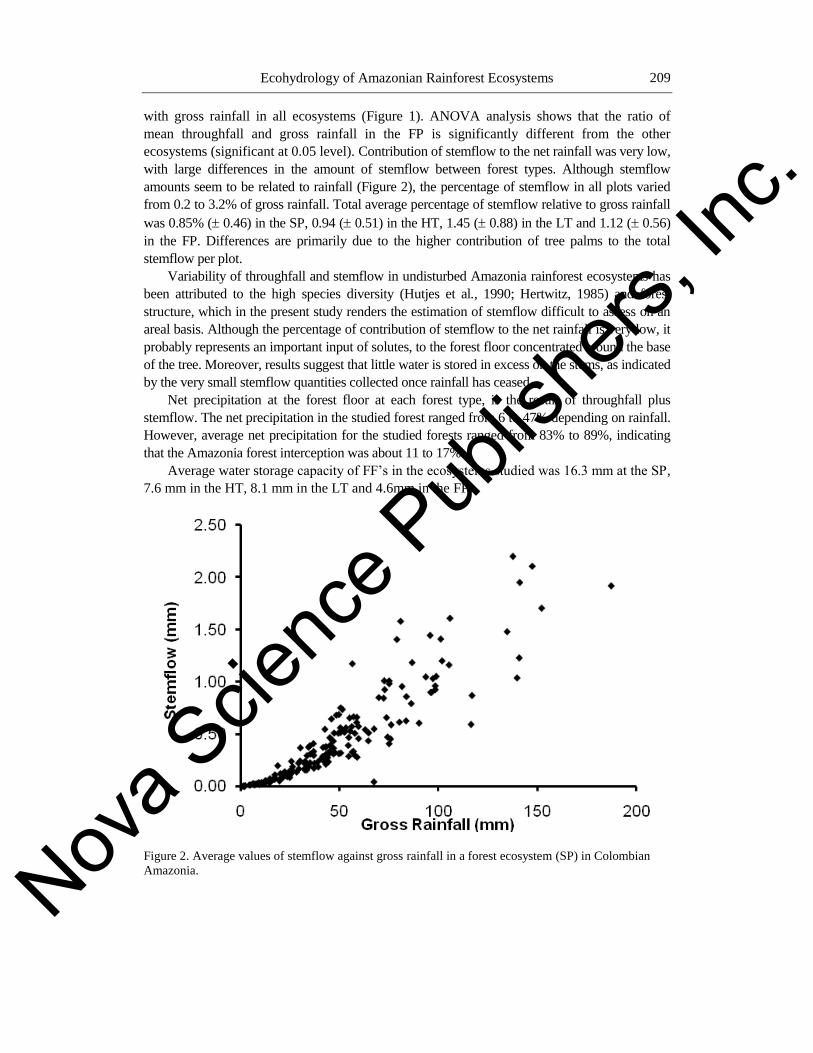
Ecohydrology of Amazonian Rainforest Ecosystems 209
with gross rainfall in all ecosystems (Figure 1). ANOVA analysis shows that the ratio of
mean throughfall and gross rainfall in the FP is significantly different from the other
ecosystems (significant at 0.05 level). Contribution of stemflow to the net rainfall was very low,
with large differences in the amount of stemflow between forest types. Although stemflow
amounts seem to be related to rainfall (Figure 2), the percentage of stemflow in all plots varied
from 0.2 to 3.2% of gross rainfall. Total average percentage of stemflow relative to gross rainfall
was 0.85% ( 0.46) in the SP, 0.94 ( 0.51) in the HT, 1.45 ( 0.88) in the LT and 1.12 ( 0.56)
in the FP. Differences are primarily due to the higher contribution of tree palms to the total
stemflow per plot.
Variability of throughfall and stemflow in undisturbed Amazonia rainforest ecosystems has
been attributed to the high species diversity (Hutjes et al., 1990; Hertwitz, 1985) and forest
structure, which in the present study renders the estimation of stemflow difficult to assess on an
areal basis. Although the percentage of contribution of stemflow to the net rainfall is very low, it
probably represents an important input of solutes, to the forest floor concentrated around the base
of the tree. Moreover, results suggest that little water is stored in excess on the stems, as indicated
by the very small stemflow quantities collected once rainfall has ceased.
Net precipitation at the forest floor at each forest type, is the result of throughfall plus
stemflow. The net precipitation in the studied forest ranged from 6 to 47% depending on rainfall.
However, average net precipitation for the studied forests ranged from 83% to 89%, indicating
that the Amazonia forest interception was about 11 to 17%.
Average water storage capacity of FF‟s in the ecosystems studied was 16.3 mm at the SP,
7.6 mm in the HT, 8.1 mm in the LT and 4.6mm in the FP.
Figure 2. Average values of stemflow against gross rainfall in a forest ecosystem (SP) in Colombian
Amazonia. Nova S
cienc
e Pub
lishe
rs, In
c.

Conrado Tobón and Jan Sevink 210
This gives an average of 1.51 ( 0.30) mm kg-1
, expressed as the weighted mean storage
capacity per unit dry mass. The differences between ecosystems in FF water storage capacity
can be accounted for by the differences in amounts of FF mass: the FF in the SP had the
lowest storage per unit FF thickness (0.99 mm cm-1
), which may be explained by the loose
structure of this FF and its composition, i.e. only a thin layer of fresh litter and many very fine
and fine roots. The FF in the other ecosystems is rather compact and has far less fine roots, as
in most part of the Amazonia (Wittmann and Parolin, 2005).
When comparing the storage capacity of the FF of Amazonia ecosystems with that of FF‟s in
Coniferous, Douglas Fir, and Bracken forests, it appears that the value found is lower than 4.83
mm kg-1
, as reported by Pitman (1989) for Bracken forest, and slightly higher than the 1.30 mm
(0.32) found by Pradham (1973) and 0.97 mm found by Putuhena (1996) for a Eucalyptus
plantation in the U.K. Noting these differences, the authors clarify that the amount of FF dry
mass per unit area in the Colombian Amazonia is higher than most values reported by Pitman
(1989) and Perkins et al. (1978) for temperate forests.
Water draining from the FF varies considerably between sites, which appeared to be related
to the thickness of the litter layer and amount of litter. Although litterflow was not observed for
most gross rainfall events lower than 5mm, some litterflow was collected upon small throughfall
values (about 2mm). The daily average percentage of litterflow ranged from 25% to 93% of net
precipitation, depending on rainfall characteristics and antecedent litter wetness (Figure 3). The
trend points to a logarithmic relation between net precipitation and its interception by the FF‟s for
small rainfall events and a linear relation for larger events are shown in Figure 3. The tendency of
litter interception is related to the asymptotic nature of the wetness curve: FF‟s retain higher
percentages of water during the earliest stage of the rainfall event.However, if the event lasts long
enough, the FF storage capacity reaches its maximum value, and total drainage and uptake rates
become equal to net precipitation.
Figure 3. FF water interception, as calculated from the difference between daily measurements of net
rainfall and litterflow, versus net precipitation in a forest ecosystem (SP) in Colombian Amazonia. Nova S
cienc
e Pub
lishe
rs, In
c.

Ecohydrology of Amazonian Rainforest Ecosystems 211
Figure 4 shows the measured FF water content in the four forest ecosystems. The FF in the
SP exhibited the lowest water content over the whole period, while in the LT and FP water
content were highest. Furthermore, the FF in the SP and HT dried out to lower values than in
the FP and LT. As a general tendency, the dynamics of the FF water content in the different
forest ecosystems showed a clear response to rainfall events: increases in water content in the FF
were only observed after rainfall events. During the period of measurements, FF water depth
ranged from 7.0 mm to 23.1 mm in the SP, 3.9 to 12.4 mm in the HT, 3.8 to 11.4 mm in the
LT, and 2.7 to 8.1 mm in the FP.
Assuming that there is no evaporation from the FF, water in this compartment can either be
taken up by roots or drain to the mineral soil. Water depletion from the FF‟s was analyzed
during the two dry periods (from day 384 to 403 and from day 445 until 461), when drainage
was zero since water storage in the FF‟s remained below the measured storage capacity,
where water uptake was the only hydrological process active during these periods. In both
periods and all ecosystems the water content decreased, implying that the forests took up a
certain amount of water from the FF. This uptake differs between forest ecosystems and between
periods. Depletion rates during the dry periods were 0.51 and 0.61 mm d-1
in the SP, 0.20 and
0.34 mm d-1
in the HT, 0.21 and 0.40 mm d-1
in the LT, and 0.19 and 0.24 mm d-1
in the FP. The
relatively high uptake rate in the SP may be related to the relative high proportion of fine roots in
the FF.
Figure 4. Temporal dynamics of measured forest floor (FF) water content (TDR) in four forest
ecosystems in the Colombian Amazonia (SP, HT, LT, and FP). Nova S
cienc
e Pub
lishe
rs, In
c.
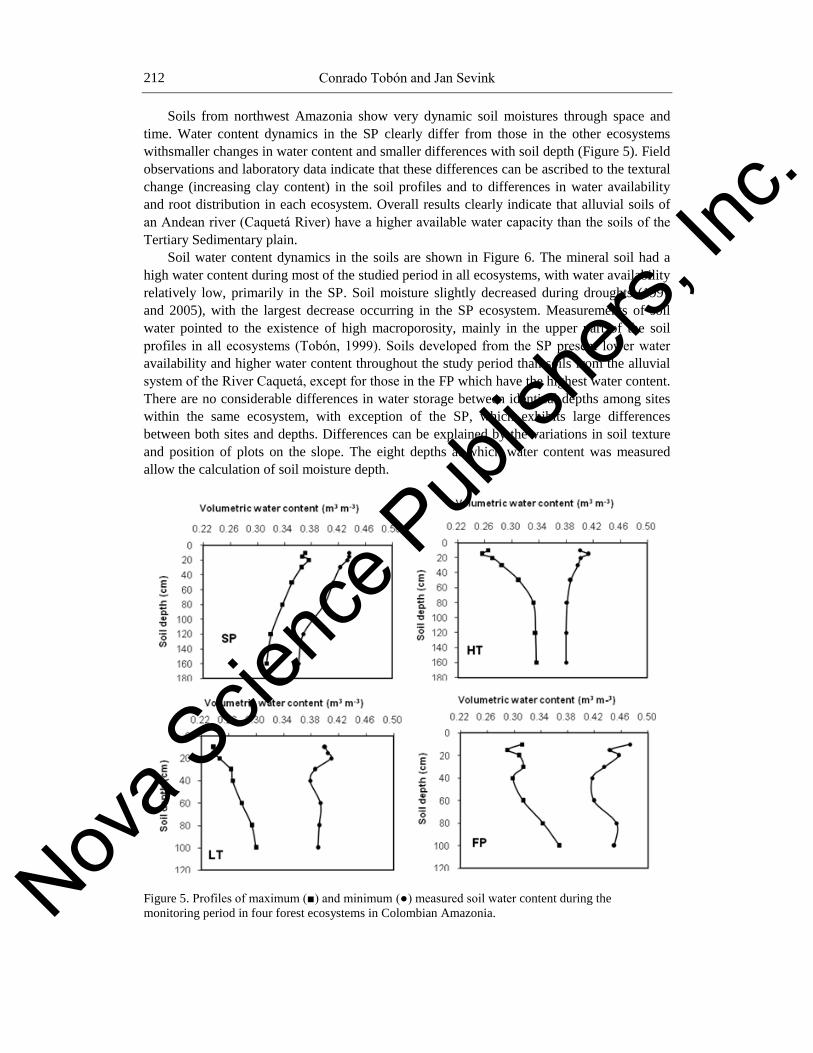
Conrado Tobón and Jan Sevink 212
Soils from northwest Amazonia show very dynamic soil moistures through space and
time. Water content dynamics in the SP clearly differ from those in the other ecosystems
withsmaller changes in water content and smaller differences with soil depth (Figure 5). Field
observations and laboratory data indicate that these differences can be ascribed to the textural
change (increasing clay content) in the soil profiles and to differences in water availability
and root distribution in each ecosystem. Overall results clearly indicate that alluvial soils of
an Andean river (Caquetá River) have a higher available water capacity than the soils of the
Tertiary Sedimentary plain.
Soil water content dynamics in the soils are shown in Figure 6. The mineral soil had a
high water content during most of the studied period in all ecosystems, with water availability
relatively low, primarily in the SP. Soil moisture slightly decreased during droughts (1997
and 2005), with the largest decrease occurring in the SP ecosystem. Measurements of soil
water pointed to the existence of high macroporosity, mainly in the upper part of the soil
profiles in all ecosystems (Tobón, 1999). Soils developed from the SP present lower water
availability and higher water content throughout the study period than soils from the alluvial
system of the River Caquetá, except for those in the FP which have the highest water content.
There are no considerable differences in water storage between identical depths among sites
within the same ecosystem, with exception of the SP, which exhibits large differences
between both sites and depths. Differences can be explained by the variations in soil texture
and position of plots on the slope. The eight depths at which water content was measured
allow the calculation of soil moisture depth.
Figure 5. Profiles of maximum (■) and minimum (●) measured soil water content during the
monitoring period in four forest ecosystems in Colombian Amazonia. Nova S
cienc
e Pub
lishe
rs, In
c.

Ecohydrology of Amazonian Rainforest Ecosystems 213
Figure 6. Soil water content dynamics at two soil depths (0.1 and 1.2 m) in a forestecosystem (SP), in
Colombian Amazonia.
As an example, Figure 7 presents the temporal dynamics in soil moisture for three soil
layers in the SP and HT. Water depth during the wet periods were almost similar for all
ecosystems with a slightly higher values in the FP. However, during dry periods, water depth
in the SP was higher than in the other ecosystems, which is consistent with the property of
these soils retaining high amounts of water at low matric potential.
Changes in water uptake from the soil among forest ecosystems were found to differ:
During the two dry periods (days 384 to 403 and days 445 until 461), the highest water
depletion was observed in the FP with 54.1 and 65.4 mm in each period.Differences in water
storage between soil layers within the same plot were observed during the dry periods when
the upper part of the soil profiles dried out differently in each ecosystem. In the SP
ecosystem, the upper 0.5 m of the crest profile showed the highest storage, and that in the
valley bottom the lowest. Nova S
cienc
e Pub
lishe
rs, In
c.
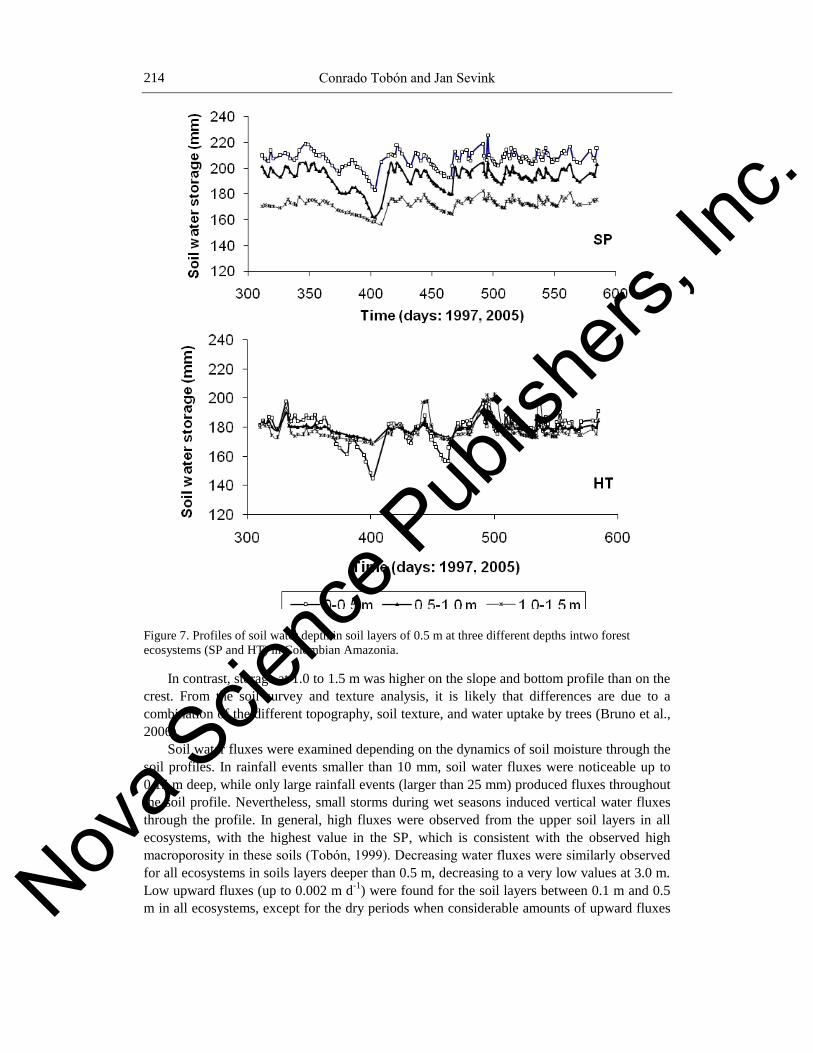
Conrado Tobón and Jan Sevink 214
Figure 7. Profiles of soil water depth in soil layers of 0.5 m at three different depths intwo forest
ecosystems (SP and HT) in Colombian Amazonia.
In contrast, storage at 1.0 to 1.5 m was higher on the slope and bottom profile than on the
crest. From the soil survey and texture analysis, it is likely that differences are due to a
combination of the different topography, soil texture, and water uptake by trees (Bruno et al.,
2006).
Soil water fluxes were examined depending on the dynamics of soil moisture through the
soil profiles. In rainfall events smaller than 10 mm, soil water fluxes were noticeable up to
0.15 m deep, while only large rainfall events (larger than 25 mm) produced fluxes throughout
the soil profile. Nevertheless, small storms during wet seasons induced vertical water fluxes
through the profile. In general, high fluxes were observed from the upper soil layers in all
ecosystems, with the highest value in the SP, which is consistent with the observed high
macroporosity in these soils (Tobón, 1999). Decreasing water fluxes were similarly observed
for all ecosystems in soils layers deeper than 0.5 m, decreasing to a very low values at 3.0 m.
Low upward fluxes (up to 0.002 m d-1
) were found for the soil layers between 0.1 m and 0.5
m in all ecosystems, except for the dry periods when considerable amounts of upward fluxes Nova S
cienc
e Pub
lishe
rs, In
c.
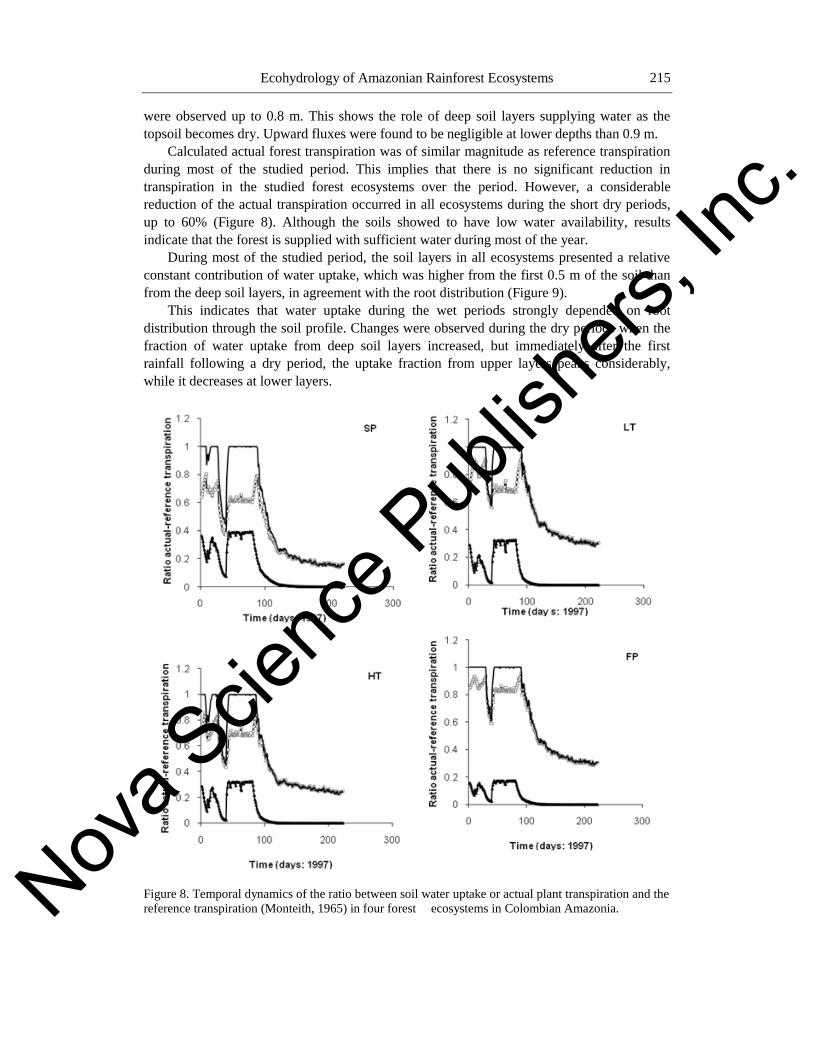
Ecohydrology of Amazonian Rainforest Ecosystems 215
were observed up to 0.8 m. This shows the role of deep soil layers supplying water as the
topsoil becomes dry. Upward fluxes were found to be negligible at lower depths than 0.9 m.
Calculated actual forest transpiration was of similar magnitude as reference transpiration
during most of the studied period. This implies that there is no significant reduction in
transpiration in the studied forest ecosystems over the period. However, a considerable
reduction of the actual transpiration occurred in all ecosystems during the short dry periods,
up to 60% (Figure 8). Although the soils showed to have low water availability, results
indicate that the forest is supplied with sufficient water during most of the year.
During most of the studied period, the soil layers in all ecosystems presented a relative
constant contribution of water uptake, which was higher from the first 0.5 m of the soil than
from the deep soil layers, in agreement with the root distribution (Figure 9).
This indicates that water uptake during the wet periods strongly depended on root
distribution through the soil profile. Changes were observed during the dry periods when the
fraction of water uptake from deep soil layers increased, but immediately after the first
rainfall following a dry period, the uptake fraction from upper layers peaks considerably,
while it decreases at lower layers.
Figure 8. Temporal dynamics of the ratio between soil water uptake or actual plant transpiration and the
reference transpiration (Monteith, 1965) in four forest ecosystems in Colombian Amazonia. Nova S
cienc
e Pub
lishe
rs, In
c.
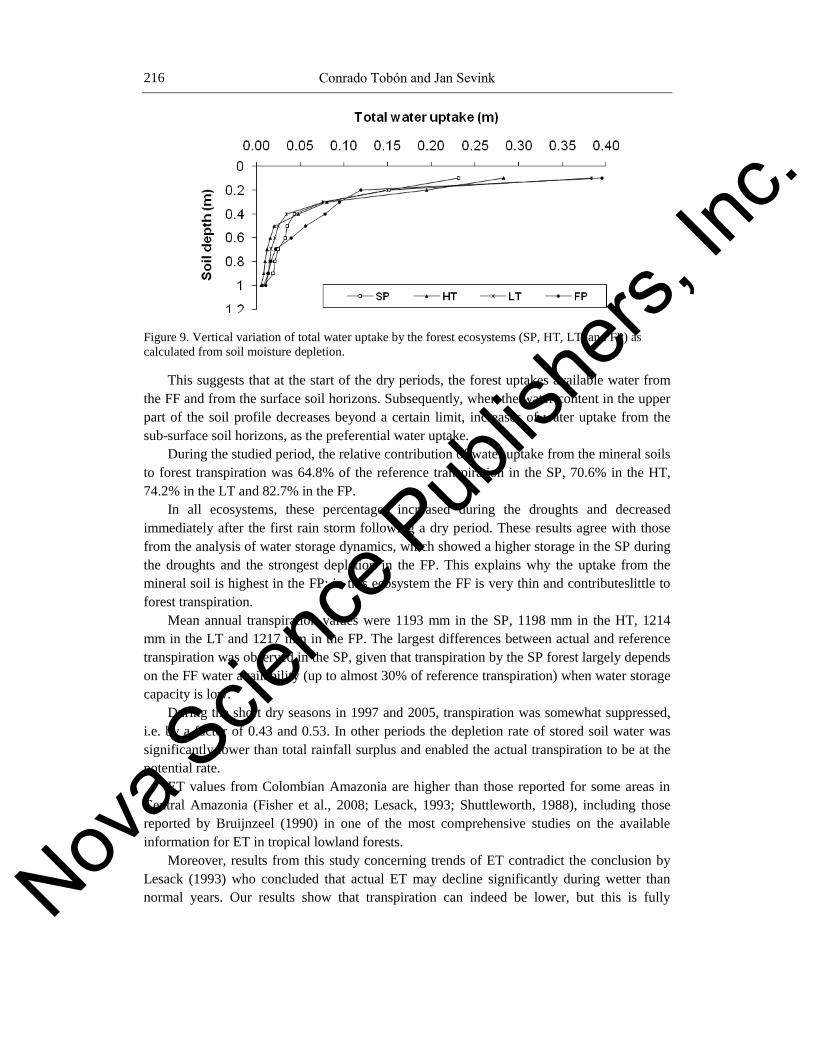
Conrado Tobón and Jan Sevink 216
Figure 9. Vertical variation of total water uptake by the forest ecosystems (SP, HT, LT, and FP) as
calculated from soil moisture depletion.
This suggests that at the start of the dry periods, the forest uptakes available water from
the FF and from the surface soil horizons. Subsequently, when the water content in the upper
part of the soil profile decreases beyond a certain limit, increases of water uptake from the
sub-surface soil horizons, as the preferential water uptake.
During the studied period, the relative contribution of water uptake from the mineral soils
to forest transpiration was 64.8% of the reference transpiration in the SP, 70.6% in the HT,
74.2% in the LT and 82.7% in the FP.
In all ecosystems, these percentages increased during the droughts and decreased
immediately after the first rain storm following a dry period. These results agree with those
from the analysis of water storage dynamics, which showed a higher storage in the SP during
the droughts and the strongest depletion in the FP. This explains why the uptake from the
mineral soil is highest in the FP: in this ecosystem the FF is very thin and contributeslittle to
forest transpiration.
Mean annual transpiration values were 1193 mm in the SP, 1198 mm in the HT, 1214
mm in the LT and 1217 mm in the FP. The largest differences between actual and reference
transpiration was observed in the SP, given that transpiration by the SP forest largely depends
on the FF water availability (up to almost 30% of reference transpiration) when water storage
capacity is low.
During the short dry seasons in 1997 and 2005, transpiration was somewhat suppressed,
i.e. by a factor of 0.43 and 0.53. In other periods the depletion rate of stored soil water was
significantly lower than total rainfall surplus and enabled the actual transpiration to be at the
potential rate.
ET values from Colombian Amazonia are higher than those reported for some areas in
Central Amazonia (Fisher et al., 2008; Lesack, 1993; Shuttleworth, 1988), including those
reported by Bruijnzeel (1990) in one of the most comprehensive studies on the available
information for ET in tropical lowland forests.
Moreover, results from this study concerning trends of ET contradict the conclusion by
Lesack (1993) who concluded that actual ET may decline significantly during wetter than
normal years. Our results show that transpiration can indeed be lower, but this is fully Nova S
cienc
e Pub
lishe
rs, In
c.

Ecohydrology of Amazonian Rainforest Ecosystems 217
compensated by evaporation of intercepted water. Our results also confirm the conclusion of
Bruijnzeel (1990), in the sense that values of ET can be substantially higher during wettest
years or in areas with high rainfall.
Our results point to a reduction in forest transpiration during the dry periods, while
available water capacity seems to be low, mainly in the SP. However, there are no clear
indications for any significant physiological effects caused by water deficits such as leaf
shedding or wilting. This is probably due to the short duration of the dry periods. Several
authors found that Amazonia forest withered during the drought in 2005 (Tomasella, et al.,
2011; Phillips, et al., 2009; Fisher, et al., 2008; Marengo et al., 2008a; Fisher, et al., 2007).
However, the research results did not yield any differences in leaf shedding from studied
forests, implying that in the systems studied, large soil water deficits are unlikely to occur.
Results of the quantification of the water balance for each compartment are presented in
Table 2. Comparing the water balances shows differences both between compartments and
among ecosystems in their water evaporation, uptake, and drainage. When considering results
of each individual ecosystem, a primary observation is that the percentage of evaporation
relative to gross rainfall was relatively constant over the years, although net values of
evaporation differ.
An exception is the years 1997 and 2005where this percentage increased in all
ecosystems. As to the forest canopy compartment, Table 2 shows that although the storage
depth of this canopy is low, in terms of intercepting incoming rainfall, the net annual
interception is considerably high and differs between ecosystems. Annual average
evaporation of intercepted water was 366 mm in the SP, 361 mm in the HT, 405 mm in the
LT, and 508 mm in the FP.
The water balance for the four forest ecosystems indicated that transpiration was
relatively constant through the studied period in all ecosystems. This is not surprising since
rainfall is well distributed, and FF and soil water storage was showed to be a sufficient
reservoir to meet forest transpiration demands during most of the studied period. This actual
transpiration appeared to be larger in the FP than in the other ecosystems, while in the SP it
was lowest.
Comparison of the temporal dynamics of discharge with incoming net rainfall indicates
that the fraction of discharge differs between years, with the highest value during 1996 in all
ecosystems, and between ecosystems, ranging from 52% to 58% with the lowest value for the
FP, in agreement with the highest interception and transpiration in this ecosystem. These
percentages are higher than most values reported for the Amazonia forests (Elsenbeer and
Cassel, 1991; Poels, 1987), but similar to that by Lesack (1993). However, we have to
consider that gross rainfall is considerably higher in the Colombian Amazonia.
It is clear from Table 2 that the water balance surplus is almost zero, which is explained
by the nature of the calculations applied, which balance inputs and outputs, and by the
changes of FF and soil water storage.
Additionally, soil water storage did not change considerably over the years, while in FF
relatively large changes occurred. Larger changes could be expected to occur in the forest
floor and the mineral soil at the end of the dry period.
Nova S
cienc
e Pub
lishe
rs, In
c.
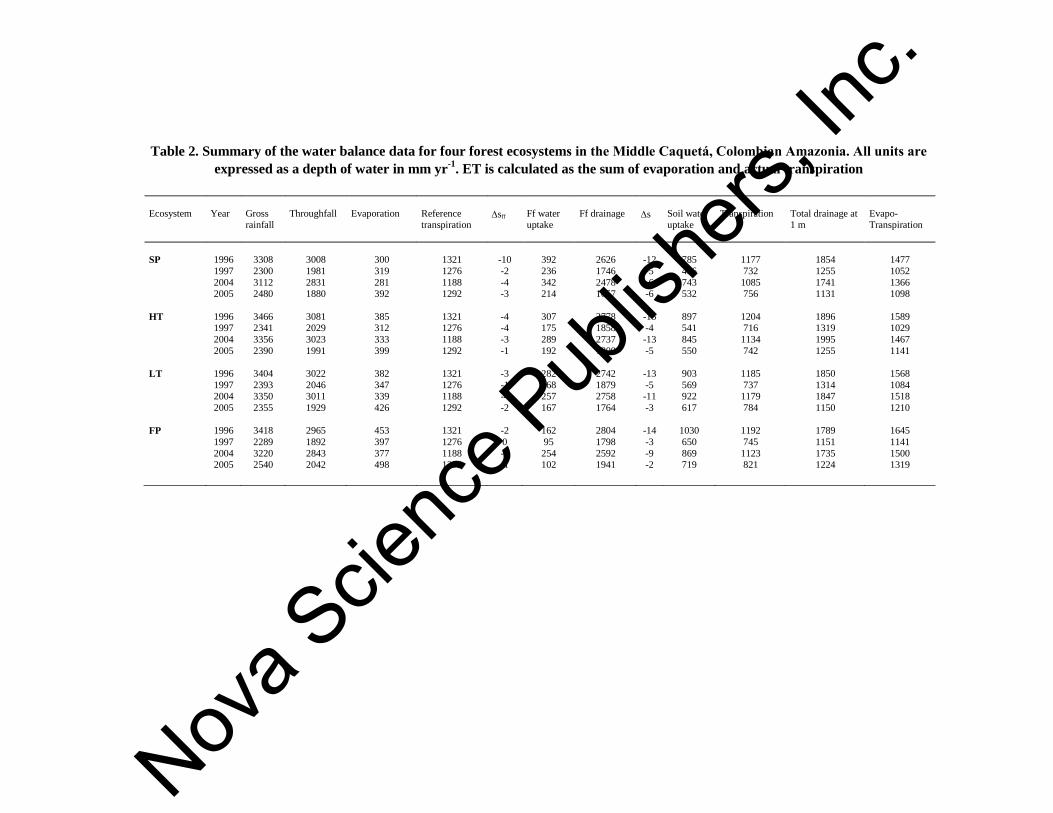
Table 2. Summary of the water balance data for four forest ecosystems in the Middle Caquetá, Colombian Amazonia. All units are
expressed as a depth of water in mm yr-1
. ET is calculated as the sum of evaporation and actual transpiration
Ecosystem
Year
Gross rainfall
Throughfall
Evaporation
Reference transpiration
sff
Ff water uptake
Ff drainage
s
Soil water uptake
Transpiration
Total drainage at 1 m
Evapo- Transpiration
SP 1996 3308 3008 300 1321 -10 392 2626 -12 785 1177 1854 1477
1997 2300 1981 319 1276 -2 236 1746 -5 496 732 1255 1052
2004 3112 2831 281 1188 -4 342 2478 -6 743 1085 1741 1366
2005 2480 1880 392 1292 -3 214 1657 -6 532 756 1131 1098
HT 1996 3466 3081 385 1321 -4 307 2778 -15 897 1204 1896 1589
1997 2341 2029 312 1276 -4 175 1858 -4 541 716 1319 1029
2004 3356 3023 333 1188 -3 289 2737 -13 845 1134 1995 1467
2005 2390 1991 399 1292 -1 192 1800 -5 550 742 1255 1141
LT 1996 3404 3022 382 1321 -3 282 2742 -13 903 1185 1850 1568
1997 2393 2046 347 1276 -1 168 1879 -5 569 737 1314 1084
2004 3350 3011 339 1188 -4 257 2758 -11 922 1179 1847 1518
2005 2355 1929 426 1292 -2 167 1764 -3 617 784 1150 1210
FP 1996 3418 2965 453 1321 -2 162 2804 -14 1030 1192 1789 1645
1997 2289 1892 397 1276 0 95 1798 -3 650 745 1151 1141
2004 3220 2843 377 1188 -3 254 2592 -9 869 1123 1735 1500 2005 2540 2042 498 1292 -1 102 1941 -2 719 821 1224 1319
Nova S
cienc
e Pub
lishe
rs, In
c.
Ecohydrology of Amazonian Rainforest Ecosystems 219
CONCLUSION
Average annual rainfall in Northwest Amazonia was found to be around 3,400 mm yr-1
,
mostly falling in small showers during the afternoon and at night, with events of short
duration. The hydrological functioning of forest ecosystems showed that the SP ecosystem
has the highest percentage of net precipitation relative to gross rainfall, and the FP the lowest
of the studied forests. The observed differences in throughfall, stemflow, and evaporation
between ecosystems can partly be attributed to differences in forest structure: In the canopy
this study clearly demonstrated that rainfall interception is a function of structural forest
characteristics e.g. canopy cover and LAI. Ecosystem forest floors results showed similar
drainage dynamics, but amounts of water retained were found to be different for each ecosystem.
The FF in the SP consistently had the lowest water content and dried out to a greater extent than
other ecosystems. In terms of water storage, the SP showed the highest values during the studied
period, while the FP showed the lowest. Differences between ecosystems in FF water storage
amounts areprimarily the result of differences in the FF thickness and to a lesser extent their
moisture conditions.
Measured forest floor and soil water content dynamics indicate that there are high vertical
water fluxes from the FF to the mineral soil, with the highest in the SP. On average, 34% of
the SP forest transpiration was supplied by the FF, whereas in the FP, the FF contributed
toonly 14% ofthe forest transpiration. The contribution of the mineral soil to the total forest
transpiration during the study period differed between ecosystems, ranging from 63% to 79%
of the reference transpiration. Differences are explained by the differences in the root
distribution between ecosystems and the respective contribution of the forest floor to
transpiration. Though rainfall reduces considerably in 2005, there was no long shortage of
water for the vegetation in this part of the Amazonia. Thus, rainfall distribution is the key
factor to maintain forest transpiration at the potential rate, and the FF and soil water storage
capacity of undisturbed forests is high enough to meet forest ET demands during most dry
periods.
Recent research demonstrated the important role played by deep roots to supply water to
the forest in central Amazonia (Hodnett et al., 1996; Nepstad et al., 1994). This raises the
question to whether such a phenomenon is more widespread. This research suggests that this
is not the case in the study area. A truly dry period was found to not exist, and the short dry
period (January to February) did not last long enough to significantly affect forest
transpiration. Moreover, fine roots appeared to be concentrated in the FF and on top of the
mineral soil in ecosystems studied. As to the substrate, water supply to the forests is largely
determined by the moisture conditions in the FF and mineral topsoil. Therefore, neither lack
of moisture stress nor lack of oxygen can explain the concentration of fine roots in the FF and
top of the mineral soils. It is therefore concluded that root distribution most probably is
determined by soil chemistry, notably gradients in nutrient availability rather than by
moisture.
This research indicates that the impact of deforestation onchanges the hydrology of a
system at the local scale remains largely unclear, and will be very site dependent. For
example, trends in changes of transpiration due to land-use changes are diverse and difficult
to predict without comparable data, or without making broad assumptions. Results from this
research indicate that at least in the short term, removal of forest will cause increases in Nova S
cienc
e Pub
lishe
rs, In
c.
Conrado Tobón and Jan Sevink 220
streamflow. For the research sites, although some bare soil evaporation can be expected,
streamflow is expected to be about 1,600 mm yr-1
, larger than at the present, simplydue to the
reduction in interception and transpiration. The situation, however, can be complex, as for
example with the effect of large scale land-use changes on the eastern slopes of the Andes.
The seasonal distribution of rainfall in the east is reflected in the fluctuations of the water
level of the River Caquetá (changes of about 10m). Any change in the river discharge in the
upper part of the basin of the River Caquetá, whether induced by changes in climate resulting
from changes in land use in the Amazon basin, or by changes in hydrology of the Andean
slopes, will directly affect the hydrological functioning of large areas in Andean rivers.
ACKNOWLEDGMENT
Thanks to the Universidad Nacional de Colombia for the time to pursue de research and
the time to write this paper. I like to thank the Dutch Tropenbos Foundation for the financial
support to the project. Thanks to the Nonuya indigenous community in the Middle Caquetá –
Colombia, for their support to the field work and hospitality. To the memory of Sebastian
“tocayo” (RIP), my unforgettable field assistance during the entire field work.
REFERENCES
Álvarez, D. E. (1993). Composición florística, diversidad, estructura y biomasa de un bosque
inundable, en la Amazonia Colombiana. Ir. Dissertation, Universidad de Antioquia,
Colombia. 550 pp.
Botero P. (1984). Relación fisiografía-suelo-aptitud de la tierra en la Amazonia colombiana.
Revista CIAF 9 (1): 3-25. IGAC, Bogotá.
Bruijnzeel, L.A. (1990). Hydrology of moist tropical forests and effects of conversion: a state
of knowledge review. UNESCO, Paris. 36 pp.
Bruno, R.; da Rocha, H.; de Freitas, H.; Goulden, M.; Miller, S. (2006). Soil moisture
dynamics in an eastern Amazonian tropical forest. Hydrological Processes, 20:12 15. p.
2477 – 2489.
Chauvel, A., Grimaldi, M. and Tessier, D. (1991). Changes in soil pore space distribution
following deforestation and revegetation: an example from the central Amazonia Basin,
Brazil. For. Ecol. and Manage., 38: 259-271.
Cuevas, E. and Medina, E. (1988).Nutrient dynamics within Amazonian forest ecosystems. II.
Fine root growth, nutrient availability and leaf litter decomposition. Oecologia, 76: 222-
235.
Duivenvoorden, J. F. (1995). Tree species composition and rainforest-environment
relationships in the Middle Caquetá area, Colombia, NW Amazonia. Vegetatio, 120: 1-
113.
Duivenvoorden, J. M. and Lips, J. M. (1995).A land-ecological study of soils, vegetation and
plant diversity in Colombian Amazonia.Ph.D. Dissertation, Landscape and
Environmental Research Group, Faculty of Environmental sciences, University of
Amsterdam.Tropenbos Series 12, Wageningen.438 pp. Nova S
cienc
e Pub
lishe
rs, In
c.
Ecohydrology of Amazonian Rainforest Ecosystems 221
Duivenvoorden J. F. and J. Lips.(1993). Ecología del Paisaje del Medio Caquetá. Memoria
explicativa de los mapas.Tropenbos Colombia, Santafé de Bogotá. 301 pp.
Elsenbeer, H. and Cassel, D. K. (1991).The mechanisms of overland flow generation in a
small catchment in western Amazonia. In: water management of the Amazon basin,
edited by B.P.F. Braga and C.A. Fernandez-Jauregui,.213-220 pp, UNESCO,
Montevideo, Uruguay.
Fisher, R., Williams, M., Ruivo, M., de Costa, A., Meir, P. (2008). Evaluating climatic and
soil water controls on evapotranspiration at two Amazonian rainforest sites. Agricultural
and forest meteorology: 148: 850-861.
Fisher, R. A.; Williams, M.; da Costa, L; Malhi, Y.; da Costa F.; Almeida, S.; Meir, P.
(2007). The response of an Eastern Amazonian rainforest to drought stress: results and
modelling analyses from a throughfall exclusion experiment. Global Change Biology vol.
13 issue 11 p. 2361-2378.
Gash, J. H. C., Nobre, C. A., Roberts, J. M. and Victoria, R. L. (1996).An overview of
ABRACOS. In: Amazonian Deforestation and Climate. John Wiley and Sons, Chichester,
United Kingdom.611 pp.
Golley, F. B. (1983). The abundance of energy and chemical elements. In Golley, F. B. (ed)
1983a Tropical rainforest ecosystems. Elsevier, Amsterdam, pp. 101-115.
Hertwitz, S. R. (1985). Interception storage and capacities of tropical rainforest canopy trees.
J. of Hydrol. 77: 237-252.
Hodnett, M. G.,Oyama, M. D. and Tomasella, J. (1996). Comparisons of long-term soil water
storage under pasture and forest in three areas of Amazonia. In: J. H. C. Gash, C. A.
Nobre, J. M. Roberts and R. L. Victoria (Ed.). Amazonia deforestation and Climate. Pp.
57-77. John Wiley and Sons Ltd.
Hölscher, D., Sá, T. D. de A., Bastos, T. X., Denich, M. and Fölster, H. (1997).Evaporation
from young secondary vegetation in eastern Amazonia. J. of Hydrol. 193: 293-305.
Hutjes, R. W. A., Wierda, A. and Veen, A. W. L. (1990). Rainfall interception in the Tai
forest, Ivory Coast: Application of two simulation models to a humid tropical system. J.
of Hydrol. 114: 259-275.
Jetten, V. G. (1996). Interception of tropical rainforest: Performance of a canopy water
balance model. Hydrol. Process, Vol. 10: 671-685.
Jordan, C. F. (1989). An Amazon rainforest: the structure and function of a nutrient stressed
ecosystem and the impact of slash-and-burn agriculture. Man in the Biosphere series Vol.
2. UNESCO, Paris, and the Parthenon Publ. Group.Ltd, UK.
Köppen, W. (1936).Das geographische System der Klimate. In: Handbuch der Klimatologie.
Verlag Gebrüder Borntraeger, Berlin, 44 pp.
Laurance, W. F. (1998). A crisis in the making: responses of Amazonian forests to land use
and climate change. Trends in Ecology and Evolution vol. 13 issue 10. p. 411-415.
Leopoldo, P. R., Franken, W., Salati, E. and Ribeiro, M. N. (1987). Towards a water balance
in central Amazonia region. Experentia 43 (1987), BirkhäuserVerlag, Basel/Switzerland.
Leopoldo, P. R., Franken, W. and Villa Nova, N. (1995). Real evaporation and transpiration
through a tropical rainforest in central Amazonia as estimated by the water balance
method. For. Ecol. Manag. 73: 185-195.
Lesak, L. F. W. (1993). Water balance and hydrologic characteristics of a rainforest
catchment in the Central Amazon Basin. Water Resour. Res. 29 (3): 759-773. Nova S
cienc
e Pub
lishe
rs, In
c.
Conrado Tobón and Jan Sevink 222
Lesack, L. F. W. and Melack, J. M. (1991).The deposition, composition and reference sources
of major ionic solutes in rain of the central Amazon Basin. Water Resour. Res. 27: 2953-
2978.
Lips J. M., Duivenvoorden J. F. (1990). Estudios de suelos en la Amazonia colombiana.
TROPENBOS. Colombia.
Londoño, V. C. (1993). Análisis estructural de dos bosques asociados a unidades fisiográficas
contrastantes, en la region de Araracuara (Amazonia Colombiana). Ir. Dissertation,
Universidad Nacional de Colombia. 478 pp.
Longman, K. A. and Jeník, J. (1990).Tropical forest and its environment.Longman Scientific
and technical Ed. 1990.347 pp.
Malhado, A; Whittaker, R.; Malhi, Y; Ladle, R.; terSteege, H; Phillips, O; Aragão, L.; Baker,
T.; et al. (2010). Are compound leaves an adaptation to seasonal drought or to rapid
growth? Evidence from the Amazon rainforest.Global Ecology and Biogeography vol. 19
issue 6. p. 852-862.
Marengo J. A, Nobre C. A, Tomasella J, Oyama M. D, Oliveira G. S, de Oliveira R, Camargo
H, Alves L. M, Brown I. F. (2008a). The drought of Amazonia in 2005. Journal of
Climate 21: 495–516.
Mejía, L., Botero, P., y Montoya, A. (1980). Levantamiento detallado y semidetallado de los
suelos de Araracuara. Centro Interamericano de Foto interpretación CIAF, Bogotá.
213 pp.
Milliken, W; Zappi, D; Sasaki, D; Hopkins, M; P, Toby.(2010). Amazon vegetation: how
much don‟t we know and how much does it matter?.Kew Bulletin vol. 65 issue 4 p. 691 –
709.
Nepstad, D. C., de Carvalho, C. R., Davidson, E. A., Jipp, P. H., Lefebvre, P. A., Negreiros,
G. H., da Silva, E. D., Trumbore, S. E. and Vieira, S. (1994). The role of deep roots in the
hydrological and carbon cycles of Amazonian forests and pastures. Nature, 372: 666-669.
Nobre, C. A., Sellers, P. and Shukla, J. (1991). Amazonia deforestation and regional climate
change. J. Climate, 4: 957-988.
Pitman, J. I. (1989). Rainfall interception by bracken litter-relationship between biomass,
storage and drainage rate. J. of Hydrol. 111: 281-291.
Phillips O. L, et al. (2009).Drought sensitivity of the Amazon rainforest. Science 323 (5919):
1344–1347.
Poels, R. (1987). Soils, water and nutrients in a forest ecosystem in Suriname.Ph.D. thesis,
Agricultural University of Wageningen, the Netherlands.
Pradham, I. P.(1973). Preliminary study of rainfall interception through leaflitter. Indian For.,
99: 440-445.
Putuhena, W. and Cordery, I. (1996).Estimation of interception capacity of forest floor. J. of
Hydrol. 180: 283-299.
Sala, S; Duque, S; Núñez, M; Lamaro, A. (2002).Diatoms from the Colombian
Amazonia.CryptogamieAlgologie vol. 23 issue 1. p. 75-99.
Salati, E., Dall‟olio, A., Matsui, E. and Gat, J. R. (1979).Recycling of water in the Amazon
Basin: an isotopic study. Water Resour. Res. 15: 67-71.
Salati, E. andVose, P.B. (1984). Amazon Basin: a system in equilibrium. Science, 225: 129-
138.
Shukla, J., Nobre, C. and Sellers, P. J. 1990. Amazon deforestation and climate change.
Science, 247: 1322-1325. Nova S
cienc
e Pub
lishe
rs, In
c.

Ecohydrology of Amazonian Rainforest Ecosystems 223
Shuttleworth, W. J. (1988). Evaporation from Amazonian rainforest. Proc. R. Soc. London,
B233, 321-346.
Soil Survey Staff. 2010. Keys to Soil Taxonomy, 11th ed. USDA-Natural Resources
Conservation Service, Washington, DC.
Tiessen, H., Cuevas, E. and Chacón, P. (1994).The role of soil organic matter in sustaining
soil fertility. Nature, 371: 783-785.
Tobón Marin, C., Bouten, W., Sevink, J. (2000a). Gross rainfall and its partitioning into
throughfall, stemflow and evaporative loss in four forest ecosystems in western
Amazonia. J. of Hydrol. Vol. 237(1-2): 40-57.
Tobón Marin, C., Bouten and S. Dekker.(2000b). Forest floor water dynamics and root water
uptake in four forest ecosystems in northwest Amazonia. J. of Hydrol. Vol. 237 (1-2):
169-183.
Tobón, C. 1999. Monitoring and modelling hydrological fluxes in support of nutrient cycling
studies in Amazonian rainforest ecosystems. Tropenbos series17, Wageningen, the
Netherlands.169 pp.
Tomasella, J., L. S. Borma, J. A. Marengo, D. A. Rodríguez, L. A. Cuartas, C. A. Nobre, and
M. C. R. Prado.(2011).The droughts of 1996 1997 and 2004 2005 in Amazonia:
Hydrological response in the river main‐stem. Hydrol. Processes, 25, 1228–1242.
Ubarana, V. N. (1996). Observations and modelling of rainfall interception at two
experimental sites in Amazonia.In: Amazonian deforestation and climate, edited by J. H.
C. Gash, C. A. Nobre, J. M. Roberts and R. L. Victoria. Ed. John Wiley and Sons.611 pp.
Vasconcelos, H.; Vilhena, J.; Facure, K.; Albernaz, A. (2000).Patterns of ant species diversity
and turnover across 2000 km of Amazonian floodplain. Forest Journal of Biogeography
vol. 37 issue 3. p. 432-440.
Wittmann, F; Parolin, P. (2005).Aboveground Roots in Amazonian Floodplain Trees.
Biotropica vol. 37 issue 4 December 2005. p. 609-619.
Wright, I. R., Gash, J. H., da Rocha, H. R., Shuttleworth, W. J., Nobre, C. A., Maitelli, G. T.,
Zamparoni, C. A. and Carvalho, P. (1992). Dry season micrometeorology of central
Amazonian ranchland. Q.J.R. Meteorol. Soc. 118: 1083-1099.
Nova S
cienc
e Pub
lishe
rs, In
c.

Nova S
cienc
e Pub
lishe
rs, In
c.
INDEX
A
abatement, 96
Acacia mangium, vii, 129, 137, 146, 147, 148,
150, 152, 155, 156, 172, 173, 174, 175, 176
access, 18, 59, 60, 70, 75, 89
accommodation, 77, 90, 92
accounting, 57, 73, 78, 80, 87, 88, 89, 90, 92, 93,
94, 96, 114, 116, 117, 121, 122
acid, 19, 47, 101, 130, 138, 147, 152, 159, 165,
175
acidic, vii, 156, 157, 171, 178, 179, 184
acidity, 128, 129, 130, 134, 143, 171, 181
activated carbon, 53
actuation, 190, 193
adaptability, 130
adaptation, 13, 40, 41, 116, 222
adaptations, 41
administrative efficiency, 78
adsorption, 24
adults, 190
advancements, 77
aesthetics, 5
Africa, 12, 17, 18, 19, 22, 26, 28, 29, 30, 41, 130,
168, 171
agaric (fleshy mushroom), 16
age, 56, 59, 81, 83, 85, 86, 87, 91, 99, 102, 103,
106, 107, 117, 121, 123, 193
agencies, 27
aggregation, 147, 182
agricultural pasture, 3
agricultural sector, 13, 74, 88, 95
agriculture, 12, 14, 15, 19, 24, 31, 47, 113, 118,
121, 128, 147, 149, 151, 221
Agroforestry, v, vi, 95, 113, 116, 125, 127, 134
air temperature, 206
alcohols, 181
aldehydes, 181
allometry, 78, 82
alters, 47, 50
Amazonia forest, 204, 209, 217
AMF, 36, 37, 40, 42, 43, 45, 46, 128, 129, 130,
132, 133, 134, 135, 136, 137, 138, 140, 141,
142, 143, 144, 145
amino, 19, 35, 183
amino acid, 19, 35
amino acids, 19, 35
ammonia, 35
ammonium, 61, 139, 141, 150, 159
amphibia, 202
amphibians, 190, 201
amplitude, 101
Andes mountain, 177
Andisol, 132, 177
animal husbandry, 19
annihilation, 24
ANOVA, 139, 144, 160, 169, 195, 209
antagonism, 24
aquaculture, 100
arbuscular mycorrhizal fungal communities, vii,
34, 35, 49, 50
arbuscular mycorrhizal fungi, 36, 47, 48, 51, 147,
148, 149, 151, 152, 153, 154
Arid, v, 51, 53, 73, 74, 75
aromatic rings, 181
ascorbic acid, 19
ASI, 125
Asia, 19, 22, 106, 110, 130
assessment, 6, 8, 10, 47, 75, 78, 81, 86, 90, 93, 94,
96, 152, 203, 205
assets, 4, 5, 6, 7, 8, 79
asymptomatic, 24, 151
atmosphere, 17, 80, 114, 115, 118, 203 Nova S
cienc
e Pub
lishe
rs, In
c.
Index 226
atmospheric deposition, 170, 175
authorities, viii
authority, 157
awareness, 29, 34
B
bacteria, 21, 23, 24, 35, 36, 48, 51, 130, 156, 170,
171
Bangladesh, 110
barriers, 12, 54, 72
base, 39, 86, 138, 205, 209
bauxite, 61, 73
BD, 181
beef, 2
benefits, 2, 3, 4, 5, 6, 7, 8, 9, 10, 11, 15, 19, 25,
36, 46, 78, 93, 94, 118, 119, 130, 134, 145,
179, 186, 204
beverages, 19, 178
bioaccumulation, 21
bioavailability, 128, 131, 146
biochemistry, 110
bioconversion, 19
biodegradation, 24
biodiesel, 53, 67, 74
biodiversity, vii, 1, 2, 3, 4, 5, 6, 7, 8, 9, 10, 11, 12,
14, 19, 22, 25, 26, 29, 30, 31, 34, 35, 36, 39,
46, 47, 49, 51, 54, 78, 89, 94, 95, 113, 116,
119, 154, 179, 201, 203, 204
Biodiversity, 1, iii, v, 1, 2, 3, 4, 6, 8, 14, 25, 29,
30, 189, 203
biodiversity loss, 1, 2, 6, 8
bioenergy, vii, 53, 54, 67, 70, 71, 73, 74, 88, 95
Bioenergy, v, 53, 74, 95, 96, 124, 173
biofuel, 24, 74
biogas, 24
biogeochemical cycles, vii, 20, 155, 156, 171,
172, 204
biogeography, 19, 94
bioindicators, 20
bio-indicators, 26
biological activity, 170
biological control, 19
biological processes, 4, 78, 80
biological responses, 78, 79
Biomass, vi, 56, 59, 74, 86, 93, 96, 110, 111, 124,
125, 152, 167, 173, 174, 177, 178, 181, 182
biomass growth, 56, 57, 63, 65, 67, 71, 80, 81, 86
biomolecules, 21
bioremediation, 19, 24, 134, 144, 156
Biosequestration, v, 53, 61
biotechnology, 16, 19
biotic, 35, 37, 205
biotin, 19
boreal forest, 12, 114, 115, 126, 129
Boreal forest, 114, 118, 126
bounds, 9
Brazil, 14, 47, 173, 176, 220
Burkina Faso, 37
burn, 221
businesses, 7
C
calcium, 128, 130
calibration, 78, 81, 96
Cameroon, 47, 129, 151
carapace, 193
carbohydrate, 19, 23
carbohydrates, 129
Carbon, 1, iii, v, 13, 50, 53, 54, 58, 73, 74, 75, 77,
79, 80, 81, 86, 87, 90, 93, 94, 95, 96, 99, 102,
110, 111, 113, 116, 117, 121, 122, 124, 125,
126, 176, 187
carbon dioxide, 113, 114, 115, 123
carbon emissions, 13
Carbon isotope, 110, 111
Carbon sequestration, 13, 50, 74, 75, 95, 114, 124,
125
carbonyl groups, 180
Caribbean, 200
case study, 50, 90, 125, 173
catchments, 91
categorization, 16
cation, 156, 165, 177, 205
cattle, 18
CEC, 165, 166, 177, 181, 183, 185
cellulose, 175, 177, 178, 179, 180, 181
Census, 126
certificate, 88, 96
certification, 88, 90
challenges, vii
charm, 30
chemical, 21, 24, 27, 35, 43, 45, 46, 100, 130,
131, 141, 144, 149, 156, 158, 159, 169, 177,
179, 181, 182, 184, 185, 202, 205, 221
chemical properties, 141, 144, 159, 179
chemical stability, 131
chemicals, 19, 24, 37
Chile, 94 Nova S
cienc
e Pub
lishe
rs, In
c.
Index 227
China, viii, 51, 99, 100, 101, 104, 105, 106, 108,
109, 110, 111, 152, 176, 187
circulation, 170, 187, 204
City, 15, 30, 31
classes, 87, 121, 208
classification, 206
clean air, 5, 7
clean energy, 13, 73
climate, vii, 2, 13, 18, 21, 26, 28, 29, 37, 39, 78,
80, 81, 85, 87, 88, 106, 109, 113, 115, 116,
118, 124, 189, 191, 203, 204, 205, 220, 221,
222, 223
climate change, vii, 13, 26, 29, 78, 88, 109, 113,
115, 116, 124, 221, 222
Climate change, 13, 114, 115, 126
climates, 21, 59, 178
climatic shifts, 190
clusters, 40
CMC, 186
CNS, 159
CO2, 24, 61, 73, 100, 102, 110, 124, 177, 178,
179, 204
coal, 173, 175, 187
coastal ecosystems, 100, 111
collaboration, 27, 200
colonisation, 48
colonization, 36, 43, 44, 45, 110, 130, 135, 138,
139, 142, 143, 150, 206
color, 182
combustion, 159
commerce, 18, 19, 24
commercial, 18, 53, 67, 85, 90, 119, 185
commodity, 1, 11
communication, 77, 78, 92, 115, 118
communities, vii, 3, 12, 17, 18, 34, 35, 36, 37, 42,
43, 45, 46, 47, 48, 49, 50, 74, 94, 117, 128
community, 2, 6, 7, 19, 20, 23, 25, 26, 36, 37, 39,
42, 45, 47, 48, 50, 51, 101, 187, 220
compaction, 157
compatibility, 41
compensation, 10, 92
competition, 20, 23, 40, 63
competitive advantage, 130
competitors, 24
compilation, 121
complement, 180
complexity, 2, 87, 130, 201
compliance, 88
composition, 19, 20, 23, 26, 28, 36, 37, 38, 40, 42,
46, 49, 74, 111, 114, 128, 155, 167, 169, 175,
177, 178, 179, 181, 184, 185, 187, 205, 210,
220, 222
composting, 21
compounds, 19, 35, 42, 45, 127, 128, 130, 131,
132, 133, 170, 171, 180
comprehension, 81
conceptualization, 15, 17, 25
conference, 27, 28
configuration, 16
Congo, 148, 172, 173
Congress, 29, 201
conifer, 128, 140, 142
connectivity, 21, 34
consciousness, 16
conservation, 1, 5, 6, 7, 8, 10, 11, 12, 13, 14, 15,
21, 26, 27, 29, 30, 34, 39, 54, 64, 77, 88, 89,
90, 91, 92, 110, 173, 190, 194, 201
Conservation, 12, 14, 28, 29, 30, 109, 124, 189,
201, 202, 203, 223
conservation planning, 6
conserving, 11
constituents, 128
construction, 7, 11, 27
consumers, 7, 18, 19
consumption, 3, 5, 34, 68
contaminated soil, 14
contaminated soils, 14
contamination, viii, 186
continuous data, 81
contour, 66
control measures, 78
controversies, 22
Convention on Biological Diversity, 2, 14
convergence, 13, 73, 95
cooperation, 29
copper, 36
correction factors, 85
correlation, 116, 160, 165, 166, 167, 169, 170
correlation coefficient, 160, 165, 166
correlations, 160
cortex, 45, 132
cost, 1, 7, 9, 10, 11, 13, 53, 64, 66, 67, 70, 77, 90,
92, 93, 108, 117, 145
Costa Rica, 28, 129, 130, 174
cost-benefit analysis, 9
counterbalance, 49
covering, 16, 205
critical value, 168
crop, vii, 13, 19, 31, 80, 136, 140, 141, 147, 151,
175, 179, 206 Nova S
cienc
e Pub
lishe
rs, In
c.

Index 228
crop production, vii
crops, vii, 34, 128, 138, 143, 148, 153, 204
crown, 80, 89, 121
crowns, 82
crude oil, 28, 29
cultivars, 50, 146, 147
cultivation, 16, 18, 30, 31, 119, 178, 185, 206
culture, 27, 37, 149
current limit, 115
cycles, vii, 20, 37, 43, 155, 156, 171, 172, 204,
222
cycling, 2, 21, 22, 31, 34, 35, 39, 43, 46, 126, 128,
129, 130, 145, 148, 154, 168, 173, 175, 176,
178, 187, 205, 223
cytotoxicity, 50
D
damages, 5, 198, 199
danger, 18
data collection, 123, 204
data set, 81
database, 71, 81, 121
decay, 20, 28, 100, 107, 108, 129, 155
decision-making process, 2
decomposition, 20, 21, 22, 25, 27, 28, 31, 35, 42,
45, 48, 68, 80, 100, 106, 107, 109, 111, 114,
118, 122, 129, 146, 155, 156, 160, 163, 164,
169, 170, 171, 172, 173, 174, 175, 176, 178,
184, 186, 187, 220
deficiency, 85, 128, 139
deficit, 114, 168
deforestation, 18, 26, 43, 80, 186, 190, 203, 204,
219, 220, 221, 222, 223
degradation, 2, 13, 42, 47, 54, 156, 170, 178, 182,
190
Degradation, 34, 89
Delta, 30
Department of Agriculture, 74, 75, 97
deposition, 43, 48, 107, 110, 222
deposits, 20, 56
depression, 59
depth, 61, 62, 66, 82, 99, 100, 102, 103, 104, 105,
106, 107, 108, 111, 129, 157, 159, 206, 207,
211, 212, 213, 214, 217, 218
desorption, 147
destruction, 201
detection, 74
developed countries, 18, 19
developing countries, 18, 30, 150
developing nations, 18, 27
deviation, 162, 166
diesel fuel, 67
diffusion, 127, 131, 133
digestion, 15, 23
direct investment, 70
discrimination, 109
diseases, vii, 114, 116
dispersion, 193
displacement, 42, 197, 198
distilled water, 102
distribution, 16, 18, 19, 23, 30, 42, 47, 50, 86,
102, 114, 151, 184, 190, 192, 194, 195, 201,
202, 203, 207, 212, 215, 219, 220
diversification, 40, 54, 64, 72
diversity, vii, 2, 8, 9, 12, 17, 18, 19, 20, 21, 22,
23, 24, 26, 28, 29, 30, 31, 35, 40, 41, 42, 43,
46, 47, 49, 50, 51, 89, 94, 111, 118, 130, 136,
146, 154, 186, 203, 206, 209, 220, 223
DOI, 74
domestication, 18, 27, 28
dominance, 23, 130, 169
double bonds, 181
double counting, 8
drainage, 59, 203, 206, 207, 210, 211, 217, 219,
222
drought, 24, 91, 94, 114, 116, 128, 151, 217, 221,
222
droughts, 114, 204, 212, 216, 223
drugs, 26
dry matter, 19, 83, 135, 148, 159, 160, 163, 164,
167
drying, 102
durability, 193, 195
dynamism, 26
E
ECM, 128, 129, 130
Ecohydrology, vi, 203, 204
ecological data, 92
Ecological Impacts, 34
ecological indicators, 89
Ecological Interaction, 189
ecological management, 89
ecological processes, 10, 15, 35, 100
ecological roles, 17
ecological structure, 4, 5, 6, 10
ecological systems, 78
ecology, vii, 16, 31, 34, 110, 128, 173, 179 Nova S
cienc
e Pub
lishe
rs, In
c.
Index 229
economic activity, 5
economic development, 93
economic downturn, 116
economic evaluation, 14
economic goods, 2
economic incentives, 6
economic theory, 1
economic values, 4, 11
economics, 6, 12, 13
Ecosystems, v, vi, 1, 2, 12, 34, 73, 95, 124, 125,
126, 176, 186, 203
edible mushroom, 18
editors, 175
effluent, 24
effluents, 19
electricity, 13, 53, 67, 68, 70, 88
electron, 181
electron microscopy, 181
electrophoresis, 37
emission, 61, 68, 81, 113, 114, 120, 122
empirical studies, 22
encouragement, viii
endangered, vii, 148, 190
endangered species, vii
energy, 7, 13, 20, 23, 40, 54, 67, 72, 73, 74, 82,
87, 221
energy efficiency, 7
engineering, 9
England, 13
environment, 4, 6, 7, 13, 22, 24, 37, 40, 75, 220,
222
environmental conditions, 4, 36, 40, 42, 86, 127,
183
environmental effects, 13, 74, 95
environmental factors, 35, 45, 49
environmental impact, 8, 12, 30, 74, 95, 179
environmental management, 10, 77
environmental policy, 6, 12
environmental services, 10
environments, 130, 151
enzyme, 37, 49
enzymes, 15, 16, 19, 22, 23, 28, 128, 131
equilibrium, 3, 24, 27, 31, 222
equipment, 150
erosion, 66, 100, 131, 148, 176
ester, 131
ethology, 197
eucalyptus, 129
Europe, 110
European Union, 115
evaporation, 54, 56, 204, 206, 207, 211, 217, 218,
219, 220, 221
evapotranspiration, 47, 114, 204, 207, 221
evidence, 34, 45, 46, 88, 96, 115, 185
evil, 24
evolution, 13, 18, 23, 24, 26, 27, 73, 95, 152, 160,
169
exclusion, 221
excretion, 133
execution, 199
exercise, 31
expenditures, 8, 77, 90
experimental design, 139, 179
exploitation, 1, 11, 26
explosives, 61
export market, 115
exports, 114, 115, 122
exposure, 91
external costs, 13, 93
externalities, 4, 7, 13, 73, 92
extinction, 21, 23, 24, 26, 27
extraction, 21, 24, 149, 177, 179
F
fabrication, 68
families, 26, 129
farmers, 18, 119, 179
farmland, 94
farms, viii, 5, 18, 20, 113, 114, 118, 120
fauna, 21, 78
feed additives, 13, 73, 95
feedstock, 53
fencing, 63
fermentation, 31
fertility, vii, 34, 36, 47, 135, 143, 149, 152, 153,
156, 178, 205, 206, 223
fertilization, 19, 47, 48, 134, 143
fertilizers, 26, 131, 134
fiber, 113, 114, 119, 120, 122, 123, 178, 179, 181,
182, 184
fibers, 177, 178, 179, 180
financial, 4, 7, 146, 186, 220
financial support, 146, 186, 220
fires, 87, 114, 116, 190, 199
firewalls, 192
Fischer-Tropsch process, 67
Fischer-Tropsch synthesis, 67
fish, 10
fisheries, 100 Nova S
cienc
e Pub
lishe
rs, In
c.
Index 230
fitness, 36
fixation, 10, 35, 41, 47, 73, 131, 152
flexibility, 8, 11
flooding, 60, 110, 116
flora, 17, 21, 31, 35, 56
flora and fauna, 56
flowers, 21
fluctuations, 37, 116, 117, 174, 220
food, 16, 18, 19, 21, 22, 23, 24, 26, 36, 92, 190,
192
food chain, 24
food production, 92
food security, 24
food web, 22
force, 25, 45
foreign exchange, 18
forest ecosystem, 19, 20, 21, 82, 117, 118, 173,
205, 207, 208, 209, 210, 211, 212, 213, 214,
215, 216, 217, 218, 219, 220, 222, 223
forest fire, 189, 190, 192, 193, 199
forest floor, 21, 22, 23, 48, 126, 203, 204, 205,
206, 207, 209, 211, 217, 219, 222
forest management, 25, 26, 89, 125, 126, 157,
173, 190
Forest Management, 124, 125, 126, 189
forest restoration, vii, 128
Forestry, v, vi, 13, 53, 73, 77, 91, 93, 95, 110,
114, 116, 118, 124, 125, 126, 127, 134, 140,
173, 189, 195, 198
formation, 2, 5, 21, 30, 35, 36, 127, 128, 146
fragments, 42, 138
France, 29, 190, 201
freshwater, 70
fructose, 19
fruits, 21
FTIR, 180, 181
funding, 27, 77, 92
funds, 18, 109
fungi, 15, 16, 17, 19, 20, 22, 23, 24, 25, 26, 27,
28, 30, 31, 35, 36, 42, 47, 127, 128, 130, 132,
137, 143, 147, 148, 152, 153, 156, 170, 184
fungus, 16, 17, 22, 23, 29, 48, 50, 127, 130, 132,
144, 145, 147, 151, 152, 153
fungus spores, 152
G
gasification, 67, 74
gel, 37
genetic diversity, 10, 40, 41, 46
genetic engineering, 18
genetics, 4, 16, 153
genus, 156, 171, 178, 202
Germany, 102, 153
germination, 56
GHG, 81
Gigaspora margarita, 51, 134
GIS, 118, 119, 193
global consequences, 204
global scale, 115
global warming, 100, 115, 126
Glomus intraradices, 48
glucose, 19
goods and services, 3, 4, 5, 6, 7, 22, 24, 26, 96
government expenditure, 11
governments, 71, 79, 91, 92, 93
GPS, 193
grading, 131
grants, 22
graphite, 102
grass, 48, 82, 130, 140, 141, 143, 144, 149
grasslands, 115
grazing, 18, 54, 63, 64, 72, 80, 89
Greece, 201, 202
greenhouse, 2, 78, 96, 114, 138, 142, 144, 145
greenhouse gas, 2, 78, 96, 114
greenhouse gas (GHG), 78
greenhouse gas emissions, 2
grid resolution, 80
groundwater, 4, 54, 60, 70, 74, 78, 94
growth, 21, 24, 34, 36, 37, 42, 46, 50, 51, 54, 56,
57, 60, 61, 62, 70, 71, 73, 74, 80, 82, 86, 91,
103, 110, 114, 119, 121, 123, 127, 128, 130,
135, 139, 143, 144, 145, 147, 149, 152, 153,
156, 193, 220, 222
growth rate, 54, 56, 57, 61, 62, 82, 86, 156
Guangzhou, 99, 102, 109
Guatemala, 172
guidelines, 31, 80
Guinea, 109
H
habitat, 3, 6, 7, 8, 9, 10, 18, 21, 22, 24, 26, 118,
119, 174, 193, 195, 198, 199, 201
habitats, 3, 7, 11, 16, 38, 108, 199
hair, 135
harvesting, 53, 61, 63, 67, 81, 86, 88, 116, 123,
125, 190
Hawaii, 148, 149, 151, 187 Nova S
cienc
e Pub
lishe
rs, In
c.
Index 231
hazards, 178, 184
healing, 198
health, viii, 5, 17, 18, 20, 24, 26, 27, 29, 134, 149
health care, 18, 29
heavy metals, 19, 67
height, 57, 59, 71, 80, 82, 83, 85, 86, 144, 157,
158, 199
hemicellulose, 178, 179, 180, 181
hemp, 177
heterogeneity, vii, 85, 110, 117
highlands, 49, 179
history, 93
hormones, 19, 26
hospitality, 220
host, 23, 24, 27, 36, 39, 40, 41, 43, 45, 46, 47, 49,
129, 132, 135, 137, 138, 144, 148, 151, 153,
204
hotspots, 19, 25, 30
housing, 2, 87, 117
human, 2, 3, 4, 5, 8, 10, 11, 17, 19, 24, 26, 27, 34,
118, 130, 190, 199
human activity, 199
human capital, 5, 8
human development, 8
human perception, 10
human welfare, 3, 4, 10
humidity, 101, 203, 204, 205, 206
humus, 21
Hunter, 124, 190, 201
hunting, 25, 118
hybrid, 11, 50, 114, 119, 120, 122, 123, 124
hypothesis, 19, 22, 40, 100, 145, 171
I
identification, 4, 7, 201
identity, 27
IMA, 29
image, 81
image interpretation, 81
imagery, 71, 81, 88
images, 180
immobilization, 164, 169, 170
immunity, 27
in vitro, 24
incidence, 135
income, 9, 64, 70, 72, 90, 119
independent variable, 85
India, 30, 168, 169, 172, 175, 176, 187
indirect effect, 18
individuals, 2, 5, 8, 39, 67, 189, 193, 195, 196,
198
Indonesia, 175
induction, 192
industries, 4, 18, 19, 24, 26
industry, 79, 92, 116, 117
ineffectiveness, 143
inertia, 25
infection, 27, 45, 138, 143, 148, 150, 152
inferences, 108
infrastructure, 2, 5, 92
inhibition, 184
inoculation, 50, 135, 136, 137, 138, 140, 142, 143,
144, 145, 151, 152
inoculum, 47, 138, 139, 140, 143, 144, 145, 148
insects, 17, 20, 116
institutions, 92
insulation, 196
integration, 77, 92
integrity, 64
interface, 74, 92, 95, 172
International Bank for Reconstruction and
Development, 14
intervention, 54, 199
interwoven hyphae, 16
intrinsic value, 8
invasions, 50
invertebrates, 159
investment, 1, 7, 67, 70, 71, 79
investors, 67, 70, 71, 79
ion uptake, 153
ions, 128, 131
Iowa, 147
iron, 19, 130, 157
islands, 9
isolation, 6
isotherms, 148
isotope, 73, 74, 99, 102, 103, 107, 108, 109, 110,
111
issues, vii, 8, 10, 11, 85, 89, 92, 121
Italy, 190, 201
Ivory Coast, 174, 221
J
Japan, 56, 72, 73, 75, 110, 115
Jordan, 37, 48, 156, 173, 174, 205, 221
jurisdiction, 89 Nova S
cienc
e Pub
lishe
rs, In
c.

Index 232
K
Kenya, 30, 41, 49
ketones, 181
kill, 24
kinetics, 147
KOH, 138
Kyoto Protocol, 57, 79, 89, 95, 116, 124, 126
L
Land, v, 12, 13, 53, 54, 58, 73, 74, 75, 78, 88, 89,
90, 93, 94, 96, 118, 124, 125, 126, 156
land cover, vii, 51, 80, 94
landscape, 2, 14, 56, 77, 78, 79, 91, 92, 94, 190,
205, 206, 207
landscapes, vii, 72, 85, 116, 153, 205, 207
latency, 138
laws, 27
leaching, 24, 131, 156
lead, 43, 46, 66, 68, 89, 114, 200
legal protection, 199
legislation, 54, 64, 89
legume, vii, 34, 35, 37, 39, 40, 41, 46, 47, 48, 49,
50, 51, 153
liability insurance, 5
liberation, 170
life cycle, 45
light, 45, 63, 65, 147
light conditions, 147
lignin, 20, 28, 159, 165, 169, 170, 174, 175, 177,
178, 179, 180, 181, 187
local government, 90
localization, 195
logging, 27
logistics, 67
low-interest loans, 7
LSD, 144, 185
lying, 20, 204
M
macronutrients, 157
magnesium, 128
magnitude, 29, 113, 145, 183, 204, 215
majority, 17, 51, 54, 72, 92, 118, 165
Malaysia, 149, 174, 175
mammal, 192
mammals, 190
man, 19, 33, 34, 36, 37, 38, 39, 40, 42, 43, 44, 45,
46, 50
management, vii, viii, 3, 7, 8, 13, 17, 24, 27, 31,
35, 36, 42, 47, 67, 72, 73, 77, 78, 80, 81, 83,
88, 89, 91, 92, 93, 96, 109, 110, 114, 119, 123,
134, 148, 151, 153, 172, 173, 189, 190, 192,
204, 221
mangrove forests, 100, 106, 107, 109, 110
mangroves, 100, 107, 110, 111
Mangroves, 99
manipulation, 61
manufacturing, 16, 178
manure, 186
mapping, 19
market economy, 3, 4
market failure, 6, 7, 12
marketing, 88
Markets, v, 77, 82, 91
mass, 16, 25, 28, 83, 102, 174, 210
materials, 2, 20, 27, 39, 67, 100, 132, 159, 160,
169, 170, 175
matrix, 187
matter, 20, 101, 109, 135, 160, 166, 171, 177,
184, 222
Mauritius, 27
measurement, 13, 74, 81, 82, 83, 85, 87, 88, 95,
100, 123, 149
measurements, 71, 82, 83, 86, 90, 99, 100, 108,
111, 114, 116, 121, 123, 193, 204, 207, 210,
211
media, 5
median, 56, 86, 121
medical, 18
medicine, 18, 19, 24, 26, 178
Mediterranean, 173, 190, 191, 202
Mediterranean countries, 190
membrane permeability, 45
memory, 220
mercury, 157
meta-analysis, 31
metabolism, 21
metals, 24
methanol, 159
methodology, 13, 57, 73, 79, 95, 193, 199
Mexico, 48, 126, 129, 146, 149
microbial communities, 14, 34, 35, 37, 46, 49
microbial community, 42
microcosms, 49
micronutrients, 153
microorganism, 169, 170 Nova S
cienc
e Pub
lishe
rs, In
c.
Index 233
microorganisms, 17, 22, 23, 34, 35, 36, 38, 40,
118, 130, 170
mineralization, 21, 24, 26, 109, 169
MIP, 43, 45, 46
misunderstanding, 26
mixing, 100, 103, 108, 121, 123
modelling, 73, 78, 80, 81, 85, 88, 90, 176, 221,
223
models, 9, 34, 45, 77, 78, 79, 80, 81, 82, 88, 91,
92, 119, 164, 187, 195, 199, 204, 221
modern science, 22
modifications, 2, 37, 42
moisture, 21, 53, 54, 63, 67, 117, 175, 177, 178,
204, 206, 207, 212, 213, 214, 216, 219, 220
moisture content, 63, 67
mold, 198
molecular weight, 19, 28, 180
morphology, 30
mortality, 29, 113, 114, 119, 189, 190, 191, 199
Mountain tortoises, 189
multidimensional, 25, 26
multiplication, 40, 43, 57, 143
municipal solid waste, 67
Mushrooms, v, 15, 16, 17, 18, 19, 20, 22, 23, 24,
26, 27, 28, 30
mutuality, 22
MWD, 159, 166
mycelium, 16, 24, 29, 30, 43, 45
mycology, 16, 26, 27, 29
mycorrhiza, 36, 45, 128, 133, 145, 146, 147, 148,
149, 151, 152, 153
Mycorrhizae, 34, 127, 147, 149, 150
Mycorrhizal dependency, 135, 137, 148, 151, 152,
153
N
NaCl, 71
National Academy of Sciences, 29
Native forest, 177
native population, 190
native species, vii, 33, 54, 86, 87, 110, 119
NATO, 125
natural resources, 35
Natural Resources Conservation Service, 223
natural selection, 23
nature conservation, 17
negative consequences, 24, 26
negative effects, 45
neglect, 27
nematode, 24, 147
Nepal, 28
Netherlands, 152, 203, 222, 223
neutral, 102, 159, 184
New South Wales, 12, 88, 95, 96
Nicaragua, 129
Nigeria, 15, 17, 18, 19, 23, 27, 28, 29, 30, 31
nitrogen, 3, 23, 24, 35, 36, 40, 47, 48, 49, 102,
128, 130, 147, 155, 156, 166, 171, 173, 175,
176, 178
nitrogen fixation, 47, 175
nitrogen gas, 35
nitrogen-fixing bacteria, 36, 49, 130
nodules, 36, 40, 170
non-plantation forestry assets, 6
NPC, 53, 62, 66
nucleotides, 35
numerical analysis, 111
nutrient concentrations, 169
nutrient resorption, 173
nutrients, 19, 21, 23, 26, 35, 36, 45, 46, 61, 127,
128, 129, 133, 143, 150, 155, 156, 160, 161,
162, 164, 167, 170, 171, 172, 176, 183, 184,
205, 222
nutrition, 24, 46, 127, 128, 143, 148, 151, 168,
172, 174, 186
nutritional status, 133
O
objectivity, 81
obstacles, 8
OH, 130, 181, 183
oil, 61, 81, 118, 138, 187
open spaces, 196
operations, 118
opportunities, 22, 26, 67, 72, 93, 116
opportunity costs, 2
optimization, 148
organic compounds, 15, 110, 128
organic matter, 15, 16, 20, 34, 39, 46, 101, 106,
107, 108, 109, 110, 111, 122, 126, 139, 141,
156, 157, 165, 169, 170, 171, 172, 177, 178,
182, 183, 184, 185, 186, 223
organism, 22
organs, 20, 169
overgrazing, 24, 34
overlap, 78, 185
overtime, 116, 143
ownership, 79 Nova S
cienc
e Pub
lishe
rs, In
c.

Index 234
ownership structure, 79
oxidation, 182
oxygen, 23, 219
P
Pacific, 106, 109, 110, 169
Pakistan, 74
Panama, 109
parallel, 48, 77, 178
parasite, 27
parasites, 16, 17, 24, 27
parenchyma, 180
Parliament, 79, 96
participants, 88
pasture, 3, 12, 43, 91, 94, 152, 196, 221
pastures, 153, 189, 191, 199, 204, 222
patents, 187
pathogens, 19, 24, 26, 28, 36, 128, 134, 147, 149
pathology, 16
pathways, 77, 192
peat, 107
peer review, viii
percolation, 207
permafrost, 115
permeability, 61
permit, 54, 65, 89
personal communication, 115, 118, 121
Perth, 74, 75, 96, 97
pesticide, 186
pests, vii, 19, 24, 37, 91
petroleum, 19
Petroleum, 30
pH, 47, 101, 102, 128, 138, 139, 141, 143, 144,
146, 150, 153, 158, 159, 182, 183, 184, 185,
205
pharmaceuticals, 5, 28
phenol, 164, 170
phosphate, 48, 127, 128, 131, 132, 144, 148, 151,
153
phosphates, 130
phosphorous, 166, 170
phosphorus, 19, 23, 36, 147, 148, 149, 150, 151,
152, 153, 155, 172, 174, 175
photographs, 71, 88
photosynthesis, 91
phylum, 152
physical characteristics, 78
physical environment, 179
physical properties, 156, 178
physicochemical properties, 170
physics, 156
Physiological, 81
physiology, 16, 128, 149
phytoremediation, 148
plant establishment, 56
plant growth, 48, 71, 73, 130, 133, 138, 143, 144,
145, 146, 148, 149, 156, 157
Plantations, 1, iii, v, vi, 33, 40, 73, 105, 107, 108,
128, 140, 155
plants, 16, 17, 20, 22, 23, 24, 34, 35, 36, 37, 39,
40, 42, 43, 44, 45, 46, 48, 49, 60, 91, 95, 127,
128, 129, 130, 131, 134, 135, 137, 138, 139,
142, 143, 144, 145, 147, 149, 151, 152, 153,
170, 172, 174, 178, 184, 186
plasticity, 17, 75
plastics, 67
pluralism, 10
policy, viii, 1, 2, 4, 5, 13, 73, 78, 81, 88, 89, 92,
95
Policy, 12, 13, 73, 88, 95
policy instruments, 13
policymakers, 5, 6, 8, 77, 78, 79, 81, 87, 89, 92
politics, 6
pollution, 5, 94, 100, 116, 134
pools, 20, 22, 80, 100, 114, 120, 122, 130, 152,
179
population, vii, 23, 26, 27, 36, 37, 39, 40, 46, 47,
111, 136, 143, 190, 199, 201
population growth, vii
population structure, 136
porosity, 177, 181, 182, 183
positive correlation, 39, 71
positive feedback, 114
positive interactions, 36
potassium, 19, 128
potato, 140, 143
potential benefits, 6, 15, 115
poverty, 18, 26
poverty alleviation, 18
precipitation, 73, 101, 114, 115, 118, 128, 196,
203, 204, 206, 207, 209, 210, 219
predation, 190, 198, 201, 202
predators, 193
preparation, 57, 59, 61, 66, 119, 123
prescribed burning, 116
present value, 90
preservation, 25, 26
President, viii
prevention, 100, 192 Nova S
cienc
e Pub
lishe
rs, In
c.
Index 235
priming, 47
principles, 8
prior knowledge, 70
private good, 2
probability, 193, 194, 195, 199
probiotics, 26
producers, 6, 174
productive capacity, 93
profit, 27
profitability, 90
project, 9, 59, 62, 66, 67, 68, 70, 88, 90, 93, 146,
193, 220
proliferation, 42
propagation, 67
property rights, 6, 79, 88
protection, 2, 5, 7, 9, 24, 28, 31, 36, 92, 118, 128,
178, 192
proteins, 178, 180
pruning, 192
public goods, 78
publishing, viii
Puerto Rico, 175, 176
pulp, 115, 117, 118, 122
Q
quantification, 2, 57, 80, 82, 88, 217
quartz, 102
Queensland, 94, 153, 172
R
race, 25
radiation, 43, 115, 206
radicals, 183
radio, 190, 198
radius, 118, 134
rain forest, viii, 31, 151, 175, 176
rainfall, 37, 39, 53, 56, 70, 86, 90, 155, 157, 159,
160, 161, 166, 168, 169, 171, 179, 191, 196,
197, 203, 204, 205, 206, 207, 208, 209, 210,
211, 214, 215, 216, 217, 219, 220, 222, 223
rainforest, 28, 47, 149, 186, 203, 204, 209, 220,
221, 222, 223
rangeland, 71, 74, 95
ratio analysis, 73
raw materials, 26
reactions, 130, 131, 151
reagents, 175
reality, viii, 7, 193
receptacle, 158
recognition, 21, 22
recovery, 3, 54, 186, 190
recreation, 5, 8, 118
recreational, 18, 27
recycling, 23, 26, 117, 129, 130, 156
redundancy, 3
Reforestation Systems, 34
reforestations, 192
regeneration, 23, 25, 34, 37, 49, 54, 72, 114, 178
regression, 71, 83, 84, 85, 131, 207
regression equation, 207
regression model, 131
regrowth, 82
rehabilitation, 34, 54, 61
reimburse, 7
relevance, 20, 204
reliability, 10, 81
relief, 191, 195
remote sensing, 47, 75, 80, 81, 94
renewable energy, 12, 67, 73, 88, 95
renewable energy technologies, 73
repair, 9
repetitions, 195
replication, 108
reproduction, 193
reptile, 202
requirements, 1, 60, 63, 66, 67, 70, 80, 87, 89, 94,
117, 148, 149
RES, 44
researchers, viii, 19, 22, 26, 61, 77, 78, 79, 87, 93
reserves, 131
residues, viii, 45, 67
resilience, 3, 4, 36
resistance, 37, 151
resolution, 71, 78, 79, 87, 92, 206
resource management, 6, 28
resource utilization, 22
resources, 5, 8, 9, 12, 16, 19, 20, 21, 22, 23, 24,
27, 29, 35, 43, 78, 92, 116, 117
respiration, 10, 37, 111, 118, 173, 174
response, 12, 37, 39, 94, 135, 144, 145, 146, 152,
153, 191, 211, 221, 223
responsiveness, 153
restoration, vii, viii, 34, 51, 111, 116, 118, 127,
128, 136, 156, 170
restoration programs, 128
restored ecosystem, 156
restrictions, 88
restructuring, 13, 73 Nova S
cienc
e Pub
lishe
rs, In
c.
Index 236
retail, 18, 87
revenue, 72
Rhizobia, v, 33, 34, 49
Rhizopus, 184
rhythm, 198
riboflavin, 19
rights, 79, 92
risk, 13, 18, 27, 70, 73, 88, 91, 94, 95, 192, 199
risk management, 88
risk profile, 70
risks, 70, 91, 116, 134
Romania, 202
room temperature, 102, 131
root hair, 128, 133
root system, 23, 40, 43, 45, 91, 117, 128, 133,
151, 178
roots, 16, 17, 35, 43, 47, 48, 49, 59, 60, 82, 86, 91,
94, 102, 117, 121, 127, 128, 129, 130, 131,
133, 134, 135, 138, 143, 148, 150, 151, 156,
159, 171, 187, 203, 205, 210, 211, 219, 222
rotations, 120, 122
rubber, 31
rules, 88
runoff, 24, 54, 61, 66, 207
rural areas, 117
S
safety, 179
Sahelian Ecosystems, 34
salinity, 2, 3, 13, 37, 47, 70, 71, 89, 134
Salt, v, 53
salt accumulation, 70, 73
saltwater, 70
sanctions, 49
satellite monitoring, 78
saturation, 205
sawdust, 30
scaling, 85
scaling coefficients, 85
scanning electron microscopy, 179, 182
scarcity, 40, 46, 89, 133, 190
scatter, 20
science, 16, 28
scientific publications, 153
scientific understanding, 2
scope, viii, 9, 21
scrublands, 192
sea level, 177, 178, 179
seasonal flu, 79
seasonality, 15, 22, 45
security, 5, 8, 79, 92
sediment, 99, 100, 101, 102, 103, 105, 106, 107,
108
Sedimentary organic carbon, 99
sediments, 100, 101, 106, 107, 108, 110
seed, 115, 135, 157, 175
seedlings, 51, 127, 136, 138
selectivity, 21
semiarid regional plantations, vii
senescence, 40
sensing, 81, 94
sensitivity, 70, 96, 126, 222
sensors, 207
services, vii, 2, 3, 4, 6, 7, 8, 9, 10, 12, 13, 20, 26,
89, 93, 100, 113, 118
sewage, 24
sex, 190, 195, 196, 197, 198, 199
shade, 64
shape, 16
shelter, 196
shoot, 72, 77, 87, 94, 139, 140, 142, 143, 144
shorelines, 100
shortage, 115, 129, 130, 219
showing, 37, 40, 43, 60, 133
shrimp, 110
shrubs, 39, 82, 149, 192
significance level, 185
simulation, 221
simulations, 96, 122, 123
Singapore, 129
skin, 20
social benefits, 9
social welfare, 5, 72
society, 7, 13
software, 195
softwoods, 117
Soil bioremediation, 156
soil erosion, 157, 178
Soil Fertility, 34, 148
soil legume-nodulating rhizobia, vii, 34
soil particles, 134, 159
soil type, 39, 80, 86, 91, 119, 205
solid phase, 131
solid surfaces, 131
solid waste, 19, 185
solution, 74, 78, 92, 130, 131, 133, 135, 136, 138,
148, 149, 151
sorption, 131, 132, 138, 147, 149
sorption isotherms, 132, 149 Nova S
cienc
e Pub
lishe
rs, In
c.
Index 237
South America, 19, 115
Southern China, 99, 100, 101, 104, 105, 106, 108,
110, 111
soybeans, 151
SP, 206, 207, 208, 209, 210, 211, 212, 213, 214,
216, 217, 219
Spain, viii, 113, 155, 156, 175, 189, 190, 191, 201
specialists, 42
speciation, 23, 26
species richness, 18, 174, 186
specifications, 67
spectrophotometry, 159
spore, 16, 17, 25, 41, 42, 44, 45, 48, 51, 129, 130,
143, 154
sporocarp (spore harbour), 16
SSS, 192, 202
stability, 3, 5, 14, 19, 23, 36, 40, 49, 110, 134,
154, 156, 159, 165, 166, 169, 171
standard deviation, 161, 198, 208
standardization, 123
starvation, 29
state, 20, 54, 72, 87, 91, 94, 109, 121, 158, 194,
197, 220
steroids, 177, 178
stimulation, 148, 172
stimulus, 21
stock, 5, 13, 64, 73, 80, 87, 93, 95, 96, 113, 116,
117, 122
storage, 19, 22, 99, 108, 111, 115, 118, 121, 122,
172, 173, 174, 203, 205, 206, 207, 209, 210,
211, 212, 213, 214, 216, 217, 219, 221, 222
storms, 56, 207, 208, 214
stress, 26, 37, 60, 91, 128, 134, 219, 221
structure, vii, 12, 20, 21, 25, 35, 37, 41, 42, 48,
49, 50, 51, 94, 128, 130, 151, 168, 171, 182,
186, 203, 204, 205, 206, 209, 210, 219, 221
sub-Saharan Africa, 51
subsidy, 70, 71
subsistence, 18
substitutes, 9
substrate, 30, 31, 37, 49, 103, 138, 139, 140, 158,
160, 169, 191, 219
substrates, 16, 142
succession, 23, 25, 28, 36, 47, 48, 149, 172, 175
Sudan, 41
sulfate, 128
Sun, 109
supplier, 67
suppression, 26, 27
surface area, 61, 135
surface structure, 181
surplus, 216, 217
survival, 34, 35, 42, 43, 54, 61, 62, 70, 86, 128,
149, 193, 201
survival rate, 54, 61, 62
sustainability, vii, 12, 14
sustainable energy, 12
Switzerland, 14, 28, 149, 221
symbiosis, 24, 35, 36, 43, 46, 49, 50, 128, 138,
148, 149, 150, 153, 168
symptoms, 139, 153
T
Tanzania, 149
target, 137, 145
tax incentive, 89
taxa, 19, 22, 26, 42
taxonomy, 16, 202, 205
teams, 66, 90
techniques, 2, 8, 9, 11, 54, 94, 123, 148, 149, 151,
192, 206
technologies, 13, 67, 68, 73, 74, 95, 123
technology, 12, 13, 18, 28, 47, 67, 74, 95
telephone, 89
temperature, 21, 37, 39, 45, 56, 101, 113, 114,
115, 157, 179, 191, 196, 197, 199, 203, 205
terraces, 191, 205
terrestrial ecosystems, 27, 51, 116, 117, 129, 146,
153, 172, 179
testing, 94
texture, 16, 91, 212, 214
Thailand, 111
thermoregulation, 190
thinning, 81
threats, 20
timber production, 2
tissue, 80, 133
tonic, 18
tortoises, 189, 190, 192, 193, 194, 195, 196, 197,
198, 199, 200
total costs, 77
tourism, 5, 8, 72, 118
toxicity, 16, 128, 134
toxin, 24, 184
trade, 6, 11, 79, 115
trade-off, 6, 11
training, 18, 27
trajectory, 159
transaction costs, 92 Nova S
cienc
e Pub
lishe
rs, In
c.
Index 238
transformation, 85, 86
translocation, 21, 148
transmission, 202
transparency, 79, 88
transpiration, 24, 203, 207, 215, 216, 217, 218,
219, 221
transport, 65, 68, 73, 77, 117, 118, 133, 149, 152,
153
transportation, 113
treatment, 24, 139, 158, 160, 161, 162, 168, 190,
192, 193, 195
tree plantings, 56
trial, 64, 72
triggers, 130
tropical forests, 129, 151, 156, 167, 169, 170, 172,
220
Tropical forests, 129
tropical rain forests, 176
tundra, 115
turnover, 47, 86, 87, 109, 110, 111, 223
U
UK, 12, 29, 50, 148, 151, 153, 154, 221
UN, 89, 179
UNESCO, 220, 221
uniform, 195
United, vii, 2, 12, 14, 31, 79, 89, 96, 110, 124,
186, 221
United Kingdom, 12, 14, 124, 221
United Nations, vii, 2, 14, 31, 79, 89, 96, 110
United Nations Framework Convention on
Climate Change, 79, 89, 96
United Nations Framework Convention on
Climate Change (UNFCCC), 79
United States, 124, 186
updating, 81
urban, 30, 92
urbanization, vii, 100
urea, 175
Uruguay, 221
USA, 13, 14, 28, 73, 74, 94, 95, 132
USDA, 205, 223
V
vacuum, 102
validation, 81
valuation, 1, 2, 3, 6, 7, 8, 9, 10, 11, 12, 13, 14, 95
Valuation, 8, 10, 199
variables, 3, 13, 21, 82, 85, 142, 206
variations, 21, 87, 100, 116, 126, 182, 212
varieties, 119
vein, 20
velocity, 113
Venezuela, 172, 177, 178
versatility, 26
vibration, 180
vitamins, 19
volatilization, 156
W
Wales, 12
walking, 192
Washington, 14, 28, 202, 223
waste, 7, 25, 26, 67, 74, 177, 178, 179, 180, 186
waste management, 25, 26
wastewater, 24
water evaporation, 217
water quality, 5, 78, 118
water resources, 3
waterways, 134
weight loss, 169, 170
welfare, 4
well-being, 2
West Africa, 33, 34, 39
Western Australia, v, viii, 1, 13, 53, 54, 58, 71,
72, 73, 74, 75, 77, 79, 87, 90, 94, 95, 96, 97
Western Europe, 201
wetlands, 111
White Paper, 88, 94
wild animals, 18
wildfire, 116
wildlife, 116, 118, 119
Wildlife, 118, 202
wind speed, 206
wood, 16, 18, 23, 25, 28, 29, 31, 67, 74, 80, 81,
86, 87, 90, 94, 113, 114, 115, 117, 119, 120,
121, 122, 123, 125, 126, 158, 180
wood density, 80, 81, 86
wood products, 25, 90, 126
woodland, 15, 17, 18, 20, 21, 22, 23, 24, 26, 43,
72, 94, 149
Woodlands, v, 15
wool, 2
workers, 66, 192, 195, 198, 199
World Bank, 14
worldwide, vii, 19, 100, 113 Nova S
cienc
e Pub
lishe
rs, In
c.

Index 239
Y
yield, vii, 2, 18, 36, 67, 148, 176, 217
Z
Zambezi, 172
Zimbabwe, 29
Nova S
cienc
e Pub
lishe
rs, In
c.
Recommended