1
Project Number: MQP-TAC-
Biodegradable Polymers: Blends of Starch and
Poly(lactic) Acid
A Major Qualifying Project Report
Submitted to the Faculty of
WORCESTER POLYTECHNIC INSTITUTE
In fulfilment of the requirements for the
Degree of Bachelor and Science
By
___________________
Rachel Katz
____________________
Andrew Peter
Date: April 30, 2009
Approved:
________________________________
Professor Terri A. Camesano, Project Advisor
2
Abstract The objective of this project was to investigate the effect that plasticizers had on starch and
poly(lactic) acid blends. The type and ratio of plasticizers used was varied. Water, glycerol
and citric acid were added to starch, which was plasticized and blended with PLA. After each
step, the mixtures were characterized using DSC, GPC, SEM, IR spectroscopy and
mechanical testing. It was determined that a 70/18/12 blend of starch/water/glycerol blended
50:50 with PLA had the best properties.
3
Executive Summary A dichotomy exists on our planet between our want for cheap durable goods, and the need for
space and time to dispose of them. Plastics offer a cheaper, more durable alternative to wood,
metal, glass, and other traditional materials. However, disposing of plastics is harmful to the
environment, which we are rapidly trying to improve. One alternative to plastics synthesized
from hydrocarbons, is to utilize biopolymers polymers. Large quantities of biopolymers exist
in nature and are readily consumed by it. One such polymer is poly(lactic) acid (PLA). PLA is
a made up of lactic monomers, which can be fermented from most agricultural waste products,
like corn or wheat. The plastic can then be used in products from food packaging to medical
devices. One problem with PLA is that it is fairly expensive to produce. In order to lower the
cost of PLA plastics, there have been attempts to combine it with other biodegradable plastics,
namely starch. Starch is one of the most widely available polysaccharides. It has the ability to
be plasticized. However, when starch is plasticized, its mechanical properties are poor. It is a
very brittle plastic and needs the right combination of starch, PLA, and various plasticizers for
optimal balancing of physical properties and price. The effects of different plasticizers on the
properties of PLA/starch blends were explored. Water and glycerol were used in four
proportions to plasticize starch. The samples were 70/18/12, 70/25/5, 70/30/0, and 70/18/12
wt% of starch, glycerol, and water, respectively. They were labelled respectively as Starch 1,
Starch 2, etc. Starch on its own tends to join together, forming granules that do not interact
with the PLA. Plasticizing before blending it with PLA decreased the tendency for starch to
form granules, increasing the entanglements with PLA. By testing the viscosity of the blends
while in the extruder, we were able to determine that as the concentration of water in the
blends decreased, the viscosity decreased, as well. Looking closely at the surface morphology
with a scanning electron microscope, we determined that although the viscosity of the
mixtures decreased with decreasing water content, the compatibility of the blends decreased
significantly. However, water content had little effect on the thermal properties of the polymer,
4
as shown by differential scanning calorimetry. The effect of citric acid was also tested. Citric
acid is thought to plasticize PLA as well as starch, increasing compatibility between the
polymers. Again by examining viscosity during extrusion, we determined that citric acid does
plasticize PLA. By looking at the SEM scans of the citric acid blends we determined that it
not only plasticizes PLA but it increases compatibility between PLA and starch. Therefore,
we determined that a 70/18/12 blend of starch/water/glycerol blended 50:50 with PLA had the
best properties.
5
Table of Contents Abstract ...................................................................................................................................... 2
Executive Summary ................................................................................................................... 3
1. Introduction ............................................................................................................................ 9
2. Background .......................................................................................................................... 11
2.1 Polymers ......................................................................................................................... 11
2.1.1 Polymer Structure .................................................................................................... 12
2.1.2 Polymer Synthesis ................................................................................................... 13
2.1.3 Starch ....................................................................................................................... 14
2.1.4 Poly(lactic) acid ....................................................................................................... 15
2.2 Mechanical Testing ........................................................................................................ 17
2.3 PLA/Starch Blends ......................................................................................................... 20
2.3.1 Compatibilizers ....................................................................................................... 20
2.4 Biodegradabilty .............................................................................................................. 23
2.4.1 Disorder ................................................................................................................... 23
2.4.2 Enzymatic Reactions ............................................................................................... 24
2.4.3 Photodegradation ..................................................................................................... 24
2.4.4 Rates of Degradation ............................................................................................... 24
2.4.5 Waste ....................................................................................................................... 25
2.4.6 Legislation ............................................................................................................... 26
2.4.7 Organizations .......................................................................................................... 26
2.4.8 Composting ............................................................................................................. 27
2.4.9 Reduce, Reuse, Recycle .......................................................................................... 28
2.4.10 Uses ....................................................................................................................... 29
2.4.11 Biodegradable Plastics .......................................................................................... 30
2.4.12 Synthetic “biopolymers” ....................................................................................... 32
3. Methodology ........................................................................................................................ 33
3.1 Samples .......................................................................................................................... 33
3.2 Extruder, Injector, and Molding ..................................................................................... 34
3.3 Mixer .............................................................................................................................. 36
3.4 Differential Scanning Calorimetry ................................................................................. 37
3.5 Melting Temperature ...................................................................................................... 38
3.6 Infrared Disk Preparation ............................................................................................... 38
3.7 Gel Permeation Chromatography ................................................................................... 39
3.8 Scanning Electron Microscopy ...................................................................................... 40
4. Result and Discussion .......................................................................................................... 42
4.1 Samples .......................................................................................................................... 42
6
4.2 Extruding, Injecting, and Molding ................................................................................. 42
4.3 Determination of the Unknown Specimen ..................................................................... 44
4.4 Effect of Water and Glycerol Content on PLA/Starch Blends ....................................... 49
4.5 Effect of Citric Acid on PLA/Starch Blends .................................................................. 53
5. Conclusion ............................................................................................................................ 62
Bibliography ............................................................................................................................. 64
7
Table of Figures Figure 1 Linear Polymer. The monomers form linear chains. (27-100 Materials in Engineering)
.................................................................................................................................................. 11 Figure 2 Branched Polymer. The monomers form linear chains with smaller branches. (27-
100 Materials in Engineering) .................................................................................................. 12
Figure 3 Styrene is polymerized to form polystyrene. ............................................................. 13 Figure 4 The polycondensation of diaminohexane and adipic acid gives the polymer
polyamide. ................................................................................................................................ 14 Figure 5 Polyaddition occurs between diphenylmethane diisocyante and butanedoil giving
polyurethane. ............................................................................................................................ 14
Figure 6 Amylose is one of two monomers that make up starch. ............................................ 14 Figure 7 Amylopectin is the second monomer which composes starch. ................................. 15
Figure 8 Starch polymerization groups amylose and amylopectin monomers into chains. H2O
is a product. .............................................................................................................................. 15 Figure 9 Opened rings of lactide make up poly(lactic) acid. ................................................... 16 Figure 10 Lactides undergo ring opening polymerization. Lewis-acids catalyze the reaction. 16 Figure 11 Ring opening polymerization can be catalyzed by SnOct as well. .......................... 17 Figure 12 Stress/Strain Analysis (Yu, 2004) ............................................................................ 18
Figure 13 Extruder ................................................................................................................... 43
Figure 14 Established PLA IR Spectrum ................................................................................. 46 Figure 15 Sample 02 was determined to be PLA. The peaks of this IR spectrum match with
the peaks on Figure 17. ............................................................................................................ 46 Figure 16 Sample 01 was discovered to be polyamide 12. The absorbance peaks clearly show
nitrogen bonds. ......................................................................................................................... 47
Figure 17 The dehydrated (sample 03) gave the same peaks as non dehydrated polyamide 12
(sample 01). .............................................................................................................................. 47 Figure 18 The absorbance between 3550cm
-1 to 3200cm
-1 represent the citric acid. .............. 48
Figure 19 The PLA/Starch 4 blend has the lowest viscosity, likely because there citric acid is
plasticizing both PLA and starch. ............................................................................................ 49 Figure 20 Decreased appearance of granules, but surface is still “rough” ............................... 50
Figure 21 The lack of water contributes to a multitude of starch granules .............................. 51 Figure 22 For each blend with starch, the peaks are within a few degrees Celsius of PLA’s
glass transition temperature. ..................................................................................................... 52 Figure 23 The PLA/citric acid blend clearly shows less viscosity, confirming that it is an
effective plasticizer. ................................................................................................................. 53 Figure 24 interior of the GPC. The laser is pointed on the sample then the diffraction angle
can be found. ............................................................................................................................ 55 Figure 25 Absorbance shifts to the right for smaller pieces because they come out of the tube
last. Larger molecules are expelled first. The smaller pieces are slower moving because of
diffusion. (GPC Theory: Separation, 2008) ............................................................................. 55 Figure 26 As PLA stays in the extruder there is bond scission. Since PLA after 10 min of
extrusion is furthest right, the chains are the smallest. ............................................................. 57 Figure 27 Mixed results are given by this graph. It shows that there were samples of PLA and
citric acid with significantly different elution volumes/ml, and molecular weights. ............... 59 Figure 28 Citric acid has a dramatic effect on the molecular weight of PLA .......................... 60 Figure 29 Citric acid helps to plasticize both PLA and starch, increasing blend compatibility
.................................................................................................................................................. 61
8
Table of Tables
Table 1 Molar mass and molecular weight are given for PLA. ............................................... 58 Table 2 The two experimentally found molar masses of PLA and citric acid samples differ
significantly. ............................................................................................................................. 59 Table 3 Extended time in the extruder decreases molecular weight. Citric acid further
decreases molecular weight. ..................................................................................................... 60
9
1. Introduction
Poly(lactic) acid (PLA) and starch blends provide for cheap and sustainable
biodegradable plastics. Because of the many uses for plastics and the quantity that is used
each year, there exists a need for a biodegradable plastic that is also cost effective. By
blending cheep starch and expensive PLA, a reasonably priced polymer is formed. A mixture
between PLA and starch could offer the solution. PLA has a wide variety of uses, ranging
from textiles to biomedical items. PLA is a polyester while lactic acid is the monomer
component, and so PLA is an honorary polymer. Like PLA, starch is also biodegradable and
is used for paper making and paper coatings. Most plastic is used as packaging material and
serves a single use before being discarded. The product shares characteristics similar to the
two components. Packaging should be the major use for the plastic. A biodegradable
affordable packaging would be created. Mixtures can be used for packaging and other
applications.
Traditionally plastics have been disposed of in landfills; however, the amount of
plastic being produced each year is increasing and so a more environmentally friendly
solution is necessary. There has been a growing concern for moving towards a greener future.
Society wants less waste in landfills so that a smaller imprint is left on the earth. A
biodegradable plastic that can be composted would not take space in landfills and could slow
the rate at which they are filled. There is a growing amount of trash in landfills. Eventually
there will be little to no room left for waste. An efficient waste management method is
composting. Composting allows for less waste, returns nutrients to the soil, and reduces the
environmental impact the plastic has. PLA and starch are promising because both are carbon
sources and compostable. A solution to the problem of having too much material added to
landfills is compostable bioplastics.
10
Ideally all plastics would be biodegradable. Luckily PLA and starch have a wide
variety of uses, so these findings can be applied to a large group of applications. If all plastics
were biodegradable there would be no plastics in landfills. Plastics, yard waste, and disposed
foods could all be composted. If this were the case, then only metals and glass would remain.
However, they are easily recycled and so there would be little waste left to dispose of in
landfills. This would allow for more room for the construction of houses and businesses. PLA
and starch combinations mark the beginning of the answer. In order to find a promising
solution, different amounts of plasticizer and compatiblizer are added and tested for
mechanical traits and characterization. The first step is to mix different percentages of starch,
glycerol, and citric acid. Next, these samples are mixed with different percentages of PLA and
the plastic samples are characterized and undergo mechanical testing. Based on the results
from the mechanical testing, the most promising samples are then mixed and tested with
different percentages of compatibilizer. The final product will then be selected and further
applications will later be determined.
The purpose of project is to find the combination of PLA, starch, and compatiblizer
that provides sufficient mechanical properties while remaining cost effective. Ideally, it will
be considerably less expensive than PLA alone, yet be able to continue to perform the same
tasks as non biodegradable plastics. The effect of plasticizer content on the characteristics of
PLA/starch blends was determined mostly from the results of the SEM scans and
measurements of the viscosity during extrusion. As water content decreased, so did the
viscosity of the blends, suggesting increased compatibility. As water decreased the SEM
scans also showed decreases in the amount of starch granules, further suggesting increased
compatibility. The viscosity of PLA with citric acid was less than that of PLA, suggesting
citric acid is a good plasticizer. The SEM scans also showed a large decrease in the amount of
11
starch granules in the blends, further suggesting the citric acid is beneficial to PLA/starch
compatibility.
2. Background
2.1 Polymers
A polymer is a large macromolecule made up of many repeating, smaller units. These
units are called monomers, and can vary in size and composition. Polymers can be made from
chains of just one type of monomer or several monomers. The number of individual
monomers in a polymer chain can range from small to large (ex. 10 – 100000 units). Bond
strength, length and molecular weight all factor in determining the behavioural properties of a
polymer. The physical properties of a polymer are determined by the arrangement of
monomers which occur in either a linear, branched, or cross linked chain (William D.
Callister, 2007). An image of linear polymers, Figure 1, and an image of branched polymers,
Figure 2, are show below. Examples of these types of polymers are polypropylene,
polyethylene, and polyisoprene respectively.
Figure 1 Linear Polymer. The monomers form linear chains. (27-100 Materials in Engineering)
12
Figure 2 Branched Polymer. The monomers form linear chains with smaller branches. (27-100 Materials in
Engineering)
Polymers are found everywhere, even in nature, but are typically synthesized from
unnatural materials. Natural polymers include rubber, starch and cellulose. These molecules
are made from plants and animals using simple organic molecules as building blocks.
Synthetic polymers are created in a similar way, taking reactants found in nature and
combining them to make fully- or semi-synthetic polymers.
2.1.1 Polymer Structure
There are two types of polymer structure: semi-crystalline and amorphous. There are
no naturally occurring crystalline polymers, and while there may be some produced in a lab,
the classification is typically omitted. Semi-crystalline polymers consist of sections of orders
polymer chain distribution, separated by smaller sections of random entanglements. These
entanglements are amorphous. Some polymers are completely amorphous, and resemble
something like a tangled ball of yarn. These entanglements are what give polymers strength,
and amorphous polymers are typically stronger than semi-crystalline. Amorphous polymers
also do not have a melting point temperature, so characterizing them thermally is often
difficult. Polymer length is also very important when it comes to structure. The longer a
polymer chain, the more chances there are to form entanglements, and increase strength.
Chain length is often described in average molecular weight or degree of polymerization, the
average number of monomers per chain. The length of a polymer has the most effect on
polymer properties, but there are other elements than can effect properties. Tacticity describes
13
the chiral conformation of monomers in the chain. There are three types of tacticity: isotactic,
atactic, and syndiotactic. They represent all substituent on the same side, random placement
of substituent and alternating substituent respectively (William D. Callister, 2007).
2.1.2 Polymer Synthesis
Polymerization is when two monomers containing at least one multiple bond undergo
a chain reaction to form polymer chains. Molecules with at least one double bond are
necessary for monomers because the double bond is broken creating a radical, which is
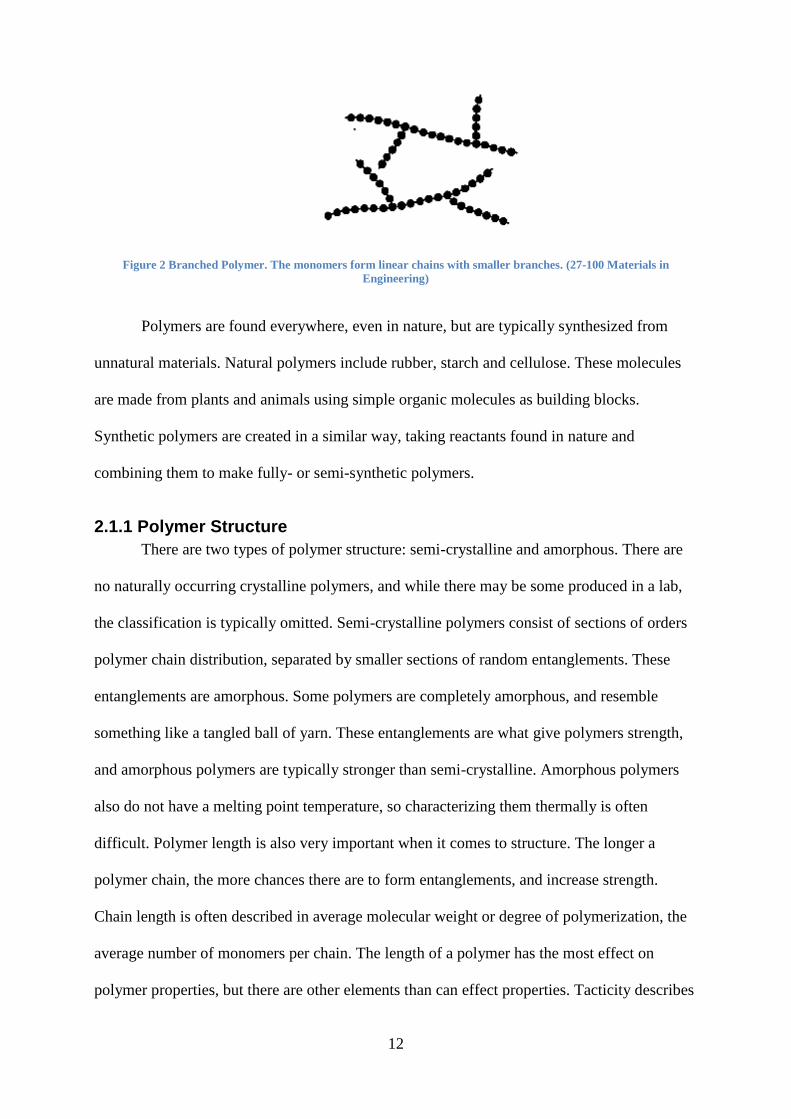
typically the initiator of a polymerization chain reaction. When one monomer is used a
polymer is created based solely on that molecule. For example if you polymerize only styrene
molecules you get polystyrene. Polymerizing several different monomers will result in
random copolymers. Figure 3 depicts the process of polymerization.
n
styrene
polystyrene Figure 3 Styrene is polymerized to form polystyrene.
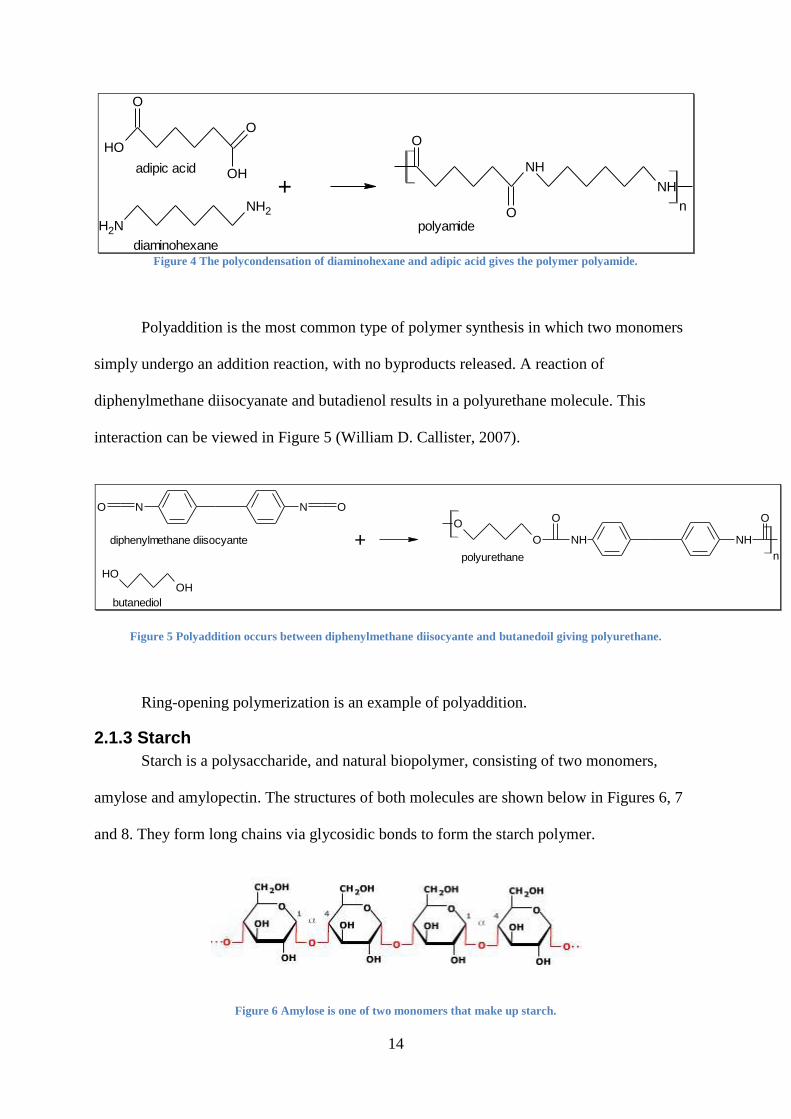
Unnaturally synthesized polymers are created in two ways, polycondensation and
polyaddition. Polycondensation is a reaction between multifunctional monomer molecules,
which are molecules that have more than one reactive site. Monomers with two reactive sites
produce linear polymers and monomers with three or more reactive sites result in branched or
crosslinked polymers. The monomers undergo a condensation reaction, releasing small
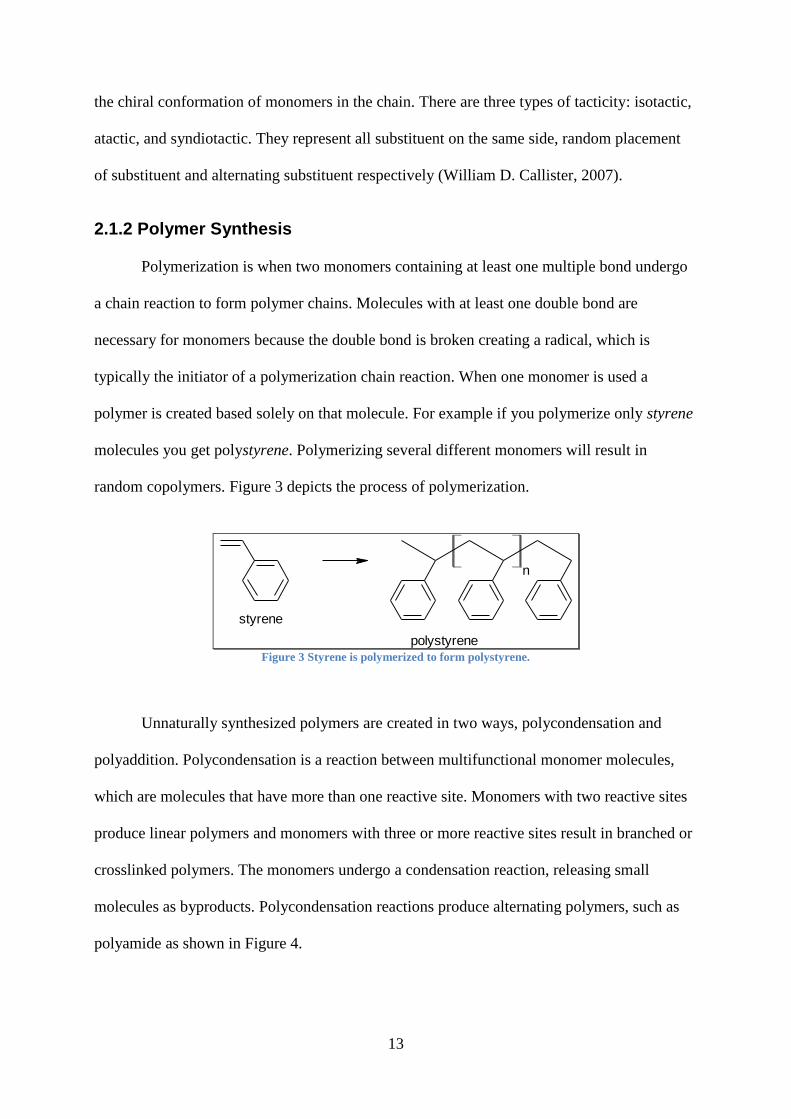
molecules as byproducts. Polycondensation reactions produce alternating polymers, such as
polyamide as shown in Figure 4.
14
O
OH
OH
O
adipic acid
NH2
NH2
diaminohexane
+NH
O
O
NH
n
polyamide
Figure 4 The polycondensation of diaminohexane and adipic acid gives the polymer polyamide.
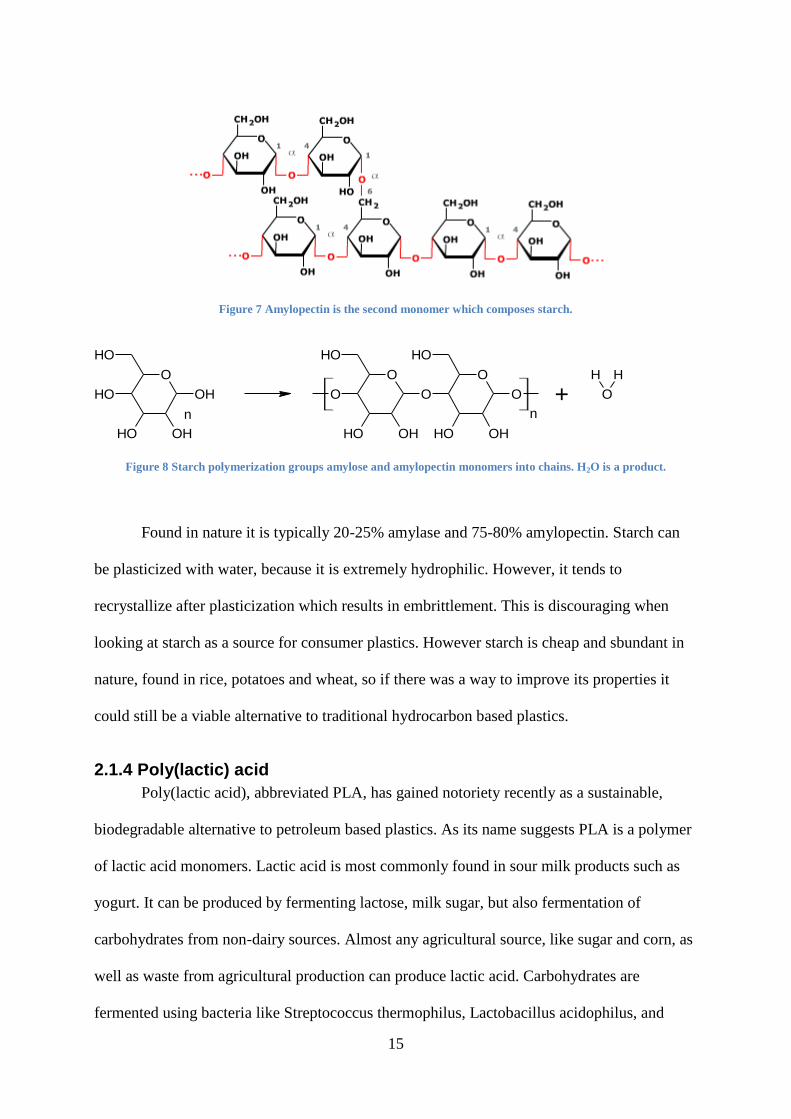
Polyaddition is the most common type of polymer synthesis in which two monomers
simply undergo an addition reaction, with no byproducts released. A reaction of
diphenylmethane diisocyanate and butadienol results in a polyurethane molecule. This
interaction can be viewed in Figure 5 (William D. Callister, 2007).
O N N O
diphenylmethane diisocyante +
OH
OH
butanediol
NH
O
O
O
NH
O
npolyurethane
Figure 5 Polyaddition occurs between diphenylmethane diisocyante and butanedoil giving polyurethane.
Ring-opening polymerization is an example of polyaddition.
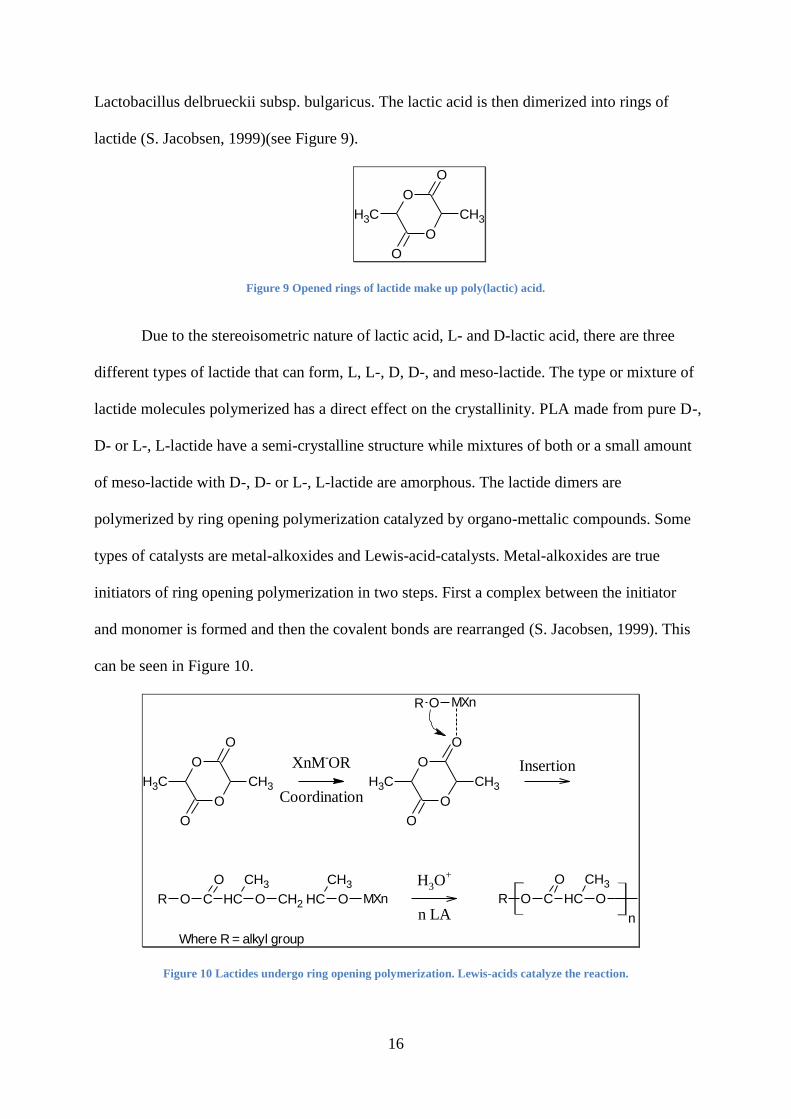
2.1.3 Starch
Starch is a polysaccharide, and natural biopolymer, consisting of two monomers,
amylose and amylopectin. The structures of both molecules are shown below in Figures 6, 7
and 8. They form long chains via glycosidic bonds to form the starch polymer.
Figure 6 Amylose is one of two monomers that make up starch.
15
Figure 7 Amylopectin is the second monomer which composes starch.
O
OH
OHOH
OH OH
OH
O
O
OH
O
OHOH
O
OH
O
OH
n+
HH
O
n
Figure 8 Starch polymerization groups amylose and amylopectin monomers into chains. H2O is a product.
Found in nature it is typically 20-25% amylase and 75-80% amylopectin. Starch can
be plasticized with water, because it is extremely hydrophilic. However, it tends to
recrystallize after plasticization which results in embrittlement. This is discouraging when
looking at starch as a source for consumer plastics. However starch is cheap and sbundant in
nature, found in rice, potatoes and wheat, so if there was a way to improve its properties it
could still be a viable alternative to traditional hydrocarbon based plastics.
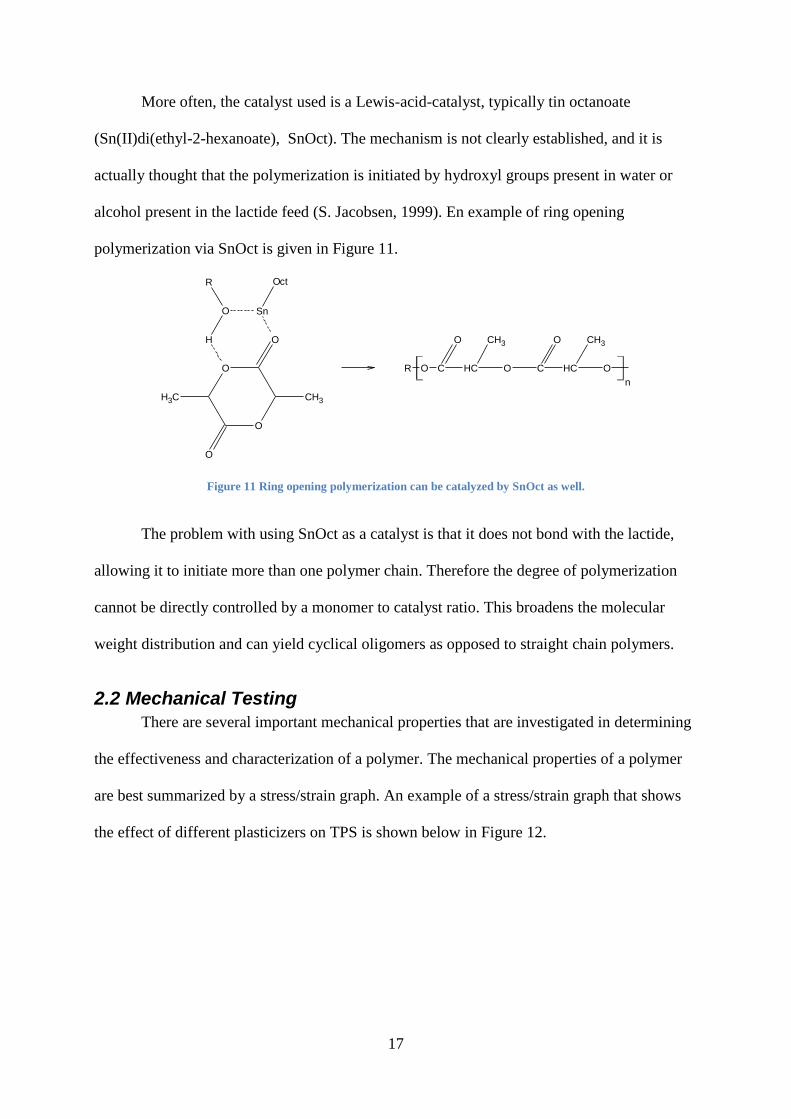
2.1.4 Poly(lactic) acid
Poly(lactic acid), abbreviated PLA, has gained notoriety recently as a sustainable,
biodegradable alternative to petroleum based plastics. As its name suggests PLA is a polymer
of lactic acid monomers. Lactic acid is most commonly found in sour milk products such as
yogurt. It can be produced by fermenting lactose, milk sugar, but also fermentation of
carbohydrates from non-dairy sources. Almost any agricultural source, like sugar and corn, as
well as waste from agricultural production can produce lactic acid. Carbohydrates are
fermented using bacteria like Streptococcus thermophilus, Lactobacillus acidophilus, and
16
Lactobacillus delbrueckii subsp. bulgaricus. The lactic acid is then dimerized into rings of
lactide (S. Jacobsen, 1999)(see Figure 9).
O
O
O
O
CH3 CH3
Figure 9 Opened rings of lactide make up poly(lactic) acid.
Due to the stereoisometric nature of lactic acid, L- and D-lactic acid, there are three
different types of lactide that can form, L, L-, D, D-, and meso-lactide. The type or mixture of
lactide molecules polymerized has a direct effect on the crystallinity. PLA made from pure D-,
D- or L-, L-lactide have a semi-crystalline structure while mixtures of both or a small amount
of meso-lactide with D-, D- or L-, L-lactide are amorphous. The lactide dimers are
polymerized by ring opening polymerization catalyzed by organo-mettalic compounds. Some
types of catalysts are metal-alkoxides and Lewis-acid-catalysts. Metal-alkoxides are true
initiators of ring opening polymerization in two steps. First a complex between the initiator
and monomer is formed and then the covalent bonds are rearranged (S. Jacobsen, 1999). This
can be seen in Figure 10.
O
O
O
O
CH3CH3
XnM-OR
CoordinationCH3
O
O
O
O
CH3
MXnOR
Insertion
R O C CH
CH3O
O CH2 CH
CH3
O MXn
H3O+
n LAR O C CH
CH3O
O
n
Where R = alkyl group
Figure 10 Lactides undergo ring opening polymerization. Lewis-acids catalyze the reaction.
17
More often, the catalyst used is a Lewis-acid-catalyst, typically tin octanoate
(Sn(II)di(ethyl-2-hexanoate), SnOct). The mechanism is not clearly established, and it is
actually thought that the polymerization is initiated by hydroxyl groups present in water or
alcohol present in the lactide feed (S. Jacobsen, 1999). En example of ring opening
polymerization via SnOct is given in Figure 11.
H
O
R
Sn
Oct
O
O
CH3CH3
O
O
R O C CH
CH3O
O C CH
CH3O
O
n
Figure 11 Ring opening polymerization can be catalyzed by SnOct as well.
The problem with using SnOct as a catalyst is that it does not bond with the lactide,
allowing it to initiate more than one polymer chain. Therefore the degree of polymerization
cannot be directly controlled by a monomer to catalyst ratio. This broadens the molecular
weight distribution and can yield cyclical oligomers as opposed to straight chain polymers.
2.2 Mechanical Testing
There are several important mechanical properties that are investigated in determining
the effectiveness and characterization of a polymer. The mechanical properties of a polymer
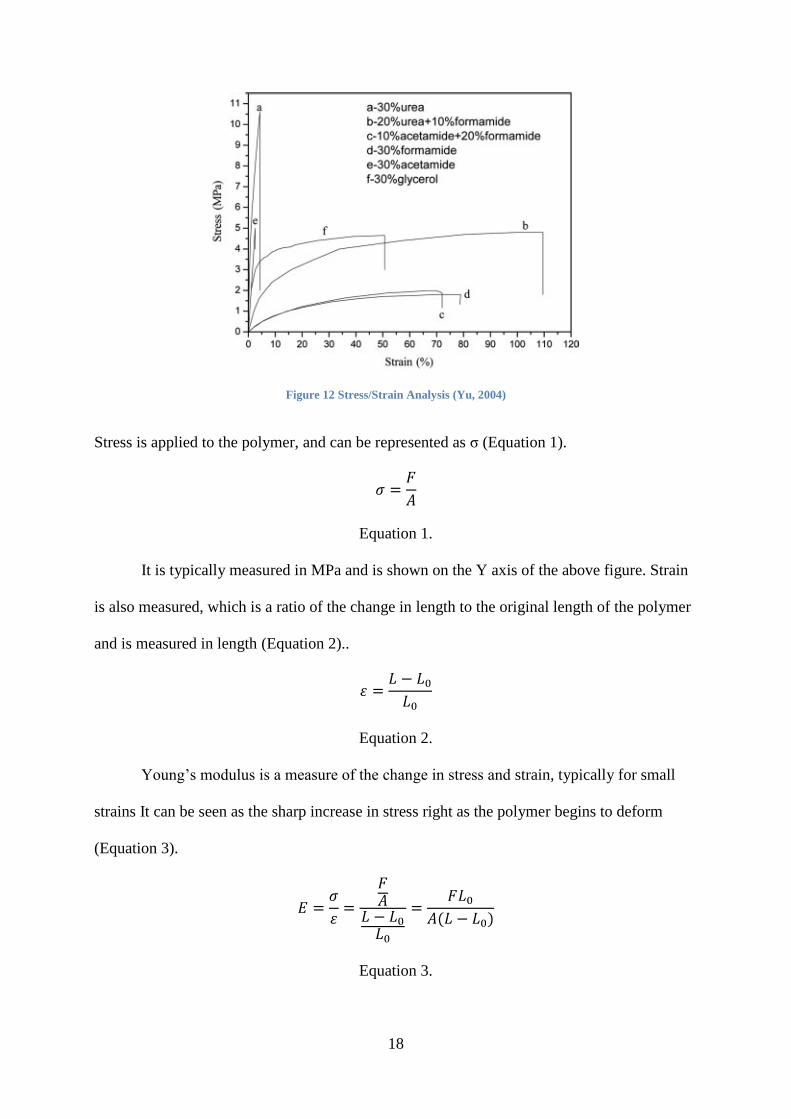
are best summarized by a stress/strain graph. An example of a stress/strain graph that shows
the effect of different plasticizers on TPS is shown below in Figure 12.
18
Figure 12 Stress/Strain Analysis (Yu, 2004)
Stress is applied to the polymer, and can be represented as σ (Equation 1).
Equation 1.
It is typically measured in MPa and is shown on the Y axis of the above figure. Strain
is also measured, which is a ratio of the change in length to the original length of the polymer
and is measured in length (Equation 2)..
Equation 2.
Young’s modulus is a measure of the change in stress and strain, typically for small
strains It can be seen as the sharp increase in stress right as the polymer begins to deform
(Equation 3).
Equation 3.
19
Young’s modulus can be directly to Hooke’s law, which a measure of the stiffness of a
spring (Equations 4 and 5).
Equation 4.
Equation 5.
However, the relation to Hooke’s law is only valid for linear substances, where stress
is essentially constant over a range of strains. Some substances with linear modules are steel,
carbon fiber and glass, hard materials that are designed not to deform under stress. Softer
products, like plastics, have non-linear modules most noticeably at small strains. Other
important features of a stress/strain analysis are yield strength, tensile strength and elongation
at the break. Yield strength is the stress required to deform the material in such a way that it
cannot return to its original dimensions. Up to the yield strength the material deforms
elastically, and after it deforms plastically. When deforming elastically the deformation
increases proportionally with stress, and can return to its original shape. Plastic deformation is
when a material deforms irreversibly without fracture. Ductile materials do not technically
have a yield strength, and a 0.2% strain offset is used. The offset strain is taken at the
intersection of a line parallel to the initial curve, offset 0.2% strain. Tensile strength is the
strength at which the material breaks, or stress at maximum strain. On the curve it is usually
represented by a sharp, almost linear drop at the right hand side. Elongation at deformation is
simply the increase in length when the material breaks. In terms of polymers, the best
properties are high yield strength, tensile strength and elongation at break (William D.
Callister, 2007).
20
2.3 PLA/Starch Blends
Though plastics made from petrochemicals have brought many benefits to mankind, it
has become apparent that their impact on the environment has been less than positive.
Coupled with the realization that petroleum resources are finite, there is much interest in
developing sustainable, biodegradable substitutes to traditional plastics. Starch is a substance
that has shown promise in replacing petroleum based plastics. Starch is a carbohydrate made
from agricultural sources, and is both sustainable and biodegradable. However, plasticized
starch, also called thermoplastic starch, TPS, has limited mechanical properties and is very
hydrophilic. TPS samples swell and deform when exposed to moisture. One option to improve
upon these issues, while still maintaining the sustainability and degradability, is to combine
TPS with other biodegradable polymers. Poly(lactic acid) has already been established as
sustainable biodegradable plastic, but it is fairly expensive to produce (S. Jacobsen, 1999).
Combining the relatively cheap TPS with PLA is a perfect solution to making an affordable,
mechanically sound, sustainable, biodegradable plastic. The issue with blending the two
polymers is that TPS is a hydrophilic substance and PLA is a hydrophobic substance making
them essentially immiscible.
2.3.1 Compatibilizers
Starch molecules are strongly attracted to each other in the presence of water, and
form granules. Because of it there are poor interfacial interactions between the starch granules
and the PLA. Gelatinizing starch in water disintegrates the granules and improves dispersion
in polymer blends. However, PLA is a biopolymer that can depolymerize in water at high
temperatures, reducing mechanical properties. Glycerol can be substituted as a plasticizer for
starch, but it is much less efficient than water. Starch chain mobility is dependant on the water
content of the mixture. It is extremely difficult to achieve plasticized starch with glycerol
alone. An alternative to water is formamide, which increases compatibility between TPS and
PLA. The addition of formamide plasticizes TPS well, decreasing the amount of granules
21
present with just glycerol. SEM pictures of TPS with glycerol show a rather ragged substance,
filled with granules. TPS with formamide is smoother. When water is excluded, and just
starch is used for plasticizing, TPS becomes rigid and fragile. Increasing formamide increased
the flexibility of TPS. The addition of formamide to TPS increases its compatibility with PLA
because the low weight, highly polar molecule is able to penetrate the starch chains and
disintegrate the granules. This increases the interfacial interactions between TPS and PLA
increasing compatibility. It is further shown by increases of T5% (temperature corresponding
to 5% weight loss) in TPS for TPS/PLA blends, as well as increases in maximum tensile
strength and elongation at the break (Ning, Jiugao, & Giaofei, 2008).
One way of increasing the compatibility between TPS and PLA is adding PLA grafted
amylose as a compatibilizer. Amylose is a linear polymer of glucose and one of two
components that make up starch. Grafting PLA to amylose creates an amphiphilic nucleus for
the blending of PLA and TPS. The A-g-PLA is created by ring opening polymerization of
D,L-lactide activated by SnOct2 in the presence of amylose. 1 wt% of A-g-PLA was mixed
with blends of 90/10, 75/25, and 60/40 (TPS/PLA wt%) in a single screw extruder. For all
three mixtures the crystallinity either stayed the same or increased. There was no significant
change in modulus induced by the compatibilizer, however there was an increase in tensile
strength without a change in elongation at the break (Scwach, Six, & Averous, 2008).
Another way of increasing compatibility is in situ reticulation using peroxide. When it
is heated it decomposes into radicals, which react with both TPS and PLA chains. The
macroradicals produce randomly react increasing compatibilty. There was a significant
decrease in crystallinity for blends with high starch content (90/10, 75/25) and an increase for
the 60/40 blend. The modulus had a slight increase in the 60/40 blend, and a slight, but
insignificant decrease in the higher starch blends. The modulus results correlate with the
crystallinity results. Compared to uncompatibilized blends, at equivalent strengths there is an
22
increased elongation at the break. This leads to the assumption that there is a compatibilizing
effect from the use of peroxide. Using more peroxide, 4 wt%, shows a decrease in all
mechanical properties. This is attributed to macromolecular degeneration due to excess
peroxide (Scwach, Six, & Averous, 2008).
Linkage between PLA and TPS can also be improved by creating urethane links with
the hydroxyl groups on the starch and the end of PLA chains. One way to accomplish this is
via in situ reaction with MDI (4,4-methylen-bis(phenyiso-cyanate). Adding 2 wt% of MDI to
TPS/PLA blends is shown to increase crystallinity better than using peroxides and A-g-PLA.
The addition of MDI also shows a maximum with respect to both modulus and elongation at
the break, which corresponds with the increase in crystallinity. However, the increase in
elongation is not significant, and compared to the addition of peroxide the compatibilizing
effect is less apparent. One possibility is that the numerous hydroxyl groups present in the
blends, water and glycerol, could be reacting with the MDI as opposed to PLA and TPS. A
SEC analysis shows an increase in elution time, meaning a decrease in molecular weight. The
lower molecular weight would explain the increased crystallinity (Scwach, Six, & Averous,
2008).
Maleic anhydride can be used as a safer alternative to MDI to improve interfacial
interaction between PLA and TPS. MA is highly reactive with PLA radicals in the presence of
an initiator. One initiator tested was 2,5-bis(tert-butylperoxy)-2,5 dimethylhexane, L101. The
anhydride groups would then react with hydroxyl groups from starch and form ester linkages.
Mechanical properties were improved to a point by the addition of the compatiblizer. Both
tensile strength and elongation at the break increased with increasing MA and L-101. Tensile
strength increased by up to 14.6 MPa with 1 wt% MA added. The tensile strength decreased
with 2 wt% MA, which is consistent with the findings of O’Shaughnessy et al.
(O’Shaughnessy, B.; Sawhney, U. Phys. Rev. Lett. 1996, 76, 344.) that there is a critical
23
density (C) for in situ formed molecules using compatibilizers, that is dependant on the
molecular weight of the compatibilizer C~N-0.5
, where N is the molecular weight of the
compatibilizer. Elongation at the break had similar trends to tensile strength, in that it
increased to a maximum at 1 wt% M, but it was still lower than pure PLA. Finding an
optimum of 1 wt% MA the effect of the amount of the initiator was examined. An addition of
10 wt% L-101, based on MA, resulted in the best tensile strength and elongation at the break.
Maleic anhydride grafted PLA, MA-g-PLA, was also examined. Using MA-g-PLA as a
compatibilizer resulted in similar mechanical properties to blends of PLA, starch, MA and L-
101. Compatibilization results were further examined using solvent extraction tests. Blends of
pure PLA/starch had residual percentages of 8.42 and 6.34 respectively. Adding 1 wt% MA
resulted in 35.4% and 38.6% residual PLA/starch (Sun, 2004).
2.4 Biodegradabilty
2.4.1 Disorder
According to the second law of thermodynamics, the universe is constantly
approaching disorder (Moran & Shapiro, 2004). This can be applied to the degradation of
plastics; plastics keep braking down until they reach a more disordered state. Entropy is
defined as the measure of disorder (Moran & Shapiro, 2004). This disorder should cause links
in polymers to break either through oxidation or hydrolysis. Thermodymanics and kinetics
describe the free energy needed to reach a product. In non-spontaneous reactions, it takes
energy to move from the reactant to the transition state. Once the transition state is reached,
the product with the lowest energy is obtained. The product should have lower energy than
the reactant (Moran & Shapiro, 2004). The energy needed to reach the transition state can be
reached using light energy, enzymes, or non-enyzimatic chemicals.
24
2.4.2 Enzymatic Reactions
In enzymatic break down, the process is initiated by an organism. The products are
harmlessly returned to nature. Many microorganisms house enzymes; bacteria, fungi, and
algae are a few examples (Campbell, 2006). This is known as biotic degradation. Abiotic
degradation is the technical term for non enzymatic break down. If oxygen is present, then the
process is aerobic; without oxygen, it is anaerobic (Campbell, 2006).
2.4.3 Photodegradation
There are many routes that the degradation of a plastic can take. The amount of light in
the environment plays a role. Natural sunlight leads to photo degradation of plastics. When
photosensitive groups of polymers are attacked by sunlight, it absorbs the energy causing the
chain to scission (International Union of Pure And Applied Chemistry (IUPAC), 1996).
Polymers can be copolymerized to be photosensitive. Adding copolymers can cause
degradation time to be altered. This process is sought after when engineering new
biodegradable plastics. By making a plastic photosensitive, you can make it biodegradable.
The plastics become brittle and begin to flake and tare. This is known as programmed
degradation.
2.4.4 Rates of Degradation
Either by natural or synthetic forces, plastics can be physically cracked or broken. The
break down via chemical degradation involves chain scission, the fragmentation of the
polymer chains. Eventually the products will be stable monomers (Moran & Shapiro, 2004).
Non-degradable plastics maintain their mass and original characteristics. For programmed
degradable plastics, after use and being discarded the mass is lost at a linear rate to time.
Some programmed degradable plastics degrade in two stages. After discard the plastic
degrades rapidly at a linear rate. Maintaining a linear rate, the plastic reaches a point at which
the plastic degrades at a slower rate.
25
2.4.5 Waste
As the population grows, there is a need for more residential space. Landfills take up
land that is often not reused for other purposes. In 2006, 251 tons of municipal solid waste
was produced (http://www.epa.gov/ORD/lrp/research/landfill.htm). Cutting back on non-
biodegradable plastics will free room for other municipal solid waste. Composting is the
solution to disposing of waste in an efficient manor. The use of biodegradable plastics saves
room that would otherwise be used for landfills. Biodegradable plastics can be used and
discarded plastics because they can be composted. However, non-biodegradable plastics take
up precious space. Biodegradable plastics will lead to a greener future.
There is a growing need for more renewable plastic feedstock. With the over use of
landfill space, waste is a growing problem. Currently, the majority of feedstock is synthetic;
biodegradable feedstock generates little to no waste. If the industry can move towards natural
sustainable resources, then biodegradable plastics will play an increasing role. Plastics make
up 18% of municipal solid waste (Stevens, November 1, 2001). Almost 90% of synthetic
polymers produced are non-biodegradable (Stevens, November 1, 2001). Plastics, metals, and
organics form the major categories of waste. Organics are made up of paper, food waste, and
yard waste. The disposal of waste occurs in homes, businesses, and industries. Each year,
over 60 billion pounds of plastics are disposed of. One half of the plastic produced is from
packaging (Stevens, November 1, 2001) About one third of the packaging is discarded soon
after use (Stevens, November 1, 2001).. The rest of the plastic produced is for extended use,
both in homes and in industrial settings. Often these long term use plastics are disposed of
after decades. Since most plastic is not biodegradable, cleaning up plastic in nature is an
increasing problem. Animals can get entangled or ingest it. Hazardous to animals, waste
should be cleared from regions where it will most impact wild life; biodegradable plastics
could be the solution.
26
2.4.6 Legislation
Over the course of the past 20 years, legislation has been past concerning the
production and disposal of plastics; much of the legislation focuses on the disposal of plastic
at sea. The United States Plastics Pollution Research Control Act of 1987 (Public Law 100-
220) prohibits the disposal of plastic at sea. Also prohibiting the disposal of plastic at sea is
the Annex V of the international MARPOL Convention (“The International Convention for
the Prevention of Pollution From Ships”). This protects the destruction of habitats from
plastic waste. To further save animals from the harms of plastics, The USA congress amended
1987 Public Law 100-556 requiring bottle and can plastic ring-carriers to be degradable.
Product labeling like recyclable m compostable, and biodegradable are “Standardizations of
the Field of Environmental Management.” These are defined by the technical committee 207
of the International Standards Organization (ISO).
2.4.7 Organizations
Supporting research on bio based materials including green chemistry; the Department
of Agriculture offers competitive grant programs through the Agriculture and Food Research
Initiative (AFRI). Providing additional markets for crops, the Department of Agriculture aims
research at the development of new bio based products. Other biopolymer grant opportunities
are provided by the Defense Advanced Research Projects Agency’s (DARPA) Mobile
Integrated Sustainable Energy Recovery (MISER). DARPA is a USA Department of Defense
section that provides grants for a variety of industrial research fields (DARPA). Awarding
$2.34 million to researchers, MISER furthered bio based technology. MISER’s goal is to
“improve the logistics of land-based military operations by reducing the quantities of solid
waste from packaging materials that require personnel, fuel, and critical transport equipment
for removal” (Researchers Develop Bioplastic that Can Be Broken Down to Liquid Fuel,
2007).
27
2.4.8 Composting
The completion of compost to humus is defined by full mineralization. Mineralization
is the complete conversion of biomass into water, salts, and gases like carbon dioxide,
methane, and nitrogen compounds (Stevens, November 1, 2001). Composting is an alternative
method of recycling; it recycles organic material into humus. Humus is the mass produced
from the biodegradation that takes place in composting. Composting requires a balance of
carbon and nitrogen, 30 parts carbon and 1 part nitrogen, and helps to nourish soil for better
crop growth. Rich soil gives back to the earth instead of taking away. There is no need for
landfill space when the items can be composted. Biodegradable plastics by definition are
easily compostable. The American Society for Testing Materials, ASTM, sets the guide lines
for assessing the compost ability of environment degradable plastics. D20.96 is the
environmentally degradable subcommittee that provides technical requirements such as the
compost ability of degradable plastics is dependent on degrading in a timely manner; meaning
that a plastic must compost at the speed of leaves or other natural items (Stevens, November 1,
2001). Helping to define the performance criteria, the International Standards Organization,
ISO, reconciles differences between various national and international standards groups such
as ASTM. The ASTM dictates tests to define biodegradability, which includes: the soil test,
Sturm test, molecular weight, biochemical oxygen demand, cress seed test and earthworm test
(Stevens, November 1, 2001). Composting plastics causes loss of weight of the item as well
as color change. In the case of poly(lactic) acid, PLA, the clear colorless plastic loses weight
linearly to time. It becomes white and fully degrades after a time span of 30 days. Developed
standards of the ASTM can be found in the “Standard test Methods for Determining Aerobic
Biodegradation of Plastic Materials Under Controlled Composting Conditions” and “Standard
Test Methods for Determining Aerobic Biodegradation of Radio Labeled Plastic Materials in
an Aqueous of Compost Environment” documents (Stevens, November 1, 2001).
28
2.4.9 Reduce, Reuse, Recycle
The saying reduce, reuse, and recycle resonates. By reducing the waste created, there
would be less waste to dispose of, leaving the environment clearer of hazardous waste. One
should be conscious of how much plastic is being used. There are most often alternatives to
using plastic. Bringing a bag to the market is an excellent way to avoid plastic use. Glass and
cardboard are efficient substitutes. Glass is made of up sand and is therefore easily renewable.
It is cheap and easy to produce (Stevens, November 1, 2001). Easier recycling and reuse of
glass makes glass a good substitute for plastics. Substituting cardboard for plastic allows for
easier methods of returning the substance to the earth. As a product of wood, cardboard can
be composted, acting as a rich carbon source for the compost produced. Using glass and
cardboard as an alternative to plastic, is a way of reducing the amount of plastic used.
Reducing the amount of plastic produced may mean that a different type of plastic could be
more ecologically friendly. Instead of using sandwich bags, one could use a long term storage
container, such as a sealing plastic box or container. A way to reduce the amount of plastic
produced is by reusing.
Reusing items such as plastic shopping bags of garbage bags or reusing a water bottle
can make a difference. Making short term use plastic, long term use can save. Unfortunately,
many plastics such as food packaging, agricultural covers, and waste bags cannot be reused
because of impurities. One such notable material that cannot be reduced is diapers. They use
millions of pounds of plastic each year. Another strategy of conservation is recycling.
Recycling is a relatively new strategy that involves hand and mechanical sorting. Only
some plastics can be recycled, thin packaging not being one of them. Within and outside of
industries, plastics are recycled. Billions of pounds of post consumer recycling is recycled
every year. Recycling projects are made easy with curbside pickup and drop off, often run by
the government. 10% of plastics, thermoplastics, cannot be recycled since they cannot be
softened or reshaped (Stevens, November 1, 2001). Many plastic deteriorate during recycling;
29
the polymer chains can be broken in the process. Therefore, plastics cannot be used in equally
taxing roles as their initial use. Containers and liners are of common use for recycled plastics.
At least 10% the mass of the original recycled material is reduced (Stevens, November 1,
2001). This reduces the processing efficiency. Recycling is mainly dependant on energy costs,
consumer markets, and transportation. All of these things must be balanced when planning a
recycling project. Despite these hurdles, recycling has become prevalent. In 1998, recycling
was available to more than 140 million people in the United States. This amounts to over 2
billion pounds of postconsumer plastics separated from organic waste each year (Stevens,
November 1, 2001).
2.4.10 Uses
There are many uses for biodegradable plastics. The most common uses for
biodegradable plastics would be plastic bags and packaging. Bags could biodegrade with the
organic waste that it contains. Plastic can fall under the broad category of packaging;
possibilities range from bottles to packaging foams. After using a soda bottle, one could
dispose of it without environmental worry. Instead of taking in energy for recycling the
plastics, the plastics could be simply composted. Food containers from restaurants or home
could be disposed of in a compost pile. When being removed, loose fill and ridge foam
packaging could be biodegraded. If the packing needs a plastic coating, the coating would
have to be biodegradable as well. Another market for biodegradable plastics is compostable
utensils. Along with everyday items, children and pet toys could be biodegradable. After use,
buried or forgotten dog toys could be returned to the earth. As of 1998, diapers made up
approximately 2.1% of municipal solid waste in the USA (Batista, 2004). The dirty diapers
could be disposed of in a compost pile. Golf tees and other sporting goods that are left behind
after use could be left in nature without worry. Personal care products could also be added to
30
the compost pile. If the biodegradable plastics could be degradable at sea, fishing nets, twines,
ropes, and lines could be left in the water after use. Otherwise they could be removed from the
water and disposed of via composting on land.
In drug delivery systems, nanocapsulesare released using time controlled degradation
to monitor the breakdown of the polymer chain allowing for more specific site locating.
Causing less side effects, the drug is released over a longer period of time. For wound
treatment, plastics are spun into gauze sheets. The gauze can degrade keeping the fibbers from
adhering to the wound and causing infection. The plastics can also be used as adhesive
(Stevens, November 1, 2001). Acting as tissue, the plastics join two pieces of skin in the
healing process. Plastic implants can degrade over time, allowing for temporary relief. The
amount of time can be selected through which additive is used when forming a polymer.
2.4.11 Biodegradable Plastics
Poly(vinyl alcohol) (PVA) is made through the polymerization of vinyl acetate which
is followed by alcoholysis. This water soluble plastic is used for the production of films,
fibers, paper coatings, and adhesives (Saxena).
Poly(glycolic acid) is a thermoplastic that is used for pharmaceutical and biomedial
applications like drug delivery systems, wound treatment and implants. It is made up of the
repeating monomer glycolic acid (Stevens, November 1, 2001).
Polycaprolactone is formed through the polymerization of caprolactone. It is a
polyester thermoplastic used to modify the properties of other plastics with agricultural
applications such as controlled release of pesticides, herbicides, and fertilizer. It is used in for
compostable plastic bags. These plastics bags can be used for food waste and yardwaste as
well as other applications (Plycaprolactone).
31
Poly(ethylene oxide) is a water soluble thermoplastic used for adhesives, lubricants,
cosmetics, pharmaceuticals, antifreeze agents, printing inks, paper coatings, and other
products (Hubbe).
A polyamide named Nylon is the first synthetic polymeric fiber formed. It was first
made in the 1930s. Characterized by its smooth, resilient, and lustrous characteristics, it can
be used for applications such as carpeting, tents, and rope. Acrylics are another synthetic
polymeric fiber. It is mainly used for clothing because of its lightweight and quick drying
properties. Polymer fibers are made through spinning solution. The diameter of the plastic
fibers can be varied by changing a die. The method of blown films is made for bags or other
packaging. After stress is applied, rubbers reform their original shape (Nylon, 2005).
Microorganisms produce a staggering number of polymers, some of which are used on
a commercial scale. Some of these carbohydrates are cellulose, starch, chitin, agar, carrageen,
and agarose. Carbohydrates make up for than 75% of all organic matter (Stevens, November 1,
2001). Found in plant walls, the most plentiful polysaccharide is cellusose. Cellulose is the
most abundant organic compound accounting for 40% of all organic matter. Animals do not
have the ability to digest cellulose although it can be digested by bacteria living within
animals. Through hydrolysis, cellulose is readily broken down. Like cellulose, starch is also
abundant. It can be found in corn, potatoes, wheat, rice, and other plants. Often starch is
extracted from these plants. Like cellulose, the monomeric structure of starch is glucose
(Voet, Voet, & Pratt, 2006). Each type of starch has a different ratio of the compounds
amylose and amylopectin. Normally composed of 28% amylose and 72% amylopectin, the
starch polymer is brital and hydrophilic (Stevens, November 1, 2001). Paper, textile, and
food products are a few of starch’s wide variety of uses. Cellulose, starch and chitin are all
made up of five carbon six member rings. Another abundant polysaccaride is chitin. Chitin
can be found in the skeletal tissue of shellfish, insects, and cells walls. Therefore it is mainly
32
produced from the waste of marine crustaceans. It can be found in cosmetics, hygiene
products, agriculture, and food.
In microbiology, the polymer agar is commonly used as growth medium. Some of its
applications include health foods, pet foods, and deserts. Like carrageenan, agar is harvested
from seaweeds. Carrageenan is used as an emulsifier in food products. It helps to stabilize ice
cream, cheese, tooth paste, cosmetics, and pharmaceuticals. The polymer alginate has similar
uses. Polysaccharides are used for drug delivery systems (Stevens, November 1, 2001). They
form gel beads to encapsulate drugs. Tara, carob, guar, and fenugreek gums are other plant
polysaccharides. These polysaccharides can be used as thickeners and stabilizers.
Proteins are characterized by different combinations of amino acids. There are twenty
amino acids in total (Voet, Voet, & Pratt, 2006). These are the foundation of residues found
in a protein sequence. Three levels of structure are given for a protein chain. The primary
structure is the amino acid sequence, secondary structure is made up of helical segments, and
tertiary structure if the folding of the helical segments. This structure is stabilized by disulfide
bonds. These folded tertiary structures then form enzymes; enzymes are made from folded
amino acid polymer chains (Voet, Voet, & Pratt, 2006). Some of the most common animal
proteins are collagen, casein, whey protein, and keratin. Each of these has a particular amino
acid sequence. Gelatin, or denatured collagen, has a wide variety of uses. It is used in food
items and in drug delivery systems, often forming drug capsules. Casein and whey are both
taken from mild. Casein has uses in adhesives, coatings, and binders. Predominantly, whey is
useful in the food industry. It adds body as a bulking agent.
2.4.12 Synthetic “biopolymers”
Through a process of polymerizing monomers found in nature, honorary biopolymers
are formed. The polymer itself is not directly made from an organism. These are also known
33
as synthetic biopolymers (Stevens, November 1, 2001). Lactic acid, amino acids, and
triacylglycerols are natural compounds that can all be polymerized.
Lactic acid is found in animals and microorganisms. It gives yogurt, buttermilk, and
sourdough their flavor. It is produced through fermentation; the fermentation of sugar
feedstock gives lactic acid. PLA is mostly used for disposable packaging and biomedical
applications such as drug delivery systems. It is made completely from renewable feedstock.
This aliphatic polyester is produced through ring-opening polymerization of lactides and
lactic acid monomers (Voet, Voet, & Pratt, 2006). It has a brittle behavior and has
characteristics similar to synthetic polymers of fossil fuels. However, this polymer is
expensive to produce.
Amino acids and poly(amino acids) are another form of honorary biopolymers. An
example of and poly(amino acid) is poly(aspartic acid). It is a supplement for synthetic
polyacrylate with properties ranging from dispersing detergents to dispersing pigments in
paints (Voet, Voet, & Pratt, 2006).
Triacylglycerols make up the most abundant class of lipid, storage lipids. Solid
triacylglycerols are fats and liquids are oils; making them composed of saturated and
unsaturated fatty acids. Fatty acids are lipids that are made up of hydrocarbon chains with a
terminal hydroxyl (Voet, Voet, & Pratt, 2006). Produced from seeds of soybeans, corn, cotton,
sunflowers, flax, canola, peanuts, and more, triacylglycerols are commercially important for
dietary and industrial applications.
3. Methodology
3.1 Samples
Three samples of “PLA” were used. When obtaining the PLA there were two bags that
the samples could be taken from, both of which were labeled “PLA.” The first bag had been
34
opened and was tested by Sara. She was unable to melt the substance in the bag. The actual
substance in the first PLA bag is polyamide 12. For the experiments, this substance sample is
named PLA 01. The dehydrated version of the sample is named PLA 03. Sample PLA 02 is
from the unopened second bag. This substance is the actual PLA. PLA 01, 02, and 03 is tested
in the extruder, mixer, hot plat, IR, and DCS. PLA 02 is also tested in the GPC.
Four starch samples were created for testing. The materials used for preparing the samples are
starch, glycerol, citric acid, water, and four beakers. 400 grams of each starch sample is
created. Starch sample 1 is composed of 70% starch (210 g), 18% glycerol (54 g), and 12%
water (36 g). This sample was mixed in beaker 1 to insure that the amount of water is 36 g.
The starch and glycerol were dehydrated in an oven for 45 minutes, then the water was added.
This same procedure was carried out for the rest of the samples. In the second beaker, sample
2 was made by mixing 70% starch (210 g), 30% glycerol (75 g), and 5% water (15 g). By
adding 70% starch (210 g) and 30% glycerol (90 g) to the third beaker, sample 3 is created.
For the last sample, starch sample 4, citric acid was mixed in with the starch, glycerol, and
water. In beaker 4, sample for had 70% starch (210 g), 18% glycerol (54 g), 12% water (36 g),
and 3% starch citric acid (9 g). These four samples are used in extrusion and DSC.
Citric acid was tested as a plasticizer with PLA. Based on previous studies, 3% citric acid and
97% PLA were used to make up 10 gram samples. After one failed test and two successful
extrusions, 30 grams were made. The samples were made using a simplified version of an
extruder called a micro-compounder in conjunction with an injection moulders.
3.2 Extruder, Injector, and Molding
When using the extruder, the cleanliness of the screws and plate was checked before
using. The door was closed and the screws were fastened. The machine was turned on
allowing the temperature to be set on the touch screen. Retightening the bolts after shutting
the door insures that the plastic did not leak. The injector temperature was set to match the
35
temperature of the extruder and the molding temperature should be kept at 40 ˚C . After
inserting the hopper and plunger into the extruder, the hopper can be screwed tight. While
pumping the plunger the substance was slowly added. Occasionally the hopper and plunger
would get stuck, so they would have to be cleaned intermediately. The substance was added
until the force reached approximately 5000 N. Next the hopper and plunger were removed,
the plug was inserted and the bolt tightened. While pressing the injector against the dye, the
recycle valve was opened allowing the extruded material to enter the injector. When the
injector bar is displaced by 6.5 centimeters, it can be placed in the molder. The molder was
turned on and the pressure was applied to the displaced injector bar. Once the dumbbell was
formed, it was removed. The extra polymer was then drained from the recycle valve. All of
the materials were then cleaned thoroughly.
Starch, PLA, and blends were extruded. The first time that starch was run through the
extruder, not enough starch was ejected to make a full dumbbell. The dumbbell was only
partially crated. The same problem occurred the second time. Finally a dumbbell was created.
Each of the four starch samples were run through the extruder, injector, and molding. Starch
sample 1 clogged the machine and caused the torque alarm to sound. The temperature was set
higher and the test was attempted to be run again but the machine did not move. The machine
was cleaned and emptied. Without problem, 4 dumbbells were prepared from starch sample 2.
The blend was easy to work with. 4 dumbbells were created from starch sample 3. For the
third attempted, the starch sample 3 did not completely fill the mold. Starch sample 4
produced 4 successful dumbbells. The third trial produced a dumbbell, but it broke when
being removed from the mold.
Three ratios of starch PLA blends were mixed. There were 12 starch PLA blends in
total: four 1 to 1 ratio blends, 4 four to one, and 4 one to four mixes. 10 dumbbells were
attempted for the four one to one ratio blend extrusion. Blend one is made of starch sample
36
one and PLA, blend two is made of starch sample two and PLA. This pattern continues. With
the exception of one to one starch blend 1, 10 dumbbells were created of each. Due to its
difficult nature, only 5 dumbbells were created of starch blend 1. While working with starch
blend 1 two other dumbbells were created, but they broke while being removed from the
mould.
For the starch PLA one to four and four to one ratios, no dumbbells were needed; only
an extrusion was produced. The material was run through the extruder to clean out the
previous mixture. Once the majority of the sample was run through (most of the 10 g inserted)
and the color changed, the extruder was considered ready to produce the extruded sample.
A mixture of 3% citric acid 97% PLA 10 g was run through the extruder. After, 10 g
of PLA was run through twice. The first time the temperature was accidentally turned off.
This sample was used for IR and GPC.
3.3 Mixer
Similarly to the extruder, the “Haake” mixer has dual screws that spin while the
machine heats the material within. Unlike the extruder, the contents have to be removed by
hand. Since only samples were being collected this was a difficulty. PLA, polyamide 12, and
dehydrated polyamide 12 were tested in the mixer.
To the machine both plates were bolted into the augers. The “Haake” machine was
turned on and the dial was first turned and then the emergency stop was released. After
turning on the computer the “Poly program” was opened. Under file, a new data set was
selected. To see the data sheet, “worksheet” was clicked. The air valve was opened slightly so
that there was enough air to move the piston. The RPM, temperature, and time were set
depending on the experiment. “Start heating” is selected under “instrument control.” The
smiley face was clicked. Next the hopper was connected to the feed and the feed was inserted.
By clicking “instrument control” then “start measurements,” the data was collected. To stop
37
the data, again “instrument control was selected,” but “stop measurements” was selected next.
The machine was emptied and cleaned.
Polyamide 12
For each trial, 55 g of Polyamide 12 was added. Since the substance was not melting
the mixer was set to 150 ˚C for the first two trials and the RPM was shifted from 60 RPM to
180 RPM. They were run for 20 minutes each. The temperature was set to 175 ˚C for the
third trial and the RPM was moved to 190. This trial was also run for 20 min.
55 g was added for each of the PLA experiments. The temperature was 150 ˚C with
60 rpm for 20 min. The experiment was repeated three times and each time the torque alarm
sounded. For each of the three PLA trials run, the PLA was added more slowly.
3.4 Differential Scanning Calorimetry
The differential scanning calorimeter was used to look at the thermal properties of the
polymer blends. DSC graphs present glass melting and crystalinity temperature. For this test
approximately 10 mg of the samples were measured and put in a metal capsule. The metal
bottom was taken with a tweezers and then filled with the 10 mg of sample. The cap was
placed on top and then compressed. The filled capsule and the blank was placed in the DSC.
Next ice was poured into the machine. Filling the DCS with ice helps to cool.
In order to prepare for a scan, the “Pyris” program is brought up on the computer and a new
file is created. The file can be placed in an operator file. Our file operator was labeled
“andyrachel.” Since 10 mg was the mass used, 0.010 g are entered for the initial state. The
sample was as well as the file was named. Steps were added to dictate temperature scans and
isotherm steps. Different setting were selected depending on the sample used.
It was calibrated using samples with known masses and melting temperatures. Zinc
and indium were used. Zinc has a melting point of 421 ˚C and indium and a melting point of
164 ˚C . The first of the temperature scans was set to a maximum temperature of 500 ˚C with
38
a rate of 10 ˚C per minute. The starting temperature was set at 50 ˚C . The final step was
labeled from 500 ˚C to 50 ˚C . The same setting was used for the PLA 01.
Various samples were used for DSC analysis. PLA 01, starch powder, starch polymer, and all
four of the polymer PLA/starch samples were studied. For the starch powder, polymers and
blends, the temperature was heated from at 25 ˚C to 200 ˚C at for 10 ˚C per minute then it
was held for 3 minutes at 200 ˚C . Next it was cooled from 200 ˚C to 25 ˚C at 20 ˚C per
minute. The sample was reheated from 25 ˚C to 250 ˚C at 10 ˚C per minute. It was then
cooled back down to 25 ˚C at 20 ˚C per minute. The reading is started by clicking the graph
picture. To view the graph the window button was clicked and then the instrument viewer was
selected. The water and the sample were emptied.
3.5 Melting Temperature
Because there was confusion between PLA and Polyamide 12, a general melting
temperature was investigated. The hot plate was monitored as it was heated from room
temperature to 200. The melting point was recorded.
3.6 Infrared Disk Preparation
A second attempt to differentiate the samples that would not melt in the extruder was
examining the infrared spectra of each substance. PLA 01, 02, and 03 are formed into IR disks
to detect wavelengths produced by bending and stretching. The different wavelengths
characterize bonds between molecules. These wavelengths are interpreted. In order to create
the disks, a hot plate compression device was used. There were three plates placed into the
device. The first and third plates are solid with handles. The second plate not only has a
handle, but has nine holes which act as molds for the IR disks. Sandwiched between the first
and third plate is the second plate, the mold plate.
First the hot plate was heated to 150 ˚C . As the hot plate was heating the first plate is
placed on a table, then a nonadhisive sheet. After the sheet was placed on plate 1, plate 2 was
39
laid on top of the adhesive sheet. Laid in three of the holes was PLA 02. Next an adhesive
sheet then the final plate, plate 3, is placed on top. The plates were put inside of the device
and were compressed for five minutes. As the PLA 02 melts, it takes the shape of the mold.
The plates were removed and separated. The IR disks were popped out of the molds and
trimmed. Later the plates were cleaned. The procedure was repeated for PLA 01 and 03
except the temperatures were set to 270 ˚C . Each PLA sample was run through this process
until three well shape and consistently colored IR disks were produced for each sample.
The PLA and citric acid sample was used to make an IR disk. The hot plate was heated
to 165 ˚C . The same preparation and procedure was used for this IR disk as was used for
PLA 01, 02, and 03 samples.
3.7 Gel Permeation Chromatography
Gel permeation chromatography is a process that determines the molecular weight of
polymers based on how quickly they diffuse through a column. The faster a polymer diffuses
the larger the chains are. Using PLA and the PLA citric acid blend, the GPC was run. First the
THF and sample mixture had to be created. An attempted sample was Polyamide 12. It was
not used because it did not dissolve. Before trying another solvent, it was discovered that
polyamide 12, which was thought to be degraded PLA, was in fact not. For PLA and the PLA
citric acid blend, 0.1000 g were measured. 20 mL of THF was pipetted into a flask with the
sample. A stir bar was added to the flask and the mixture was capped and left to mix and
dissolve over night. The first time that the PLA sample was tested it was not given enough
time to dissolve; it was only given two hours, so it had to be run a second time. The samples
were taken to the GPC machine.
For creating a test, a new file was selected. The operator was entered as “sara” and a
sample ID were created. The flow was set to 1.000 mL with a constant psi. On the top right of
the strip chart “11” was chosen. “Collect single inject” was pressed.
40
The injection sample was prepared by filtration. The filter was put into a tube and
rinsed three times with the sample to assure that it was clean. 100 mL of the sample was taken
up, injected, and loaded. By pressing OK, the GPC injected and closed. To insure that the
experiment starts, we waited for the inject to collect data and then waited for 30 minutes for
the data to finish collecting. After saving the file, the flow was slowly set down to 0.100 mL.
Under the view category, the “baseline” button was selected. The base of the peak was
highlighted. In order to clean the materials, they were soaked in THF. The tube on top of the
GPC was moved out of the waste. The data was analyzed and the machine turned off.
3.8 Scanning Electron Microscopy
Scanning electron microscopy was used to look at the surface morphology of three
polymer blends. We looked at the overall “smoothness” of the surface, correlating smoothness
with increased compatibility due a decrease in starch granules. SEMs are run using a beam of
electrons. The electrons bounce off of the constructed gold plating and create the produced
image. In SEM, these types of signals are produced from having the electrons fire: secondary
electrons, back scattered electrons, characteristic x-rays, light, specimen current and
transmitted electrons. Special detectors are needed to read the signals. The signal is a product
of interacting atoms at the surface of the sample.
Seven pictures were taken of each of the samples run through the SEM. Five samples
were prepared: 80% starch 4 to 20% PLA,50% starch 3 to 50% PLA, 80% starch 3 to 20%
PLA, and 50 % starch 2 to50% PLA, and 80% starch 2 to 20% PLA; however only four of
these samples were photographable. The samples prepared were composed of 10 mm long
pieces of extruded composites. Each piece was placed in a beaker. 10 mL of chloroform was
pipetted into the beaker. The sample was left for six hours. To bring the sample to a solid state,
the solvent, chloroform, was evaporated under a vacuum. The beaker remained in the vacuum
overnight. The sample dissolved during the day and dried during the night. The samples were

41
coated in gold and tested. Sara Ronasi coated and scanned the samples. The samples were
scanned at two magnifications: 20 and 50 µm.
42
4. Result and Discussion
4.1 Samples
PLA was dried prior to mixing in to the samples. Using liquid nitrogen, the PLA as
well as the samples were dried. For starch samples, the mixture was dried and then water was
mixed in. There could be human error when sealing the samples was preformed. Once it was
seen that the seals had broken. This could give faulty results because the polymers might form
differently. The measuring out the blends was done using a scale that rounded to the nearest
whole number. This could alter the accuracy of the measurements.
4.2 Extruding, Injecting, and Molding
The DSM Xplore 15 ml Micro-compounder (extruder) breaks the polymer bonds,
therefore shortening the chains. The injector takes up the expelled plastic and releases it into
the molding. Each of the four starch samples were run through the extruder, injector, and
molding.
Technical specifications of the extruder:
Batch-volume: 15 ml (batch size 2-3-15 ml multiple recirculation channels)
Detachable conical screws (Hardness 54 HRc)
Chemical resistance up to 450 °C between pH 0-14
Heating time (from 80 to 240 °C): <10 min.
Maximum axial Force: up to 9500 N
Screw speed: continuously variable 1 - 250 RPM
The large batch-volume allowed for the injector to be filled fully. Showing how full
the machine is, the axial force increases. The force maximum is 9500 N. Detachable conical
screws are easy to remove and insert by hand. When cleaning they are removed. The machine
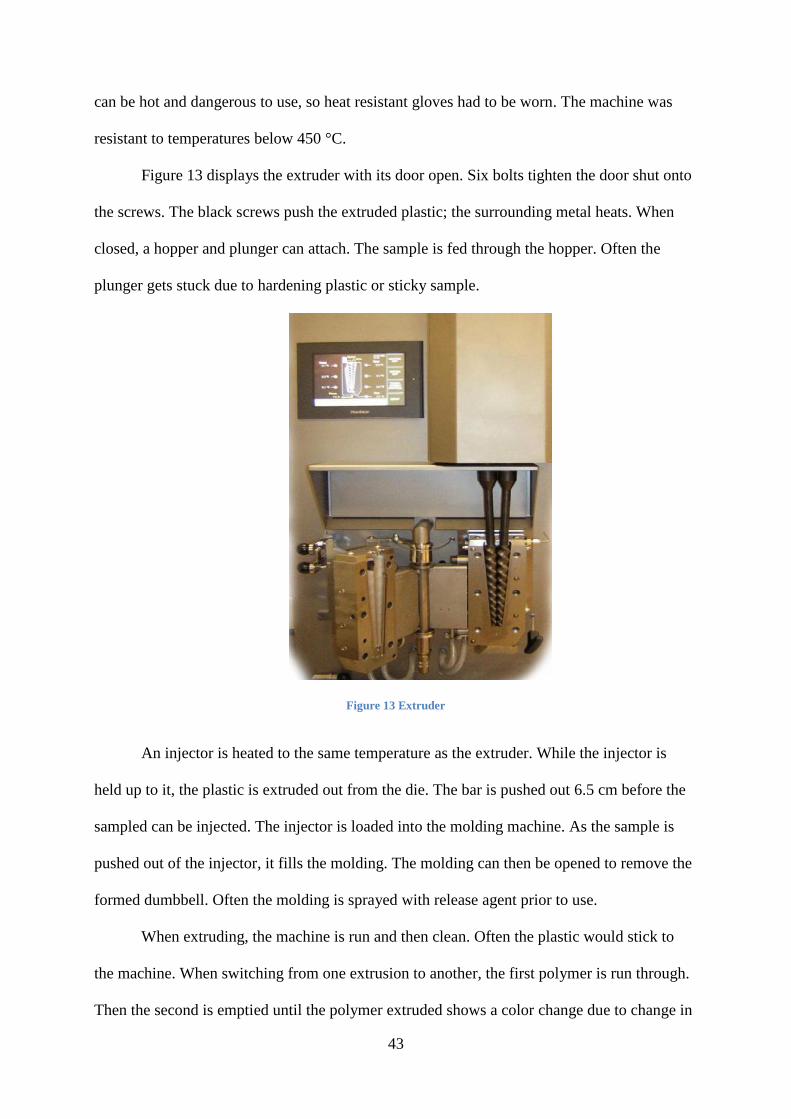
43
can be hot and dangerous to use, so heat resistant gloves had to be worn. The machine was
resistant to temperatures below 450 °C.
Figure 13 displays the extruder with its door open. Six bolts tighten the door shut onto
the screws. The black screws push the extruded plastic; the surrounding metal heats. When
closed, a hopper and plunger can attach. The sample is fed through the hopper. Often the
plunger gets stuck due to hardening plastic or sticky sample.
Figure 13 Extruder
An injector is heated to the same temperature as the extruder. While the injector is
held up to it, the plastic is extruded out from the die. The bar is pushed out 6.5 cm before the
sampled can be injected. The injector is loaded into the molding machine. As the sample is
pushed out of the injector, it fills the molding. The molding can then be opened to remove the
formed dumbbell. Often the molding is sprayed with release agent prior to use.
When extruding, the machine is run and then clean. Often the plastic would stick to
the machine. When switching from one extrusion to another, the first polymer is run through.
Then the second is emptied until the polymer extruded shows a color change due to change in
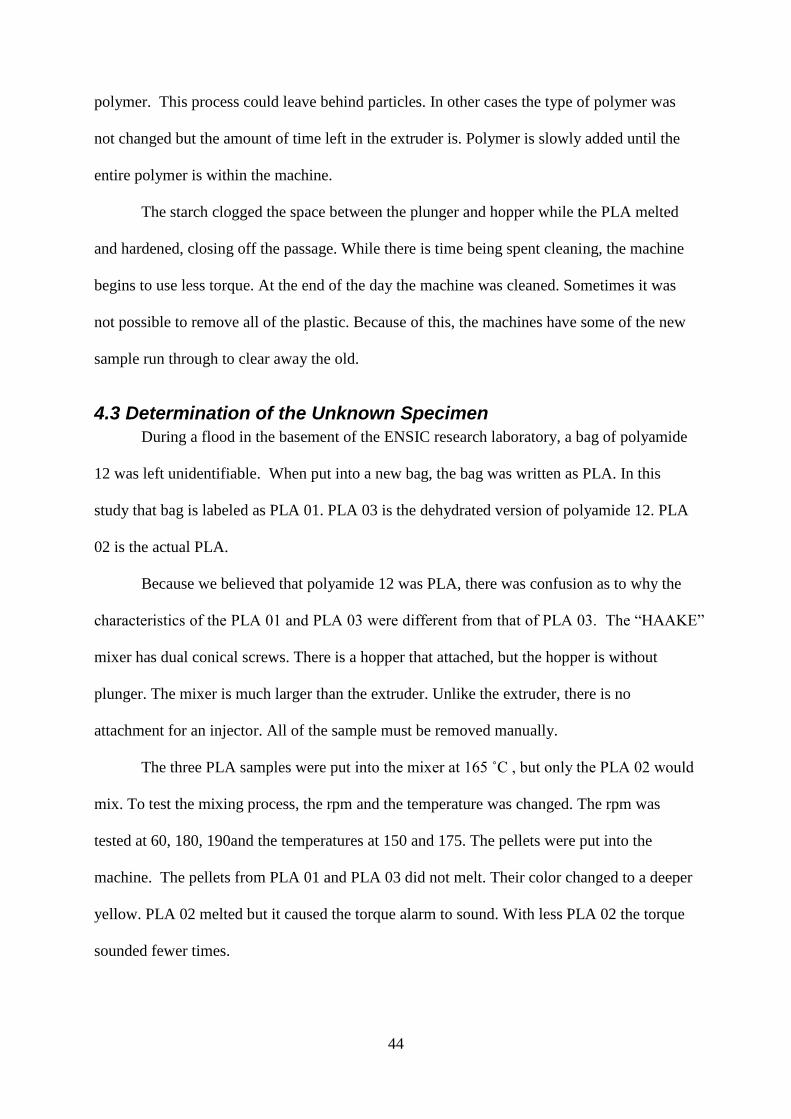
44
polymer. This process could leave behind particles. In other cases the type of polymer was
not changed but the amount of time left in the extruder is. Polymer is slowly added until the
entire polymer is within the machine.
The starch clogged the space between the plunger and hopper while the PLA melted
and hardened, closing off the passage. While there is time being spent cleaning, the machine
begins to use less torque. At the end of the day the machine was cleaned. Sometimes it was
not possible to remove all of the plastic. Because of this, the machines have some of the new
sample run through to clear away the old.
4.3 Determination of the Unknown Specimen
During a flood in the basement of the ENSIC research laboratory, a bag of polyamide
12 was left unidentifiable. When put into a new bag, the bag was written as PLA. In this
study that bag is labeled as PLA 01. PLA 03 is the dehydrated version of polyamide 12. PLA
02 is the actual PLA.
Because we believed that polyamide 12 was PLA, there was confusion as to why the
characteristics of the PLA 01 and PLA 03 were different from that of PLA 03. The “HAAKE”
mixer has dual conical screws. There is a hopper that attached, but the hopper is without
plunger. The mixer is much larger than the extruder. Unlike the extruder, there is no
attachment for an injector. All of the sample must be removed manually.
The three PLA samples were put into the mixer at 165 ˚C , but only the PLA 02 would
mix. To test the mixing process, the rpm and the temperature was changed. The rpm was
tested at 60, 180, 190and the temperatures at 150 and 175. The pellets were put into the
machine. The pellets from PLA 01 and PLA 03 did not melt. Their color changed to a deeper
yellow. PLA 02 melted but it caused the torque alarm to sound. With less PLA 02 the torque
sounded fewer times.
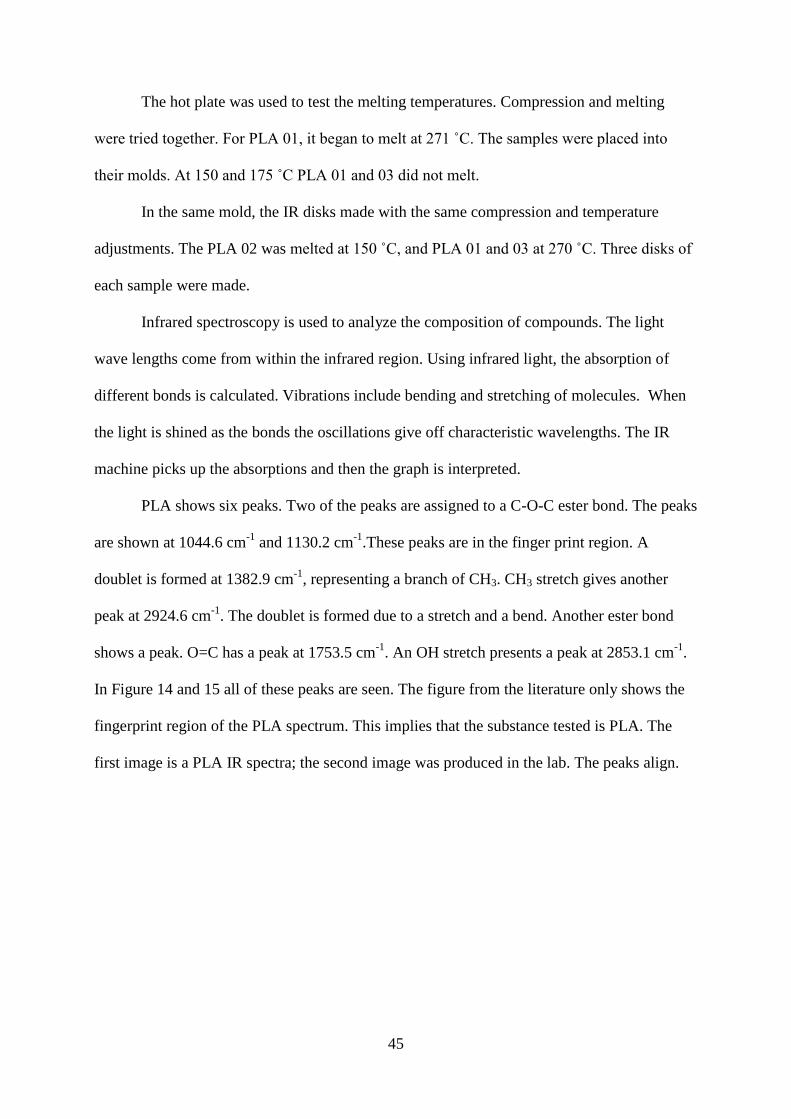
45
The hot plate was used to test the melting temperatures. Compression and melting
were tried together. For PLA 01, it began to melt at 271 ˚C. The samples were placed into
their molds. At 150 and 175 ˚C PLA 01 and 03 did not melt.
In the same mold, the IR disks made with the same compression and temperature
adjustments. The PLA 02 was melted at 150 ˚C, and PLA 01 and 03 at 270 ˚C. Three disks of
each sample were made.
Infrared spectroscopy is used to analyze the composition of compounds. The light
wave lengths come from within the infrared region. Using infrared light, the absorption of
different bonds is calculated. Vibrations include bending and stretching of molecules. When
the light is shined as the bonds the oscillations give off characteristic wavelengths. The IR
machine picks up the absorptions and then the graph is interpreted.
PLA shows six peaks. Two of the peaks are assigned to a C-O-C ester bond. The peaks
are shown at 1044.6 cm-1
and 1130.2 cm-1
.These peaks are in the finger print region. A
doublet is formed at 1382.9 cm-1
, representing a branch of CH3. CH3 stretch gives another
peak at 2924.6 cm-1
. The doublet is formed due to a stretch and a bend. Another ester bond
shows a peak. O=C has a peak at 1753.5 cm-1
. An OH stretch presents a peak at 2853.1 cm-1
.
In Figure 14 and 15 all of these peaks are seen. The figure from the literature only shows the
fingerprint region of the PLA spectrum. This implies that the substance tested is PLA. The
first image is a PLA IR spectra; the second image was produced in the lab. The peaks align.
46
Figure 14 Established PLA IR Spectrum
Figure 15 Sample 02 was determined to be PLA. The peaks of this IR spectrum match with the peaks on Figure 17.
PLA 01 and 03 were found to be polyamide 12. IR spectroscopy is one of the tests that
showed this. PLA 03 is dehydrated polyamide 12. Figure 16 is PLA 01 and Figure 17 is PLA
03. Both spectra displayed the same peaks, showing that they are the same substance. One of
the keys to discovering that this substance was not PLA was noting the nitrogen bonds in the
graphs. A nitrogen hydrogen bend peak is found at 1536.9 cm-1
. At 1633.5 cm-1
there is a
C=O stretch peak. Shown at 2933.5 cm-1
is a C-H alkane stretch peak. An N-H stretch gives a
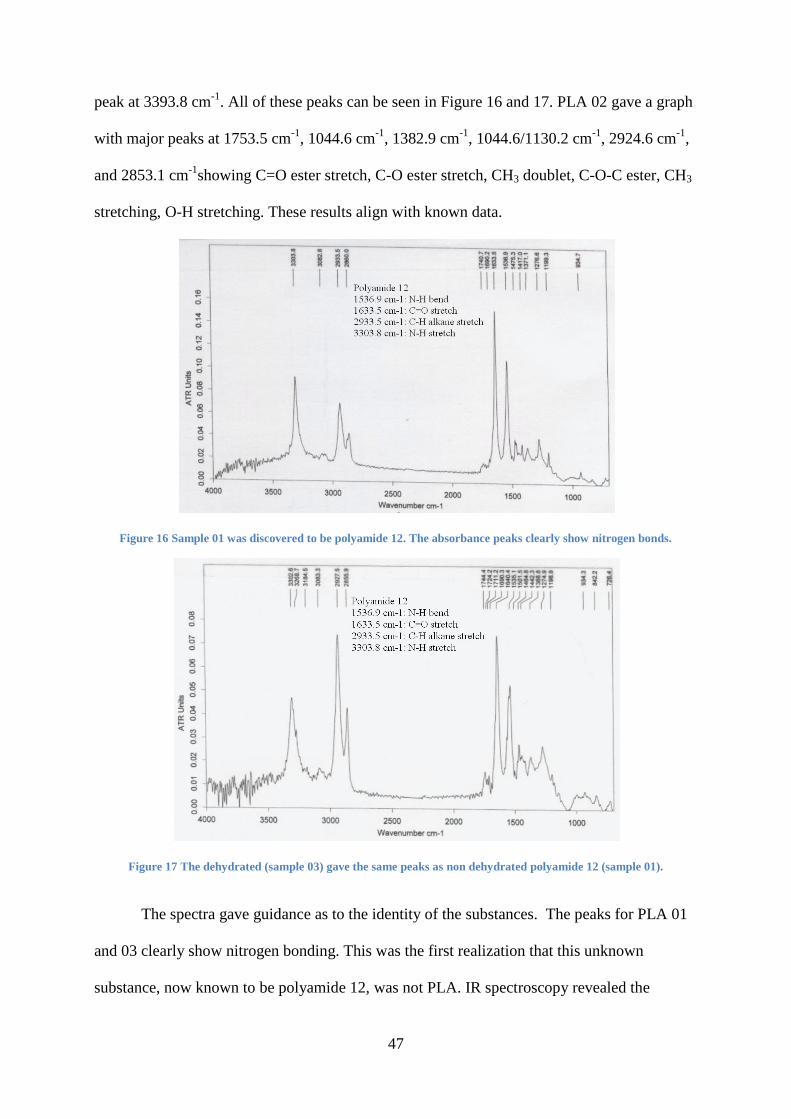
47
peak at 3393.8 cm-1
. All of these peaks can be seen in Figure 16 and 17. PLA 02 gave a graph
with major peaks at 1753.5 cm-1
, 1044.6 cm-1
, 1382.9 cm-1
, 1044.6/1130.2 cm-1
, 2924.6 cm-1
,
and 2853.1 cm-1
showing C=O ester stretch, C-O ester stretch, CH3 doublet, C-O-C ester, CH3
stretching, O-H stretching. These results align with known data.
Figure 16 Sample 01 was discovered to be polyamide 12. The absorbance peaks clearly show nitrogen bonds.
Figure 17 The dehydrated (sample 03) gave the same peaks as non dehydrated polyamide 12 (sample 01).
The spectra gave guidance as to the identity of the substances. The peaks for PLA 01
and 03 clearly show nitrogen bonding. This was the first realization that this unknown
substance, now known to be polyamide 12, was not PLA. IR spectroscopy revealed the
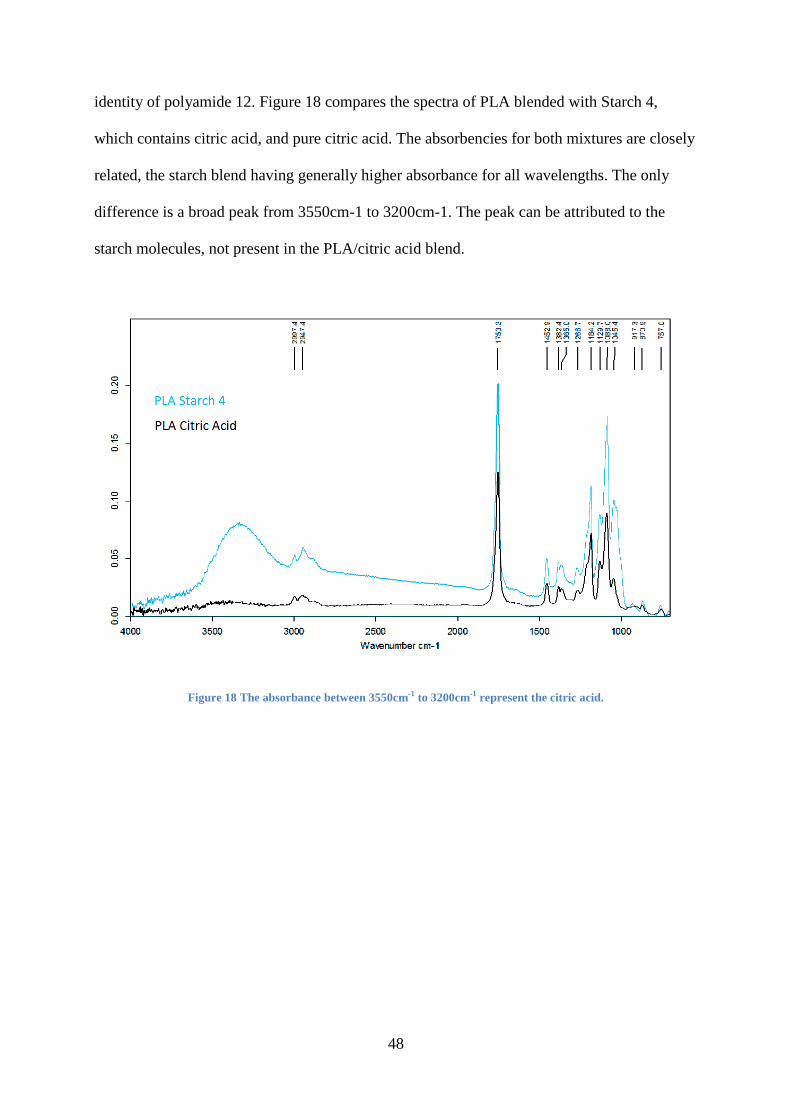
48
identity of polyamide 12. Figure 18 compares the spectra of PLA blended with Starch 4,
which contains citric acid, and pure citric acid. The absorbencies for both mixtures are closely
related, the starch blend having generally higher absorbance for all wavelengths. The only
difference is a broad peak from 3550cm-1 to 3200cm-1. The peak can be attributed to the
starch molecules, not present in the PLA/citric acid blend.
Figure 18 The absorbance between 3550cm-1 to 3200cm-1 represent the citric acid.
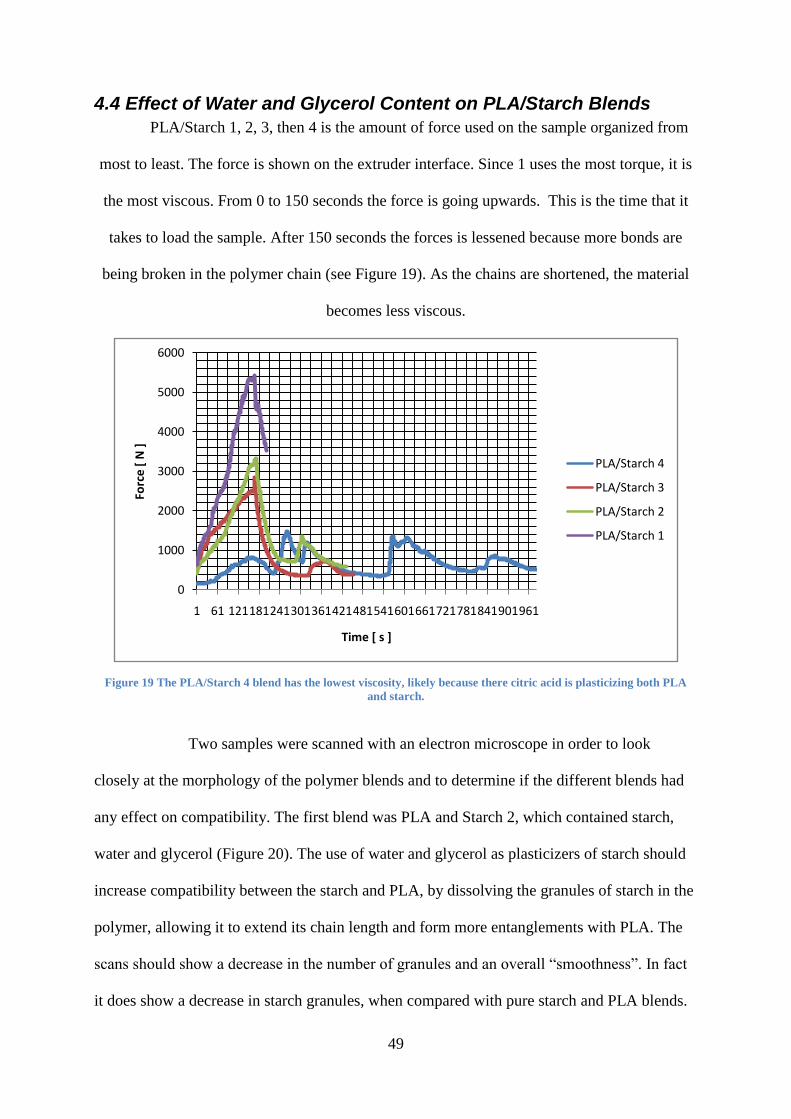
49
4.4 Effect of Water and Glycerol Content on PLA/Starch Blends
PLA/Starch 1, 2, 3, then 4 is the amount of force used on the sample organized from
most to least. The force is shown on the extruder interface. Since 1 uses the most torque, it is
the most viscous. From 0 to 150 seconds the force is going upwards. This is the time that it
takes to load the sample. After 150 seconds the forces is lessened because more bonds are
being broken in the polymer chain (see Figure 19). As the chains are shortened, the material
becomes less viscous.
Figure 19 The PLA/Starch 4 blend has the lowest viscosity, likely because there citric acid is plasticizing both PLA
and starch.
Two samples were scanned with an electron microscope in order to look
closely at the morphology of the polymer blends and to determine if the different blends had
any effect on compatibility. The first blend was PLA and Starch 2, which contained starch,
water and glycerol (Figure 20). The use of water and glycerol as plasticizers of starch should
increase compatibility between the starch and PLA, by dissolving the granules of starch in the
polymer, allowing it to extend its chain length and form more entanglements with PLA. The
scans should show a decrease in the number of granules and an overall “smoothness”. In fact
it does show a decrease in starch granules, when compared with pure starch and PLA blends.
0
1000
2000
3000
4000
5000
6000
1 61 121181241301361421481541601661721781841901961
Forc
e [
N ]
Time [ s ]
PLA/Starch 4
PLA/Starch 3
PLA/Starch 2
PLA/Starch 1
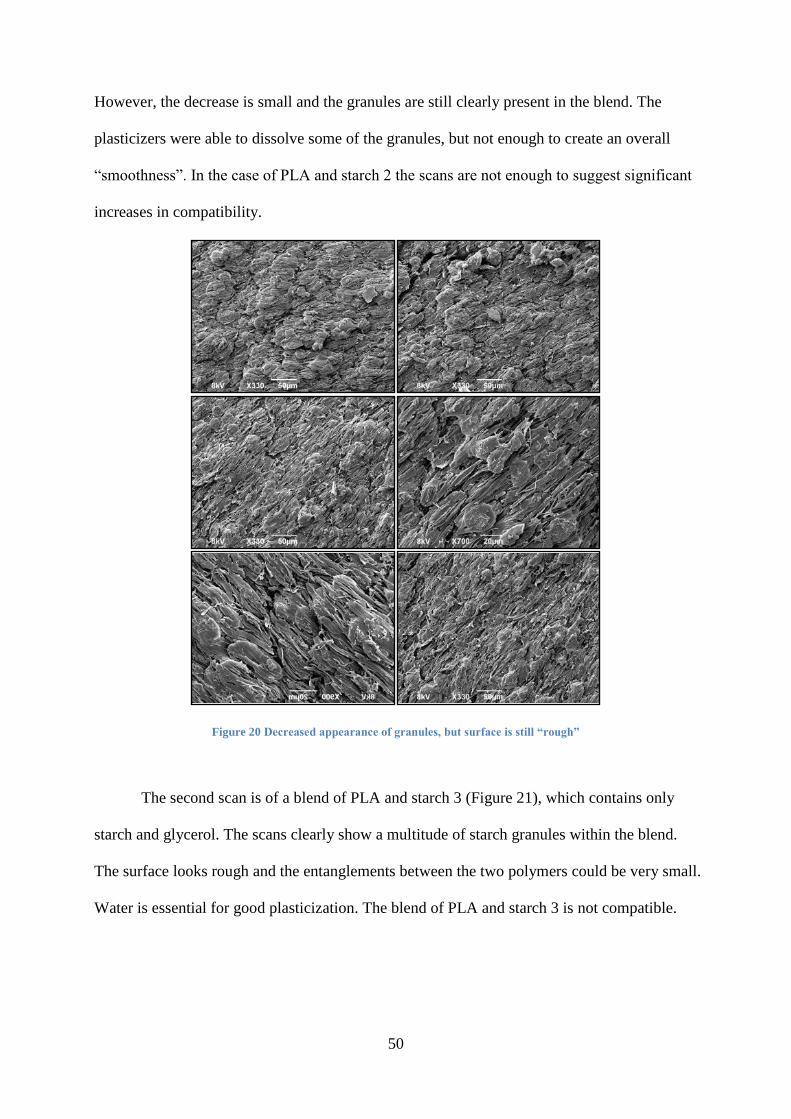
50
However, the decrease is small and the granules are still clearly present in the blend. The
plasticizers were able to dissolve some of the granules, but not enough to create an overall
“smoothness”. In the case of PLA and starch 2 the scans are not enough to suggest significant
increases in compatibility.
Figure 20 Decreased appearance of granules, but surface is still “rough”
The second scan is of a blend of PLA and starch 3 (Figure 21), which contains only
starch and glycerol. The scans clearly show a multitude of starch granules within the blend.
The surface looks rough and the entanglements between the two polymers could be very small.
Water is essential for good plasticization. The blend of PLA and starch 3 is not compatible.
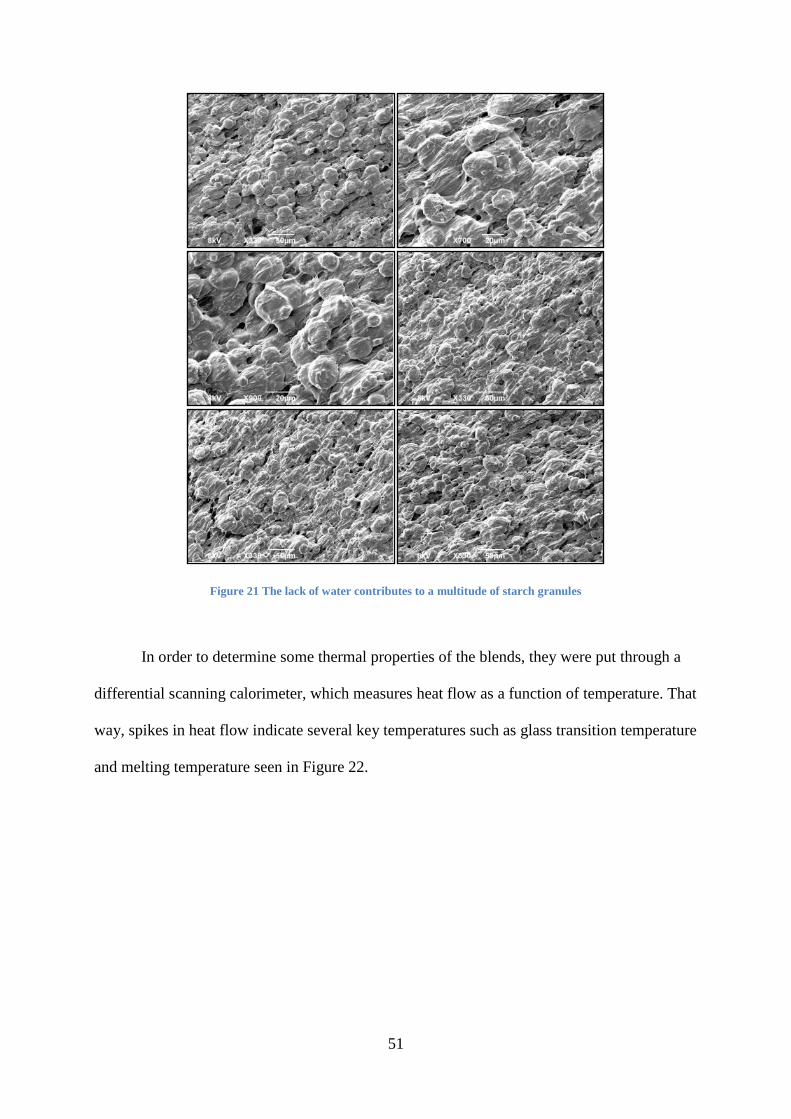
51
Figure 21 The lack of water contributes to a multitude of starch granules
In order to determine some thermal properties of the blends, they were put through a
differential scanning calorimeter, which measures heat flow as a function of temperature. That
way, spikes in heat flow indicate several key temperatures such as glass transition temperature
and melting temperature seen in Figure 22.
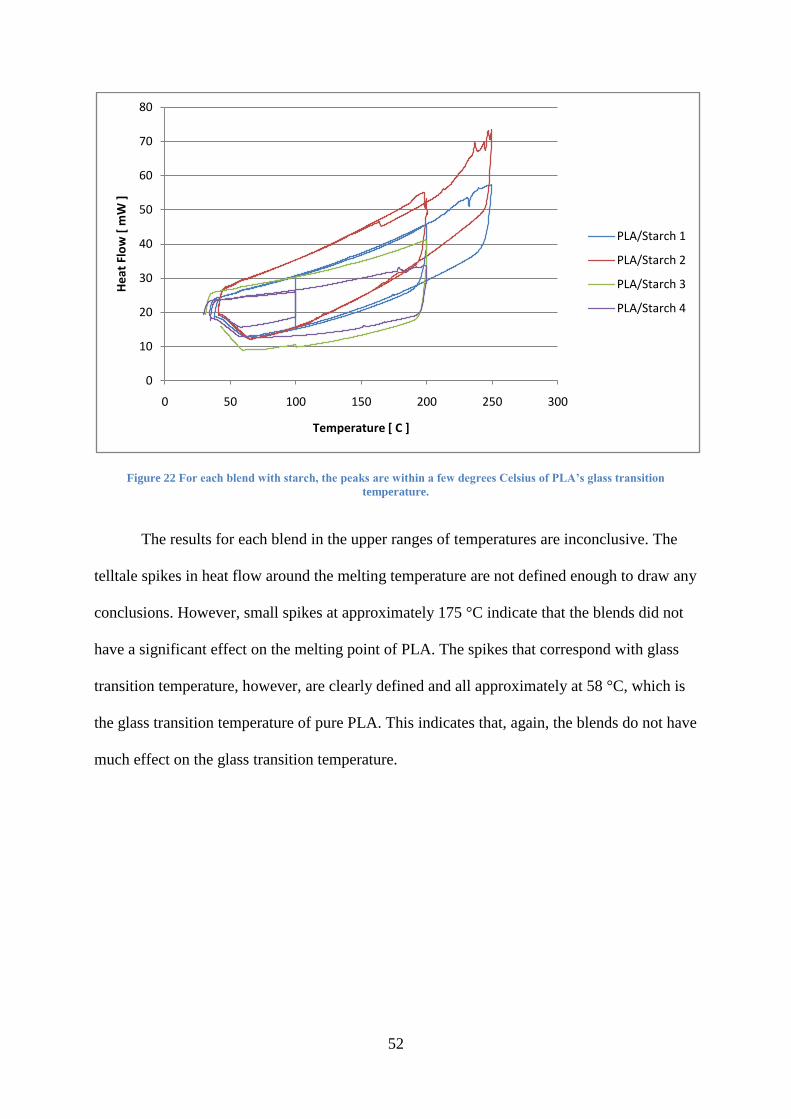
52
Figure 22 For each blend with starch, the peaks are within a few degrees Celsius of PLA’s glass transition
temperature.
The results for each blend in the upper ranges of temperatures are inconclusive. The
telltale spikes in heat flow around the melting temperature are not defined enough to draw any
conclusions. However, small spikes at approximately 175 °C indicate that the blends did not
have a significant effect on the melting point of PLA. The spikes that correspond with glass
transition temperature, however, are clearly defined and all approximately at 58 °C, which is
the glass transition temperature of pure PLA. This indicates that, again, the blends do not have
much effect on the glass transition temperature.
0
10
20
30
40
50
60
70
80
0 50 100 150 200 250 300
He
at F
low
[ m
W ]
Temperature [ C ]
PLA/Starch 1
PLA/Starch 2
PLA/Starch 3
PLA/Starch 4
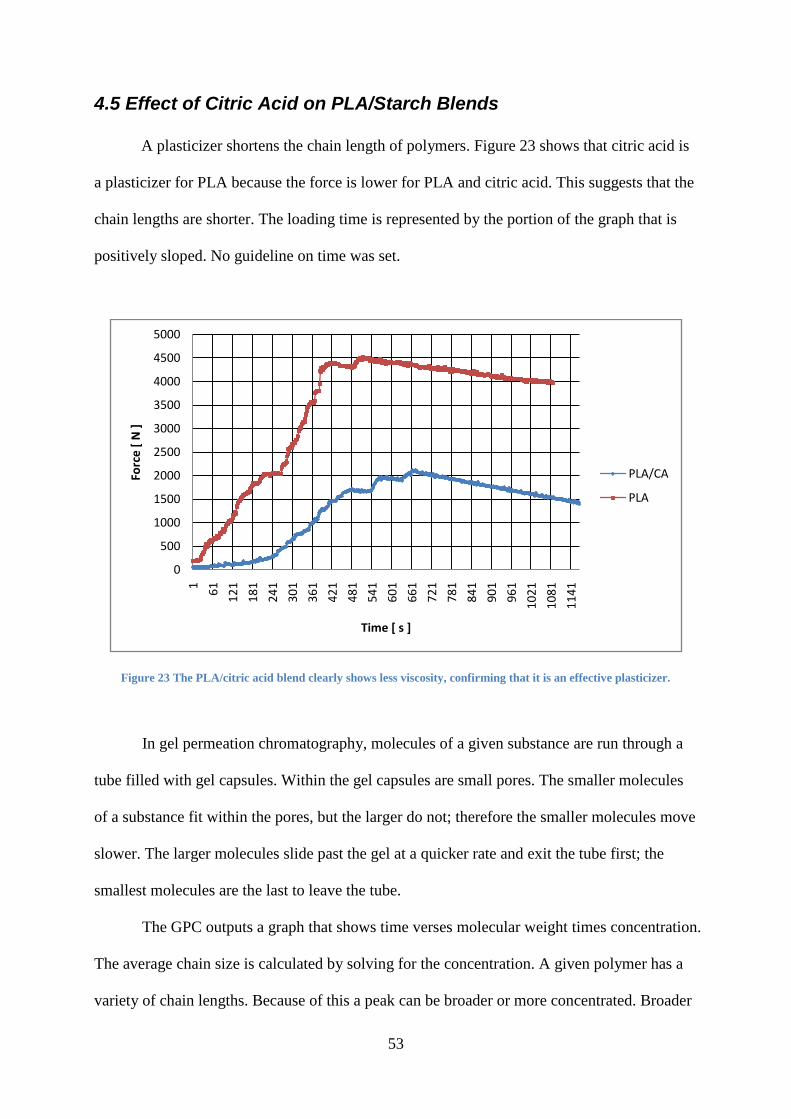
53
4.5 Effect of Citric Acid on PLA/Starch Blends
A plasticizer shortens the chain length of polymers. Figure 23 shows that citric acid is
a plasticizer for PLA because the force is lower for PLA and citric acid. This suggests that the
chain lengths are shorter. The loading time is represented by the portion of the graph that is
positively sloped. No guideline on time was set.
Figure 23 The PLA/citric acid blend clearly shows less viscosity, confirming that it is an effective plasticizer.
In gel permeation chromatography, molecules of a given substance are run through a
tube filled with gel capsules. Within the gel capsules are small pores. The smaller molecules
of a substance fit within the pores, but the larger do not; therefore the smaller molecules move
slower. The larger molecules slide past the gel at a quicker rate and exit the tube first; the
smallest molecules are the last to leave the tube.
The GPC outputs a graph that shows time verses molecular weight times concentration.
The average chain size is calculated by solving for the concentration. A given polymer has a
variety of chain lengths. Because of this a peak can be broader or more concentrated. Broader
0
500
1000
1500
2000
2500
3000
3500
4000
4500
5000
1
61
12
1
18
1
24
1
30
1
36
1
42
1
48
1
54
1
60
1
66
1
72
1
78
1
84
1
90
1
96
1
10
21
10
81
11
41
Forc
e [
N ]
Time [ s ]
PLA/CA
PLA
54
peaks show a larger spectrum of chains lengths. A concentrated peak shows a high number of
similar sized chains. Smaller particles produce a graph shifted towards the right and larger
molecules shift the peak towards the left. This is a result of the slower movement of smaller
particles and quicker movement of the larger particles. Large particles cannot enter gel and
are excluded. They have less volume to traverse and elute sooner. Small particles can enter
gel and have more volume to traverse. They elute later.
As the molecules move out of the tube the concentration and molecular weight are
determined. These are found using the diffraction angle of the light. A laser is pointed at the
molecule and the waves are received within a encapsulated region of the machine. This is
illustrated in Figure 24. The GPC outputs a graph that shows time verses molecular weight
times concentration. The average chain size is calculated by solving for the concentration. A
given polymer has a variety of chain lengths. Because of this a peak can be broader or more
concentrated. Broader peaks show a larger spectrum of chains lengths. A concentrated peak
shows a high number of similar sized chains. Smaller particles produce a graph shifted
towards the right and larger molecules shift the peak towards the left. This is a result of the
slower movement of smaller particles and quicker movement of the larger particles. Large
particles cannot enter gel and are excluded. They have less volume to traverse and elute
sooner. Small particles can enter gel and have more volume to traverse. They elute later. An
illustration is provided in Figure 25.

55
Figure 24 interior of the GPC. The laser is pointed on the sample then the diffraction angle can be found.
Figure 25 Absorbance shifts to the right for smaller pieces because they come out of the tube last. Larger molecules
are expelled first. The smaller pieces are slower moving because of diffusion. (GPC Theory: Separation, 2008)
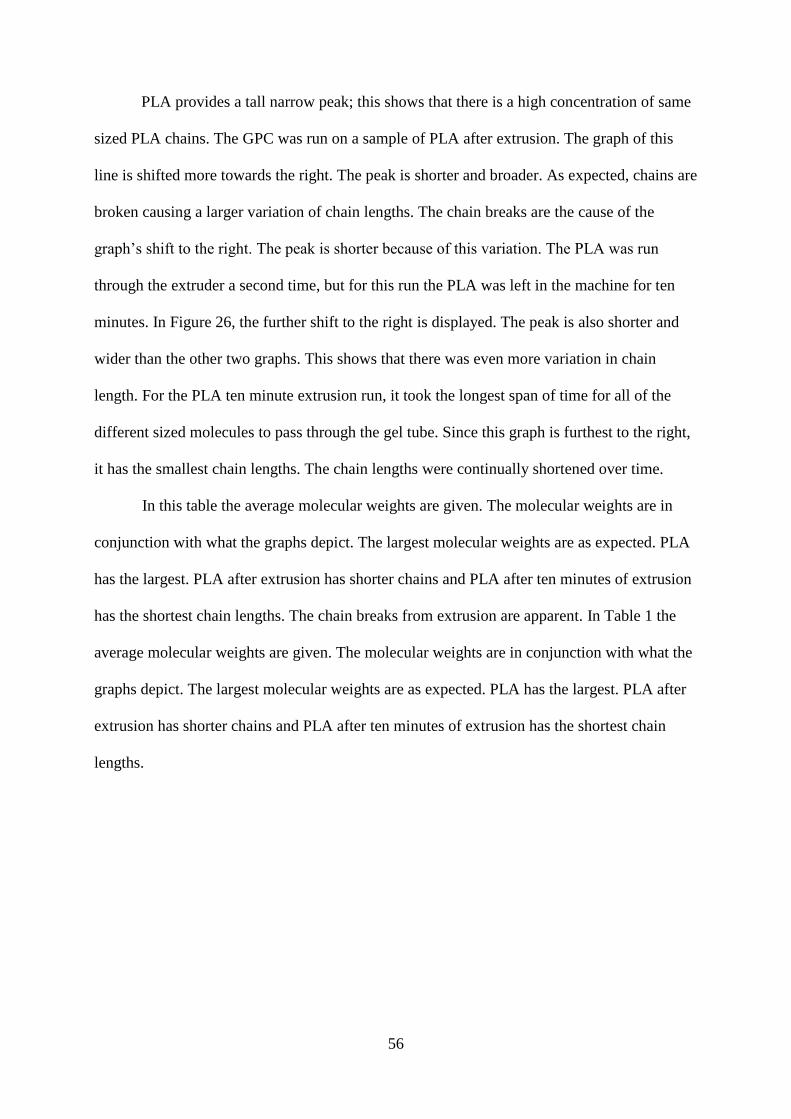
56
PLA provides a tall narrow peak; this shows that there is a high concentration of same
sized PLA chains. The GPC was run on a sample of PLA after extrusion. The graph of this
line is shifted more towards the right. The peak is shorter and broader. As expected, chains are
broken causing a larger variation of chain lengths. The chain breaks are the cause of the
graph’s shift to the right. The peak is shorter because of this variation. The PLA was run
through the extruder a second time, but for this run the PLA was left in the machine for ten
minutes. In Figure 26, the further shift to the right is displayed. The peak is also shorter and
wider than the other two graphs. This shows that there was even more variation in chain
length. For the PLA ten minute extrusion run, it took the longest span of time for all of the
different sized molecules to pass through the gel tube. Since this graph is furthest to the right,
it has the smallest chain lengths. The chain lengths were continually shortened over time.
In this table the average molecular weights are given. The molecular weights are in
conjunction with what the graphs depict. The largest molecular weights are as expected. PLA
has the largest. PLA after extrusion has shorter chains and PLA after ten minutes of extrusion
has the shortest chain lengths. The chain breaks from extrusion are apparent. In Table 1 the
average molecular weights are given. The molecular weights are in conjunction with what the
graphs depict. The largest molecular weights are as expected. PLA has the largest. PLA after
extrusion has shorter chains and PLA after ten minutes of extrusion has the shortest chain
lengths.
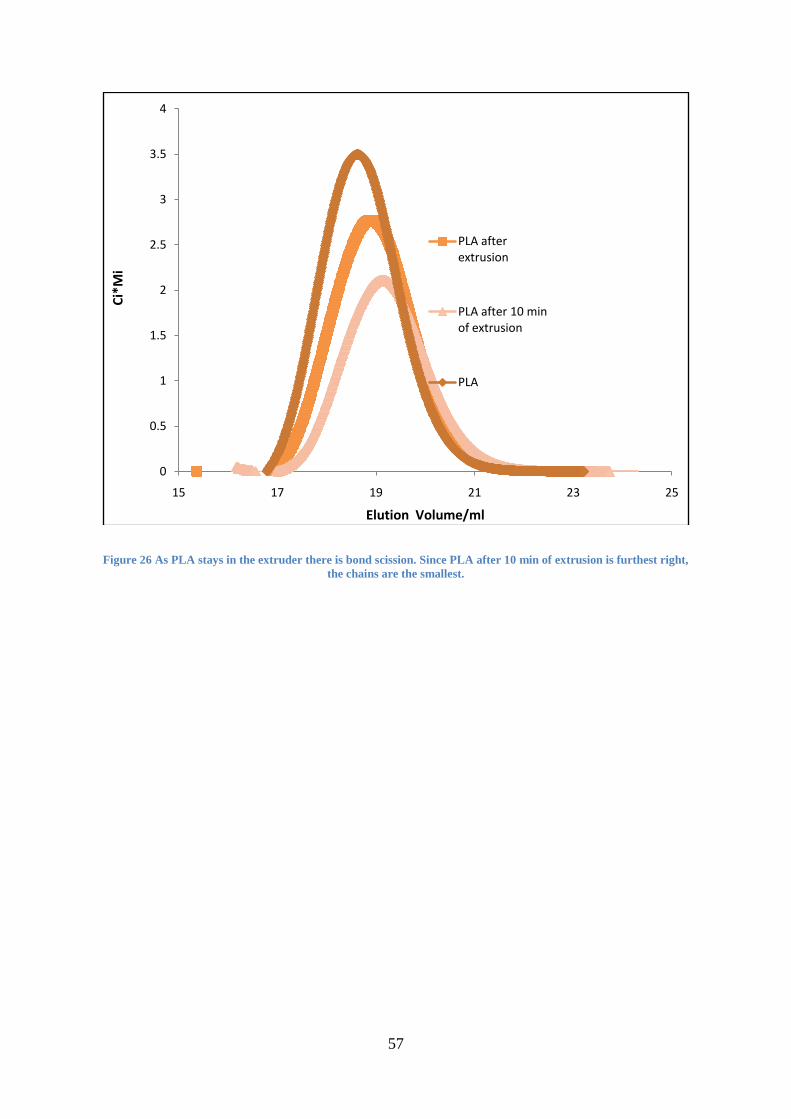
57
Figure 26 As PLA stays in the extruder there is bond scission. Since PLA after 10 min of extrusion is furthest right,
the chains are the smallest.
0
0.5
1
1.5
2
2.5
3
3.5
4
15 17 19 21 23 25
Ci*
Mi
Elution Volume/ml
PLA after extrusion
PLA after 10 min of extrusion
PLA
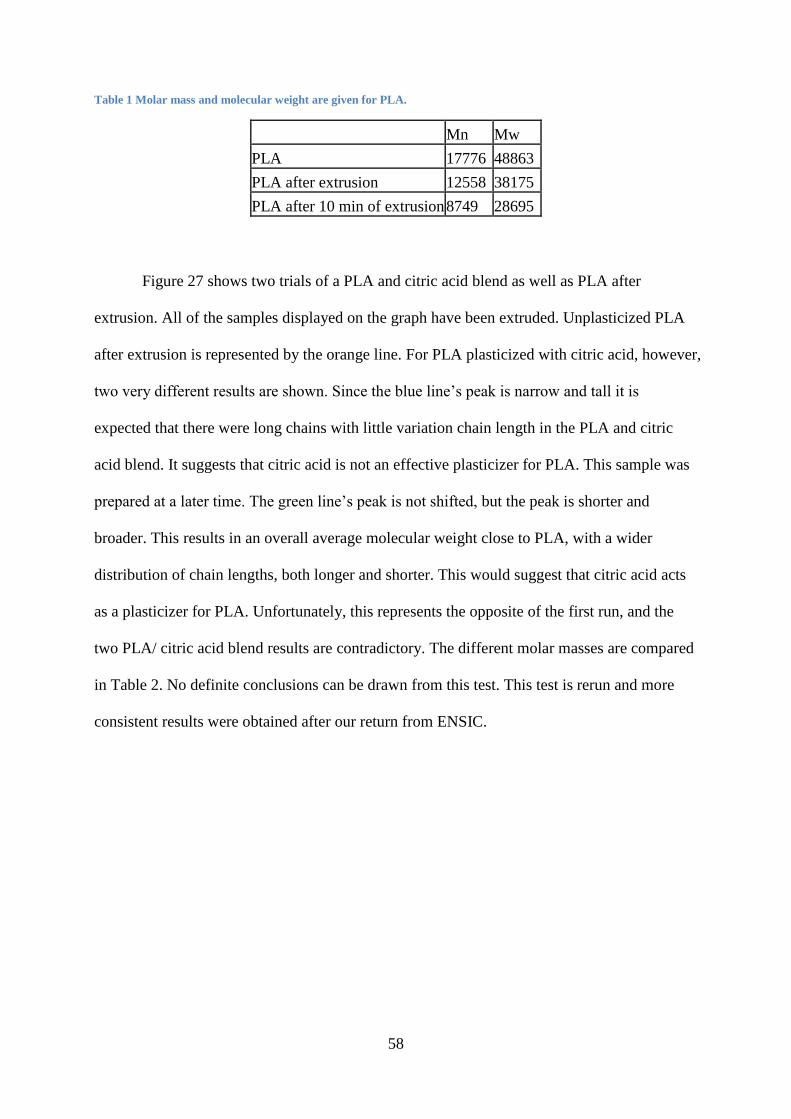
58
Table 1 Molar mass and molecular weight are given for PLA.
Mn Mw
PLA 17776 48863
PLA after extrusion 12558 38175
PLA after 10 min of extrusion 8749 28695
Figure 27 shows two trials of a PLA and citric acid blend as well as PLA after
extrusion. All of the samples displayed on the graph have been extruded. Unplasticized PLA
after extrusion is represented by the orange line. For PLA plasticized with citric acid, however,
two very different results are shown. Since the blue line’s peak is narrow and tall it is
expected that there were long chains with little variation chain length in the PLA and citric
acid blend. It suggests that citric acid is not an effective plasticizer for PLA. This sample was
prepared at a later time. The green line’s peak is not shifted, but the peak is shorter and
broader. This results in an overall average molecular weight close to PLA, with a wider
distribution of chain lengths, both longer and shorter. This would suggest that citric acid acts
as a plasticizer for PLA. Unfortunately, this represents the opposite of the first run, and the
two PLA/ citric acid blend results are contradictory. The different molar masses are compared
in Table 2. No definite conclusions can be drawn from this test. This test is rerun and more
consistent results were obtained after our return from ENSIC.
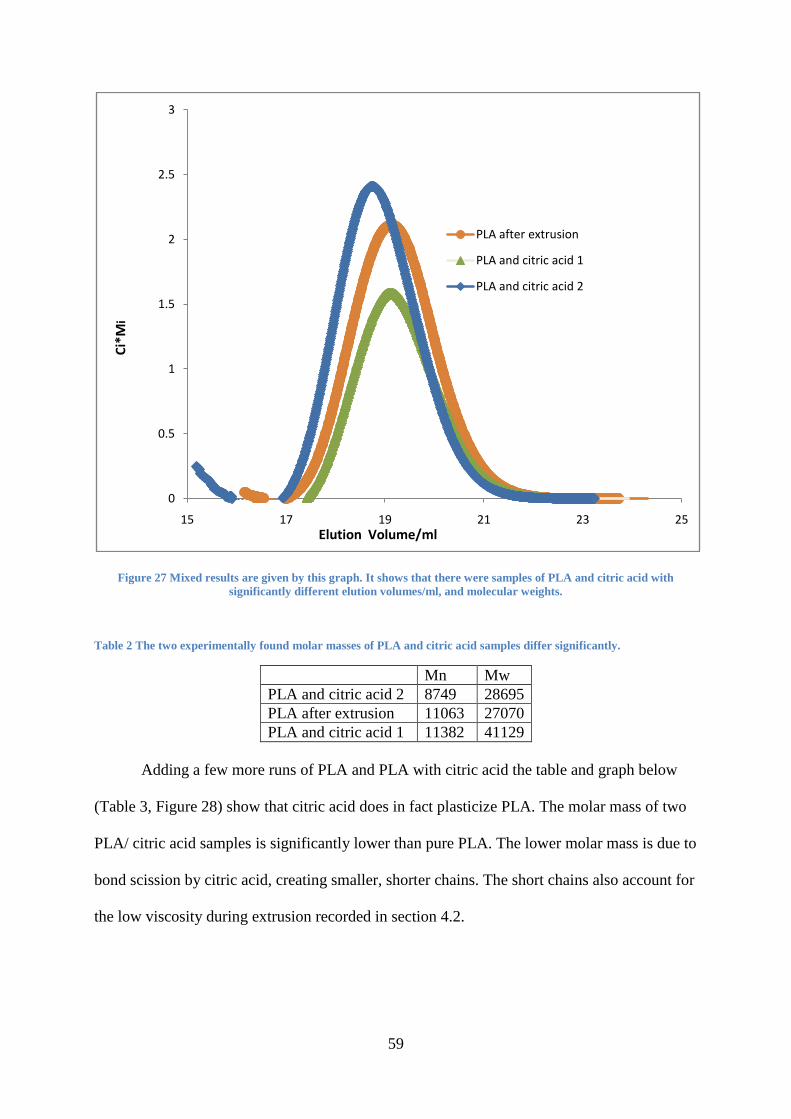
59
Figure 27 Mixed results are given by this graph. It shows that there were samples of PLA and citric acid with
significantly different elution volumes/ml, and molecular weights.
Table 2 The two experimentally found molar masses of PLA and citric acid samples differ significantly.
Mn Mw
PLA and citric acid 2 8749 28695
PLA after extrusion 11063 27070
PLA and citric acid 1 11382 41129
Adding a few more runs of PLA and PLA with citric acid the table and graph below
(Table 3, Figure 28) show that citric acid does in fact plasticize PLA. The molar mass of two
PLA/ citric acid samples is significantly lower than pure PLA. The lower molar mass is due to
bond scission by citric acid, creating smaller, shorter chains. The short chains also account for
the low viscosity during extrusion recorded in section 4.2.
0
0.5
1
1.5
2
2.5
3
15 17 19 21 23 25
Ci*
Mi
Elution Volume/ml
PLA after extrusion
PLA and citric acid 1
PLA and citric acid 2
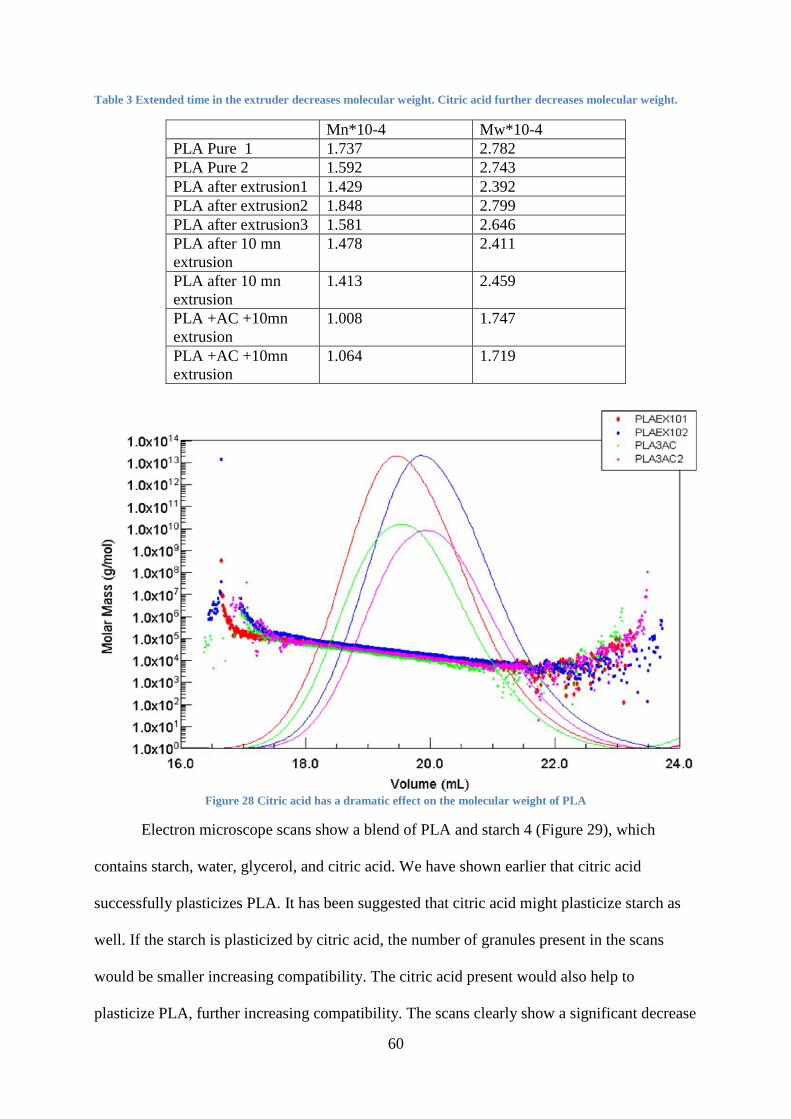
60
Table 3 Extended time in the extruder decreases molecular weight. Citric acid further decreases molecular weight.
Mn*10-4 Mw*10-4
PLA Pure 1 1.737 2.782
PLA Pure 2 1.592 2.743
PLA after extrusion1 1.429 2.392
PLA after extrusion2 1.848 2.799
PLA after extrusion3 1.581 2.646
PLA after 10 mn
extrusion
1.478 2.411
PLA after 10 mn
extrusion
1.413 2.459
PLA +AC +10mn
extrusion
1.008 1.747
PLA +AC +10mn
extrusion
1.064 1.719
Figure 28 Citric acid has a dramatic effect on the molecular weight of PLA
Electron microscope scans show a blend of PLA and starch 4 (Figure 29), which
contains starch, water, glycerol, and citric acid. We have shown earlier that citric acid
successfully plasticizes PLA. It has been suggested that citric acid might plasticize starch as
well. If the starch is plasticized by citric acid, the number of granules present in the scans
would be smaller increasing compatibility. The citric acid present would also help to
plasticize PLA, further increasing compatibility. The scans clearly show a significant decrease
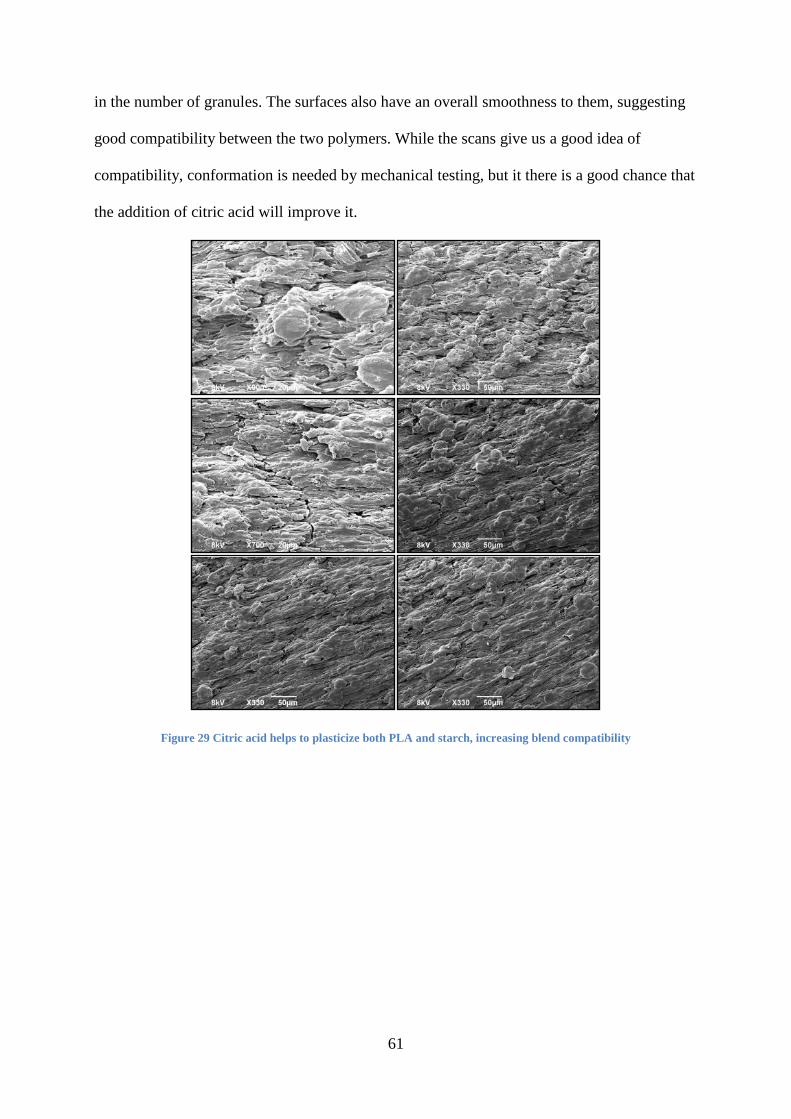
61
in the number of granules. The surfaces also have an overall smoothness to them, suggesting
good compatibility between the two polymers. While the scans give us a good idea of
compatibility, conformation is needed by mechanical testing, but it there is a good chance that
the addition of citric acid will improve it.
Figure 29 Citric acid helps to plasticize both PLA and starch, increasing blend compatibility
62
5. Conclusion The poly(lactic) acid pellets were not melting in the extruder, the hot plate, nor the
mixer was because the pellets were polyamide, not poly(lactic) acid. It was a possibility that
the PLA was of a different tacticity, making it amorphous and therefore without a melting
point. By examining the infrared spectrum of several samples, and comparing them to PLA’s
established spectrum, we determined that the samples were neither PLA nor any compound
PLA decomposes into. The mix up was caused by mislabeling.
Water is essential for good plasticization of starch. Glycerol was also used to plasticize
starch before being blended with PLA. Using a constant weight percentage of 70 for starch, as
water content decreased from 18 – 0 wt%, glycerol increasing from 12 – 30 wt%, we obtained
two separate conclusions. During extrusion, excluding the blends containing citric acid, as
water content decreased, viscosity decreased, suggesting a lower degree of polymerization
between the starch and PLA. The SEM scans showed that as water content decreased, the
number of starch granules increased. Because the starch granules indicate a lack of
compatibility, the SEM scans support the idea that water is essential for good plasticization of
starch. We were also able to determine via the DSC tests that the plasticizer blends had no
effect on the glass transition temperature of PLA, which is positive when looking at the
mechanical properties of blends in the future.
It was suggested that citric acid would be beneficial to blends of starch and PLA. It
both plasticized PLA and increased compatibility. During extrusion of pure PLA with 3 wt%
citric acid, the viscosity was measured and it was clear that the citric acid increased
plasticization. With starch, glycerol, water and PLA content held constant, citric acid also
lowered the viscosity during extrusion, suggesting increased compatibility. The SEM scans
also showed a drastic reduction it the number of starch granules and an increase to the overall
“smoothness” of the surface morphology.
63
Determining which blend of PLA and starch is difficult to do without the results of the
stress/strain testing. However, it is fairly conclusive that citric acid is an effective plasticizer
for both starch and PLA, and because of that increases compatibility in the blends. When
plasticizing starch with glycerol, there must also be water to remove the granules that inhibit
compatibility in the blends. Future projects should examine the stress/strain data to determine
which blend is most useful, or promising, for production, and continue to test the effects of
differing types and amounts of plasticizers.
64
Bibliography 27-100 Materials in Engineering. (n.d.). Retrieved April 8, 2009, from CMU:
http://neon.mems.cmu.edu/cramb/27-100/lab/S00_lab2/lab2.html
Batista, E. (2004, April 27). The Poop on Eco-Friendly Diapers. Retrieved April 2, 2009,
from WIRED: http://www.wired.com/science/discoveries/news/2004/04/63182
Campbell, N. A. (2006). Biology Concepts & Connections Fifth Edition. Boston: Pearson
Education, Inc.
DARPA. (n.d.). Retrieved April 2, 2009, from DARPA: http://www.darpa.mil/#learn
GPC Theory: Separation. (2008). Retrieved April 10, 2009, from Viscotek:
http://www.viscotek.com/the-gpc-sep.htm
Grants. (n.d.). Retrieved April 2, 2009, from USDA:
http://www.csrees.usda.gov/fo/biobasedproductsandbioenergynri.cfm
Hubbe, M. (n.d.). Polyethylene Oxide (PEO). Retrieved April 2, 2009, from Mini-
Encyclopedia of Papermaking Wet-End Chemistry : http://www4.ncsu.edu/~hubbe/PEO.htm
(1996). International Union of Pure And Applied Chemistry (IUPAC).
Moran, M. J., & Shapiro, H. N. (2004). Fundamentals of Engineering Thermodynamics 5th
Edition. John Wiley & Sons, Inc.
Ning, W., Jiugao, Y., & Giaofei, M. (2008). Preperation and Characterization of Compatible
Thermoplastic Dry Starch/Poly(lactic acid). Online: Wiley InterScience.
Nylon. (2005). Retrieved April 2, 2009, from University of Southern Mississippi.
Plycaprolactone. (n.d.). Retrieved April 2, 2009, from Green Plastics:
http://www.greenplastics.com/reference/index.php?title=Polycaprolactone
Researchers Develop Bioplastic that Can Be Broken Down to Liquid Fuel. (2007, March 24).
Retrieved April 2, 2009, from Green Car Congress:
http://www.greencarcongress.com/2007/03/researchers_dev_1.html
S. Jacobsen, P. D. (1999). Polylactic (PLA) - A New Way of Production. Polymer
Engineering and Science , 1311-1319.
Saxena, S. K. (n.d.). Polyvinyl Alcohol (PVA) Technical and Chemical Assesment. JECFA ,
1-3.
Scwach, E., Six, J.-L., & Averous, L. (2008). Biodegradable Blends Based on Starch and
Poly(Lactic Acid): Comparison of Different Strategies and Estimate of Compatibilization.
Nancy: ENSIC.
Stepto, R. (2007). Understanding the Procession of Thermoplastic Starch. Internet: Wiley
InterScience.
Stevens, E. S. (November 1, 2001). Green Plastics: An Introduction to the New Science of
Biodegradable Plastics. New York: Princeton University Press.
Sun, J.-F. Z. (2004). Mechanical Properties of Poly(lactic acid) Starch Composites.
Biomacromolecules , 1446-1451.
Voet, D., Voet, J. G., & Pratt, C. W. (2006). Fundamentals of Biochemistry Life at the
Molecular Level 2nd Edition. John Wiley & Sons, Inc.
William D. Callister, J. (2007). Materials Science and Engineering An Introduction. York:
John Wiley & Sons, Inc.
Yu, X. M. (2004). The Effect of Plasticizers Containing Amide Groups on the Properties of
Thermoplastic Starch. Starch/Starke , 545-551.

65
Recommended