BI360 for Banks
Enabling World-class Decisions for Banks A Solver Vertical Industry White Paper
Updated: Nov – 2017, Document Version 4
Solver, Inc.
www.solverglobal.com
Copyright © 2017
Copyright Solver, Inc., 2017 BI360 White Paper | Page 2
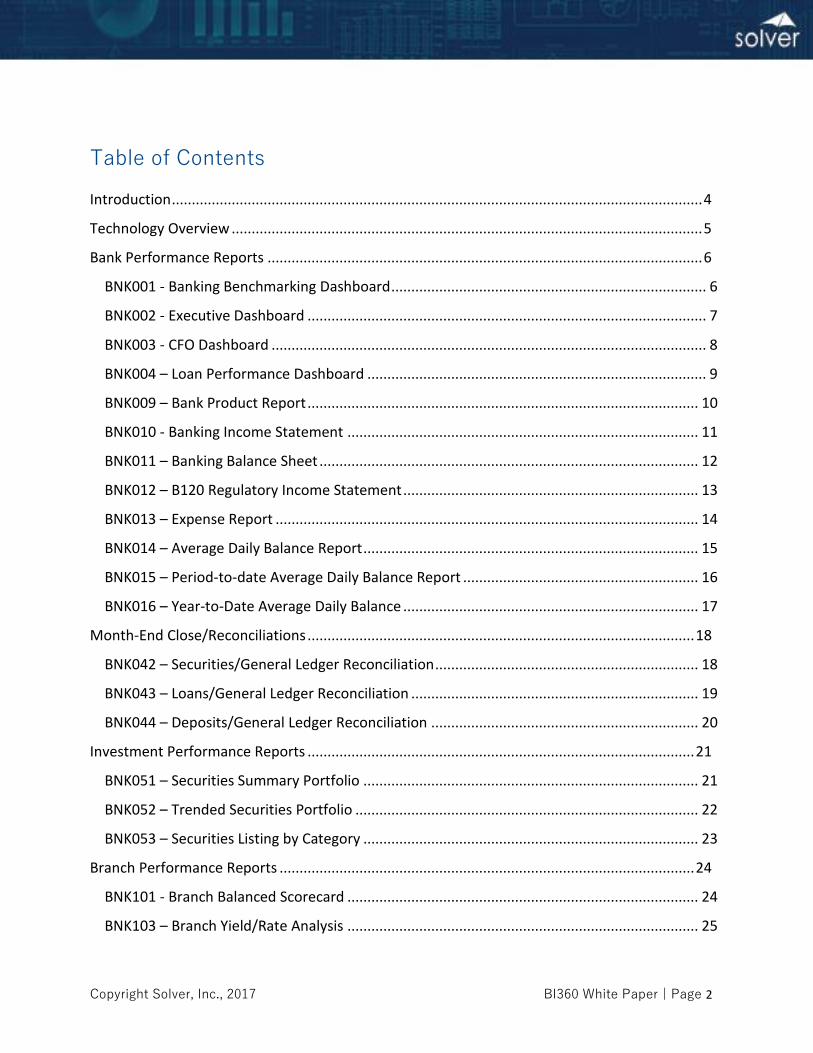
Table of Contents
Introduction ..................................................................................................................................... 4
Technology Overview ...................................................................................................................... 5
Bank Performance Reports ............................................................................................................. 6
BNK001 - Banking Benchmarking Dashboard ............................................................................... 6
BNK002 - Executive Dashboard .................................................................................................... 7
BNK003 - CFO Dashboard ............................................................................................................. 8
BNK004 – Loan Performance Dashboard ..................................................................................... 9
BNK009 – Bank Product Report .................................................................................................. 10
BNK010 - Banking Income Statement ........................................................................................ 11
BNK011 – Banking Balance Sheet ............................................................................................... 12
BNK012 – B120 Regulatory Income Statement .......................................................................... 13
BNK013 – Expense Report .......................................................................................................... 14
BNK014 – Average Daily Balance Report .................................................................................... 15
BNK015 – Period-to-date Average Daily Balance Report ........................................................... 16
BNK016 – Year-to-Date Average Daily Balance .......................................................................... 17
Month-End Close/Reconciliations ................................................................................................. 18
BNK042 – Securities/General Ledger Reconciliation .................................................................. 18
BNK043 – Loans/General Ledger Reconciliation ........................................................................ 19
BNK044 – Deposits/General Ledger Reconciliation ................................................................... 20
Investment Performance Reports ................................................................................................. 21
BNK051 – Securities Summary Portfolio .................................................................................... 21
BNK052 – Trended Securities Portfolio ...................................................................................... 22
BNK053 – Securities Listing by Category .................................................................................... 23
Branch Performance Reports ........................................................................................................ 24
BNK101 - Branch Balanced Scorecard ........................................................................................ 24
BNK103 – Branch Yield/Rate Analysis ........................................................................................ 25
Copyright Solver, Inc., 2017 BI360 White Paper | Page 3
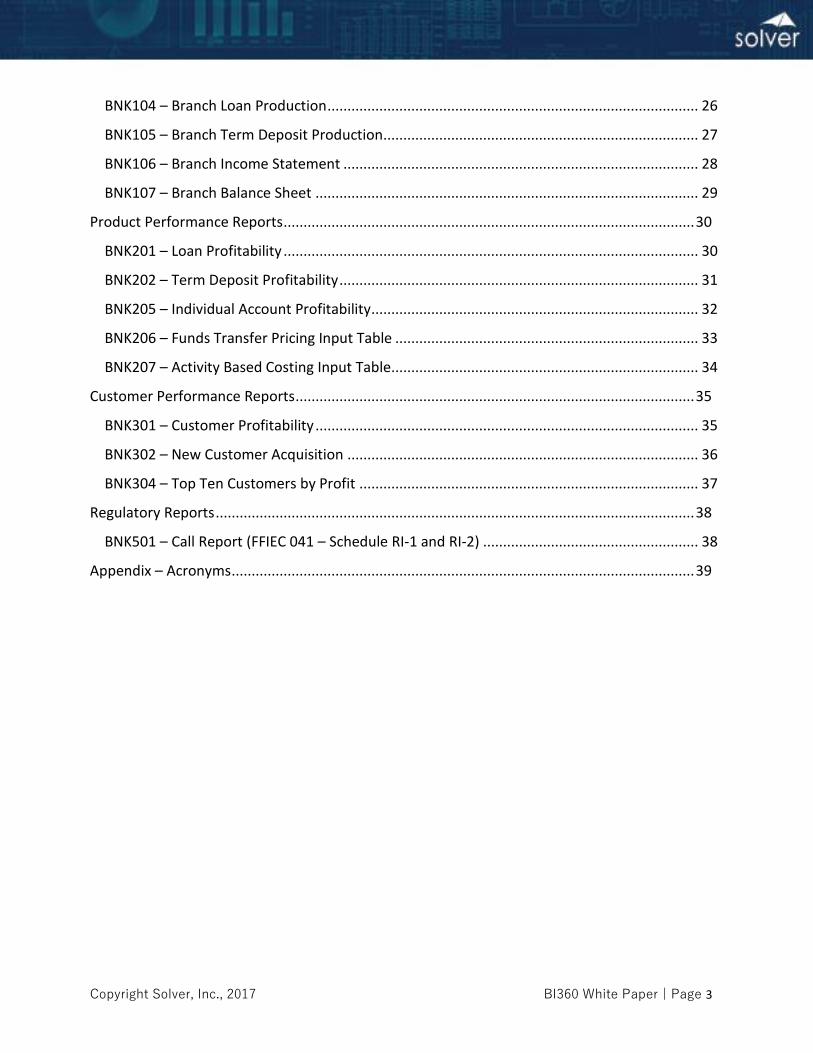
BNK104 – Branch Loan Production ............................................................................................. 26
BNK105 – Branch Term Deposit Production............................................................................... 27
BNK106 – Branch Income Statement ......................................................................................... 28
BNK107 – Branch Balance Sheet ................................................................................................ 29
Product Performance Reports ....................................................................................................... 30
BNK201 – Loan Profitability ........................................................................................................ 30
BNK202 – Term Deposit Profitability .......................................................................................... 31
BNK205 – Individual Account Profitability .................................................................................. 32
BNK206 – Funds Transfer Pricing Input Table ............................................................................ 33
BNK207 – Activity Based Costing Input Table............................................................................. 34
Customer Performance Reports .................................................................................................... 35
BNK301 – Customer Profitability ................................................................................................ 35
BNK302 – New Customer Acquisition ........................................................................................ 36
BNK304 – Top Ten Customers by Profit ..................................................................................... 37
Regulatory Reports ........................................................................................................................ 38
BNK501 – Call Report (FFIEC 041 – Schedule RI-1 and RI-2) ...................................................... 38
Appendix – Acronyms .................................................................................................................... 39
Copyright Solver, Inc., 2017 BI360 White Paper | Page 4
Introduction
BI360 gives banks full business intelligence capabilities, including budgeting and forecasting for branches, products and investments. Modern financial and operational reporting helps control costs, measure profitability and consolidate operations. Current and accurate information is critical in today’s financial services industry. BI360 can provide the detailed information bank executives need to proactively run their business and improve branch performance and product margins.
BI360 can be deployed to finance and accounting teams, as well as to operating departments to enable world-class decisions with:
Dashboards with bank metrics and benchmarking Organization-wide budgeting and forecasting, including for revenues, operating
expenses, capital purchases, and cash flow Microsoft Excel- and web-based reporting and consolidations Data warehousing that can combine financials, payroll data, loan data and more Cloud or on-premise deployment, based on preference.
With BI360, bank managers will be able to:
Improve decision-making and control through self-service business intelligence Automate budgeting, forecasting, financial reporting and consolidations, as well as
regulatory reports Reduce costs and improve administrative business processes Identify trends, track progress and continuously evaluate performance Optimize staffing levels Track customer satisfaction and assess product needs Increase accountability Engage department heads and branch managers in setting goals Develop focused strategies
Solver and our global partner channel will assist with BI360 implementations and long-term
support to aid banks in monitoring performance and in meeting targeted goals and objectives.
Copyright Solver, Inc., 2017 BI360 White Paper | Page 5
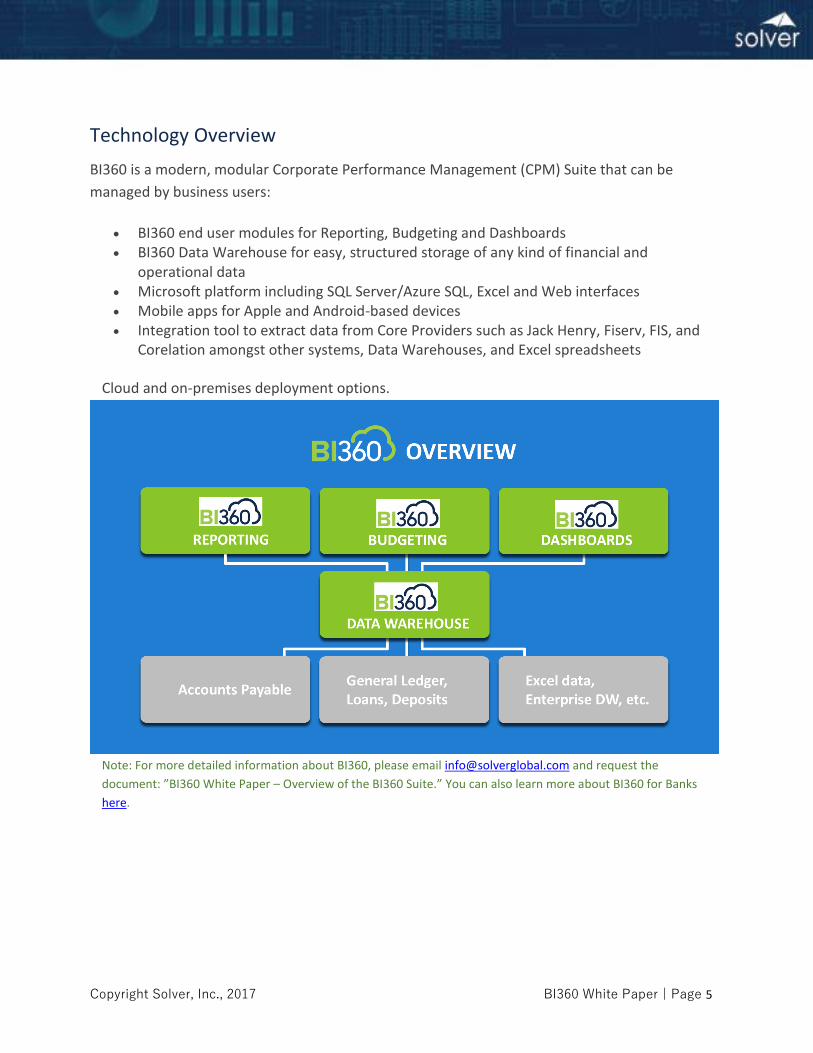
Technology Overview
BI360 is a modern, modular Corporate Performance Management (CPM) Suite that can be
managed by business users:
BI360 end user modules for Reporting, Budgeting and Dashboards BI360 Data Warehouse for easy, structured storage of any kind of financial and
operational data Microsoft platform including SQL Server/Azure SQL, Excel and Web interfaces Mobile apps for Apple and Android-based devices Integration tool to extract data from Core Providers such as Jack Henry, Fiserv, FIS, and
Corelation amongst other systems, Data Warehouses, and Excel spreadsheets
Cloud and on-premises deployment options.
Note: For more detailed information about BI360, please email [email protected] and request the
document: ”BI360 White Paper – Overview of the BI360 Suite.” You can also learn more about BI360 for Banks
here.
Copyright Solver, Inc., 2017 BI360 White Paper | Page 6
Bank Performance Reports
These types of reports are generally reviewed by the C-Suite. The goal of these reports is to
give a bank-wide view of the organization.
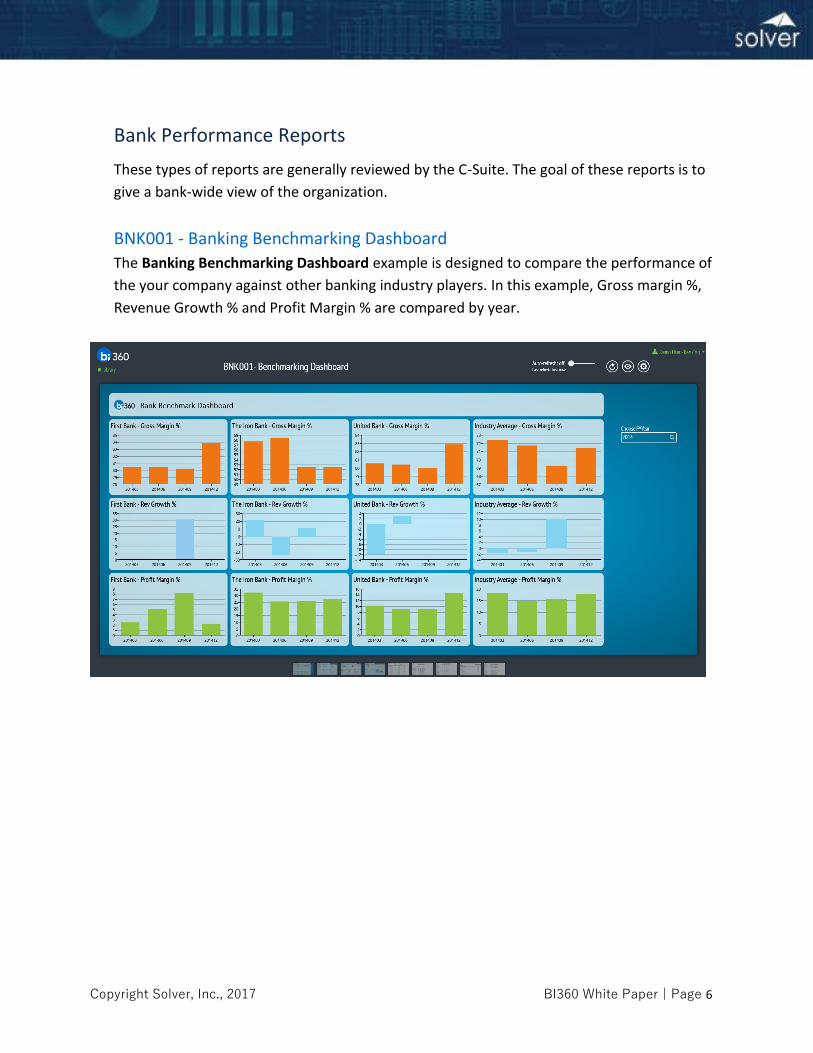
BNK001 - Banking Benchmarking Dashboard
The Banking Benchmarking Dashboard example is designed to compare the performance of
the your company against other banking industry players. In this example, Gross margin %,
Revenue Growth % and Profit Margin % are compared by year.
Copyright Solver, Inc., 2017 BI360 White Paper | Page 7
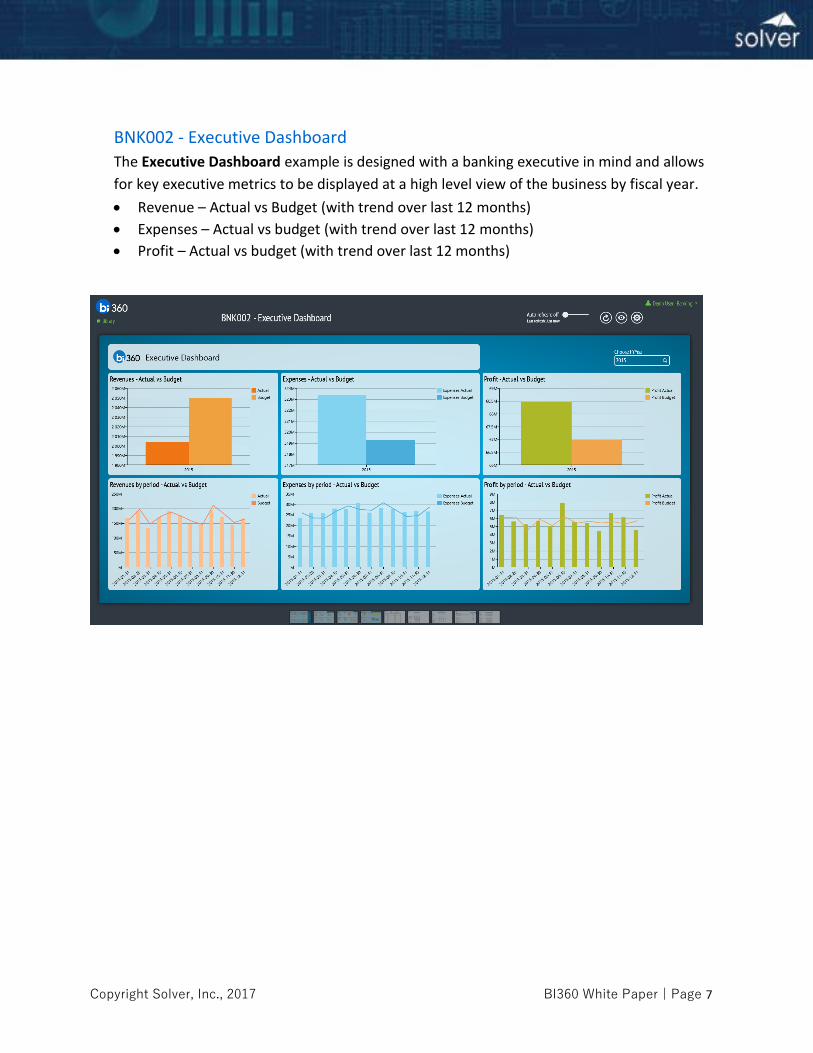
BNK002 - Executive Dashboard
The Executive Dashboard example is designed with a banking executive in mind and allows
for key executive metrics to be displayed at a high level view of the business by fiscal year.
Revenue – Actual vs Budget (with trend over last 12 months)
Expenses – Actual vs budget (with trend over last 12 months)
Profit – Actual vs budget (with trend over last 12 months)
Copyright Solver, Inc., 2017 BI360 White Paper | Page 8
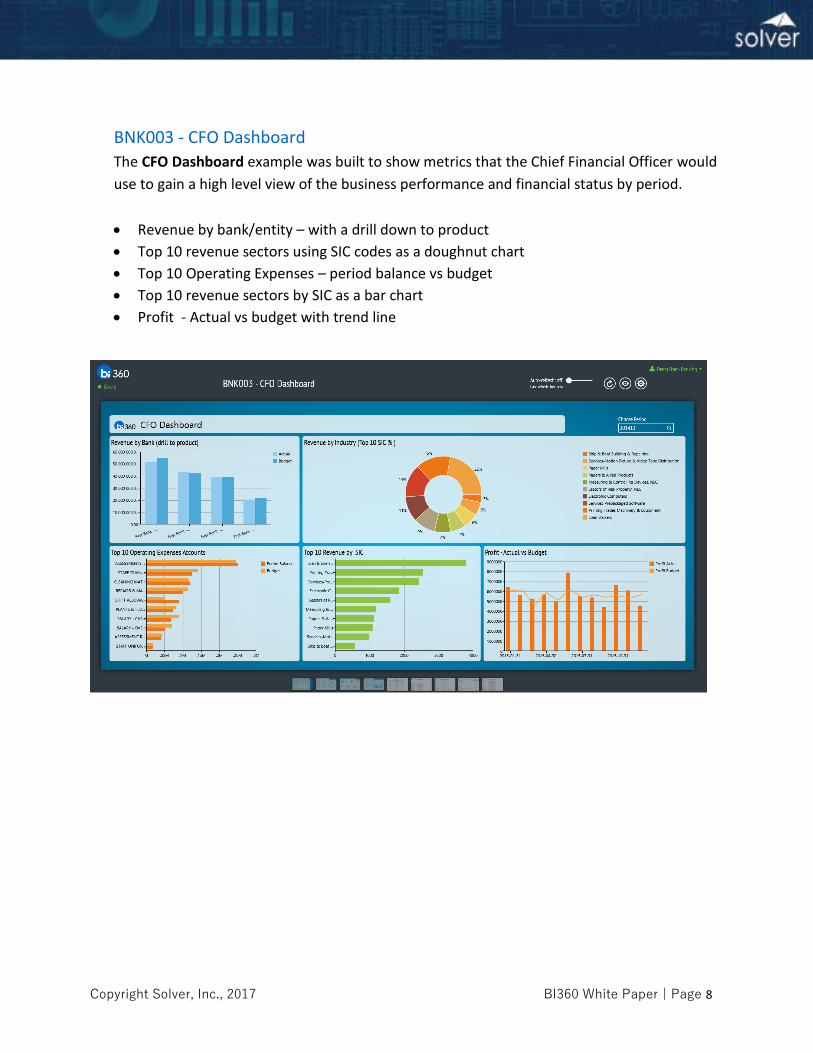
BNK003 - CFO Dashboard
The CFO Dashboard example was built to show metrics that the Chief Financial Officer would
use to gain a high level view of the business performance and financial status by period.
Revenue by bank/entity – with a drill down to product
Top 10 revenue sectors using SIC codes as a doughnut chart
Top 10 Operating Expenses – period balance vs budget
Top 10 revenue sectors by SIC as a bar chart
Profit - Actual vs budget with trend line
Copyright Solver, Inc., 2017 BI360 White Paper | Page 9
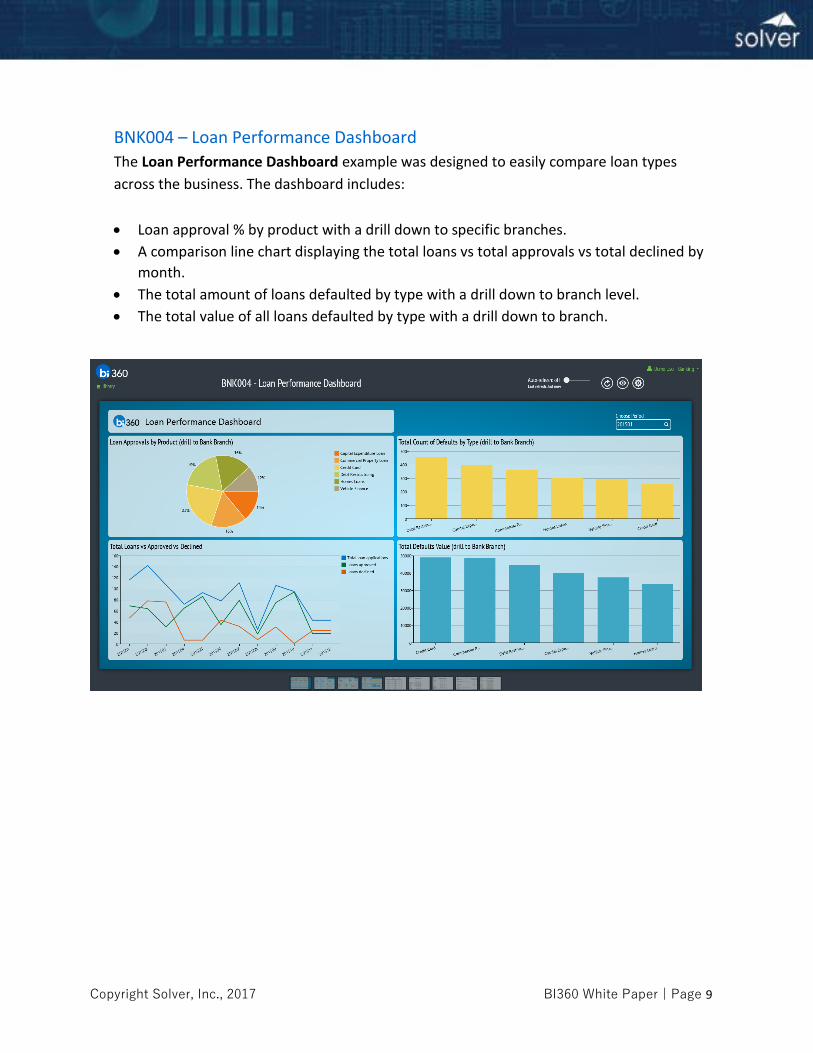
BNK004 – Loan Performance Dashboard
The Loan Performance Dashboard example was designed to easily compare loan types
across the business. The dashboard includes:
Loan approval % by product with a drill down to specific branches.
A comparison line chart displaying the total loans vs total approvals vs total declined by
month.
The total amount of loans defaulted by type with a drill down to branch level.
The total value of all loans defaulted by type with a drill down to branch.
Copyright Solver, Inc., 2017 BI360 White Paper | Page 10
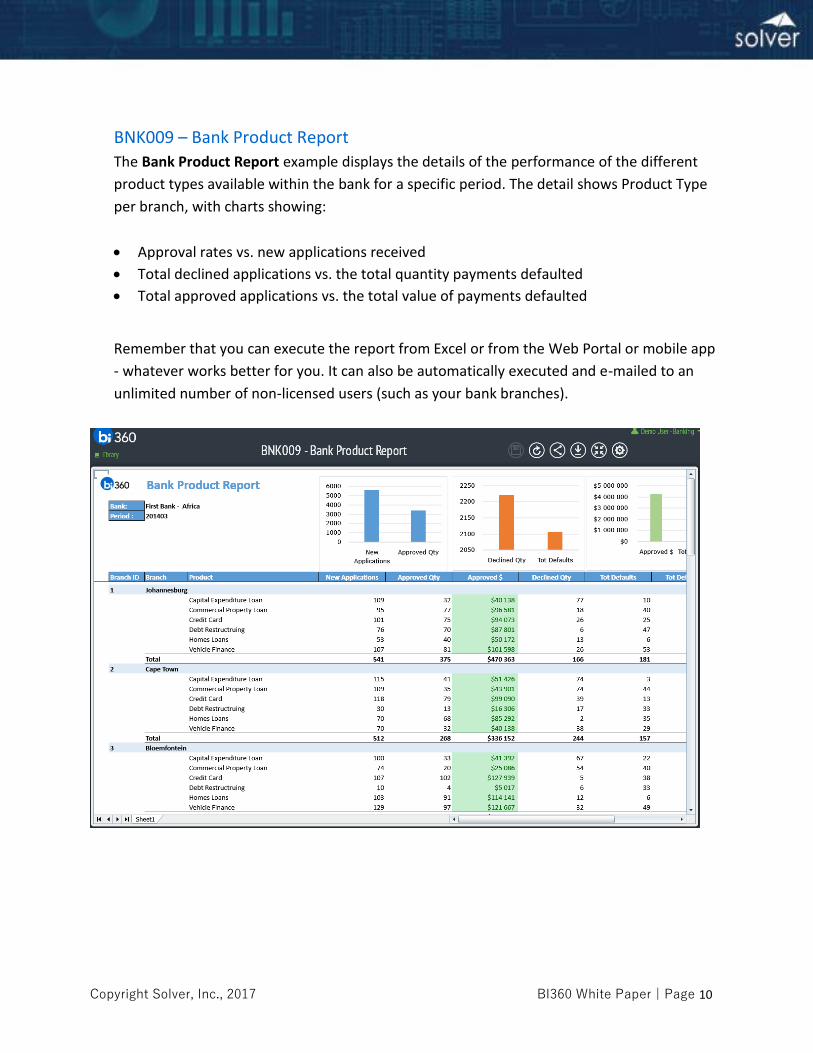
BNK009 – Bank Product Report
The Bank Product Report example displays the details of the performance of the different
product types available within the bank for a specific period. The detail shows Product Type
per branch, with charts showing:
Approval rates vs. new applications received
Total declined applications vs. the total quantity payments defaulted
Total approved applications vs. the total value of payments defaulted
Remember that you can execute the report from Excel or from the Web Portal or mobile app
- whatever works better for you. It can also be automatically executed and e-mailed to an
unlimited number of non-licensed users (such as your bank branches).
Copyright Solver, Inc., 2017 BI360 White Paper | Page 11
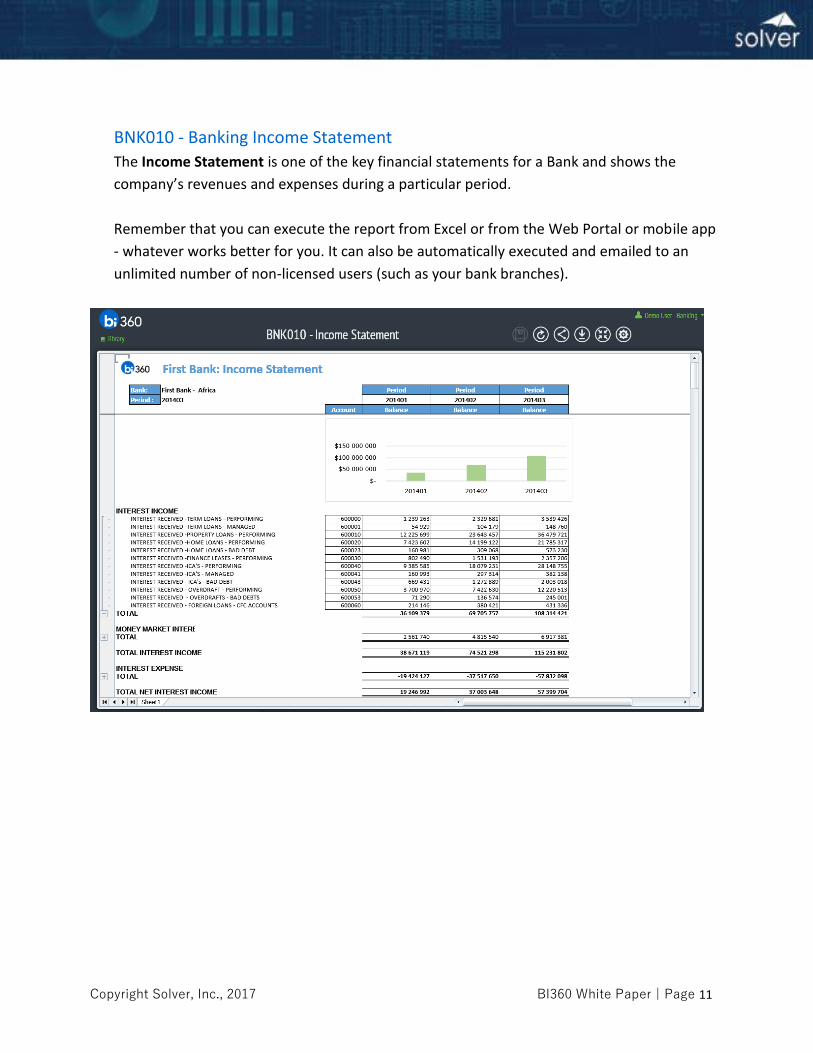
BNK010 - Banking Income Statement
The Income Statement is one of the key financial statements for a Bank and shows the
company’s revenues and expenses during a particular period.
Remember that you can execute the report from Excel or from the Web Portal or mobile app
- whatever works better for you. It can also be automatically executed and emailed to an
unlimited number of non-licensed users (such as your bank branches).
Copyright Solver, Inc., 2017 BI360 White Paper | Page 12
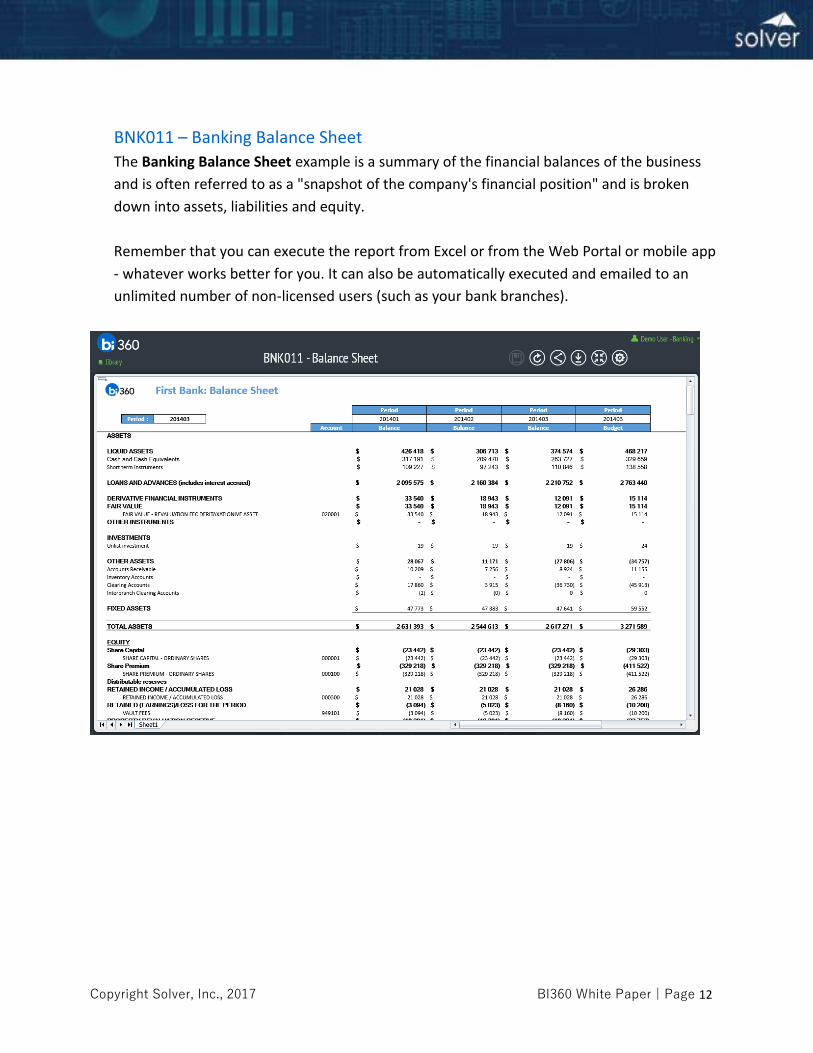
BNK011 – Banking Balance Sheet
The Banking Balance Sheet example is a summary of the financial balances of the business
and is often referred to as a "snapshot of the company's financial position" and is broken
down into assets, liabilities and equity.
Remember that you can execute the report from Excel or from the Web Portal or mobile app
- whatever works better for you. It can also be automatically executed and emailed to an
unlimited number of non-licensed users (such as your bank branches).
Copyright Solver, Inc., 2017 BI360 White Paper | Page 13
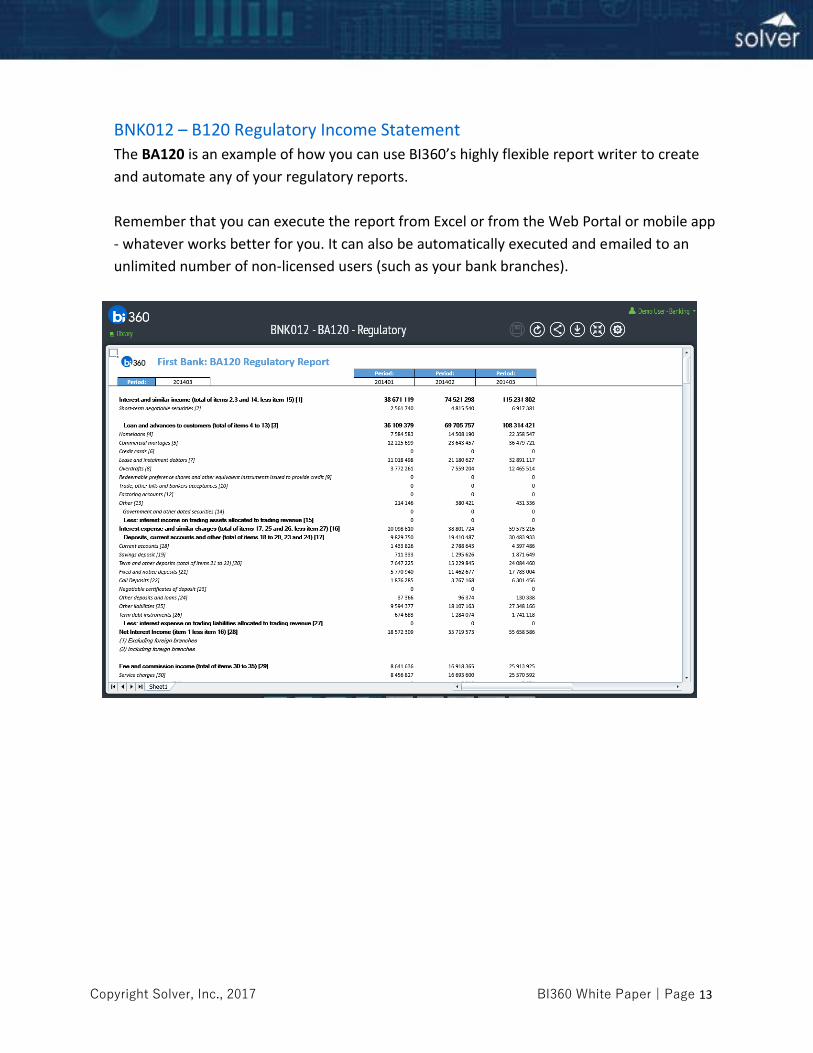
BNK012 – B120 Regulatory Income Statement
The BA120 is an example of how you can use BI360’s highly flexible report writer to create
and automate any of your regulatory reports.
Remember that you can execute the report from Excel or from the Web Portal or mobile app
- whatever works better for you. It can also be automatically executed and emailed to an
unlimited number of non-licensed users (such as your bank branches).
Copyright Solver, Inc., 2017 BI360 White Paper | Page 14
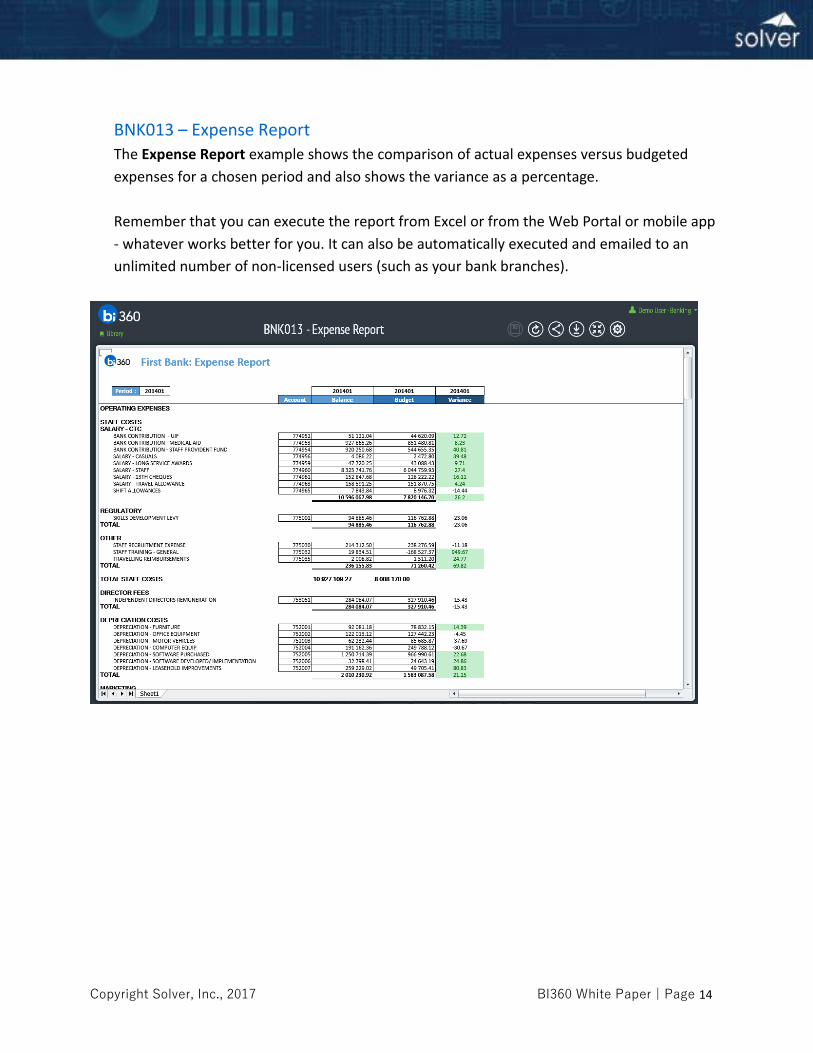
BNK013 – Expense Report
The Expense Report example shows the comparison of actual expenses versus budgeted
expenses for a chosen period and also shows the variance as a percentage.
Remember that you can execute the report from Excel or from the Web Portal or mobile app
- whatever works better for you. It can also be automatically executed and emailed to an
unlimited number of non-licensed users (such as your bank branches).
Copyright Solver, Inc., 2017 BI360 White Paper | Page 15
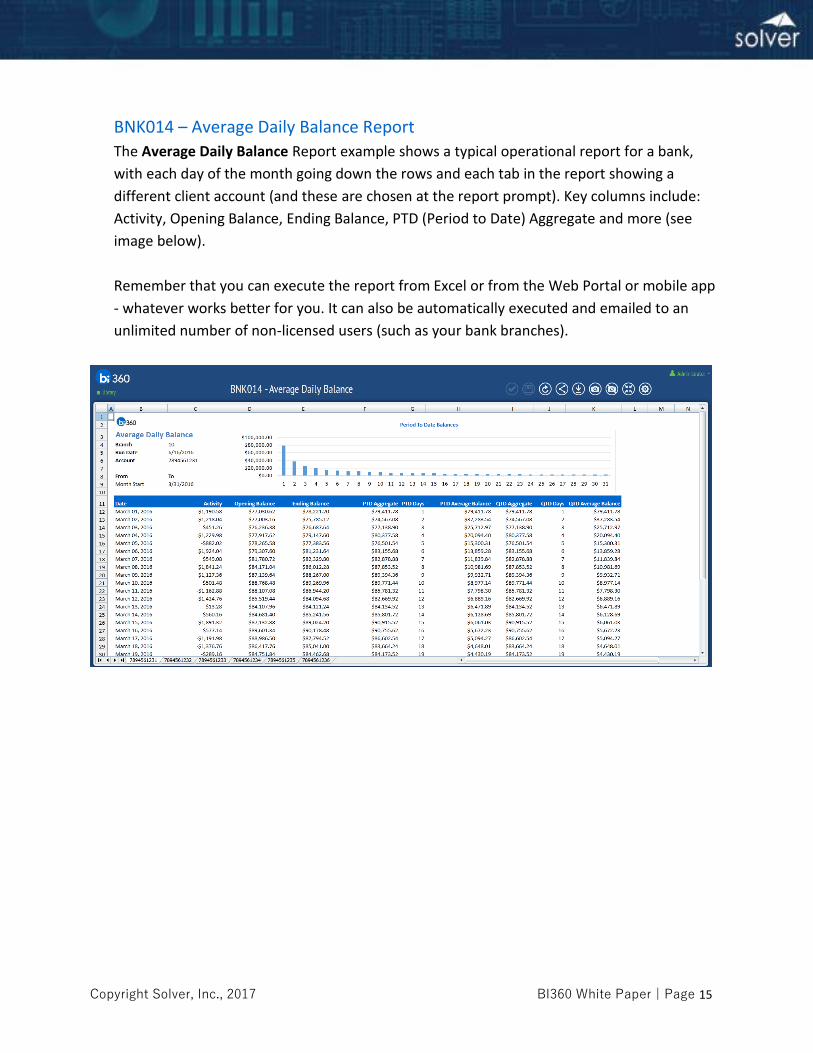
BNK014 – Average Daily Balance Report
The Average Daily Balance Report example shows a typical operational report for a bank,
with each day of the month going down the rows and each tab in the report showing a
different client account (and these are chosen at the report prompt). Key columns include:
Activity, Opening Balance, Ending Balance, PTD (Period to Date) Aggregate and more (see
image below).
Remember that you can execute the report from Excel or from the Web Portal or mobile app
- whatever works better for you. It can also be automatically executed and emailed to an
unlimited number of non-licensed users (such as your bank branches).
Copyright Solver, Inc., 2017 BI360 White Paper | Page 16
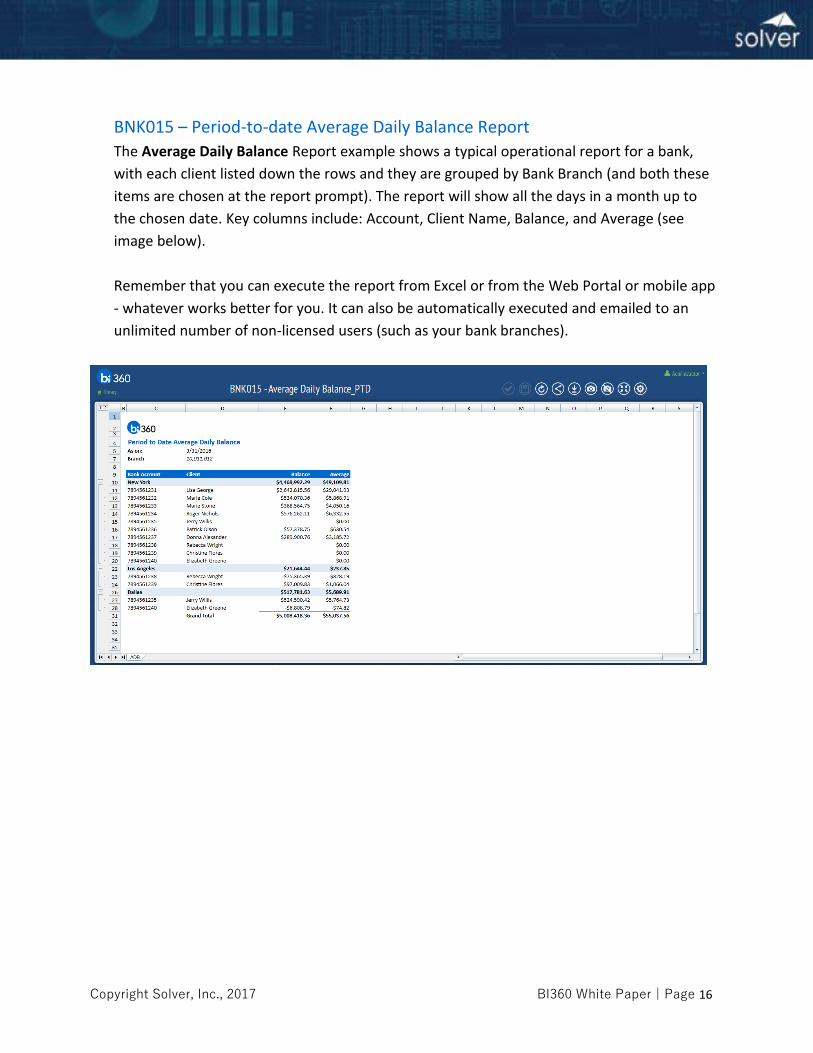
BNK015 – Period-to-date Average Daily Balance Report
The Average Daily Balance Report example shows a typical operational report for a bank,
with each client listed down the rows and they are grouped by Bank Branch (and both these
items are chosen at the report prompt). The report will show all the days in a month up to
the chosen date. Key columns include: Account, Client Name, Balance, and Average (see
image below).
Remember that you can execute the report from Excel or from the Web Portal or mobile app
- whatever works better for you. It can also be automatically executed and emailed to an
unlimited number of non-licensed users (such as your bank branches).
Copyright Solver, Inc., 2017 BI360 White Paper | Page 17
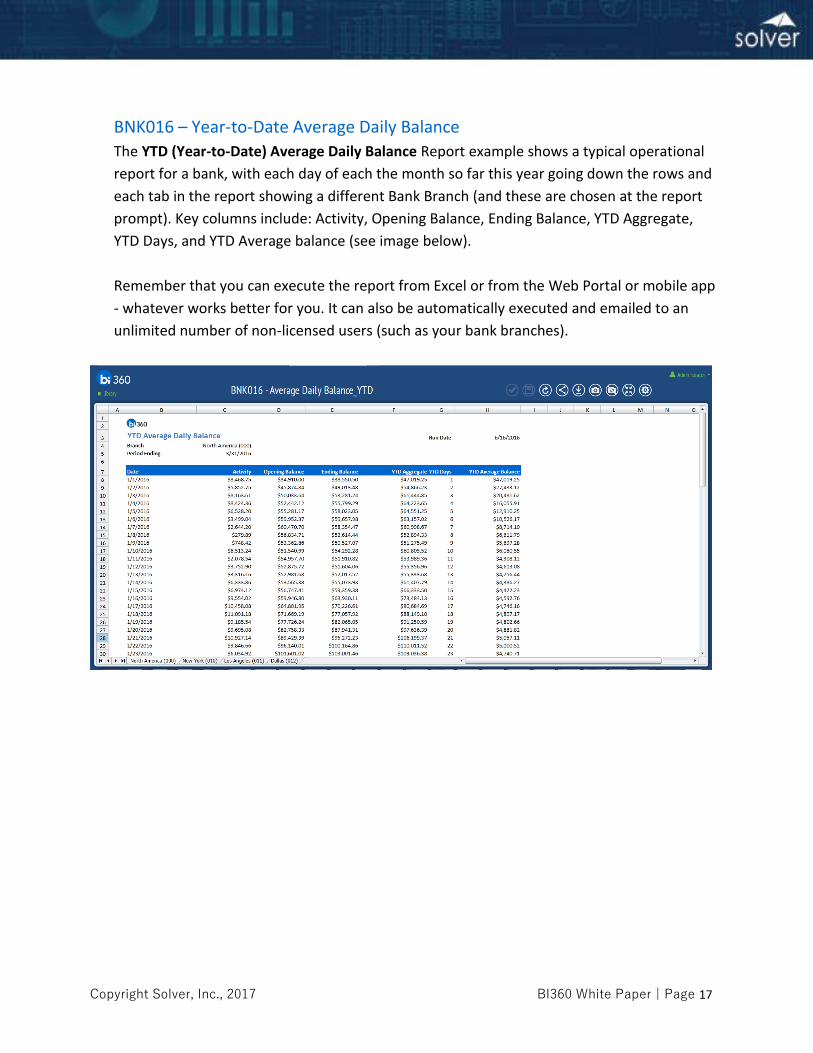
BNK016 – Year-to-Date Average Daily Balance
The YTD (Year-to-Date) Average Daily Balance Report example shows a typical operational
report for a bank, with each day of each the month so far this year going down the rows and
each tab in the report showing a different Bank Branch (and these are chosen at the report
prompt). Key columns include: Activity, Opening Balance, Ending Balance, YTD Aggregate,
YTD Days, and YTD Average balance (see image below).
Remember that you can execute the report from Excel or from the Web Portal or mobile app
- whatever works better for you. It can also be automatically executed and emailed to an
unlimited number of non-licensed users (such as your bank branches).
Copyright Solver, Inc., 2017 BI360 White Paper | Page 18
Month-End Close/Reconciliations
These reports are typically created by Accounting Operations and reviewed by the Controller and CFO. Before any external reports are released to the public, the reconciliation must be performed to ensure integrity.
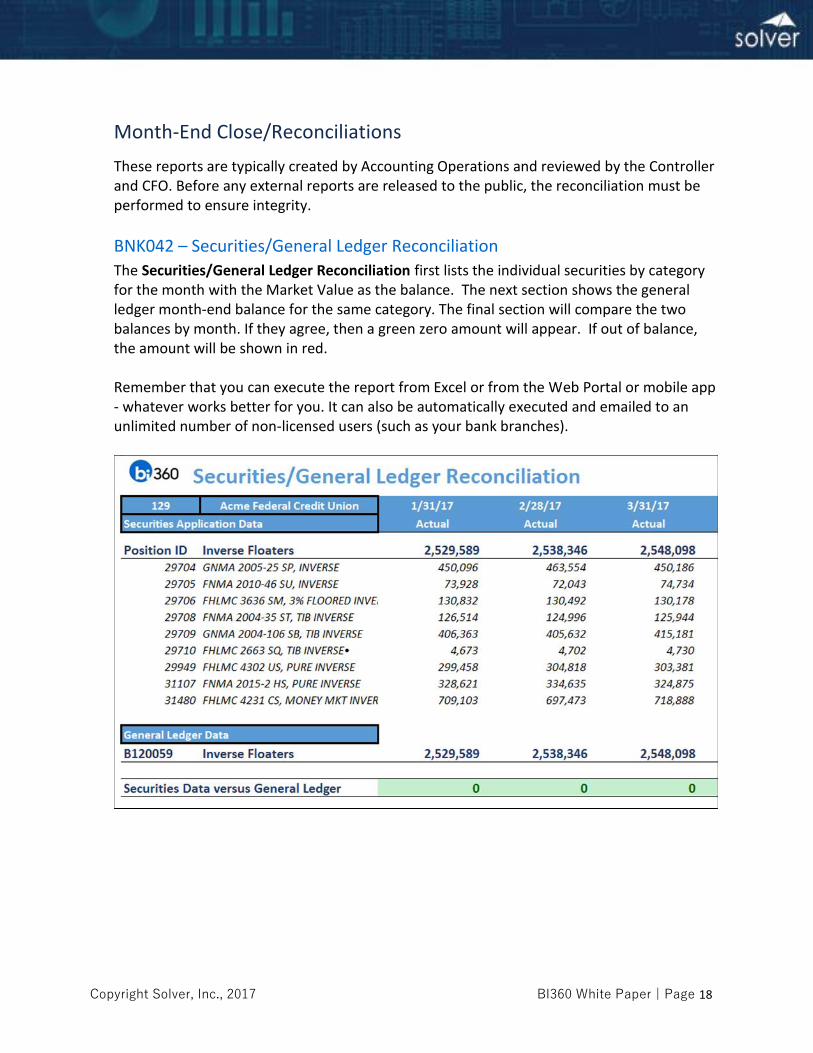
BNK042 – Securities/General Ledger Reconciliation
The Securities/General Ledger Reconciliation first lists the individual securities by category for the month with the Market Value as the balance. The next section shows the general ledger month-end balance for the same category. The final section will compare the two balances by month. If they agree, then a green zero amount will appear. If out of balance, the amount will be shown in red. Remember that you can execute the report from Excel or from the Web Portal or mobile app - whatever works better for you. It can also be automatically executed and emailed to an unlimited number of non-licensed users (such as your bank branches).
Copyright Solver, Inc., 2017 BI360 White Paper | Page 19
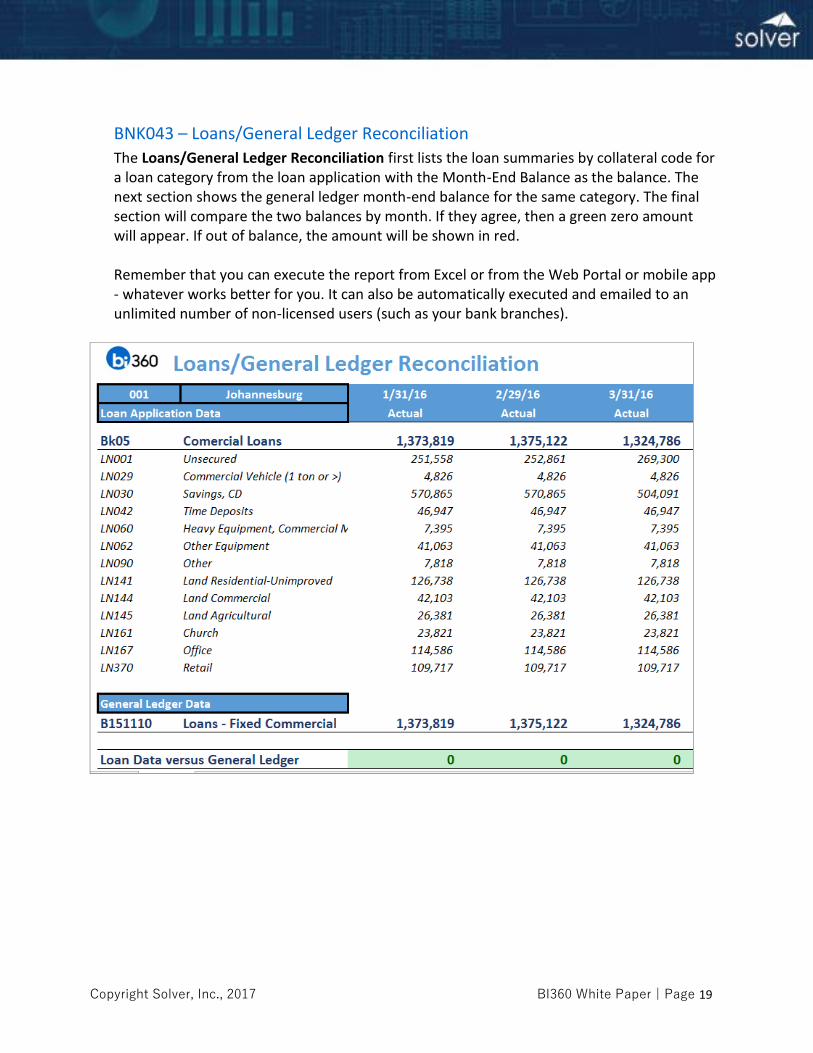
BNK043 – Loans/General Ledger Reconciliation
The Loans/General Ledger Reconciliation first lists the loan summaries by collateral code for a loan category from the loan application with the Month-End Balance as the balance. The next section shows the general ledger month-end balance for the same category. The final section will compare the two balances by month. If they agree, then a green zero amount will appear. If out of balance, the amount will be shown in red.
Remember that you can execute the report from Excel or from the Web Portal or mobile app - whatever works better for you. It can also be automatically executed and emailed to an unlimited number of non-licensed users (such as your bank branches).
Copyright Solver, Inc., 2017 BI360 White Paper | Page 20
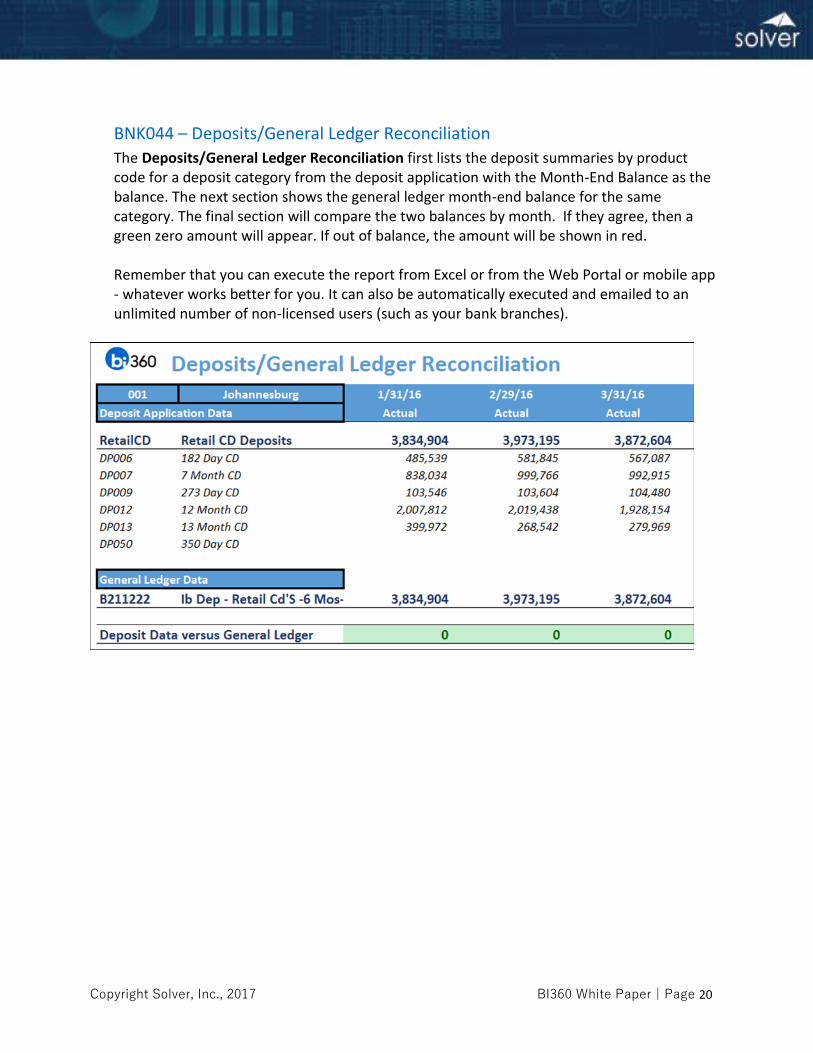
BNK044 – Deposits/General Ledger Reconciliation
The Deposits/General Ledger Reconciliation first lists the deposit summaries by product code for a deposit category from the deposit application with the Month-End Balance as the balance. The next section shows the general ledger month-end balance for the same category. The final section will compare the two balances by month. If they agree, then a green zero amount will appear. If out of balance, the amount will be shown in red.
Remember that you can execute the report from Excel or from the Web Portal or mobile app - whatever works better for you. It can also be automatically executed and emailed to an unlimited number of non-licensed users (such as your bank branches).
Copyright Solver, Inc., 2017 BI360 White Paper | Page 21
Investment Performance Reports
These reports are typically reviewed by the Asset/Liability Manager. They are also reviewed by the Asset/Liability Committee of the organization which will include the CFO.
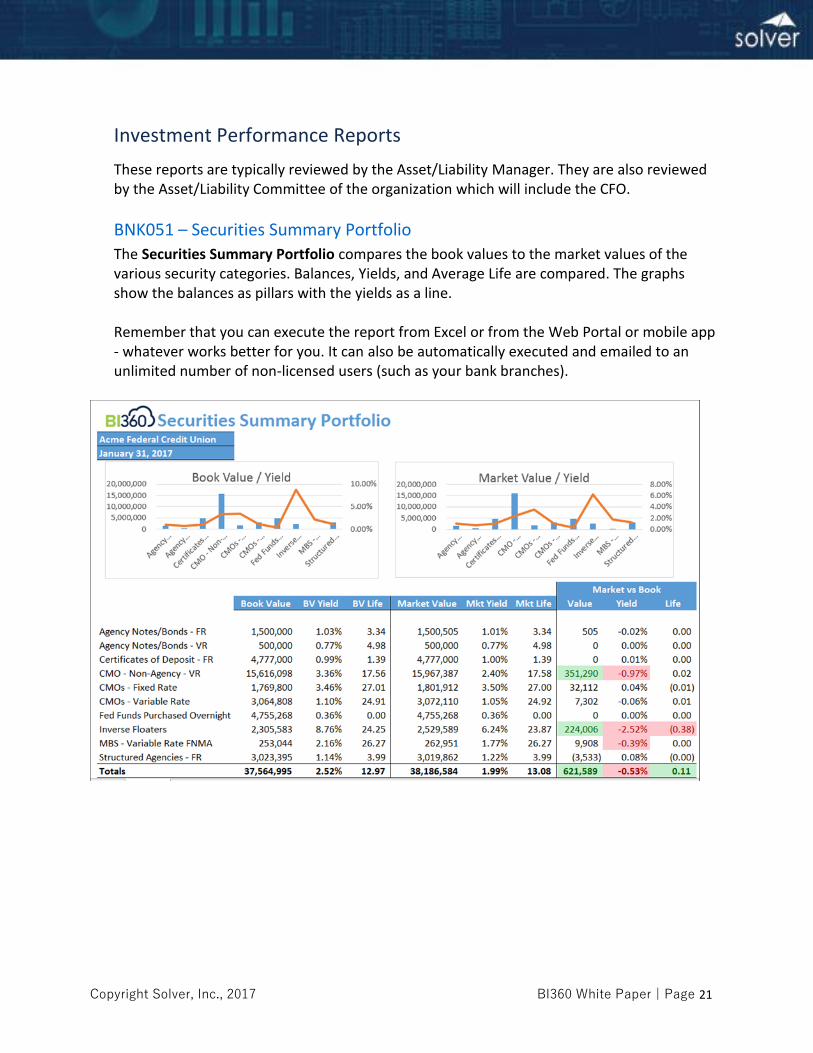
BNK051 – Securities Summary Portfolio
The Securities Summary Portfolio compares the book values to the market values of the various security categories. Balances, Yields, and Average Life are compared. The graphs show the balances as pillars with the yields as a line.
Remember that you can execute the report from Excel or from the Web Portal or mobile app - whatever works better for you. It can also be automatically executed and emailed to an unlimited number of non-licensed users (such as your bank branches).
Copyright Solver, Inc., 2017 BI360 White Paper | Page 22
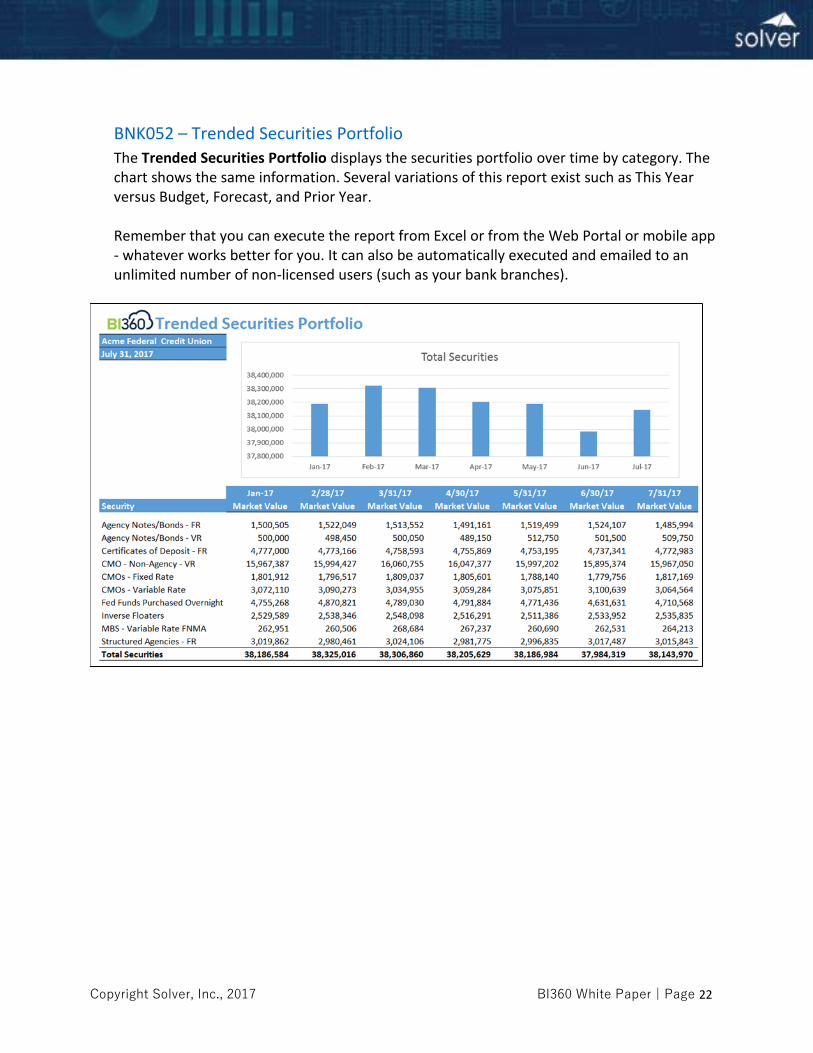
BNK052 – Trended Securities Portfolio
The Trended Securities Portfolio displays the securities portfolio over time by category. The chart shows the same information. Several variations of this report exist such as This Year versus Budget, Forecast, and Prior Year.
Remember that you can execute the report from Excel or from the Web Portal or mobile app - whatever works better for you. It can also be automatically executed and emailed to an unlimited number of non-licensed users (such as your bank branches).
Copyright Solver, Inc., 2017 BI360 White Paper | Page 23
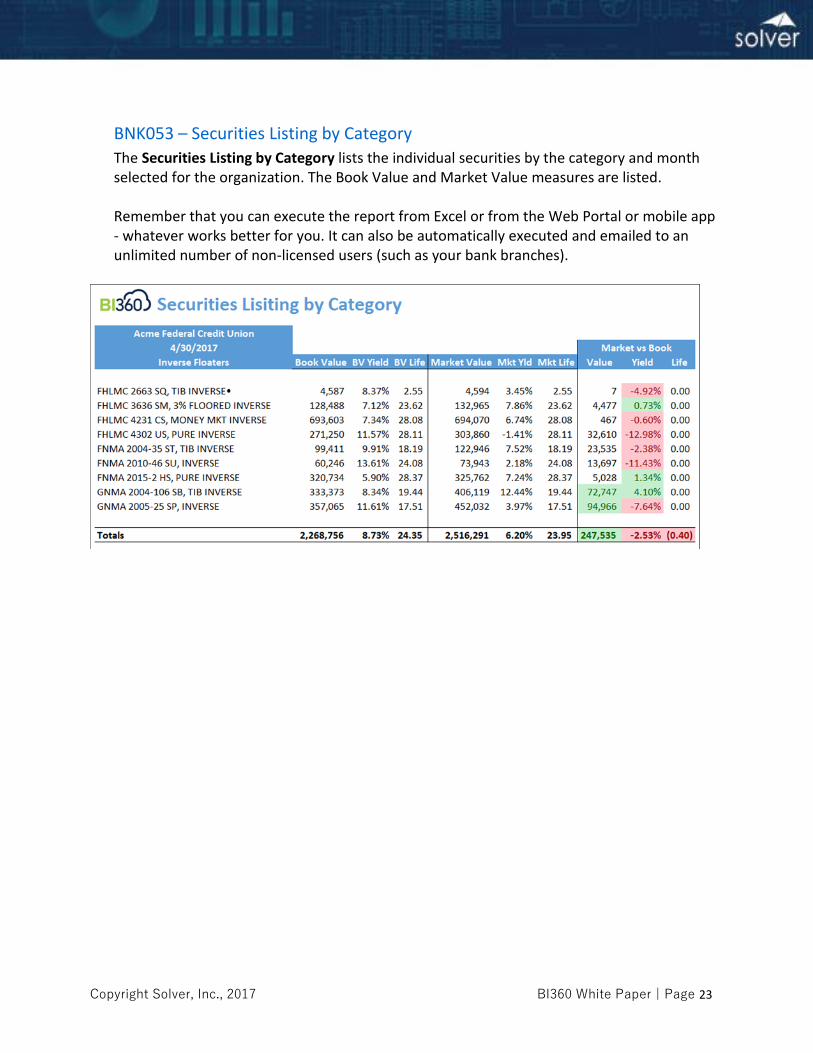
BNK053 – Securities Listing by Category
The Securities Listing by Category lists the individual securities by the category and month selected for the organization. The Book Value and Market Value measures are listed.
Remember that you can execute the report from Excel or from the Web Portal or mobile app - whatever works better for you. It can also be automatically executed and emailed to an unlimited number of non-licensed users (such as your bank branches).
Copyright Solver, Inc., 2017 BI360 White Paper | Page 24
Branch Performance Reports
These reports are typically reviewed by Regional and City Executives along with Branch Managers.
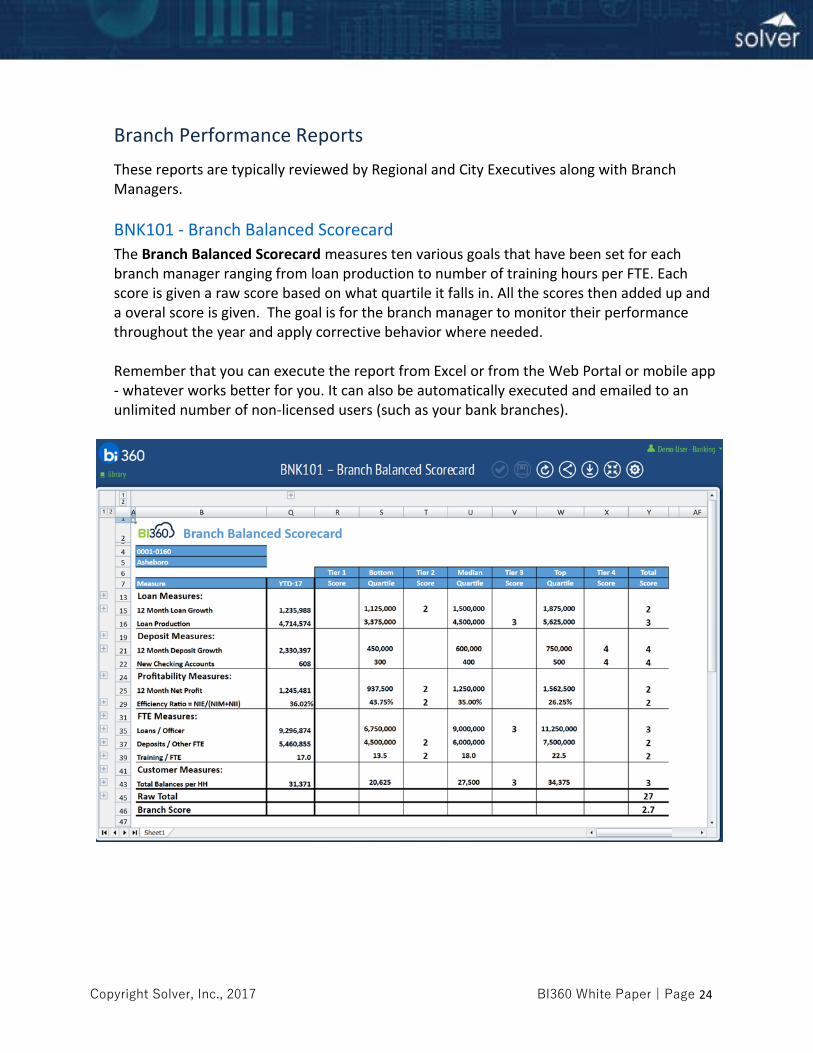
BNK101 - Branch Balanced Scorecard
The Branch Balanced Scorecard measures ten various goals that have been set for each branch manager ranging from loan production to number of training hours per FTE. Each score is given a raw score based on what quartile it falls in. All the scores then added up and a overal score is given. The goal is for the branch manager to monitor their performance throughout the year and apply corrective behavior where needed.
Remember that you can execute the report from Excel or from the Web Portal or mobile app - whatever works better for you. It can also be automatically executed and emailed to an unlimited number of non-licensed users (such as your bank branches).
Copyright Solver, Inc., 2017 BI360 White Paper | Page 25
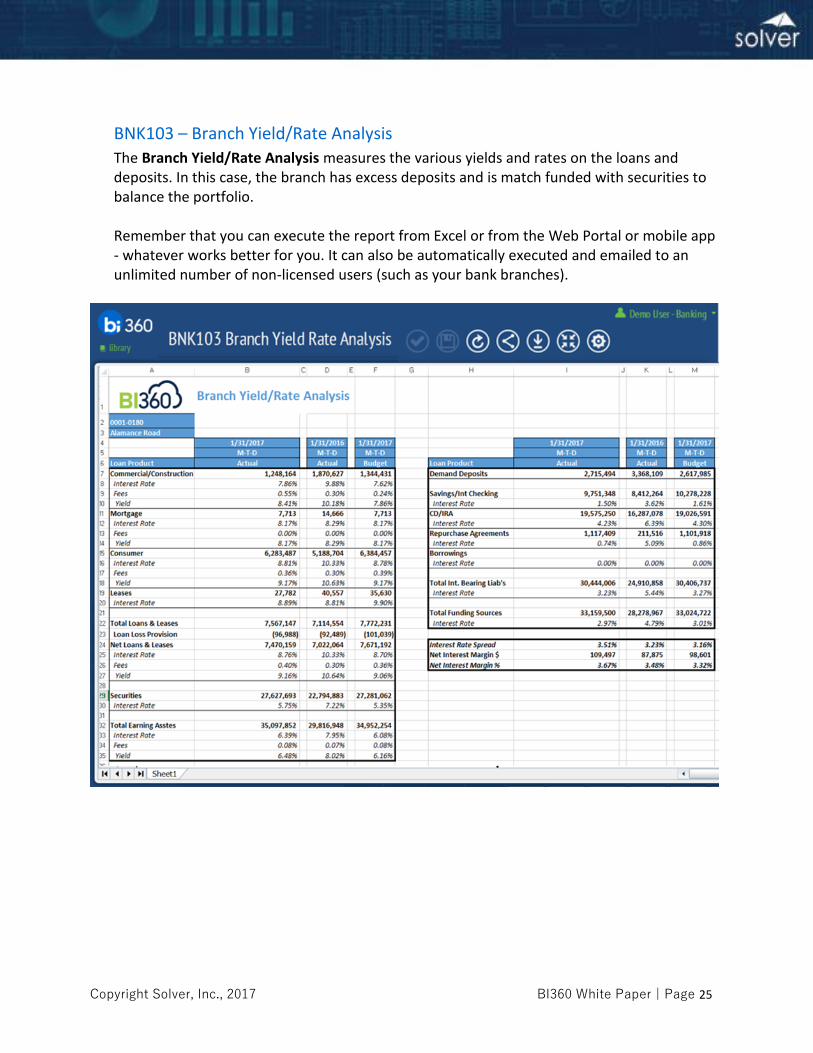
BNK103 – Branch Yield/Rate Analysis
The Branch Yield/Rate Analysis measures the various yields and rates on the loans and deposits. In this case, the branch has excess deposits and is match funded with securities to balance the portfolio.
Remember that you can execute the report from Excel or from the Web Portal or mobile app - whatever works better for you. It can also be automatically executed and emailed to an unlimited number of non-licensed users (such as your bank branches).
Copyright Solver, Inc., 2017 BI360 White Paper | Page 26
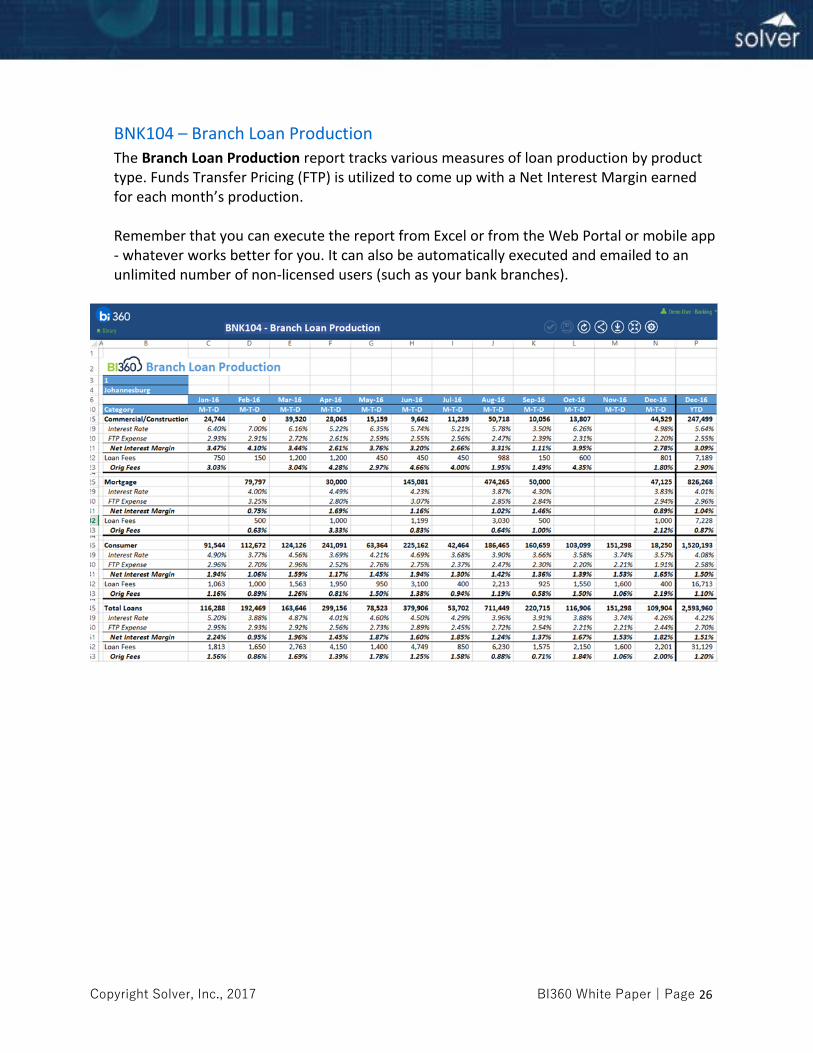
BNK104 – Branch Loan Production
The Branch Loan Production report tracks various measures of loan production by product type. Funds Transfer Pricing (FTP) is utilized to come up with a Net Interest Margin earned for each month’s production.
Remember that you can execute the report from Excel or from the Web Portal or mobile app - whatever works better for you. It can also be automatically executed and emailed to an unlimited number of non-licensed users (such as your bank branches).
Copyright Solver, Inc., 2017 BI360 White Paper | Page 27
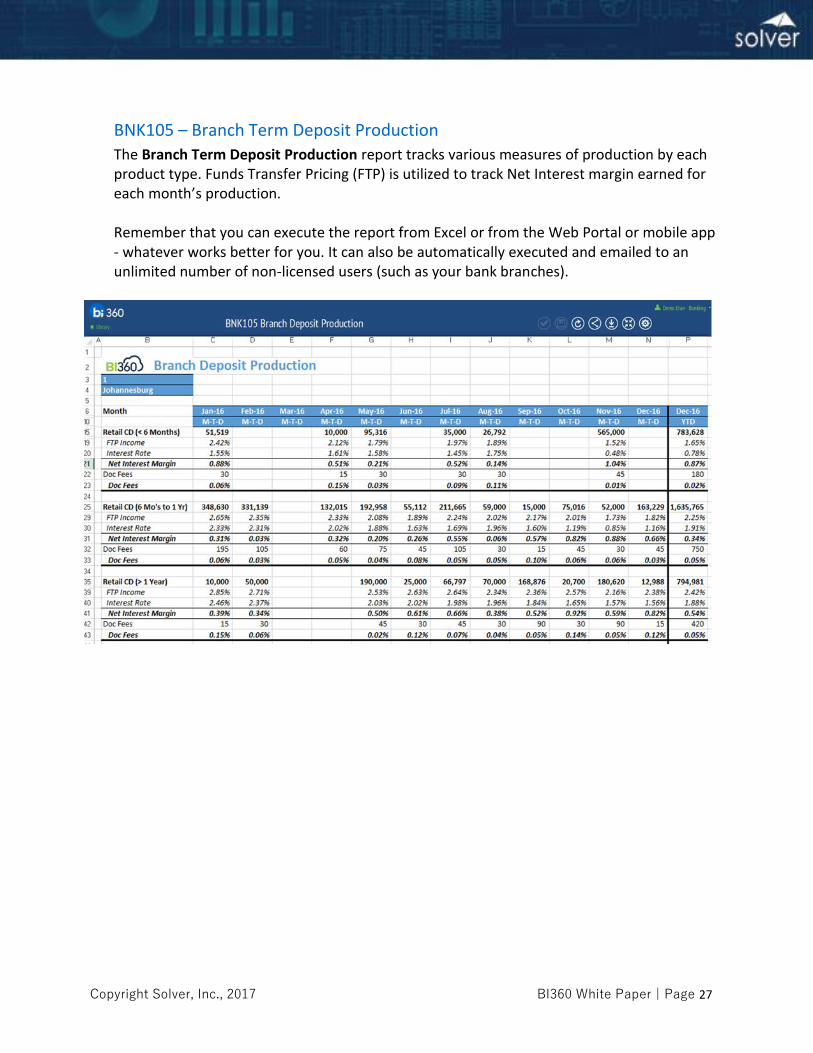
BNK105 – Branch Term Deposit Production
The Branch Term Deposit Production report tracks various measures of production by each product type. Funds Transfer Pricing (FTP) is utilized to track Net Interest margin earned for each month’s production.
Remember that you can execute the report from Excel or from the Web Portal or mobile app - whatever works better for you. It can also be automatically executed and emailed to an unlimited number of non-licensed users (such as your bank branches).
Copyright Solver, Inc., 2017 BI360 White Paper | Page 28
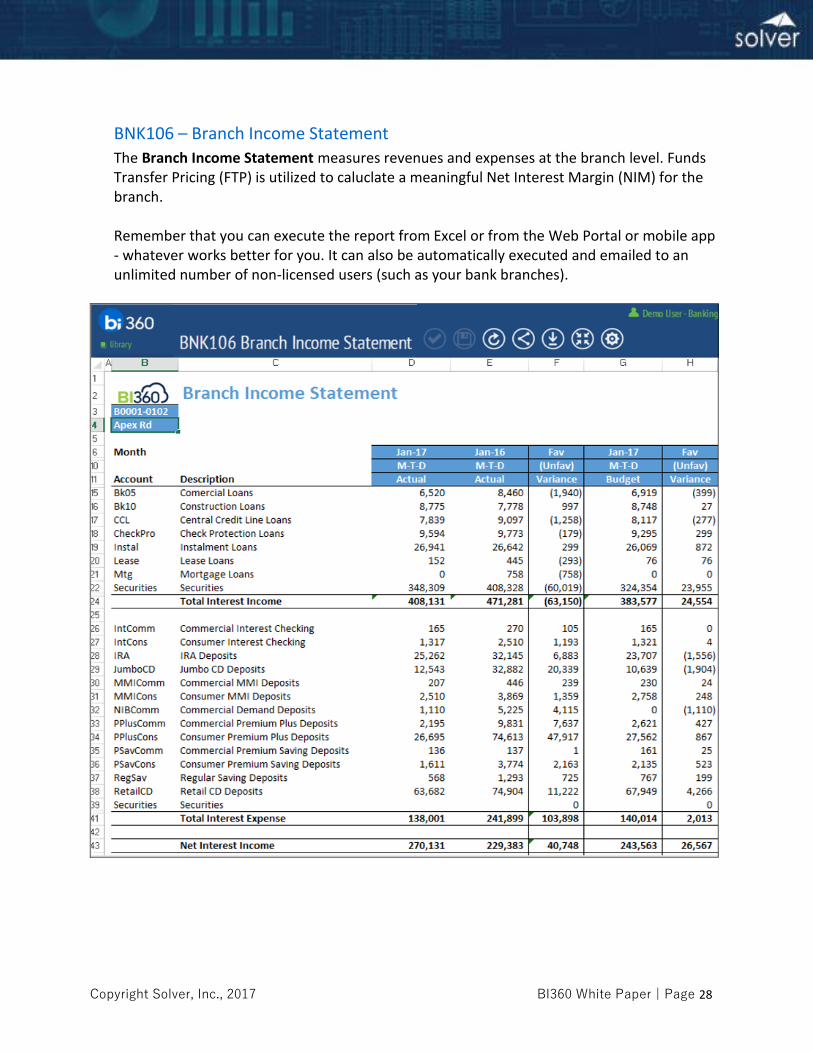
BNK106 – Branch Income Statement
The Branch Income Statement measures revenues and expenses at the branch level. Funds Transfer Pricing (FTP) is utilized to caluclate a meaningful Net Interest Margin (NIM) for the branch.
Remember that you can execute the report from Excel or from the Web Portal or mobile app - whatever works better for you. It can also be automatically executed and emailed to an unlimited number of non-licensed users (such as your bank branches).
Copyright Solver, Inc., 2017 BI360 White Paper | Page 29
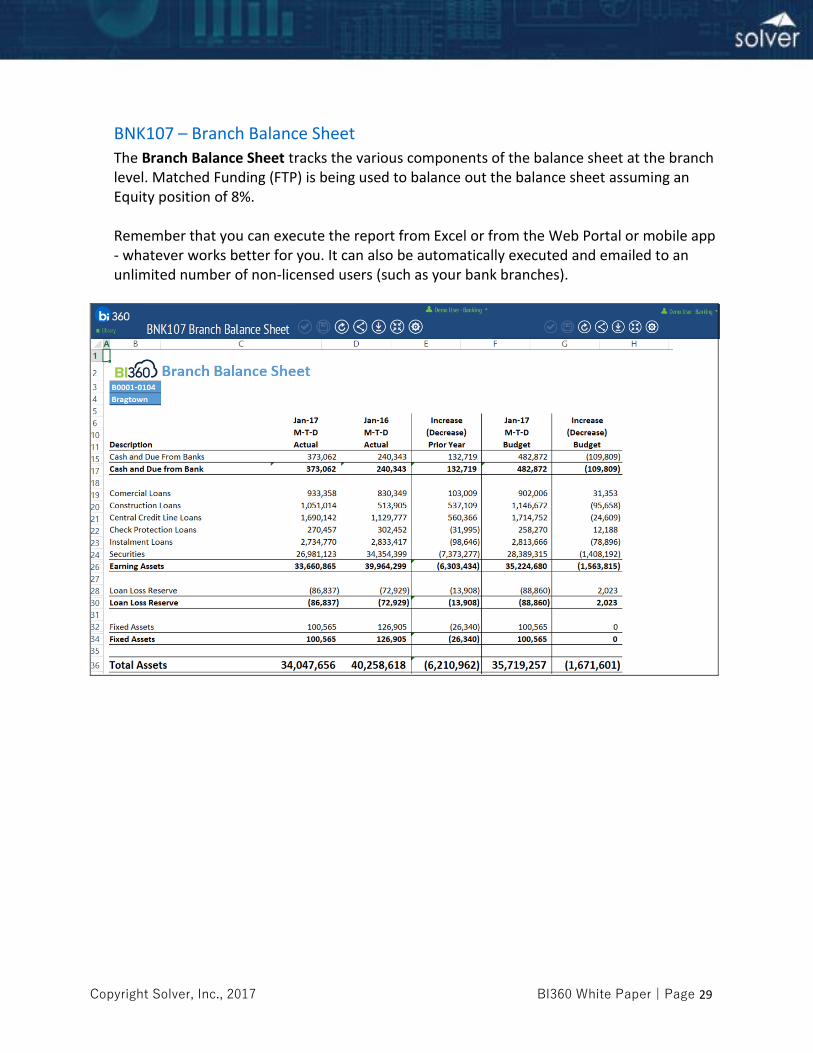
BNK107 – Branch Balance Sheet
The Branch Balance Sheet tracks the various components of the balance sheet at the branch level. Matched Funding (FTP) is being used to balance out the balance sheet assuming an Equity position of 8%. Remember that you can execute the report from Excel or from the Web Portal or mobile app - whatever works better for you. It can also be automatically executed and emailed to an unlimited number of non-licensed users (such as your bank branches).
Copyright Solver, Inc., 2017 BI360 White Paper | Page 30
Product Performance Reports
These reports are typically reviewed by Product Managers and members of the Asset/Liability Committee.
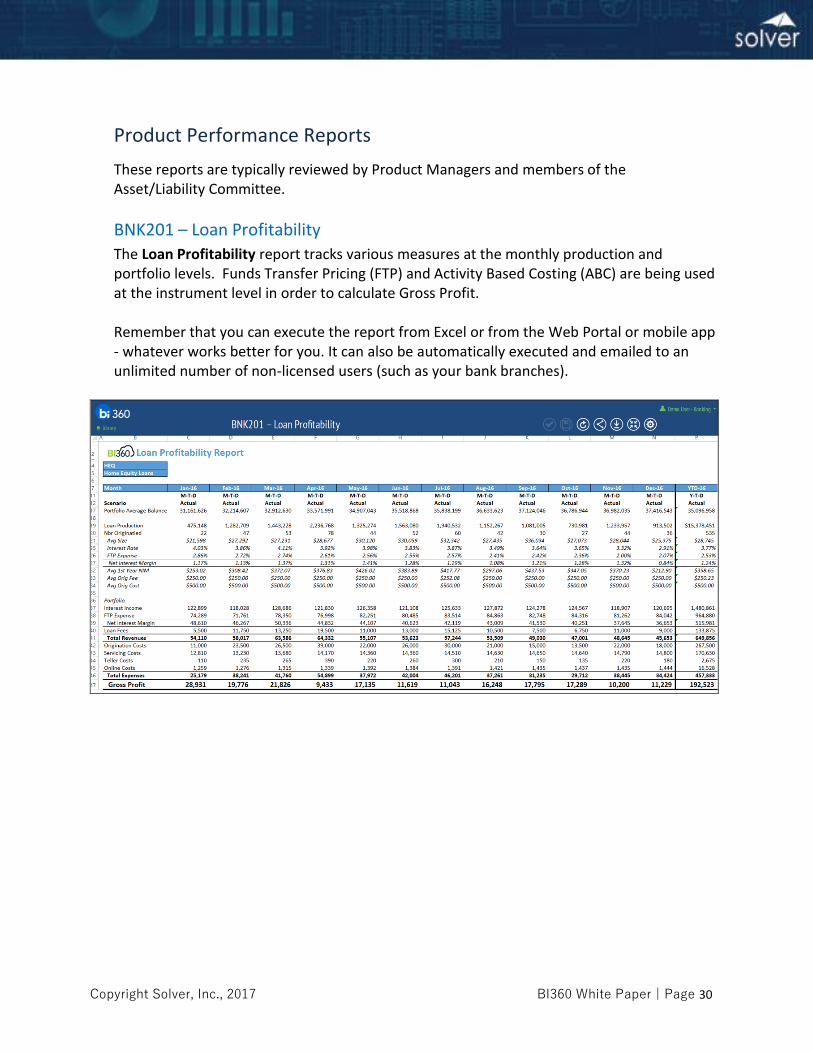
BNK201 – Loan Profitability
The Loan Profitability report tracks various measures at the monthly production and portfolio levels. Funds Transfer Pricing (FTP) and Activity Based Costing (ABC) are being used at the instrument level in order to calculate Gross Profit. Remember that you can execute the report from Excel or from the Web Portal or mobile app - whatever works better for you. It can also be automatically executed and emailed to an unlimited number of non-licensed users (such as your bank branches).
Copyright Solver, Inc., 2017 BI360 White Paper | Page 31
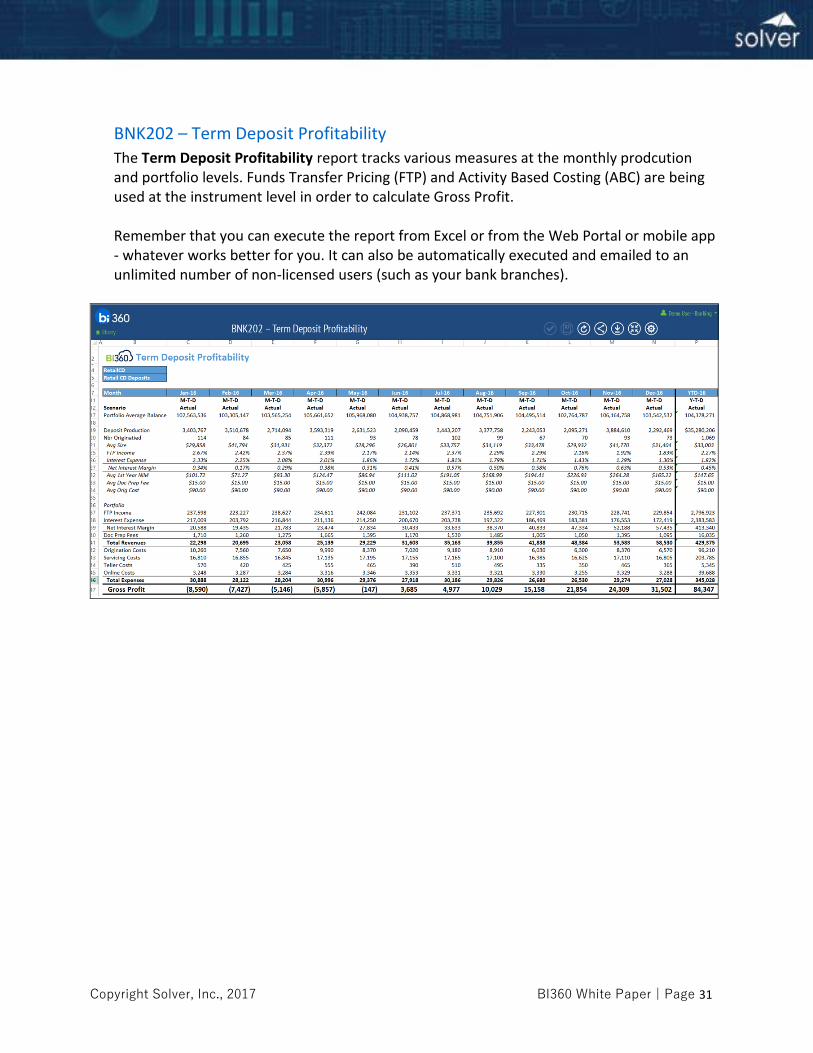
BNK202 – Term Deposit Profitability
The Term Deposit Profitability report tracks various measures at the monthly prodcution and portfolio levels. Funds Transfer Pricing (FTP) and Activity Based Costing (ABC) are being used at the instrument level in order to calculate Gross Profit.
Remember that you can execute the report from Excel or from the Web Portal or mobile app - whatever works better for you. It can also be automatically executed and emailed to an unlimited number of non-licensed users (such as your bank branches).
Copyright Solver, Inc., 2017 BI360 White Paper | Page 32
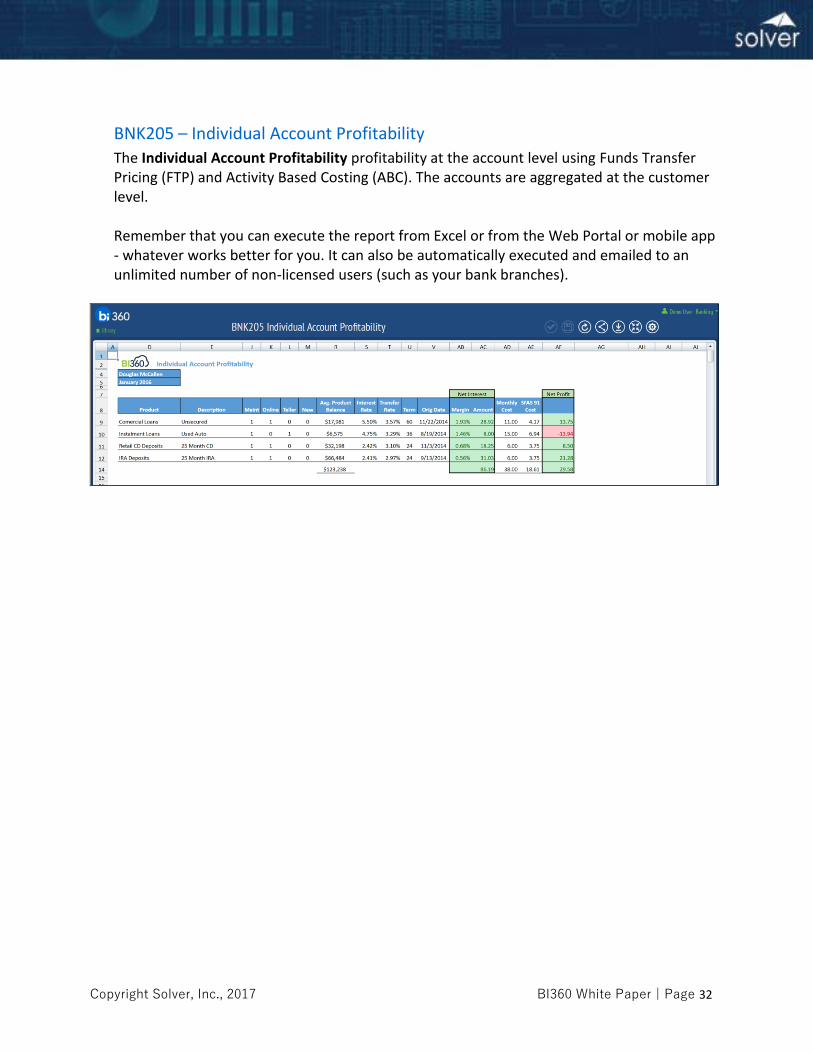
BNK205 – Individual Account Profitability
The Individual Account Profitability profitability at the account level using Funds Transfer Pricing (FTP) and Activity Based Costing (ABC). The accounts are aggregated at the customer level.
Remember that you can execute the report from Excel or from the Web Portal or mobile app - whatever works better for you. It can also be automatically executed and emailed to an unlimited number of non-licensed users (such as your bank branches).
Copyright Solver, Inc., 2017 BI360 White Paper | Page 33
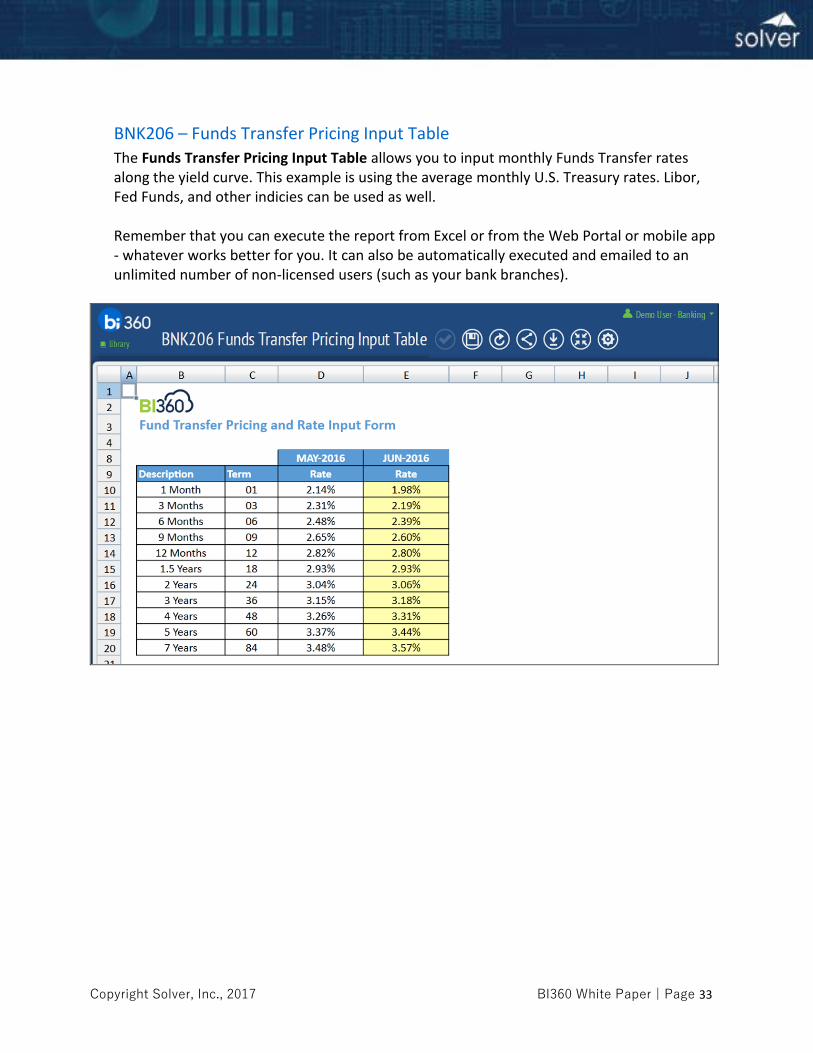
BNK206 – Funds Transfer Pricing Input Table
The Funds Transfer Pricing Input Table allows you to input monthly Funds Transfer rates along the yield curve. This example is using the average monthly U.S. Treasury rates. Libor, Fed Funds, and other indicies can be used as well.
Remember that you can execute the report from Excel or from the Web Portal or mobile app - whatever works better for you. It can also be automatically executed and emailed to an unlimited number of non-licensed users (such as your bank branches).
Copyright Solver, Inc., 2017 BI360 White Paper | Page 34
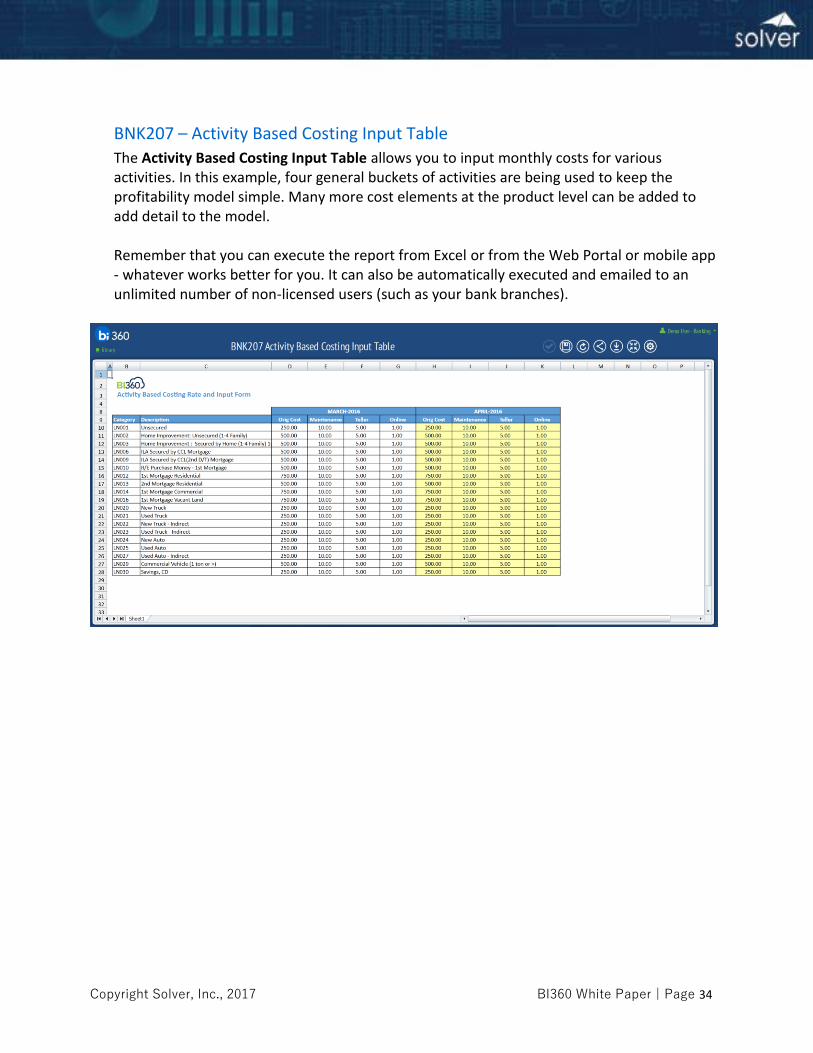
BNK207 – Activity Based Costing Input Table
The Activity Based Costing Input Table allows you to input monthly costs for various activities. In this example, four general buckets of activities are being used to keep the profitability model simple. Many more cost elements at the product level can be added to add detail to the model.
Remember that you can execute the report from Excel or from the Web Portal or mobile app - whatever works better for you. It can also be automatically executed and emailed to an unlimited number of non-licensed users (such as your bank branches).
Copyright Solver, Inc., 2017 BI360 White Paper | Page 35
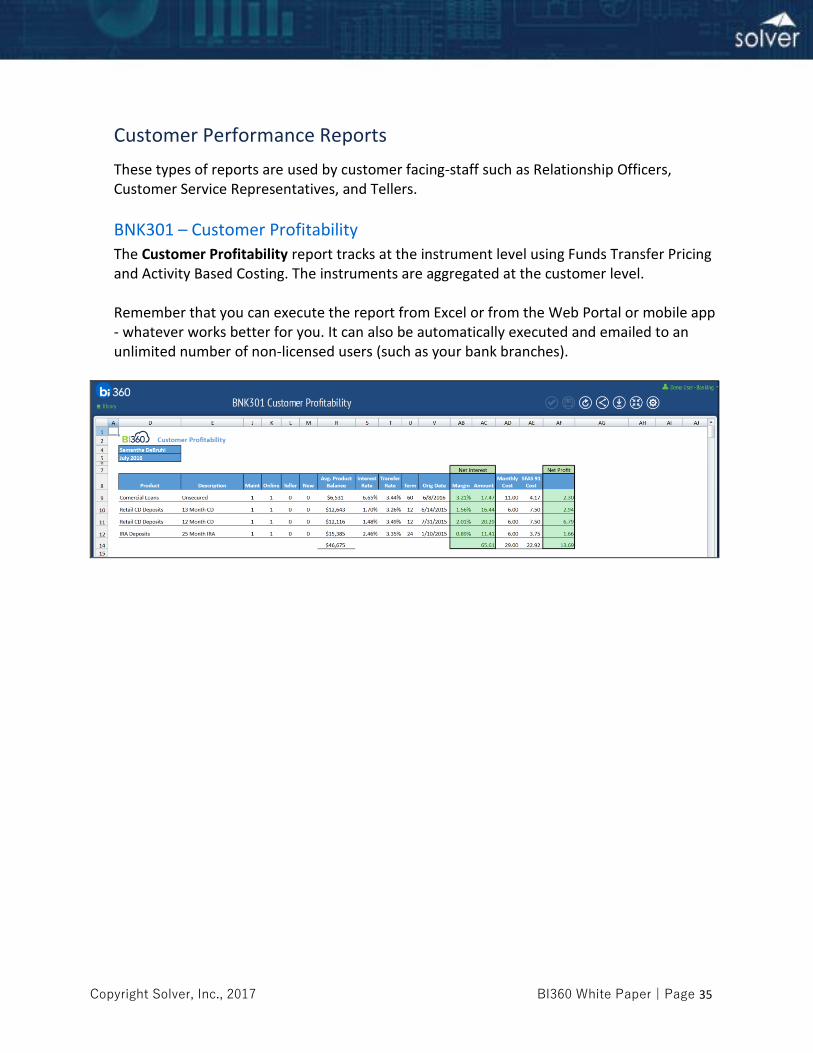
Customer Performance Reports
These types of reports are used by customer facing-staff such as Relationship Officers, Customer Service Representatives, and Tellers.
BNK301 – Customer Profitability
The Customer Profitability report tracks at the instrument level using Funds Transfer Pricing and Activity Based Costing. The instruments are aggregated at the customer level.
Remember that you can execute the report from Excel or from the Web Portal or mobile app - whatever works better for you. It can also be automatically executed and emailed to an unlimited number of non-licensed users (such as your bank branches).
Copyright Solver, Inc., 2017 BI360 White Paper | Page 36
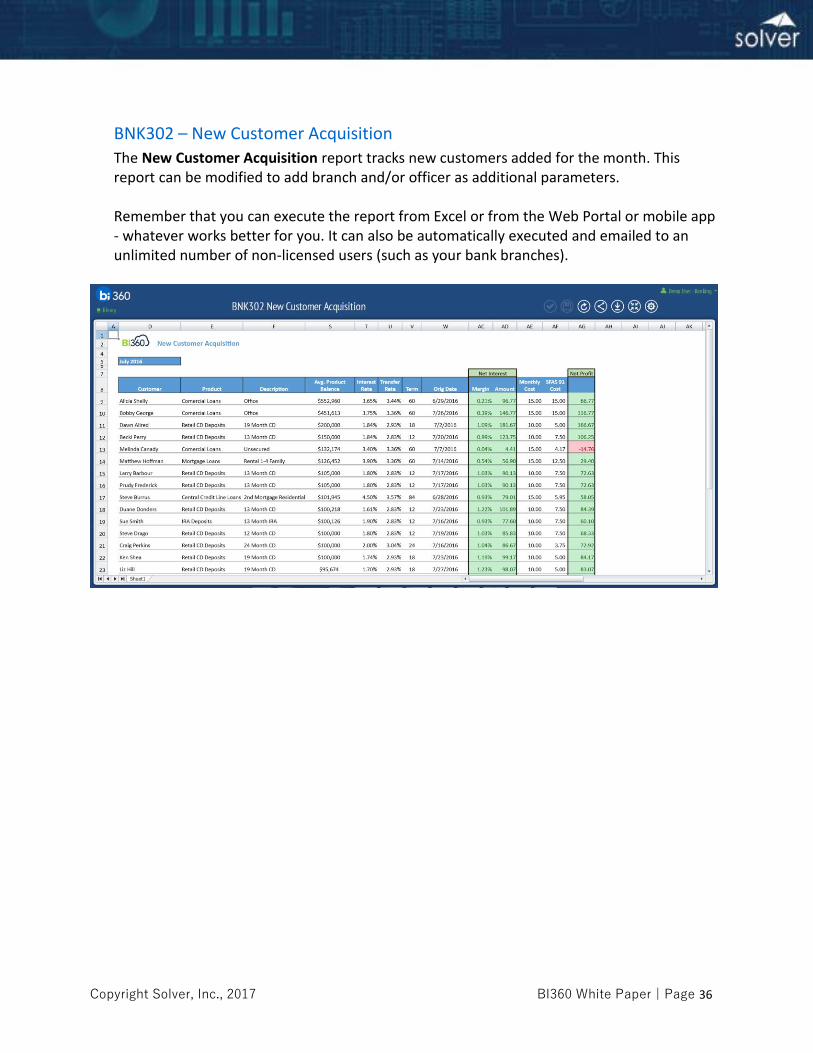
BNK302 – New Customer Acquisition
The New Customer Acquisition report tracks new customers added for the month. This report can be modified to add branch and/or officer as additional parameters.
Remember that you can execute the report from Excel or from the Web Portal or mobile app - whatever works better for you. It can also be automatically executed and emailed to an unlimited number of non-licensed users (such as your bank branches).
Copyright Solver, Inc., 2017 BI360 White Paper | Page 37
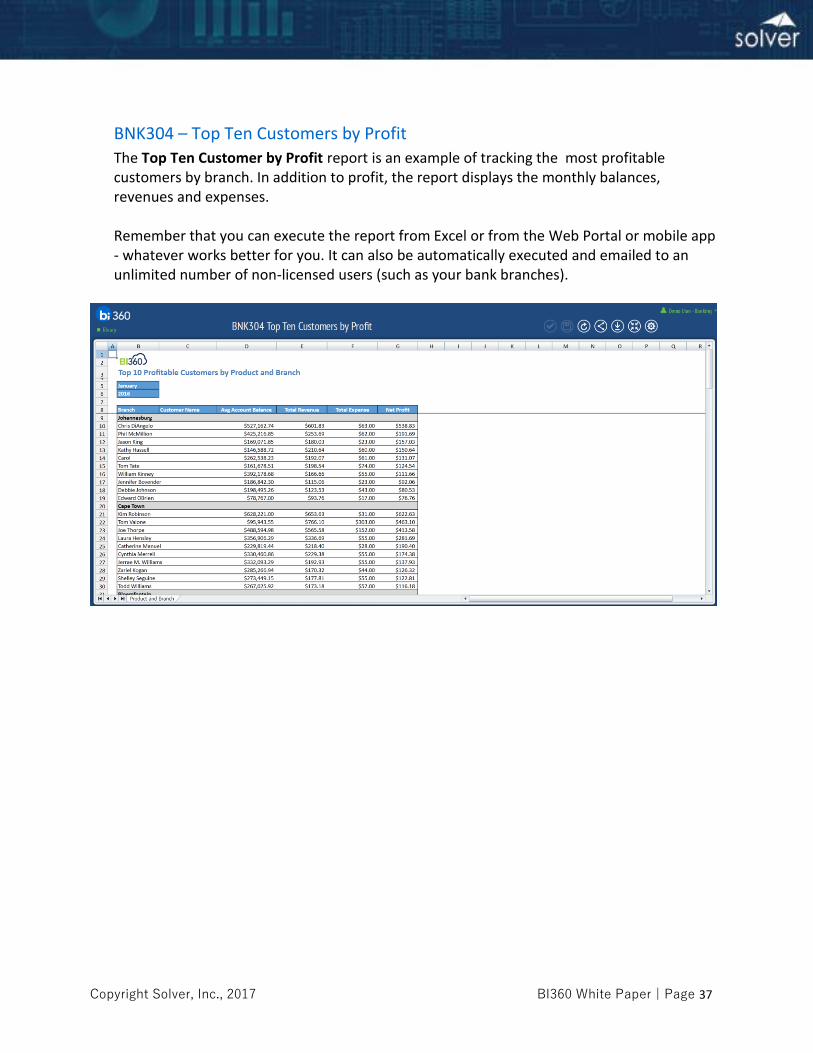
BNK304 – Top Ten Customers by Profit
The Top Ten Customer by Profit report is an example of tracking the most profitable customers by branch. In addition to profit, the report displays the monthly balances, revenues and expenses.
Remember that you can execute the report from Excel or from the Web Portal or mobile app - whatever works better for you. It can also be automatically executed and emailed to an unlimited number of non-licensed users (such as your bank branches).
Copyright Solver, Inc., 2017 BI360 White Paper | Page 38
Regulatory Reports
These reports are prepared for members of the Finance Team that are responsible for
external reporting. Outside investors and regulators use this information to make
comparisons between banks.
Remember that you can execute the report from Excel or from the Web Portal or mobile app
- whatever works better for you. It can also be automatically executed and emailed to an
unlimited number of non-licensed users (such as your bank branches).
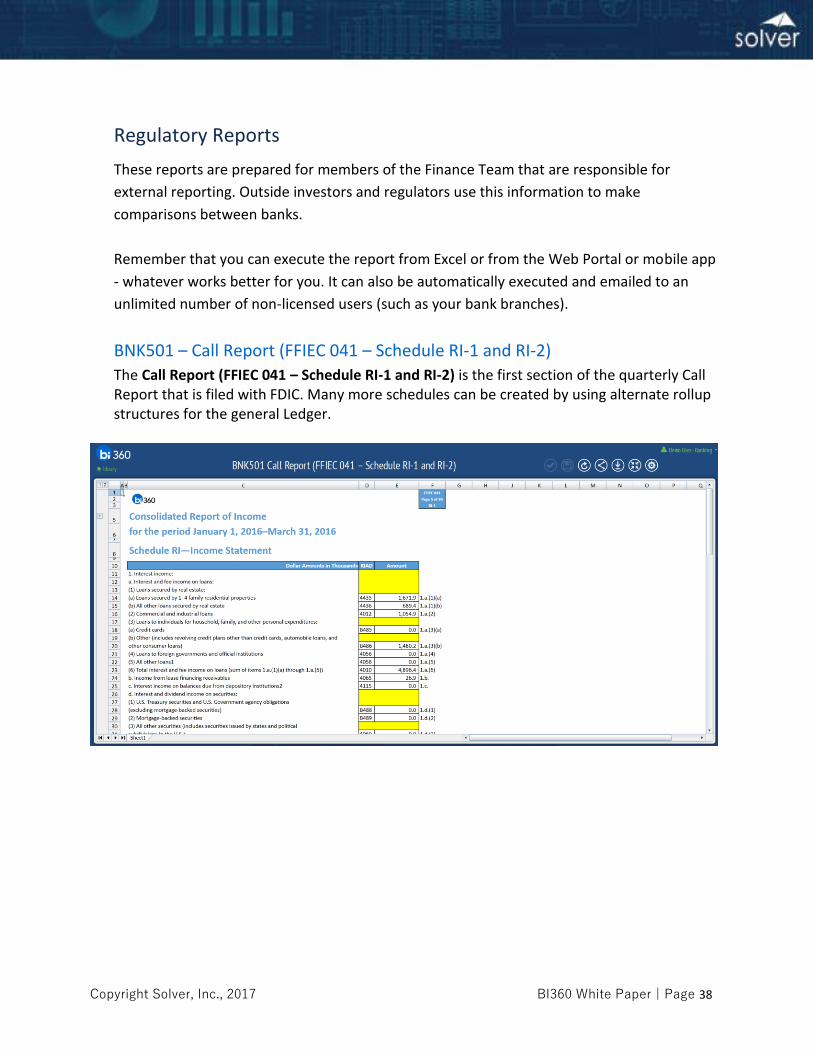
BNK501 – Call Report (FFIEC 041 – Schedule RI-1 and RI-2)
The Call Report (FFIEC 041 – Schedule RI-1 and RI-2) is the first section of the quarterly Call Report that is filed with FDIC. Many more schedules can be created by using alternate rollup structures for the general Ledger.

Copyright Solver, Inc., 2017 BI360 White Paper | Page 39
Appendix – Acronyms
SIC – Standard Industrial Classification
CPM – Corporate Performance Management
FTP – Funds Transfer Pricing
ABC – Activity Based Costing
FTE – Full Time Equivalent
NIM – Net Interest Margin
FFIEC - Federal Financial Institutions Examination Council
FDIC – Federal Deposit Insurance Corporation
Recommended