BH
GLO
BA
L CORPO
RATION
LTD AN
NUAL REPORT 2015
BH GLOBAL CORPORATION LTD 8 Penjuru Lane, Singapore 609189Tel: +65 6291 4444 Fax: +65 6291 5777Email: [email protected]
A N N U A L R E P O R T 2 0 1 5
Stay ing Focused | Remain ing Resi l ient

C O N T E N T S1 Vison, Mission and Values
2 Corporate Profile
4 At a Glance
5 Corporate Structure
8 Business Profile
15 Corporate Milestones
16 Financial Highlights
20 Chairman Statement
22 CEO’s Operational and Financial Review
25 Corporate Information
28 Board of Directors
30 Key Management
34 Investor Relations
35 Employees & Organisation
36 Corporate Social Responsibility
37 Corporate Governance
52 Financial Contents
ANNUAL REPORT 2015 1
M I S S I O NWe commit
to be a trustedand valued partner, delivering best value
to our customers andstakeholders.
V I S I O NWe pursue excellence
and aim to be the market leader in our fields of expertise.
V A L U E SINTEGRITY AND DISCIPLINE
We act with complete honesty and transparency, be responsible and accountable in all our dealings.
TEAMWORK AND PERFORMANCEWe are self-driven, cooperative, passionate and
competent in achieving common organisational goals together with open communications.
CLIENT FOCUSEDWe deliver total customer satisfaction with quality products,
value added services and solutions.
INNOVATIVEWe embrace change with innovative ideas and solutions to constantly improve productivity and
efficiency in our daily work.
LEARNING AND DEVELOPMENTWe continuously learn new skills and knowledge to develop
our potential and be the leader in our fields of expertise.
ANNUAL REPORT 2015 1
ANNUAL REPORT 20152
ESTABLISHED IN 1963 AND LISTED
ON THE SGX MAINBOARD SINCE
SEPTEMBER 2005, BH GLOBAL
CORPORATION LTD (“BH GLOBAL”
OR COLLECTIVELY KNOWN AS THE
“GROUP”) HAS TRANSFORMED FROM
A PURE SUPPLY CHAIN MANAGEMENT
COMPANY SERVICING THE MARINE
AND OFFSHORE INDUSTRIES TO
AN INTEGRATED GROUP TODAY
PROVIDING PRODUCTS IN FOUR
MAJOR BUSINESS DIVISIONS:
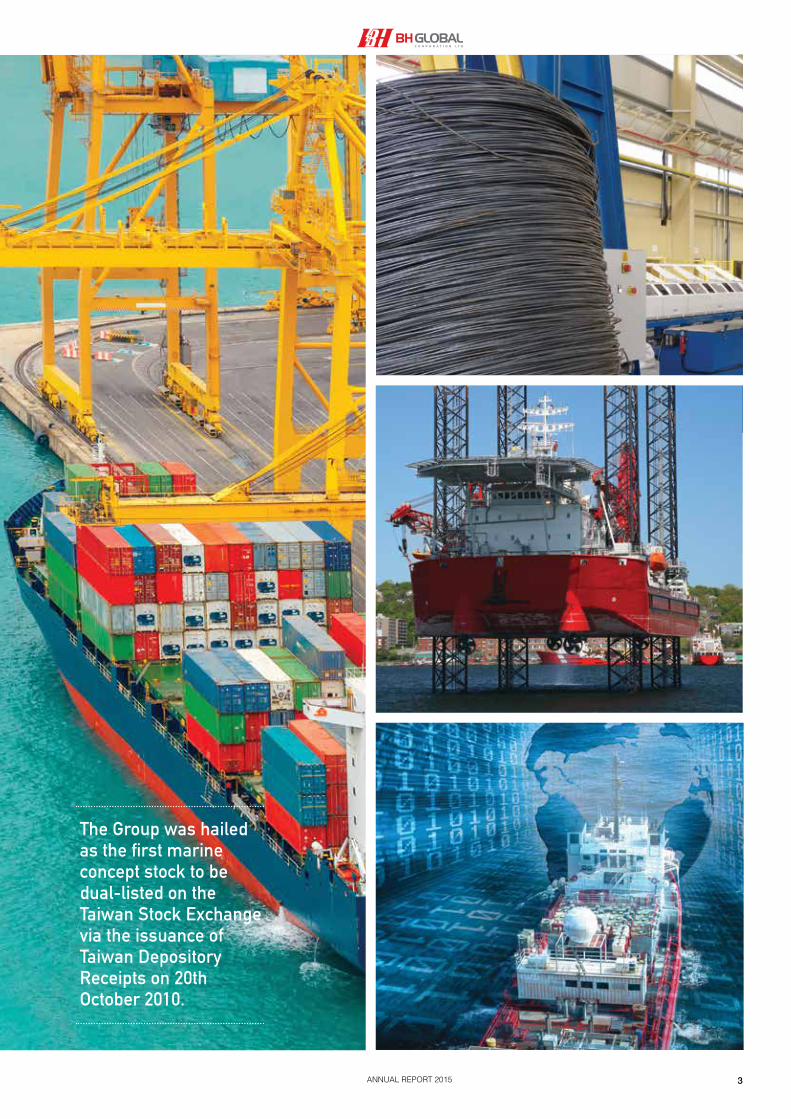
The Group has the distinction of being the first marine concept
stock to be dual-listed on the Taiwan Stock Exchange via
the issuance of Taiwan Depository Receipts on 20th October
2010.
Headquartered in Singapore, BH Global has expanded its
footprint together with its joint venture partners and distribution
channels into various regions including Southeast Asia, East
Asia, Middle East, India, Europe and North America. With over
50 years of operating experience, the Group has established
itself as a trusted and reliable business partner that carries
a premium product portfolio from industry-renowned brand
partners and manufacturers.
Leveraging on its extensive business experience and network,
BH Global has diversified its products beyond Supply Chain
Management to include Manufacturing, Engineering Solutions
and Security. Consequently, its customer base grew and it
currently has over 1,200 local and international customers
including ship owners, operators, management companies,
chandlers, repair contractors and shipyards.
• Supply Chain Management: Premium cable, lighting and electrical equipment for the marine and offshore industries
• Manufacturing: Advanced LED lighting and galvanized steel wire
• Engineering Solutions: Engineering, procurement and project management services for the oil and gas sector*
• Security: Cyber security and Enterprise IT Operation Management products for both public and private sectors
Corporate Profile
* Engineering Solutions division is classified under Discontinued Operations in the financial statements.
ANNUAL REPORT 2015 3
The Group was hailed as the first marine concept stock to be dual-listed on the Taiwan Stock Exchange via the issuance of Taiwan Depository Receipts on 20th October 2010.
ANNUAL REPORT 20154
At a Glance
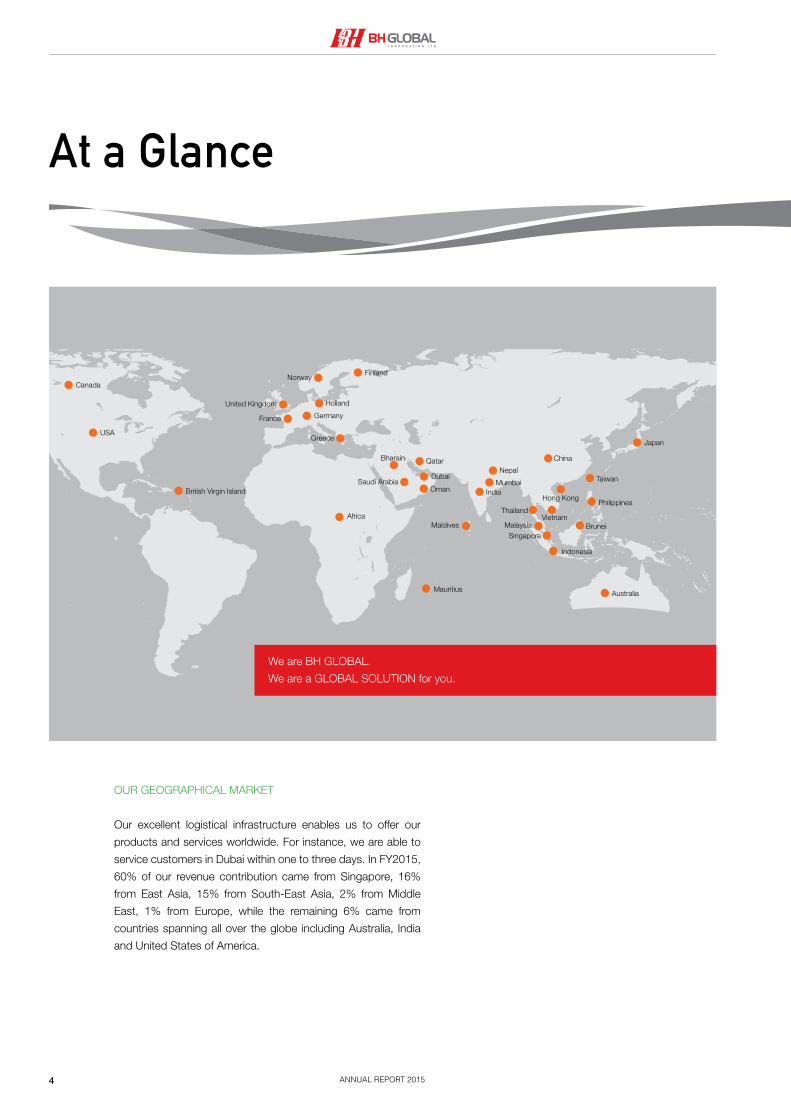
OUR GEOGRAPHICAL MARKET
Our excellent logistical infrastructure enables us to offer our
products and services worldwide. For instance, we are able to
service customers in Dubai within one to three days. In FY2015,
60% of our revenue contribution came from Singapore, 16%
from East Asia, 15% from South-East Asia, 2% from Middle
East, 1% from Europe, while the remaining 6% came from
countries spanning all over the globe including Australia, India
and United States of America.
Africa
Australia
ChinaBharain
British Virgin Island
Brunei
Dubai
France Germany
Holland
Hong Kong
Taiwan
India
Indonesia
Japan
Maldives Malaysia
Mauritius
Singapore
Mumbai
Nepal
Norway
Oman
Philippines
Qatar
Saudi Arabia
Thailand
United Kingdom
USA
Vietnam
Canada
Finland
Greece
We are BH GLOBAL.
We are a GLOBAL SOLUTION for you.
ANNUAL REPORT 2015 5
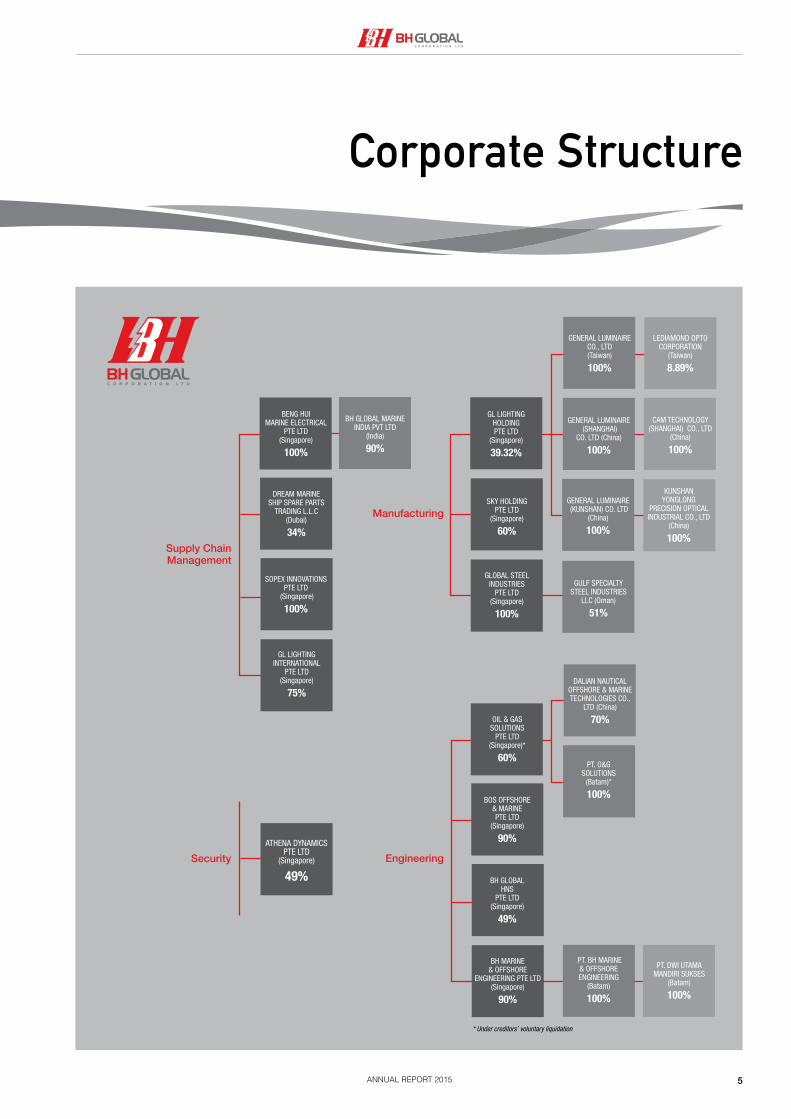
Corporate Structure
* Under creditors’ voluntary liquidation
Supply ChainManagement
Security
SOPEX INNOVATIONS PTE LTD
(Singapore)
100%
GL LIGHTING INTERNATIONAL
PTE LTD (Singapore)
75%
DREAM MARINE SHIP SPARE PARTS
TRADING L.L.C (Dubai)
34%
BENG HUI MARINE ELECTRICAL
PTE LTD (Singapore)
100%
BH GLOBAL MARINE INDIA PVT LTD
(India)
90%
ATHENA DYNAMICSPTE LTD
(Singapore)
49%
BH MARINE & OFFSHORE
ENGINEERING PTE LTD (Singapore)
90%
BH GLOBAL HNS
PTE LTD (Singapore)
49%
BOS OFFSHORE& MARINE PTE LTD
(Singapore)
90%
OIL & GAS SOLUTIONS
PTE LTD (Singapore)*
60%PT. O&G
SOLUTIONS (Batam)*
100%
PT. BH MARINE & OFFSHORE ENGINEERING
(Batam)
100%
PT. DWI UTAMA MANDIRI SUKSES
(Batam)
100%
DALIAN NAUTICAL OFFSHORE & MARINE TECHNOLOGIES CO.,
LTD (China)
70%
Manufacturing
Engineering
SKY HOLDING PTE LTD
(Singapore)
60%
GLOBAL STEEL INDUSTRIES
PTE LTD (Singapore)
100%
GL LIGHTING HOLDING PTE LTD
(Singapore)
39.32%
GULF SPECIALTY STEEL INDUSTRIES
LLC (Oman)
51%
CAM TECHNOLOGY(SHANGHAI) CO., LTD
(China)
100%
KUNSHAN YONGLONG
PRECISION OPTICAL INDUSTRIAL CO., LTD
(China)
100%
LEDIAMOND OPTO CORPORATION
(Taiwan)
8.89%
GENERAL LUMINAIRE (SHANGHAI)
CO. LTD (China)
100%
GENERAL LUMINAIRE (KUNSHAN) CO. LTD
(China)
100%
GENERAL LUMINAIRE CO., LTD (Taiwan)
100%
ANNUAL REPORT 20156
READY TO DELIVER
ANNUAL REPORT 2015 7
ANNUAL REPORT 20158
business profile:
Supply Chain Management
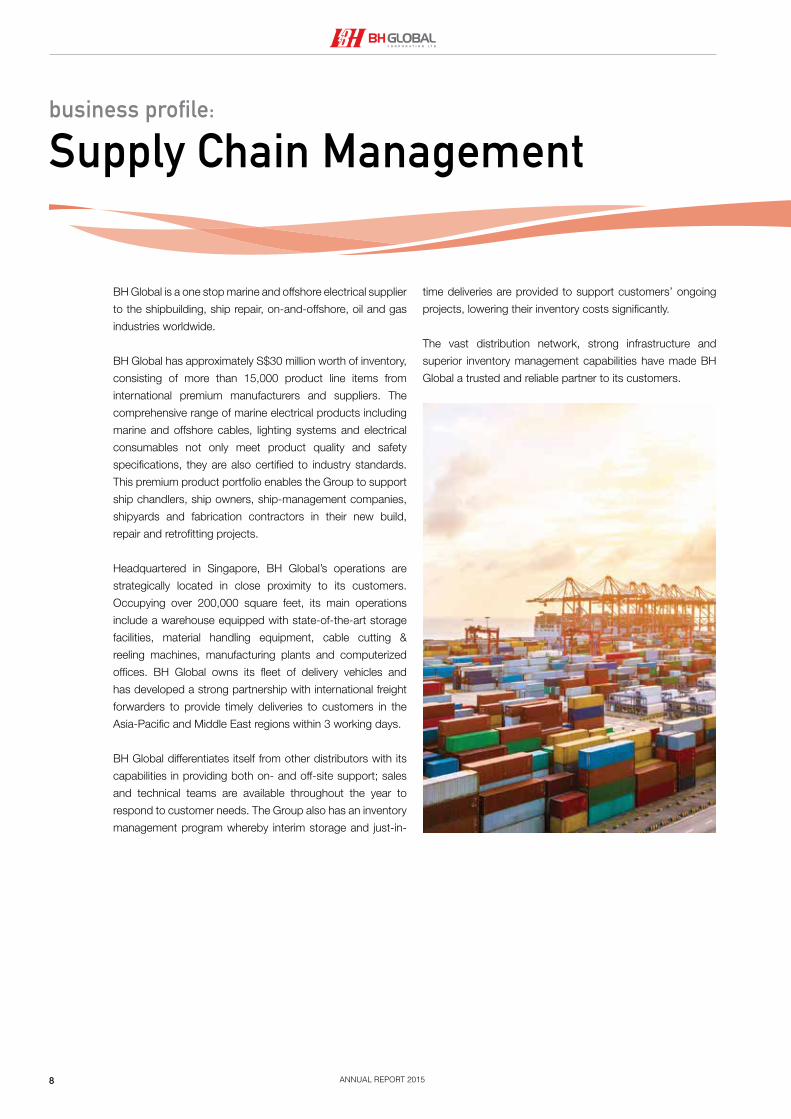
BH Global is a one stop marine and offshore electrical supplier
to the shipbuilding, ship repair, on-and-offshore, oil and gas
industries worldwide.
BH Global has approximately S$30 million worth of inventory,
consisting of more than 15,000 product line items from
international premium manufacturers and suppliers. The
comprehensive range of marine electrical products including
marine and offshore cables, lighting systems and electrical
consumables not only meet product quality and safety
specifications, they are also certified to industry standards.
This premium product portfolio enables the Group to support
ship chandlers, ship owners, ship-management companies,
shipyards and fabrication contractors in their new build,
repair and retrofitting projects.
Headquartered in Singapore, BH Global’s operations are
strategically located in close proximity to its customers.
Occupying over 200,000 square feet, its main operations
include a warehouse equipped with state-of-the-art storage
facilities, material handling equipment, cable cutting &
reeling machines, manufacturing plants and computerized
offices. BH Global owns its fleet of delivery vehicles and
has developed a strong partnership with international freight
forwarders to provide timely deliveries to customers in the
Asia-Pacific and Middle East regions within 3 working days.
BH Global differentiates itself from other distributors with its
capabilities in providing both on- and off-site support; sales
and technical teams are available throughout the year to
respond to customer needs. The Group also has an inventory
management program whereby interim storage and just-in-
time deliveries are provided to support customers’ ongoing
projects, lowering their inventory costs significantly.
The vast distribution network, strong infrastructure and
superior inventory management capabilities have made BH
Global a trusted and reliable partner to its customers.

ANNUAL REPORT 2015 9
The vast distribution network, strong infrastructure and superior inventory management capabilities have made BH Global a trusted and reliable partner to its customers.
ANNUAL REPORT 201510
business profile:
Manufacturing
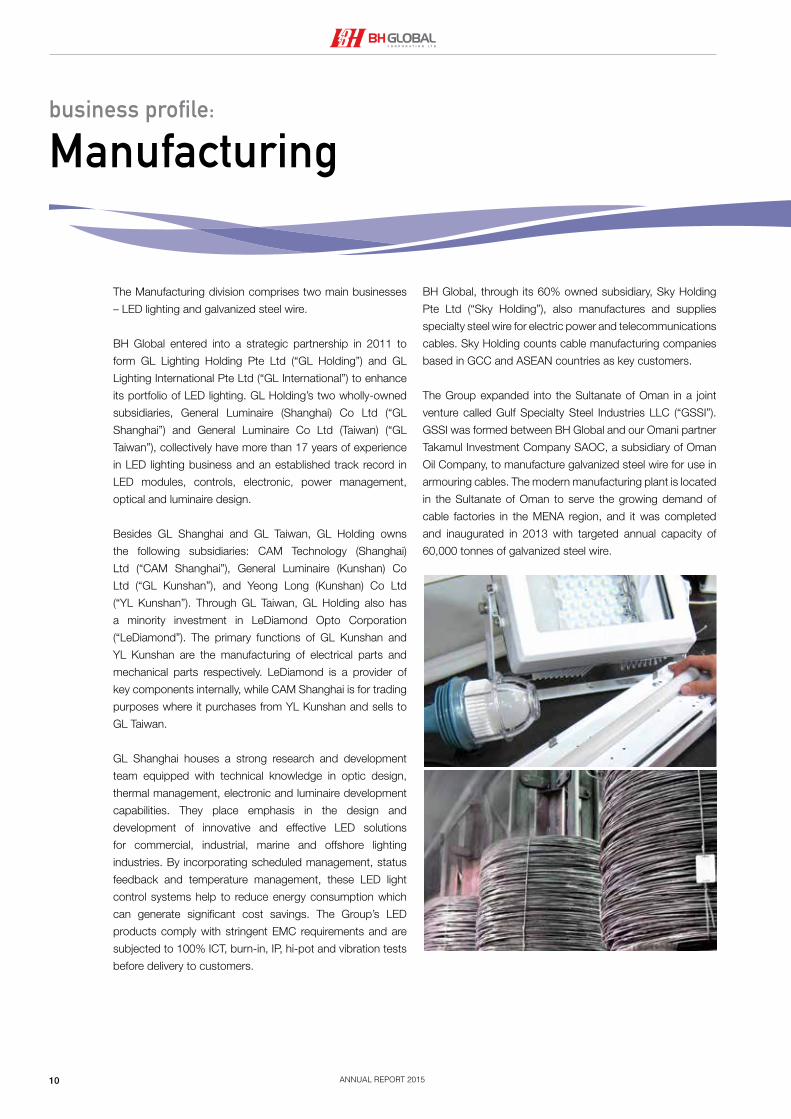
The Manufacturing division comprises two main businesses
– LED lighting and galvanized steel wire.
BH Global entered into a strategic partnership in 2011 to
form GL Lighting Holding Pte Ltd (“GL Holding”) and GL
Lighting International Pte Ltd (“GL International”) to enhance
its portfolio of LED lighting. GL Holding’s two wholly-owned
subsidiaries, General Luminaire (Shanghai) Co Ltd (“GL
Shanghai”) and General Luminaire Co Ltd (Taiwan) (“GL
Taiwan”), collectively have more than 17 years of experience
in LED lighting business and an established track record in
LED modules, controls, electronic, power management,
optical and luminaire design.
Besides GL Shanghai and GL Taiwan, GL Holding owns
the following subsidiaries: CAM Technology (Shanghai)
Ltd (“CAM Shanghai”), General Luminaire (Kunshan) Co
Ltd (“GL Kunshan”), and Yeong Long (Kunshan) Co Ltd
(“YL Kunshan”). Through GL Taiwan, GL Holding also has
a minority investment in LeDiamond Opto Corporation
(“LeDiamond”). The primary functions of GL Kunshan and
YL Kunshan are the manufacturing of electrical parts and
mechanical parts respectively. LeDiamond is a provider of
key components internally, while CAM Shanghai is for trading
purposes where it purchases from YL Kunshan and sells to
GL Taiwan.
GL Shanghai houses a strong research and development
team equipped with technical knowledge in optic design,
thermal management, electronic and luminaire development
capabilities. They place emphasis in the design and
development of innovative and effective LED solutions
for commercial, industrial, marine and offshore lighting
industries. By incorporating scheduled management, status
feedback and temperature management, these LED light
control systems help to reduce energy consumption which
can generate significant cost savings. The Group’s LED
products comply with stringent EMC requirements and are
subjected to 100% ICT, burn-in, IP, hi-pot and vibration tests
before delivery to customers.
BH Global, through its 60% owned subsidiary, Sky Holding
Pte Ltd (“Sky Holding”), also manufactures and supplies
specialty steel wire for electric power and telecommunications
cables. Sky Holding counts cable manufacturing companies
based in GCC and ASEAN countries as key customers.
The Group expanded into the Sultanate of Oman in a joint
venture called Gulf Specialty Steel Industries LLC (“GSSI”).
GSSI was formed between BH Global and our Omani partner
Takamul Investment Company SAOC, a subsidiary of Oman
Oil Company, to manufacture galvanized steel wire for use in
armouring cables. The modern manufacturing plant is located
in the Sultanate of Oman to serve the growing demand of
cable factories in the MENA region, and it was completed
and inaugurated in 2013 with targeted annual capacity of
60,000 tonnes of galvanized steel wire.

ANNUAL REPORT 2015 11
The Manufacturing division comprises two main businesses – LED lighting and galvanized steel wire.
ANNUAL REPORT 201512
business profile:
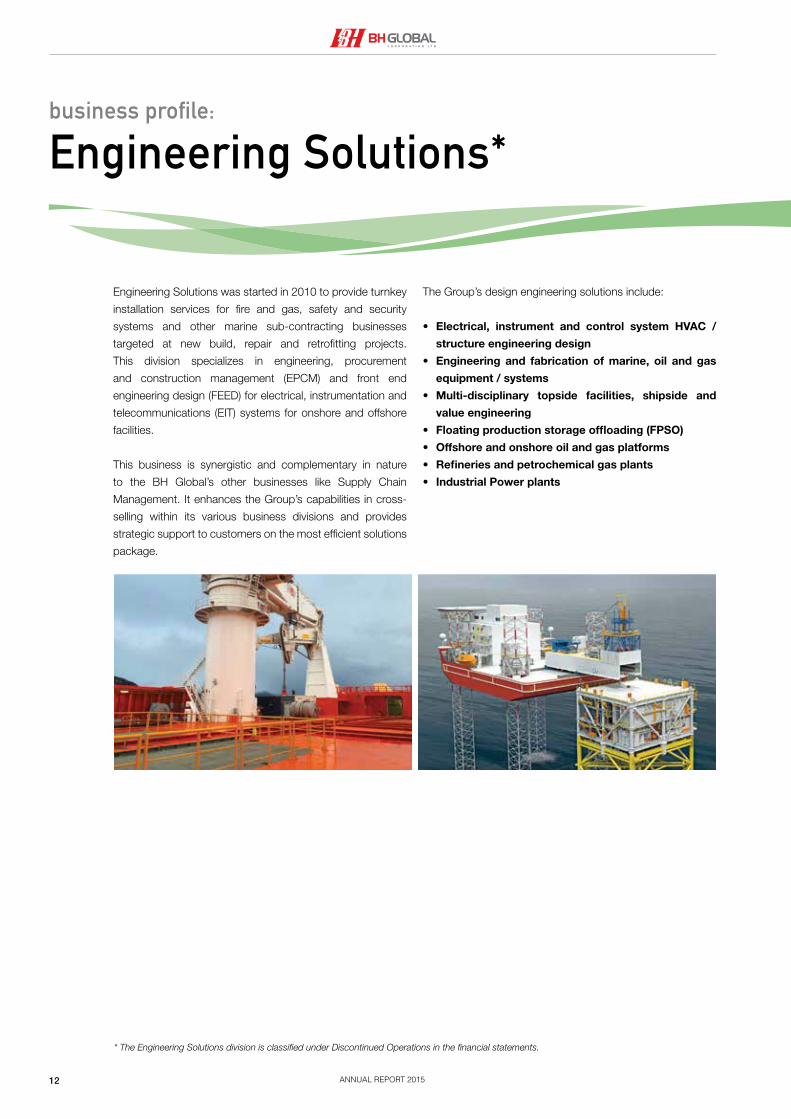
Engineering Solutions*
Engineering Solutions was started in 2010 to provide turnkey
installation services for fire and gas, safety and security
systems and other marine sub-contracting businesses
targeted at new build, repair and retrofitting projects.
This division specializes in engineering, procurement
and construction management (EPCM) and front end
engineering design (FEED) for electrical, instrumentation and
telecommunications (EIT) systems for onshore and offshore
facilities.
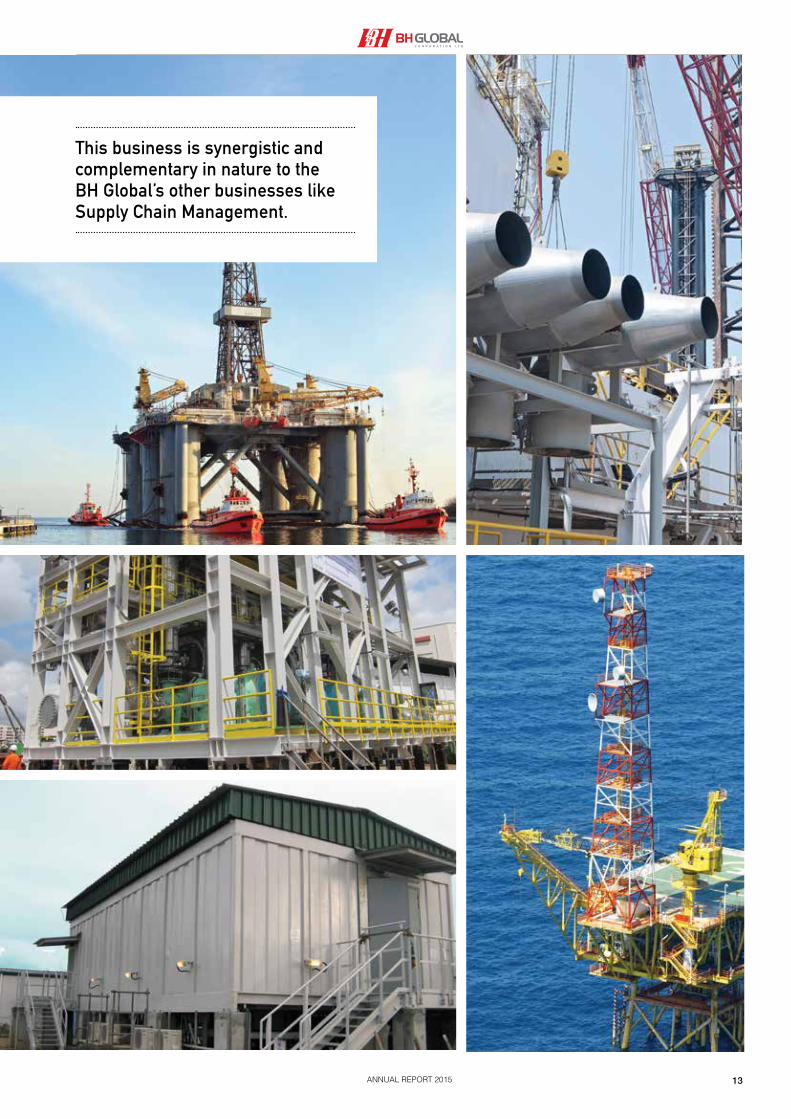
This business is synergistic and complementary in nature
to the BH Global’s other businesses like Supply Chain
Management. It enhances the Group’s capabilities in cross-
selling within its various business divisions and provides
strategic support to customers on the most efficient solutions
package.
The Group’s design engineering solutions include:
• Electrical, instrument and control system HVAC /
structure engineering design
• Engineering and fabrication of marine, oil and gas
equipment / systems
• Multi-disciplinary topside facilities, shipside and
value engineering
• Floating production storage offloading (FPSO)
• Offshore and onshore oil and gas platforms
• Refineries and petrochemical gas plants
• Industrial Power plants
* The Engineering Solutions division is classified under Discontinued Operations in the financial statements.
ANNUAL REPORT 2015 13
This business is synergistic and complementary in nature to the BH Global’s other businesses like Supply Chain Management.

ANNUAL REPORT 201514
business profile:
Security
Established in 2014, Athena Dynamics Pte Ltd (“Athena”)
sources and bridges proven technologies to Singapore and
the Asia Pacific region. The company focuses on Cyber
Security and Enterprise IT Operation Management products
which have already done well in their countries of origin but
have yet to gain sufficient traction and branding overseas.
This is achieved via its local offices in the countries of
sourcing. Athena conducts a stringent due diligence process
on these technologies prior to representing them as the
exclusive distributor and developing the channel structures
for them in Singapore and the region.
Since its inception, Athena has achieved strong traction in
key areas of critical and stringent network protection. With
that, and coupled with its strong credentials and experience
in enterprise IT operation management, the company is well
poised to introduce well-deployed products in the areas
of Enterprise, Stringent and Critical Network Security and
Enterprise IT Operation Management.
ANNUAL REPORT 2015 15
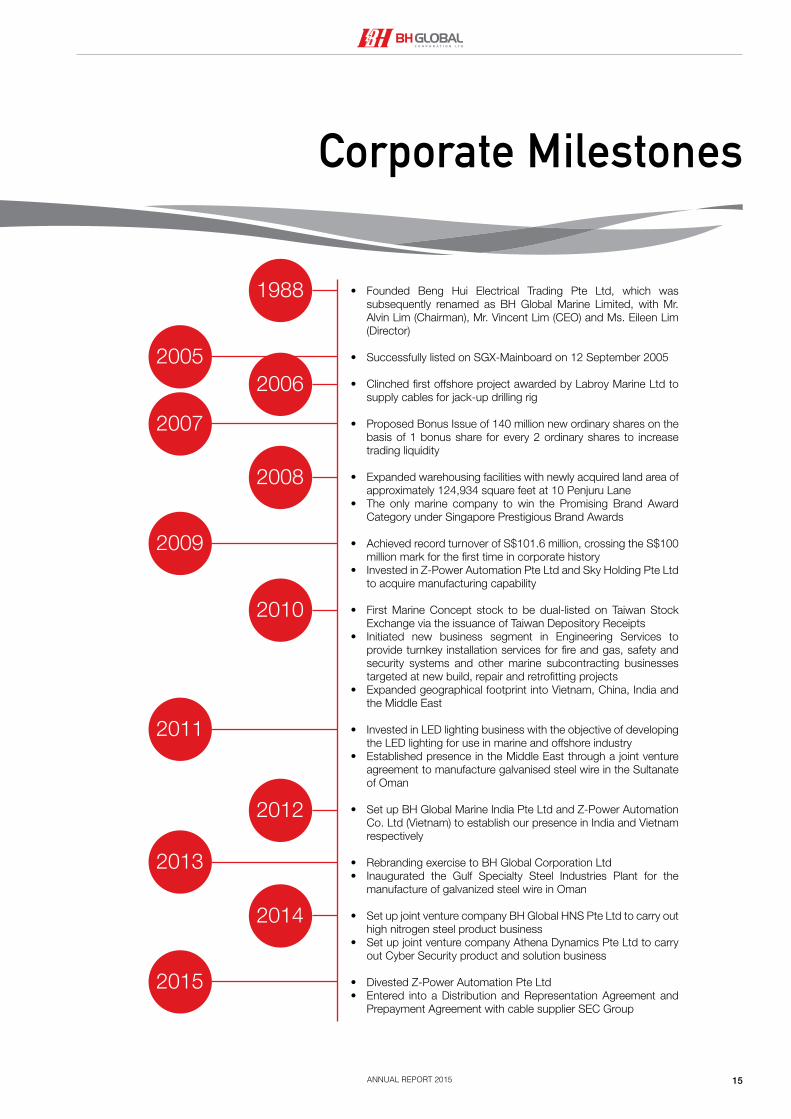
Corporate Milestones
• Founded Beng Hui Electrical Trading Pte Ltd, which was subsequently renamed as BH Global Marine Limited, with Mr. Alvin Lim (Chairman), Mr. Vincent Lim (CEO) and Ms. Eileen Lim (Director)
• Successfully listed on SGX-Mainboard on 12 September 2005
• Clinched first offshore project awarded by Labroy Marine Ltd to supply cables for jack-up drilling rig
• Proposed Bonus Issue of 140 million new ordinary shares on the basis of 1 bonus share for every 2 ordinary shares to increase trading liquidity
• Expanded warehousing facilities with newly acquired land area of approximately 124,934 square feet at 10 Penjuru Lane
• The only marine company to win the Promising Brand Award Category under Singapore Prestigious Brand Awards
• Achieved record turnover of S$101.6 million, crossing the S$100 million mark for the first time in corporate history
• Invested in Z-Power Automation Pte Ltd and Sky Holding Pte Ltd to acquire manufacturing capability
• First Marine Concept stock to be dual-listed on Taiwan Stock Exchange via the issuance of Taiwan Depository Receipts
• Initiated new business segment in Engineering Services to provide turnkey installation services for fire and gas, safety and security systems and other marine subcontracting businesses targeted at new build, repair and retrofitting projects
• Expanded geographical footprint into Vietnam, China, India and the Middle East
• Invested in LED lighting business with the objective of developing the LED lighting for use in marine and offshore industry
• Established presence in the Middle East through a joint venture agreement to manufacture galvanised steel wire in the Sultanate of Oman
• Set up BH Global Marine India Pte Ltd and Z-Power Automation Co. Ltd (Vietnam) to establish our presence in India and Vietnam respectively
• Rebranding exercise to BH Global Corporation Ltd• Inaugurated the Gulf Specialty Steel Industries Plant for the
manufacture of galvanized steel wire in Oman
• Set up joint venture company BH Global HNS Pte Ltd to carry out high nitrogen steel product business
• Set up joint venture company Athena Dynamics Pte Ltd to carry out Cyber Security product and solution business
• Divested Z-Power Automation Pte Ltd• Entered into a Distribution and Representation Agreement and
Prepayment Agreement with cable supplier SEC Group
1988
20062005
2007
2009
2011
2013
2015
2008
2010
2012
2014
ANNUAL REPORT 201516
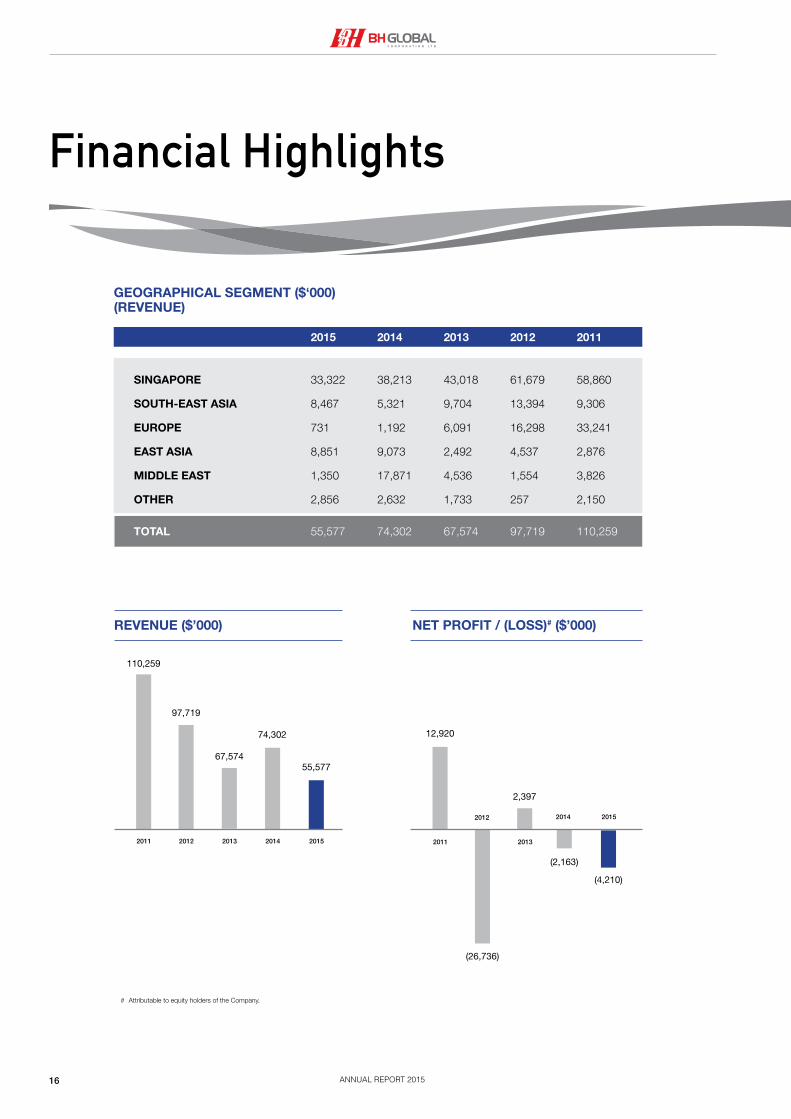
Financial Highlights
REVENUE ($’000) NET PROFIT / (LOSS)# ($’000)
110,259
97,719
67,574
74,302
55,577
12,920
2,397
(4,210)
(2,163)
(26,736)
2011 2012 2013 2014 2015
2012 2014
2011 2013
2015
2015 2014 2013 2012 2011
SINGAPORE 33,322 38,213 43,018 61,679 58,860
SOUTH-EAST ASIA 8,467 5,321 9,704 13,394 9,306
EUROPE 731 1,192 6,091 16,298 33,241
EAST ASIA 8,851 9,073 2,492 4,537 2,876
MIDDLE EAST 1,350 17,871 4,536 1,554 3,826
OTHER 2,856 2,632 1,733 257 2,150
TOTAL 55,577 74,302 67,574 97,719 110,259
GEOGRAPHICAL SEGMENT ($‘000)(REVENUE)
# Attributable to equity holders of the Company.
ANNUAL REPORT 2015 17
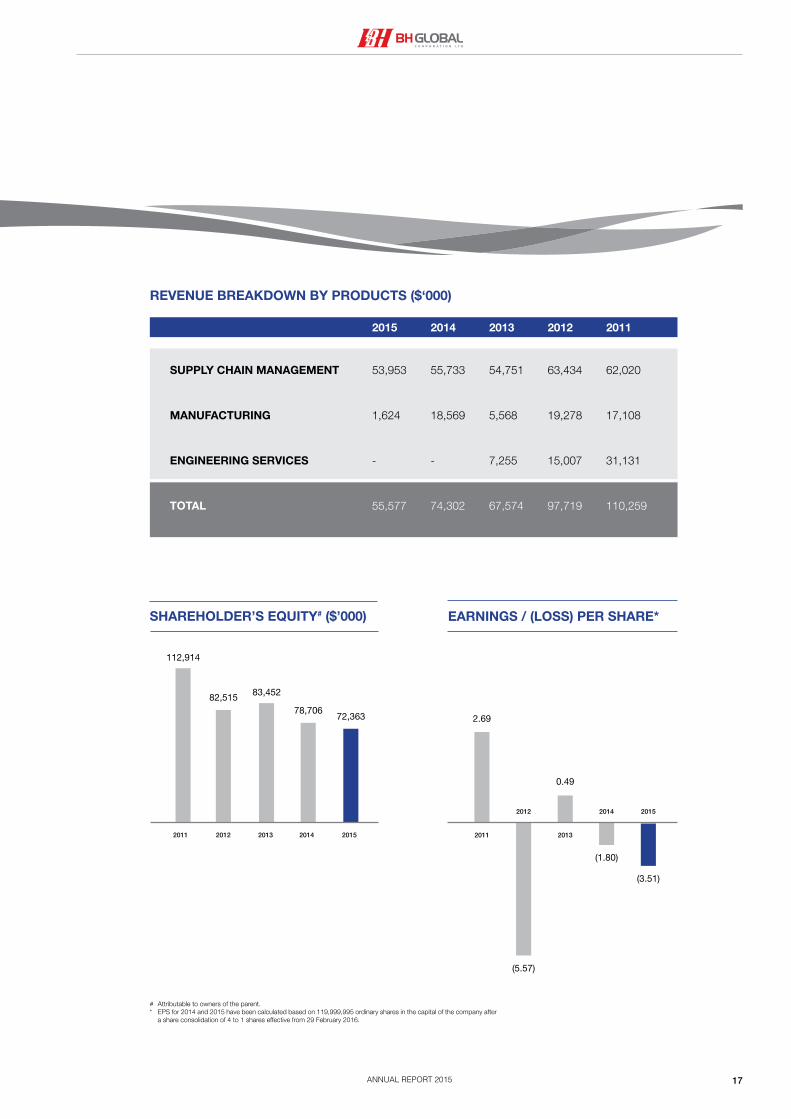
SHAREHOLDER’S EQUITY# ($’000) EARNINGS / (LOSS) PER SHARE*
2.69
0.49
(3.51)
(5.57)
(1.80)
112,914
82,515 83,452
78,70672,363
2012 2013 2014 20152011 2011 2013
20152012 2014
2015 2014 2013 2012 2011
SUPPLY CHAIN MANAGEMENT 53,953 55,733 54,751 63,434 62,020
MANUFACTURING 1,624 18,569 5,568 19,278 17,108
ENGINEERING SERVICES - - 7,255 15,007 31,131
TOTAL 55,577 74,302 67,574 97,719 110,259
REVENUE BREAKDOWN BY PRODUCTS ($‘000)
# Attributable to owners of the parent.* EPS for 2014 and 2015 have been calculated based on 119,999,995 ordinary shares in the capital of the company after
a share consolidation of 4 to 1 shares effective from 29 February 2016.
ANNUAL REPORT 201518
MAINTAINING OUR FOCUS
ANNUAL REPORT 2015 19
ANNUAL REPORT 201520
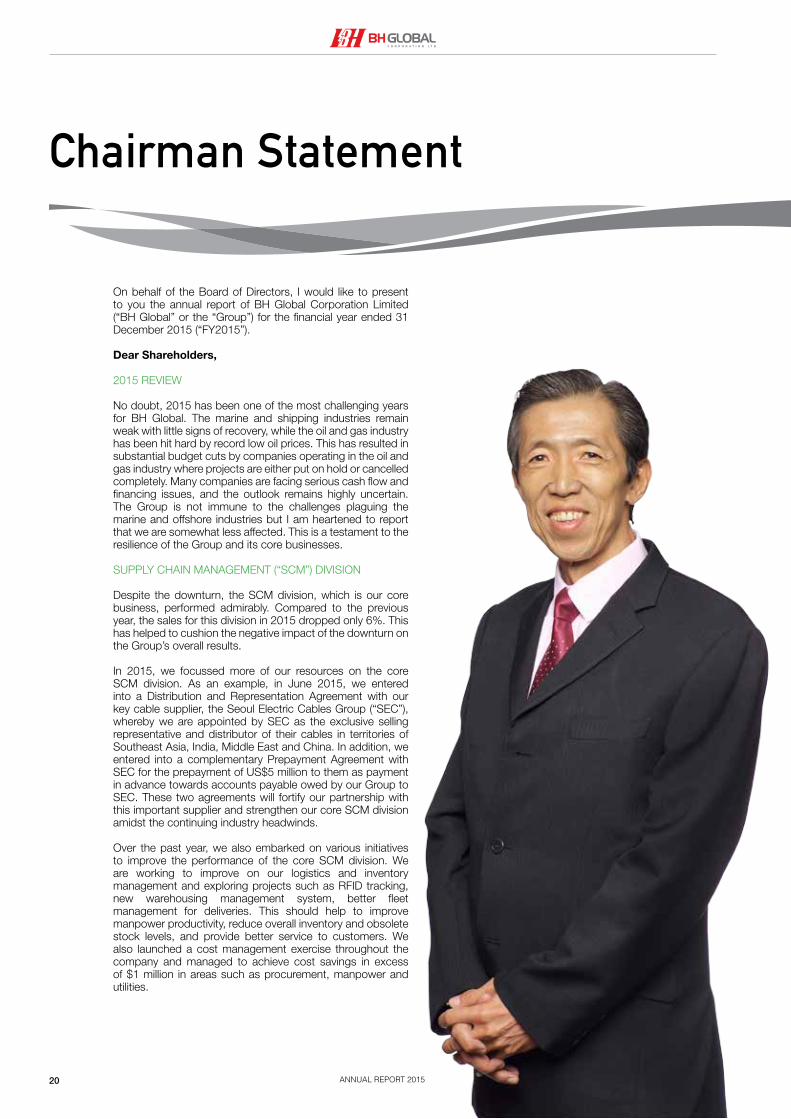
Chairman Statement
On behalf of the Board of Directors, I would like to present to you the annual report of BH Global Corporation Limited (“BH Global” or the “Group”) for the financial year ended 31 December 2015 (“FY2015”).
Dear Shareholders,
2015 REVIEW
No doubt, 2015 has been one of the most challenging years for BH Global. The marine and shipping industries remain weak with little signs of recovery, while the oil and gas industry has been hit hard by record low oil prices. This has resulted in substantial budget cuts by companies operating in the oil and gas industry where projects are either put on hold or cancelled completely. Many companies are facing serious cash flow and financing issues, and the outlook remains highly uncertain. The Group is not immune to the challenges plaguing the marine and offshore industries but I am heartened to report that we are somewhat less affected. This is a testament to the resilience of the Group and its core businesses.
SUPPLY CHAIN MANAGEMENT (“SCM”) DIVISION
Despite the downturn, the SCM division, which is our core business, performed admirably. Compared to the previous year, the sales for this division in 2015 dropped only 6%. This has helped to cushion the negative impact of the downturn on the Group’s overall results.
In 2015, we focussed more of our resources on the core SCM division. As an example, in June 2015, we entered into a Distribution and Representation Agreement with our key cable supplier, the Seoul Electric Cables Group (“SEC”), whereby we are appointed by SEC as the exclusive selling representative and distributor of their cables in territories of Southeast Asia, India, Middle East and China. In addition, we entered into a complementary Prepayment Agreement with SEC for the prepayment of US$5 million to them as payment in advance towards accounts payable owed by our Group to SEC. These two agreements will fortify our partnership with this important supplier and strengthen our core SCM division amidst the continuing industry headwinds.
Over the past year, we also embarked on various initiatives to improve the performance of the core SCM division. We are working to improve on our logistics and inventory management and exploring projects such as RFID tracking, new warehousing management system, better fleet management for deliveries. This should help to improve manpower productivity, reduce overall inventory and obsolete stock levels, and provide better service to customers. We also launched a cost management exercise throughout the company and managed to achieve cost savings in excess of $1 million in areas such as procurement, manpower and utilities.

ANNUAL REPORT 2015 21
In addition, we entered into a complementary Prepayment Agreement with SEC for the prepayment of US$5 million to them as payment in advance towards accounts payable owed by our Group to SEC.
We continue to invest in areas where there is growth potential and tangible returns. We launched our online store for the SCM division (www.bh-estore.com) to tap on this new sales channel with huge growth potential. Customers are able to view the comprehensive range of products we offer online. We are excited about this online store and will develop it further to make it easier and more convenient for customers to purchase online. We also continue our marketing and promotional efforts by taking part in various trade exhibitions such as Sea Asia, ISSA, IMPA, INMEX-SMM India and Marintec China in 2015.
MANUFACTURING DIVISION
The Manufacturing division comprises two main businesses – LED lighting with operations primarily in China, and galvanized steel wire with its factory in Oman. For LED lighting, the performance has been affected over the past year by various factors such as the relocation of the factory from Shanghai to Kunshan, implementation of a new ERP system and postponement of projects by major customers. Nevertheless, the Group remain positive on the long-term prospects of the LED lighting industry as more companies and consumers switch to LED lighting products for its higher energy efficiency and cost savings.
In 2015, we have invested further into GL Holding Pte Ltd (“GLH”) where our shareholding in this associate company has increased to 39.32%. Ultimately, our shareholding in GLH will increase to 43% as previously announced. GLH has obtained its Kunshan land title in 2015 and is currently preparing for the construction of a new factory which will significantly boost its manufacturing capacity for LED lighting products. Construction is expected to take place progressively over 2016 and the new factory is expected to be completed in 2017.
The Group’s other manufacturing operation is the galvanized steel wire plant in Oman. While the performance of this business has improved in 2015 compared to 2014, it is still below expectations and yet to achieve the targeted breakeven production and sales volumes. Hence the operation continues to incur losses and efforts to turn it around remain challenging. The Group is currently working closely with our Omani joint venture partner, Takamul Investment Company SAOC, to explore various options with regards to this galvanized steel wire business.
ENGINEERING SERVICES DIVISION
Despite efforts to rationalize the operations and costs of the Engineering Services division, it continued to suffer losses arising from the effects of the drastic fall in oil prices and is unable to pay its debts as they fall due. In view of the continuing uncertainty that the oil and gas industry is facing, the directors of Oil & Gas Solutions Pte Ltd (“OGS”) took the difficult decision to liquidate OGS. Key management of OGS have also stepped down.
Going forward, the activities of this division will be carried out by our subsidiary, BOS Offshore & Marine Pte Ltd. They are currently handling a major engineering and procurement project for a Japanese customer. Learning from the lessons of OGS, we will monitor closely the progress of this project to avoid future project delays and cost overruns.
In 2015, we also made progress in winding down our engineering operations in Batam; we sold all remaining equipment and stocks. It remains the Group’s intention to dispose of the remaining shipyard.
SECURITY DIVISION
In view of the growing security challenges facing countries, communities and corporates worldwide, we decided to form a Security division to capture these new opportunities. The activities of this division will be carried out by our joint venture company, Athena Dynamics Pte Ltd (“ADL”). ADL focuses on Cyber Security and Enterprise IT Operation Management products that have already done well in their countries of origin but have yet to establish a foothold in Singapore and neighbouring countries. Though small, the company has already won orders in 2015 and we are hopeful that it will do even better in 2016.
A WORD OF THANKS
2015 has been a tough year for the marine and offshore industries we operate in. But I would like to emphasize the resilience of our Group, our core businesses and our valued employees which will help us tide through this difficult period. As the saying goes, “This too will pass”. The dark clouds hanging over our markets will eventually be lifted, and we should position ourselves to capture the opportunities when the market recovers. I believe that we will emerge stronger from this storm. Lastly, I would like to thank everyone who has stood by BH Global in good times or bad, including our customers, suppliers, bankers, employees, Board of Directors and shareholders. Your support means a lot to us. Let’s all look forward to a better 2016!
Alvin Lim Hwee HongChairman
ANNUAL REPORT 201522
CEO Operationaland Financial Review
The Group’s revenue decreased by 25% from S$74.3 million in FY2014 to S$55.6 million in FY2015. This was largely due to the reclassification of the galvanized steel wire business in Oman from a subsidiary to a joint venture from 4Q2014 and hence its revenues are not included in FY2015. The Supply Chain Management division contributed 97% to the overall revenue, while the Manufacturing division contributed the remaining 3%.
In FY2015, the Group’s gross profit increased by 4% from S$18.6 million to S$19.4 million, while the gross profit margin increased from 25% to 35%. Both profitability measures improved in 2015 due to the reclassification of the galvanized steel wire business in Oman from a subsidiary to a joint venture and hence its gross losses are not consolidated as a subsidiary. The gross profit figures in 2015 largely reflect significantly that of the core business, the Supply Chain Management division.
The Group’s operating expenses comprise mainly selling & distribution and administrative expenses. Selling & distribution expenses decreased by 13% to S$8.1 million which is due mainly to the reclassification of the galvanized steel wire business in Oman from a subsidiary to a joint venture and the Group’s efforts in cost management. Administrative expenses increased by 16% to S$11.0 million as a result of the provision for liabilities in relation to the corporate guarantee given by the Company to the galvanized steel wire and Engineering Services businesses. While the Group’s efforts in managing expenses have paid off in areas such as manpower, purchases from suppliers, utilities and discretionary spending, it is affected by our provisions for trade receivables and stock obsolescence. The Group will work to reduce these provisions through better management of our customer credit and inventory going forward.
The Group concluded FY2015 with net losses from continuing operations and discontinued operations of S$1.7 million and S$4.5 million respectively. Overall net loss for FY2015 is S$6.2 million as compared to net loss of S$6.5 million in the previous year. Net loss attributable to equity holders of the Company is S$4.2 million, while net loss attributable to non-controlling interests is S$2.0 million
ANNUAL REPORT 2015 23
SEGMENTAL OVERVIEW
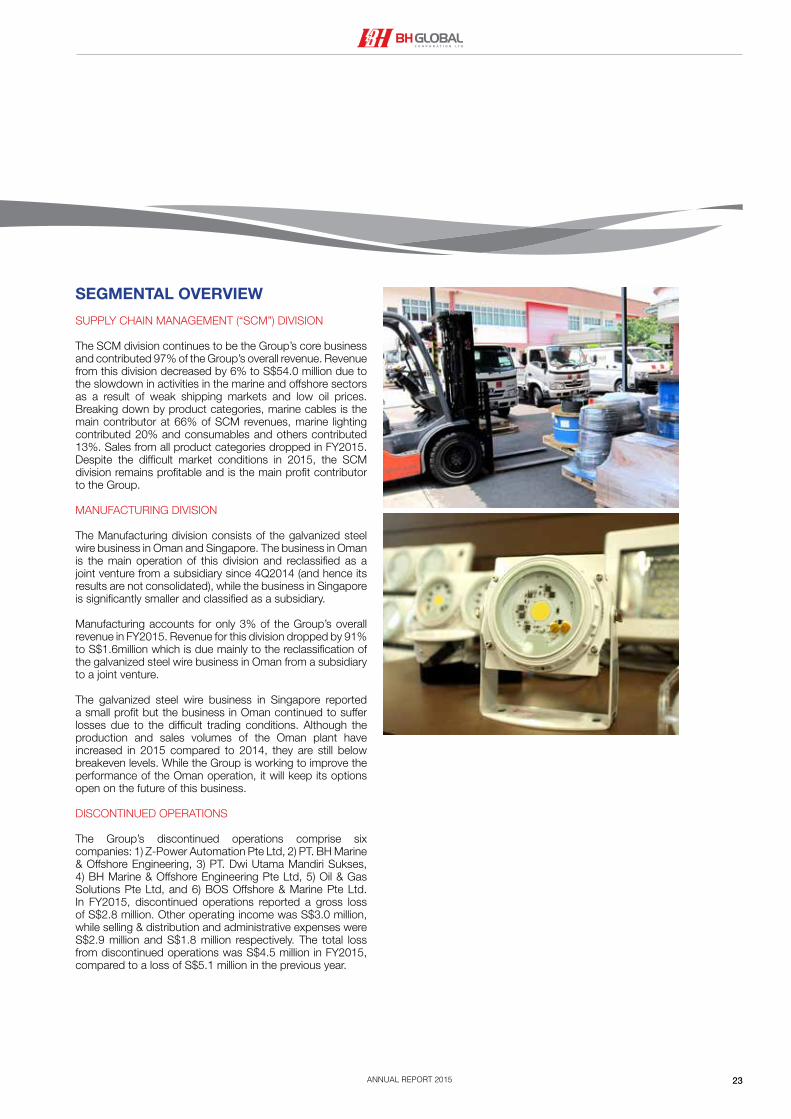
SUPPLY CHAIN MANAGEMENT (“SCM”) DIVISION
The SCM division continues to be the Group’s core business and contributed 97% of the Group’s overall revenue. Revenue from this division decreased by 6% to S$54.0 million due to the slowdown in activities in the marine and offshore sectors as a result of weak shipping markets and low oil prices. Breaking down by product categories, marine cables is the main contributor at 66% of SCM revenues, marine lighting contributed 20% and consumables and others contributed 13%. Sales from all product categories dropped in FY2015. Despite the difficult market conditions in 2015, the SCM division remains profitable and is the main profit contributor to the Group.
MANUFACTURING DIVISION
The Manufacturing division consists of the galvanized steel wire business in Oman and Singapore. The business in Oman is the main operation of this division and reclassified as a joint venture from a subsidiary since 4Q2014 (and hence its results are not consolidated), while the business in Singapore is significantly smaller and classified as a subsidiary.
Manufacturing accounts for only 3% of the Group’s overall revenue in FY2015. Revenue for this division dropped by 91% to S$1.6million which is due mainly to the reclassification of the galvanized steel wire business in Oman from a subsidiary to a joint venture.
The galvanized steel wire business in Singapore reported a small profit but the business in Oman continued to suffer losses due to the difficult trading conditions. Although the production and sales volumes of the Oman plant have increased in 2015 compared to 2014, they are still below breakeven levels. While the Group is working to improve the performance of the Oman operation, it will keep its options open on the future of this business.
DISCONTINUED OPERATIONS
The Group’s discontinued operations comprise six companies: 1) Z-Power Automation Pte Ltd, 2) PT. BH Marine & Offshore Engineering, 3) PT. Dwi Utama Mandiri Sukses, 4) BH Marine & Offshore Engineering Pte Ltd, 5) Oil & Gas Solutions Pte Ltd, and 6) BOS Offshore & Marine Pte Ltd. In FY2015, discontinued operations reported a gross loss of S$2.8 million. Other operating income was S$3.0 million, while selling & distribution and administrative expenses were S$2.9 million and S$1.8 million respectively. The total loss from discontinued operations was S$4.5 million in FY2015, compared to a loss of S$5.1 million in the previous year.
ANNUAL REPORT 201524
FINANCIAL POSITION
The Group’s total assets were S$91.7 million as at 31 December 2015, down 19% from the previous year. Non-current assets were S$37.1 million, up 14%. The increase in non-current assets is due mainly to a purchase deposit paid to a supplier, increase in investment in associated companies and joint ventures, offset partially by a decrease in property, plant and equipment. Current assets were S$54.6 million, down 32%. The decrease in current assets is mainly due to the decrease in disposal group assets held for sale, trade receivables and inventories.
As of 31 December 2015, the Group’s total liabilities were S$24.4 million, down 42% from the previous year. Non-current liabilities were S$1.3 million, down 6%. The decrease in non-current liabilities is due mainly to the decrease in finance lease liabilities. Current liabilities were S$23.1 million, down 43%. The decrease in current liabilities is due mainly to the decrease in liabilities directly associated with disposal group classified as held for sale, decrease in bank borrowings, decrease in due to customers on construction contracts, decrease in trade payables and other payables, offset partially by increase in provision for liabilities.
Total shareholders’ equity as of 31 December 2015 is S$67.3 million, 6% lower compared to the previous year. Shareholders’ equity attributable to equity holders of the Company is S$72.4 million, 8% lower. The lower shareholders’ equity is a result of the Group’s losses in FY2015.
CONCLUSION
The Group’s overall results in FY2015 is a reflection of both the difficult external environment and challenging internal issues of certain business divisions. However, it is heartening to note that our core business remains resilient and continues to perform profitably. The management will strive to work in the interests of all shareholders by continuing to strengthen our core business and improve those businesses that have underperformed.
Vincent Lim Hui EngChief Executive Officer
ANNUAL REPORT 2015 25
Corporate Information
BOARD OF DIRECTORS
Alvin Lim Hwee Hong Executive Chairman
Vincent Lim Hui Eng Executive Director and Chief Executive Officer
Patrick Lim Hui Peng Executive Director and Chief Operating Officer
Loh Weng Whye Lead Independent Director
David Chia Tian Bin Independent Director
Winston Kwek Choon Lin Independent Director
COMPANY SECRETARY
Pan Mi KeayToon Choi Fan
AUDIT COMMITTEE
David Chia Tian Bin ChairmanLoh Weng WhyeWinston Kwek Choon Lin
NOMINATING COMMITTEE
Winston Kwek Choon Lin ChairmanLoh Weng WhyeVincent Lim Hui Eng
REMUNERATION COMMITTEE
Loh Weng Whye ChairmanDavid Chia Tian BinWinston Kwek Choon Lin
RISK MANAGEMENT COMMITTEE
Alvin Lim Hwee Hong ChairmanVincent Lim Hui EngKeegan Chua Tze Wee
SHARE REGISTRAR AND SHARE TRANSFER OFFICE
Tricor Barbinder Share Registration Services(A division of Tricor Singapore Pte. Ltd.)80 Robinson Road #02-00Singapore 068898
INDEPENDENT AUDITOR
Baker Tilly TFW LLPPublic Accountants and Chartered Accountants600 North Bridge Road #05-01 Parkview SquareSingapore 188778Partner-in-charge: Ng Hock Lee(a member of Institute of Singapore Chartered Accountants)*Appointed in financial year 2015
REGISTERED OFFICE
8 Penjuru LaneSingapore 609189Registration Number: 200404900H
ANNUAL REPORT 201526
FORGINGAHEAD
ANNUAL REPORT 2015 27
ANNUAL REPORT 201528
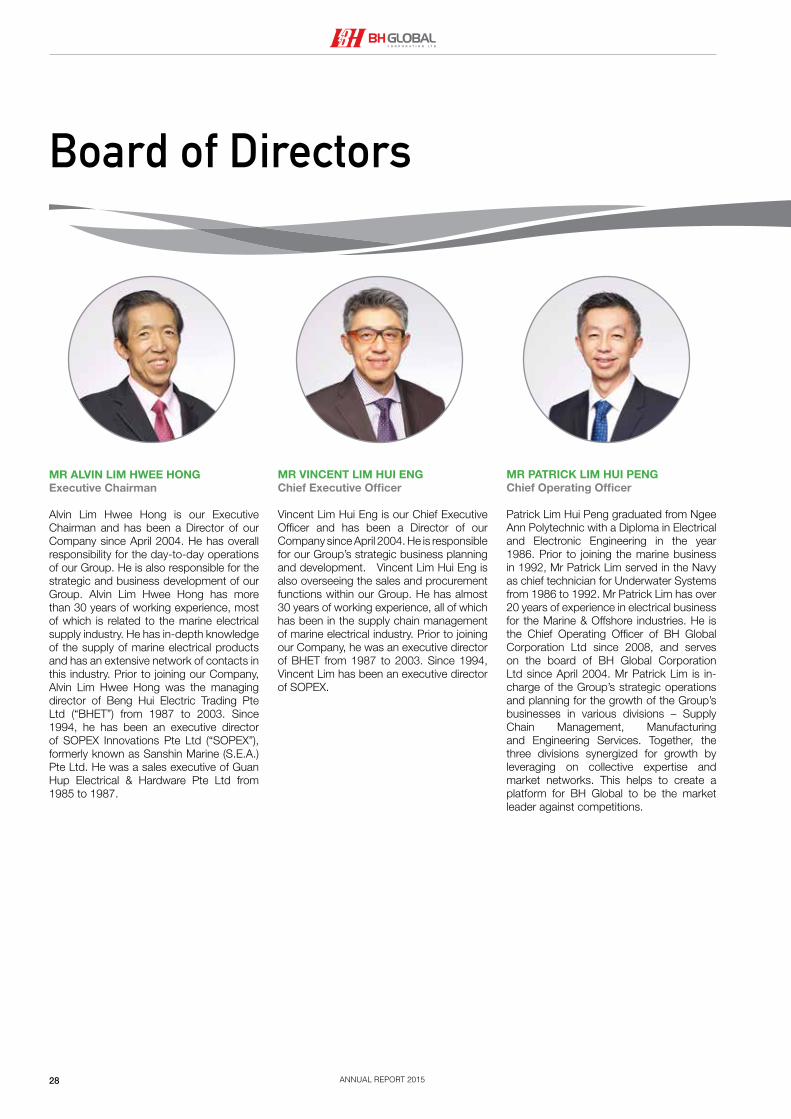
Board of Directors
MR ALVIN LIM HWEE HONGExecutive Chairman
Alvin Lim Hwee Hong is our Executive Chairman and has been a Director of our Company since April 2004. He has overall responsibility for the day-to-day operations of our Group. He is also responsible for the strategic and business development of our Group. Alvin Lim Hwee Hong has more than 30 years of working experience, most of which is related to the marine electrical supply industry. He has in-depth knowledge of the supply of marine electrical products and has an extensive network of contacts in this industry. Prior to joining our Company, Alvin Lim Hwee Hong was the managing director of Beng Hui Electric Trading Pte Ltd (“BHET”) from 1987 to 2003. Since 1994, he has been an executive director of SOPEX Innovations Pte Ltd (“SOPEX”), formerly known as Sanshin Marine (S.E.A.) Pte Ltd. He was a sales executive of Guan Hup Electrical & Hardware Pte Ltd from 1985 to 1987.
MR VINCENT LIM HUI ENGChief Executive Officer
Vincent Lim Hui Eng is our Chief Executive Officer and has been a Director of our Company since April 2004. He is responsible for our Group’s strategic business planning and development. Vincent Lim Hui Eng is also overseeing the sales and procurement functions within our Group. He has almost 30 years of working experience, all of which has been in the supply chain management of marine electrical industry. Prior to joining our Company, he was an executive director of BHET from 1987 to 2003. Since 1994, Vincent Lim has been an executive director of SOPEX.
MR PATRICK LIM HUI PENGChief Operating Officer
Patrick Lim Hui Peng graduated from Ngee Ann Polytechnic with a Diploma in Electrical and Electronic Engineering in the year 1986. Prior to joining the marine business in 1992, Mr Patrick Lim served in the Navy as chief technician for Underwater Systems from 1986 to 1992. Mr Patrick Lim has over 20 years of experience in electrical business for the Marine & Offshore industries. He is the Chief Operating Officer of BH Global Corporation Ltd since 2008, and serves on the board of BH Global Corporation Ltd since April 2004. Mr Patrick Lim is in-charge of the Group’s strategic operations and planning for the growth of the Group’s businesses in various divisions – Supply Chain Management, Manufacturing and Engineering Services. Together, the three divisions synergized for growth by leveraging on collective expertise and market networks. This helps to create a platform for BH Global to be the market leader against competitions.
ANNUAL REPORT 2015 29
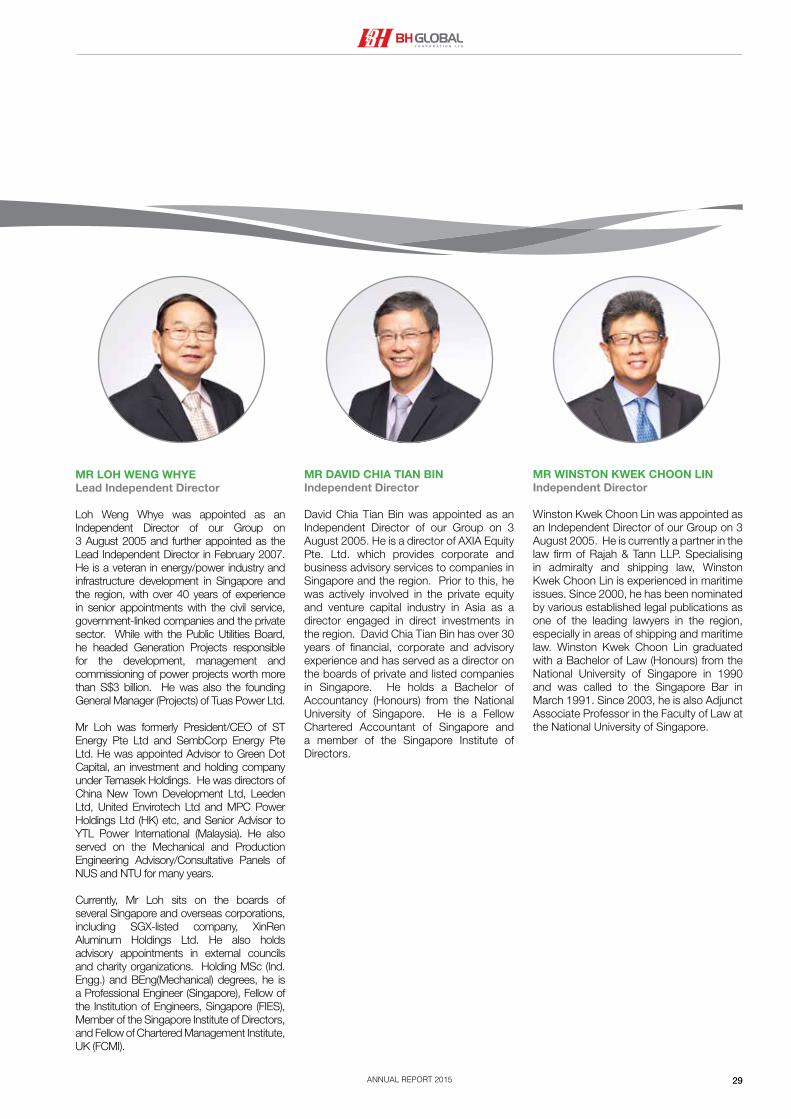
MR LOH WENG WHYELead Independent Director
Loh Weng Whye was appointed as an Independent Director of our Group on 3 August 2005 and further appointed as the Lead Independent Director in February 2007. He is a veteran in energy/power industry and infrastructure development in Singapore and the region, with over 40 years of experience in senior appointments with the civil service, government-linked companies and the private sector. While with the Public Utilities Board, he headed Generation Projects responsible for the development, management and commissioning of power projects worth more than S$3 billion. He was also the founding General Manager (Projects) of Tuas Power Ltd. Mr Loh was formerly President/CEO of ST Energy Pte Ltd and SembCorp Energy Pte Ltd. He was appointed Advisor to Green Dot Capital, an investment and holding company under Temasek Holdings. He was directors of China New Town Development Ltd, Leeden Ltd, United Envirotech Ltd and MPC Power Holdings Ltd (HK) etc, and Senior Advisor to YTL Power International (Malaysia). He also served on the Mechanical and Production Engineering Advisory/Consultative Panels of NUS and NTU for many years. Currently, Mr Loh sits on the boards of several Singapore and overseas corporations, including SGX-listed company, XinRen Aluminum Holdings Ltd. He also holds advisory appointments in external councils and charity organizations. Holding MSc (Ind. Engg.) and BEng(Mechanical) degrees, he is a Professional Engineer (Singapore), Fellow of the Institution of Engineers, Singapore (FIES), Member of the Singapore Institute of Directors, and Fellow of Chartered Management Institute, UK (FCMI).
MR DAVID CHIA TIAN BINIndependent Director
David Chia Tian Bin was appointed as an Independent Director of our Group on 3 August 2005. He is a director of AXIA Equity Pte. Ltd. which provides corporate and business advisory services to companies in Singapore and the region. Prior to this, he was actively involved in the private equity and venture capital industry in Asia as a director engaged in direct investments in the region. David Chia Tian Bin has over 30 years of financial, corporate and advisory experience and has served as a director on the boards of private and listed companies in Singapore. He holds a Bachelor of Accountancy (Honours) from the National University of Singapore. He is a Fellow Chartered Accountant of Singapore and a member of the Singapore Institute of Directors.
MR WINSTON KWEK CHOON LINIndependent Director
Winston Kwek Choon Lin was appointed as an Independent Director of our Group on 3 August 2005. He is currently a partner in the law firm of Rajah & Tann LLP. Specialising in admiralty and shipping law, Winston Kwek Choon Lin is experienced in maritime issues. Since 2000, he has been nominated by various established legal publications as one of the leading lawyers in the region, especially in areas of shipping and maritime law. Winston Kwek Choon Lin graduated with a Bachelor of Law (Honours) from the National University of Singapore in 1990 and was called to the Singapore Bar in March 1991. Since 2003, he is also Adjunct Associate Professor in the Faculty of Law at the National University of Singapore.
ANNUAL REPORT 201530
Key Management
MR JOHNNY LIM HUAY HUADirector, Logistics & Global Mobility - Import & Export Division
Johnny Lim Huay Hua is our Director of Operations since April 2004. He is responsible for managing the logistics and distribution functions within our Group. Johnny Lim Huay Hua has about 23 years of working experience, of which about 18 years is related to the marine electrical supply industry. Prior to joining our Company, he has been an executive director of BHET from 1993 to 2003. Since 1994, he was an executive director of SOPEX. In 1991, he was an employee of BHET in-charge of logistics.
MS EILEEN LIM CHYE HOONDirector, Corporate Administration & Human Resource
Eileen Lim Chye Hoon is our Director of Human Resource and Administration since April 2004. She is responsible for overseeing human resource and administration matters. Eileen Lim Chye Hoon has more than 28 years of working experience and has been in-charge of finance, personnel and administrative functions. Prior to joining our Company, she was an executive director of BHET from 1998 to 2003. From 1988 to 1998, she was an employee of BHET in-charge of accounting matters. She held the position of an accounts clerk of Guan Hup Electrical & Hardware Pte Ltd from 1982 to 1988.
MR KEEGAN CHUA TZE WEEChief Financial Officer
Keegan Chua Tze Wee is our Chief Financial Officer and is responsible for all aspects of financial planning, financial budgeting and control matters. Keegan Chua has 20 years of experience in accountancy, audit and finance. Prior to joining our Group in December 2006, he had assumed auditing, finance and accounting positions in various accounting firms and an SGX mainboard-listed company. Keegan Chua obtained his Bachelor of Accountancy (Honours) degree from The Nanyang Technological University in 1994 and is a member of the Institute of Singapore Chartered Accountants. In 2011, he was awarded the Best Chief Financial Officer of the year (companies with less than $300 million in market capitalization) at the Singapore Corporate Awards.
ANNUAL REPORT 2015 31
MR KEN SOH LEE MENGChief Information Officer
Ken Soh Lee Meng is our Chief Information Officer and was appointed in March 2014. Ken Soh is responsible for the group info-communication and technology (ICT) practices and technology based business development initiatives. Ken Soh has more than 23 years of working experiences in the ICT industry. Prior to joining BH Global, he held various senior positions including Chief Information Officer and Chief Data Officer of Temasek Polytechnic with enterprise-wide master planning and implementation responsibilities, Business Department Head and Director of Business Development in the Singapore Computer Systems Ltd and NCS Pte Ltd with P&L and operational responsibilities, Head of Corporate e-Banking Product Development (IT) in the Bank of Tokyo-Mitsubishi (Singapore), Project Lead and Consultant in IBM Singapore Pte Ltd. Ken holds a Master of Science in Computer Studies from the University of Essex, and a Master of Business Administration from the Nanyang Business School (a Nanyang Technological University and University of California, Berkeley joint program)
MR KEVIN MANSELLChief Executive OfficerGulf Specialty Steel Industries LLC
Kevin Mansell joined Gulf Specialty Steel Industries LLC in February 2015 as Chief Executive Officer. He has a degree in Metallurgy and Material Science from the University of Nottingham and has more than 20 years of experience in the steel wire industry, the last 13 in senior Managing Director roles in Europe and in Asia. He has a proven track record of improving operational performance, profitability and delivering growth. A large part of his experience has been with Bekaert, the largest steel wire company in the world, first of all in the UK where he was responsible for their manufacturing operations before being promoted to Managing Director. He then spent 5 years in India where he was the Managing Director and Country Manager for Bekaert during a period of rapid growth. For the last 2 years he has been the Managing Director of Caparo Wire where he was able to restructure the business and return it to profitability. At GSSI he is focusing on growing sales to fully utilise the capacity of the new plant in Oman while improving manufacturing effectiveness to maximise profitability and deliver value to their customers.

ANNUAL REPORT 201532
PURSUING NEWBOUNDARIES

ANNUAL REPORT 2015 33
ANNUAL REPORT 201534
Investor Relations
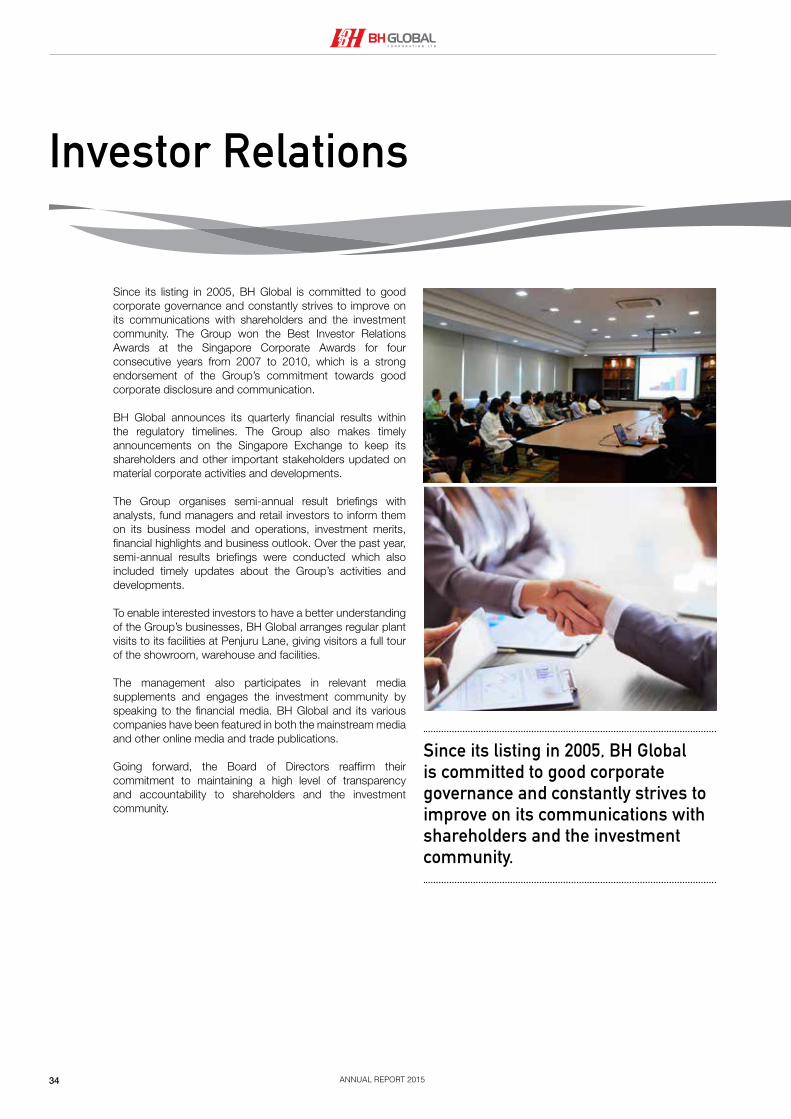
Since its listing in 2005, BH Global is committed to good corporate governance and constantly strives to improve on its communications with shareholders and the investment community. The Group won the Best Investor Relations Awards at the Singapore Corporate Awards for four consecutive years from 2007 to 2010, which is a strong endorsement of the Group’s commitment towards good corporate disclosure and communication.
BH Global announces its quarterly financial results within the regulatory timelines. The Group also makes timely announcements on the Singapore Exchange to keep its shareholders and other important stakeholders updated on material corporate activities and developments.
The Group organises semi-annual result briefings with analysts, fund managers and retail investors to inform them on its business model and operations, investment merits, financial highlights and business outlook. Over the past year, semi-annual results briefings were conducted which also included timely updates about the Group’s activities and developments.
To enable interested investors to have a better understanding of the Group’s businesses, BH Global arranges regular plant visits to its facilities at Penjuru Lane, giving visitors a full tour of the showroom, warehouse and facilities.
The management also participates in relevant media supplements and engages the investment community by speaking to the financial media. BH Global and its various companies have been featured in both the mainstream media and other online media and trade publications. Going forward, the Board of Directors reaffirm their commitment to maintaining a high level of transparency and accountability to shareholders and the investment community.
Since its listing in 2005, BH Global is committed to good corporate governance and constantly strives to improve on its communications with shareholders and the investment community.
ANNUAL REPORT 2015 35
Employees & Organisation
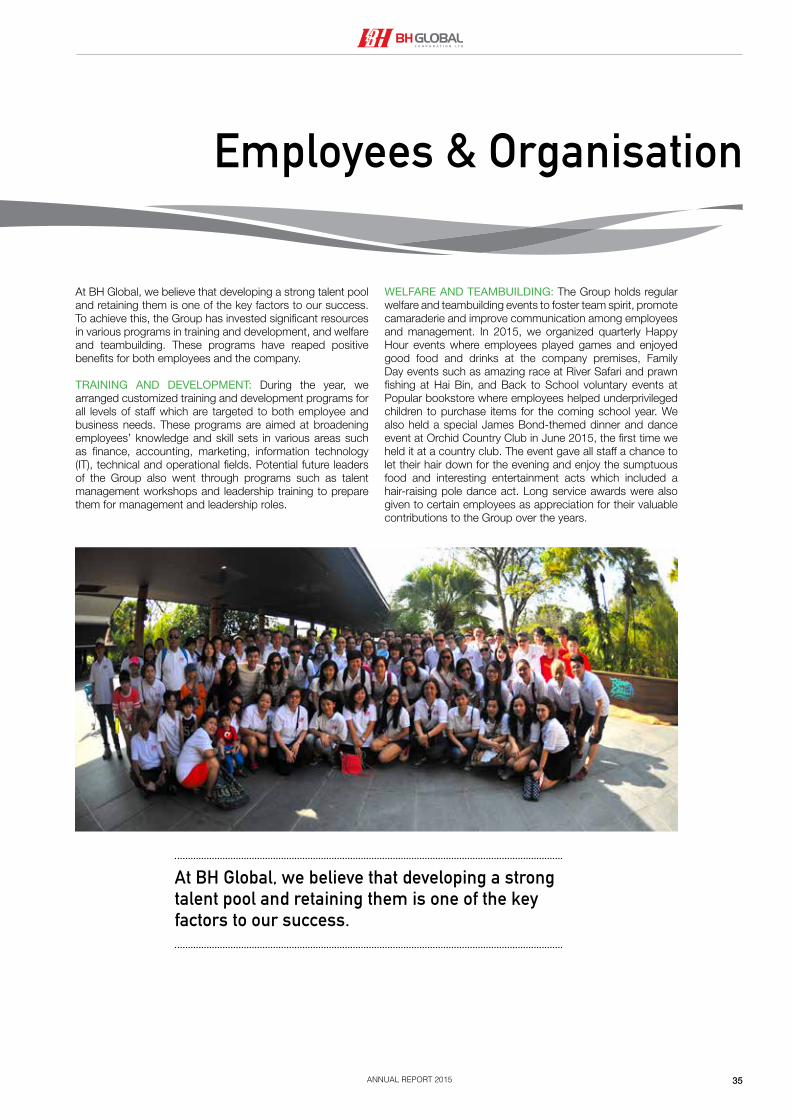
At BH Global, we believe that developing a strong talent pool and retaining them is one of the key factors to our success. To achieve this, the Group has invested significant resources in various programs in training and development, and welfare and teambuilding. These programs have reaped positive benefits for both employees and the company.
TRAINING AND DEVELOPMENT: During the year, we arranged customized training and development programs for all levels of staff which are targeted to both employee and business needs. These programs are aimed at broadening employees’ knowledge and skill sets in various areas such as finance, accounting, marketing, information technology (IT), technical and operational fields. Potential future leaders of the Group also went through programs such as talent management workshops and leadership training to prepare them for management and leadership roles.
WELFARE AND TEAMBUILDING: The Group holds regular welfare and teambuilding events to foster team spirit, promote camaraderie and improve communication among employees and management. In 2015, we organized quarterly Happy Hour events where employees played games and enjoyed good food and drinks at the company premises, Family Day events such as amazing race at River Safari and prawn fishing at Hai Bin, and Back to School voluntary events at Popular bookstore where employees helped underprivileged children to purchase items for the coming school year. We also held a special James Bond-themed dinner and dance event at Orchid Country Club in June 2015, the first time we held it at a country club. The event gave all staff a chance to let their hair down for the evening and enjoy the sumptuous food and interesting entertainment acts which included a hair-raising pole dance act. Long service awards were also given to certain employees as appreciation for their valuable contributions to the Group over the years.
At BH Global, we believe that developing a strong talent pool and retaining them is one of the key factors to our success.
ANNUAL REPORT 201536
Corporate Social Responsibility
CONTRIBUTIONS TO COMMUNITY
BH Global strongly believes in Corporate Social Responsibility (“CSR”) as we recognize the importance of building strong relationships with our stakeholders and supporting the communities that we operate in.
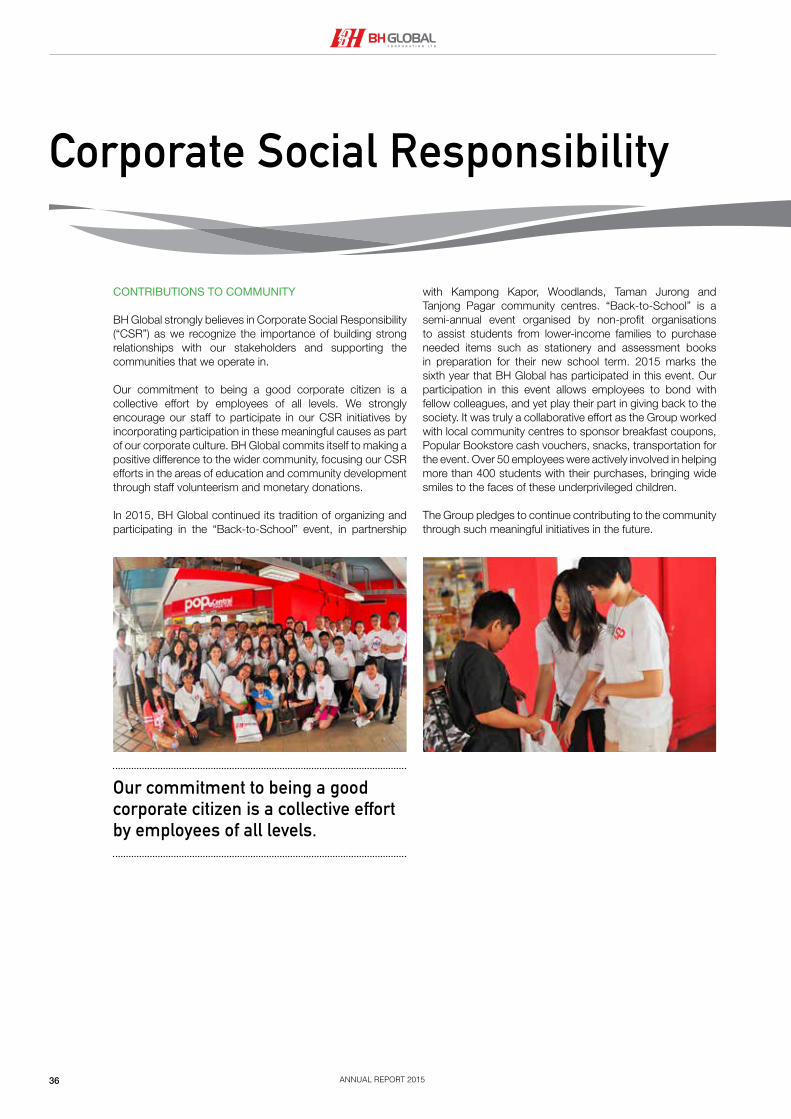
Our commitment to being a good corporate citizen is a collective effort by employees of all levels. We strongly encourage our staff to participate in our CSR initiatives by incorporating participation in these meaningful causes as part of our corporate culture. BH Global commits itself to making a positive difference to the wider community, focusing our CSR efforts in the areas of education and community development through staff volunteerism and monetary donations.
In 2015, BH Global continued its tradition of organizing and participating in the “Back-to-School” event, in partnership
with Kampong Kapor, Woodlands, Taman Jurong and Tanjong Pagar community centres. “Back-to-School” is a semi-annual event organised by non-profit organisations to assist students from lower-income families to purchase needed items such as stationery and assessment books in preparation for their new school term. 2015 marks the sixth year that BH Global has participated in this event. Our participation in this event allows employees to bond with fellow colleagues, and yet play their part in giving back to the society. It was truly a collaborative effort as the Group worked with local community centres to sponsor breakfast coupons, Popular Bookstore cash vouchers, snacks, transportation for the event. Over 50 employees were actively involved in helping more than 400 students with their purchases, bringing wide smiles to the faces of these underprivileged children.
The Group pledges to continue contributing to the community through such meaningful initiatives in the future.
Our commitment to being a good corporate citizen is a collective effort by employees of all levels.

ANNUAL REPORT 2015 37
Corporate Governance Report
The Group is committed to achieving and maintaining high standards of corporate governance. The Group has substantively complied with the recommendations of the revised Code of Corporate Governance 2012 (“Code”), issued on 2 May 2012, through effective self-regulatory corporate practices to protect and enhance the interests of its shareholders. This report describes the Group’s corporate governance processes and activities in conjunction with the Singapore Exchange Securities Trading Limited’s requirements that issuers describe its corporate governance practices with specific reference to the Code in its annual reports.
Principle 1: The Board’s conduct of Affairs
The Board’s principal functions are:
1. Approving the Group’s strategic plans, key operational initiatives, major investments and
divestments and funding requirements;
Guideline 1.1 of the Code: The Board’s
role
2. Reviewing the performance of the business and approving the release of the financial
results announcement of the Group to shareholders;
3. Providing guidance in the overall management of the business and affairs of the Group;
4. Overseeing the processes for internal control, risk management, financial reporting and
statutory compliance;
5. Approving the recommended framework of remuneration for the Board and key
executives as may be recommended by the Remuneration Committee; and
6. Considering sustainability issues such as environmental and social factors.
The Board has delegated certain specific responsibilities to four (4) board committees, namely,
the Audit Committee (“AC”), Nomination Committee (“NC”), Remuneration Committee (“RC”)
and Risk Management Committee (“RMC”). More information on these committees is set out
below. The Board accepts that while these board committees have the authority to examine
particular issues and will report to the Board their decisions and recommendations, the ultimate
responsibility for the final decision on all matters lies with the entire Board.
Guideline 1.3 of the Code: Disclosure
on delegation of authority by Board to
Board Committees
The Board meets at least four (4) times in a year. The frequency of meetings and the attendance
of each Director at every board and board committee meeting are disclosed on page 50 in
this Report. Informal meetings are regularly held to discuss and update on corporate and
commercial matters. Article 110 of the Company’s Constitution allows for participation in board
meetings by means of telephone conference or any other similar communications equipment.
Guideline 1.4 of the Code: Board to
meet regularly
Matters which are specifically reserved for decision by the Board include those involving
business plans, material acquisitions and disposals of assets, corporate or financial structuring,
corporate strategy, share issuances, dividends, communications with regulatory authorities
and shareholder matters.
Guideline 1.5 of the Code: Matters
requiring Board approval
All Directors are regularly updated by Management and the Corporate Secretary on the industry,
business, operations and corporate governance practices of the Group. The Company will,
from time to time, invite Directors to attend seminars and briefing sessions to keep pace
with financial, corporate governance, regulatory and other changes. All Directors are members
of the Singapore Institute of Directors (“SID”), and eligible to receive updates and training
from SID. Directors and Senior Management are encouraged to attend relevant courses and
subscribe for journal updates on matters of topical interest.
Guideline 1.6 of the Code: Directors to
receive appropriate training
ANNUAL REPORT 201538
Corporate Governance Report (cont’d)
A formal letter is provided to each Executive Director upon his appointment, setting out the
Director’s duties and obligations. No formal letters are issued to non-executive Directors as
their duties and obligations are governed by prevailing law, codes and regulations.
Guideline 1.7 of the Code: Formal letter
to be provided to directors setting out
duties and obligations
Principle 2: Board Composition and Guidance
The Board currently comprises six (6) Directors of whom three (3) are non-executive and
independent Directors. The Board is supported by various board committees, namely, the NC,
AC, RC and RMC whose functions are described below. The non-executive directors have
been able to exercise objective judgement independently from Management and substantial
shareholders and no individual or small group of individuals dominate the decisions of the Board.
Guideline 2.1 and 2.2 of the Code: At
least half of directors to be independent
where the Chairman and CEO are
immediate family members
The Board considers an independent director as one that has no significant relationship with
the Company, its related corporations, its substantial shareholders or its officers that could
interfere, or be reasonably perceived to interfere, with the exercise of the director’s independent
business judgement with a view to the best interests of the Company. Under this definition, half
of the Board is considered independent.
Guideline 2.3 of the Code: Definition of
independent director
All three non-executive Directors have served on the Board beyond nine years from the date
of their first appointment on 3 August 2014. The Board, having reviewed the independence of
these Directors and further taking into account the deliberations of the NC, is of the view that
all three non-executive Directors are able to exercise independent and objective judgement
considering also that there are no relationships or circumstances which may affect their
judgement and ability to discharge their duties and responsibilities as independent directors.
Guideline 2.4 of the Code: Any director
who has served more than 9 years
should be subject to rigorous review
The Board is of the opinion that, given the scope and nature of the Group’s operations, the
present size of the Board is appropriate for effective decision making. The Board is made
up of Directors who are qualified and experienced in various fields including business and
management, accounting and finance, engineering and industry, and law. The profiles of each
of the Directors are provided in pages 28 and 29 of this Annual Report. Accordingly, the current
Board comprises persons who as a group, have core competencies necessary to lead and
oversee the Company.
Guideline 2.5 and 2.6 of the Code:
Board to determine its appropriate
size and comprise directors with core
competencies
The current Board composition provides a diversity of knowledge and experience to the Company as follows:-
Balance and Diversity of the Board
Core Competencies Number of Directors Proportion of Board
Accounting or finance 2 33%
Business management 4 67%
Legal or corporate governance 3 50%
Relevant industry knowledge or experience 4 67%
Strategic planning experience 4 67%
Customer based experience or knowledge 3 50%
Gender
Male 6 100%
Female 0 -
ANNUAL REPORT 2015 39
Corporate Governance Report (cont’d)
The non-executive Directors are also involved in reviewing the corporate strategies, business
operations and practices of the Group, as well as reviewing and monitoring the performance of
Management in achieving agreed goals and objectives. The non-executive Directors do confer
with the external auditors at least once a year and whenever necessary to discuss issues
without the presence of Management.
Guideline 2.7 and 2.8 of the Code: Role
of NEDs and regular meetings of NEDs.
As at 31 December 2015, the Board comprises the following members:
Name of Director
Position
held on the
Board
Date of first
appointment
to the Board
Date of last
re-election
as Director
Nature of
appointment
Alvin Lim Hwee Hong Chairman 23.04.2004 30.04.2013Executive/ Non-
independent
Vincent Lim Hui Eng Director 23.04.2004 15.04.2014Executive/ Non-
independent
Patrick Lim Hui Peng Director 23.04.2004 15.04.2015Executive/ Non-
independent
Loh Weng Whye
Lead
Independent
Director
03.08.2005 15.04.2015Non- executive/
Independent
David Chia Tian Bin Director 03.08.2005 30.04.2013Non- executive/
Independent
Winston Kwek Choon Lin Director 03.08.2005 15.04.2014Non- executive/
Independent
Principle 3: Chairman and Chief Executive Officer
Mr Alvin Lim Hwee Hong is the Executive Chairman of the Board and Mr Vincent Lim Hui Eng
is the Chief Executive Officer of the Company, effective since January 2008. Mr Alvin Lim Hwee
Hong and Mr Vincent Lim Hui Eng are siblings.
Guideline 3.1 of the Code: Chairman
and CEO should be separate persons
The roles and responsibilities of the Executive Chairman and Chief Executive Officer are
separate and defined.
The Executive Chairman will, amongst other responsibilities, lead the Board, ensure effective
communication with shareholders, encourage constructive relationship between the Board
and Management, as well as between Board members, and promote high standards of
corporate governance. The Chief Executive Officer manages the business of the Company
and implements the Board’s decisions.
Guideline 3.2 of the Code: Chairman’s
role
In view of the sibling relationship between the Executive Chairman and the Chief Executive
Officer, the Board has, since February 2007, appointed Mr Loh Weng Whye as the Lead
Independent Director. Non-executive and independent Directors comprise half of the number
of directors on the Board.
Guideline 3.3 of the Code: Appointment
of LID where Chairman and CEO are
immediate family members
ANNUAL REPORT 201540
Corporate Governance Report (cont’d)
Principle 4: Board Membership Principle 5: Board Performance
The NC comprises the following Directors:-
Mr Winston Kwek Choon Lin (Chairman)
Mr Loh Weng Whye (Member)
Mr Vincent Lim Hui Eng (Member)
Guideline 4.1 of the Code: NC to
comprise at least three directors,
majority of whom are independent,
including the Chairman. The lead
independent director should be a
member
Save for Mr Vincent Lim Hui Eng, the other members of the NC are non-executive and
independent Directors.
The NC’s key terms of reference, describing its responsibilities, include:-
(a) Reviewing and recommending the appointment and re-appointment of the Directors
having regard to the Director’s contribution and performance, including attendance,
preparedness and participation;
(b) Determining on an annual basis whether or not a Director is independent in accordance
to the Code;
(c) Reviewing the training and professional development programs for the Board;
(d) Reviewing a Director’s multiple board representations on various companies and
deciding whether or not such Director is able to and has been adequately carrying out
his duties as Director; and
(e) Deciding on how the Board’s performance is to be evaluated and proposing objective
performance criteria, subject to the approval by the Board.
Guideline 4.2 of the Code: NC to make
recommendations to the Board
The independence of each Director has been reviewed annually by the NC based on the
Code’s definition of what constitutes an independent director. Based on this review, the NC
has confirmed the independence of the Directors concerned.
Guideline 4.3 of the Code: NC to
determine directors’ independence
annually
The NC is of the view that the Directors are able to and have adequately carried out their duties
as Directors of the Company. As Board meetings are planned and scheduled well in advance
of the meeting dates, Directors have been able to attend all of the Board and Committee
meetings. The NC is also of the view that Directors with multiple board representations and
other substantive commitments, have ensured that sufficient time and attention are given to
the affairs of the Group. As a director’s ability to commit time to the Group’s affair is essential
for his contribution and performance, the NC has determined that the maximum number of
listed company board representations which each of the Director of the Company may hold is
five (5) and all Directors have complied with the set limit.
Guideline 4.4 of the Code: NC to
decide if a director is able to and has
been adequately carrying out his duties
as a director.
The Board does not encourage approving the appointment of alternate directors except in
exceptional cases. If an alternate director is appointed, the alternate director should be familiar
with the Group’s affairs and be appropriately qualified.
Guideline 4.5 of the Code: Appointment
of alternate directors
ANNUAL REPORT 2015 41
Corporate Governance Report (cont’d)
Pursuant to the Constitution of the Company:¬
(a) one third of the Directors shall retire from office at the Annual General Meeting;
(b) Directors appointed during the course of the year will submit themselves for re-election
at the next Annual General Meeting of the Company; and
(c) the Chief Executive Officer shall be subjected to retirement and re-election by
shareholders.
The NC selects and recommends the appointment and re-appointment of new directors to
the Board after assessing the candidates’ qualifications, attributes and past experience. The
candidates’ independence, expertise, background and skills will also be considered before the
NC interviews the shortlisted candidates and makes its recommendations to the Board. This is
to ensure a balanced board and to improve its overall effectiveness.
Guideline 4.6 of the Code: Process
for selection, appointment and re-
appointment of new directors.
Key information of each director is set out on pages 28 to 29. Guideline 4.7 of the Code: Key
information regarding directors
The NC has adopted guidelines for annual assessment of the effectiveness of the Board as
a whole and its Board Committees and of the contribution of each individual director to the
effectiveness of the Board and has performed the necessary assessment for the financial year.
Guideline 5.1 of the
Code: Assessment of the Board and its
board committees
Principle 6: Access to Information
With few exceptions, the Board is provided with adequate and timely information prior to
Board meetings and on an on-going basis and Board papers are distributed in advance of
each meeting to Directors. The Company circulates copies of the minutes of the meetings
of all board committees to all members of the Board to keep them informed of on-going
developments within the Group.
Guideline 6.1 and 6.2 of the Code:
Management obliged to provide Board
with adequate and timely information
and include board papers and related
materials, background and explanatory
information
The Directors have separate and independent access to the Company’s Senior Management
and the Company Secretary at all times. Should the Directors, whether as a group or individually,
require independent professional advice, such professionals (who will be selected with the
approval of the Board Chairman or the Chairman of the Committee requiring such advice) will
be appointed at the Company’s expense.
Guideline 6.3 and 6.5 of the Code:
Directors to have access to Company
Secretary; role of Company Secretary
to be clearly defined and procedure for
Board to take independent professional
advice at company’s expense.
The Company Secretary attends the Company’s Board, AC, RC and NC meetings and is
responsible for ensuring that Board procedures are followed. The Company Secretary’s
role is also to advise the Board on governance matters and to assist the Board and Senior
Management in ensuring that the Company complies with rules and regulations which are
applicable to the Company.
ANNUAL REPORT 201542
Corporate Governance Report (cont’d)
BOARD COMMITTEES
Principle 7: Remuneration Matters / Procedures for Developing Remuneration Policies
The RC comprises entirely of non-executive Directors, all of whom, including the Chairman,
are independent:
Mr Loh Weng Whye (Chairman)
Mr David Chia Tian Bin (Member)
Mr Winston Kwek Choon Lin (Member)
Guidelines 7.1, 7.2 and 7.3 of the Code:
RC to consist entirely of NEDs; majority
of whom, including RC Chairman, must
be independent & RC to recommend
remuneration of directors and CEO,
and to review remuneration of key
management personnel and to seek
expert advice, if necessary
The RC’s key terms of reference, describing its responsibilities, include:-
(a) To recommend to the Board all matters relating to remuneration, including but not limited
to directors’ fees, salaries, allowances, bonuses and benefits-in-kind, of the Directors
and key management personnel;
(b) To review and ensure that the level and structure of remuneration of the Directors and
key management personnel should be aligned with the long-term interest and risk
policies of the Company;
(c) To structure a significant and appropriate proportion of executive directors’ and
key management personnel’s remuneration so as to link rewards to corporate and
individual performances. Such remuneration should also be aligned with the interests of
shareholders and promote the long-term success of the Company; and
(d) To review and ensure that the remuneration of non-executive directors should be
appropriate to the level of contribution, taking into account factors such as effort and
time spent and responsibilities of the directors and they should not be over-compensated
to the extent that their independence may be compromised.
The RC is responsible for ensuring a formal and transparent procedure for developing an
appropriate executive remuneration policy and a competitive framework. The RC has
recommended to the Board a framework of remuneration which covers various aspects of
remuneration, including but not limited to, directors’ fees, salaries, allowances, bonuses, and
benefits-in-kind, and the specific remuneration packages for each executive director in order
to retain and motivate each of them to run the business and operations successfully. External
consultants’ advice will be sought, where necessary, when a major remuneration review is
conducted.

ANNUAL REPORT 2015 43
Corporate Governance Report (cont’d)
Principle 8: Level and Mix of Remuneration
In recommending a remuneration framework, the RC takes into account the performance of
the Group as well as the directors and key executives, aligning their interests with those of
shareholders and linking rewards to corporate and individual performance as well as industry
benchmarks. The review of remuneration packages takes into consideration the longer
term interests of the Group. It covers various aspects of remuneration including salaries,
fees, allowances, bonuses, perks and benefits-in-kind. The Committee’s recommendations
are based on Management’s reports and recommendations, made in consultation with the
Chairman of the Board and submitted for endorsement to the entire Board.
Guideline 8.1 of the Code: Align
remuneration with corporate and
individual performance and interests of
shareholders and promote long term
success of the Company
The payment of directors’ fees is subject to the approval of shareholders. Factors such as level
of contribution, effort and time spent, and responsibilities of the non-executive Directors are
considered when determining the level of their fees.
Guideline 8.3 of the Code: Remunera-
tion of NEDs should be appropriate,
taking into account their contribution,
effort, time spent and responsibilities
The RC is of the view that the variable components of remuneration (including bonus and profit
sharing) of the Executive Directors and the key management personnel were commensurate
with performance in FY2015. In addition, the Company is entitled to reclaim, in full or in part,
any profit-sharing paid to the Executive Directors under circumstances of misstatement of
financial statements or misconduct of the Executive Directors, directly or indirectly, resulting in
financial losses to the Company, as may be determined by the Board.
Guideline 8.4 of the Code: Contractual
provision to reclaim back incentives from
executive directors and key manage-
ment in exceptional circumstances of
misstatement of financial results, or of
misconduct resulting in financial loss to
the Company
New service contracts for the Executive Chairman, Chief Executive Officer and Chief Operating
Officer for a fixed period of two years were established after a major review conducted in late
2008 by the RC with consultation from external consultants on the original executive Directors’
service contracts disclosed in the IPO Prospectus. The new service agreements were put into
effect from 1 January 2009. The Board extended their service contracts until 31 December
2011 while a review was being conducted by the RC. Subsequently, on 1 January 2012,
after completion of the review, the Company entered into new 2-year service contracts with
the Executive Chairman, Chief Executive Officer and Chief Operating Officer. The contracts
have expired since 31 December 2013 and on 1 January 2014, new 2-year service contracts
were entered into which expired on 31 December 2015. Subsequently, the RC, after due
deliberation, entered into the current 2-year service contracts with the Executive Chairman,
Chief Executive Officer and Chief Operating Officer on 1 January 2016. As stipulated in the
current service contracts, the RC is responsible for reviewing the compensation commitments
in the event of an early termination.
Management has briefed the RC regarding its annual assessments on the performance of
members of senior management and their remuneration packages as proposed, and having
reviewed the matter, the RC has recommended these to the Board for approval.
RC also reviewed the proposed bonus/incentives for the executive Directors and members of
senior management. Bonuses, if any, for the executive Directors are calculated based on profit
performance as stipulated in their respective service contracts.
ANNUAL REPORT 201544
Corporate Governance Report (cont’d)
Principle 9: Disclosure on Remuneration
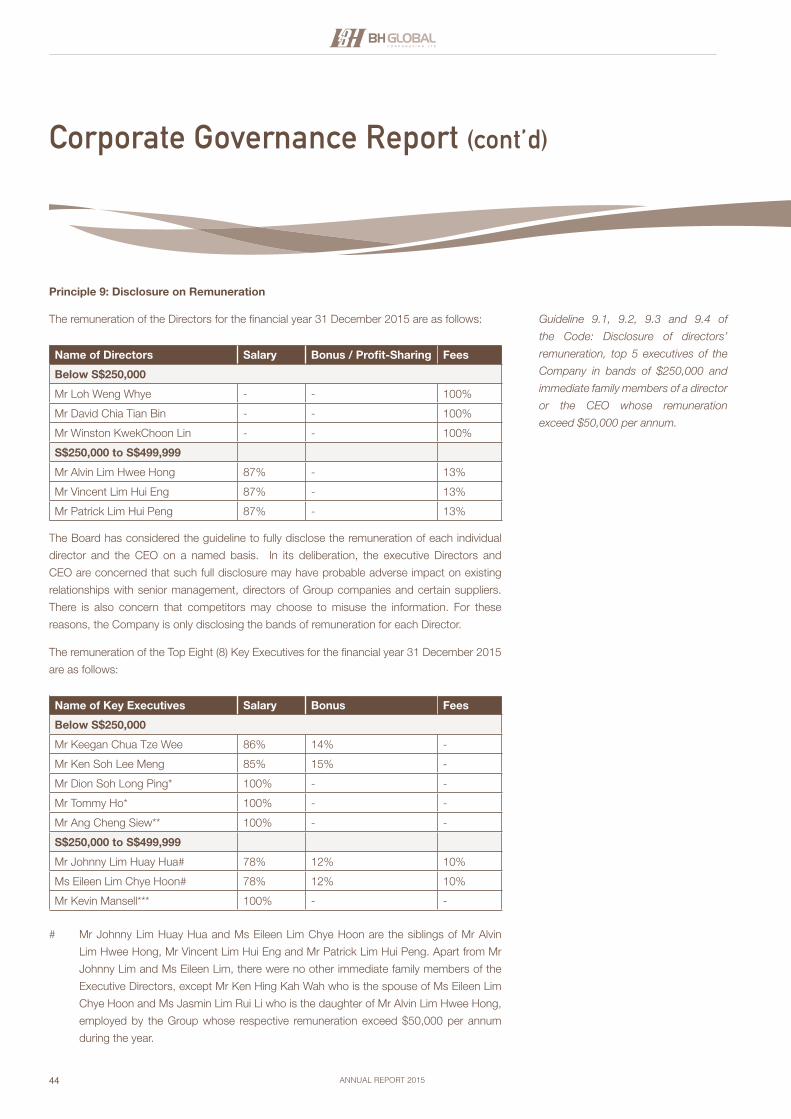
The remuneration of the Directors for the financial year 31 December 2015 are as follows:
Name of Directors Salary Bonus / Profit-Sharing Fees
Below S$250,000
Mr Loh Weng Whye - - 100%
Mr David Chia Tian Bin - - 100%
Mr Winston KwekChoon Lin - - 100%
S$250,000 to S$499,999
Mr Alvin Lim Hwee Hong 87% - 13%
Mr Vincent Lim Hui Eng 87% - 13%
Mr Patrick Lim Hui Peng 87% - 13%
The Board has considered the guideline to fully disclose the remuneration of each individual
director and the CEO on a named basis. In its deliberation, the executive Directors and
CEO are concerned that such full disclosure may have probable adverse impact on existing
relationships with senior management, directors of Group companies and certain suppliers.
There is also concern that competitors may choose to misuse the information. For these
reasons, the Company is only disclosing the bands of remuneration for each Director.
Guideline 9.1, 9.2, 9.3 and 9.4 of
the Code: Disclosure of directors’
remuneration, top 5 executives of the
Company in bands of $250,000 and
immediate family members of a director
or the CEO whose remuneration
exceed $50,000 per annum.
The remuneration of the Top Eight (8) Key Executives for the financial year 31 December 2015
are as follows:
Name of Key Executives Salary Bonus Fees
Below S$250,000
Mr Keegan Chua Tze Wee 86% 14% -
Mr Ken Soh Lee Meng 85% 15% -
Mr Dion Soh Long Ping* 100% - -
Mr Tommy Ho* 100% - -
Mr Ang Cheng Siew** 100% - -
S$250,000 to S$499,999
Mr Johnny Lim Huay Hua# 78% 12% 10%
Ms Eileen Lim Chye Hoon# 78% 12% 10%
Mr Kevin Mansell*** 100% - -
# Mr Johnny Lim Huay Hua and Ms Eileen Lim Chye Hoon are the siblings of Mr Alvin
Lim Hwee Hong, Mr Vincent Lim Hui Eng and Mr Patrick Lim Hui Peng. Apart from Mr
Johnny Lim and Ms Eileen Lim, there were no other immediate family members of the
Executive Directors, except Mr Ken Hing Kah Wah who is the spouse of Ms Eileen Lim
Chye Hoon and Ms Jasmin Lim Rui Li who is the daughter of Mr Alvin Lim Hwee Hong,
employed by the Group whose respective remuneration exceed $50,000 per annum
during the year.
ANNUAL REPORT 2015 45
Corporate Governance Report (cont’d)
* Mr Dion Soh Long Ping and Mr Tommy Ho have stepped down following the liquidation
of Oil & Gas Solutions Pte Ltd on 4 September 2015.
** Mr Ang Cheng Siew is the Managing Director of Z-Power Automation Pte Ltd, the
Group’s 60% owned subsidiary, which was disposed on 4 March 2015.
*** Mr Kevin Mansell was appointed CEO of Gulf Specialty Steel Industries LLC on 1
February 2015.
The aggregate amount of the total remuneration paid to the Key Executives (who are not
Directors or CEO) is $1,656,652 in FY 2015.
The Company has adopted a remuneration policy for staff comprising a fixed (basic salary)
and variable (bonus) components. The variable component is linked to the performance of the
Company and individual.
Guideline 9.6 of the Code: Disclosure
on link between remuneration and
performance.
Principle 10: Accountability of the Board and Audit
The Board is responsible for providing a balanced and understandable assessment of the
Company’s performance, position and prospects, including interim and other price sensitive
reports.
The Board ensures by confirming with Management and the external auditors that the financial
statements are prepared according to applicable accounting policies and accounting standards
as well as comply with other legislative and regulatory requirements.
Guideline 10.1, 10.2 & 10.3 of the
Code: Board’s responsibility to provide
balanced, understandable assessment
of Company’s performance and
position on interim basis and
management accounts.
Principle 11: Risk Management and Internal controls
The Audit Committee (AC) and Risk Management Committee (RMC) assist the Board in the
oversight of risk management responsibilities, internal controls and governance processes.
The AC, with the assistance of the Internal Auditor (“IA”), periodically reviews the effectiveness
of the Group’s internal controls relating to finance, operational, compliance and information
technology controls.
Risk Management
The Board has set up the RMC in 2010 which comprises:
Mr. Alvin Lim Hwee Hong (Executive Chairman)
Mr. Vincent Lim Hui Eng (Chief Executive Officer)
Mr. Keegan Chua Tze Wee (Chief Financial Officer)
The RMC is chaired by the Executive Chairman Mr. Alvin Lim Hwee Hong.
ANNUAL REPORT 201546
Corporate Governance Report (cont’d)
The main objective of the RMC is to assist the Board and AC to review and implement best
corporate governance practices, with reference to compliance, enterprise risk management
and internal controls. The primary responsibilities of the RMC include:
• Identifying, assessing, and managing the Group’s risk including managing the Group’s
enterprise risk programme;
• Reviewing the effectiveness of internal controls and to implement changes where
required;
• Ensuring compliance with statutory, regulatory requirements and the Group’s policies
and procedures; and
• Promoting awareness of the importance of risk management within the Group
Guideline 11.1 and 11.2 of the Code:
Board to review adequacy of financial,
operational and compliance controls
and risk management policies and
Board to comment on the adequacy of
the internal controls
The Group has implemented an Enterprise Risk Management System. An Enterprise Risk
Assessment (ERA) has been carried out to form a “Risk Map” of the high priority business risks.
Based on the Risk Map, measures were taken to address and monitor the top business risks.
Based on the Enterprise Risk Assessment, the Board is satisfied with the risk management
process in place, and in its opinion, that the effectiveness and adequacy of the controls have
been appropriately reviewed through the management and independent assurance provided
by the Group’s internal and external auditors.
Internal Controls
During the year, IA (refer to Principle 13) worked closely with Management to align its related
companies to the Group’s internal control environment and compliance standards in order to
strengthen the internal checks and balances.
The IA conducted periodic audits of its related companies and to review their key operations
and business practices to ensure compliance with the Group’s system of internal controls.
Significant control issues were highlighted with recommendations provided by IA and remedial
action were taken by Management. A Control Self-Assessment review was conducted to
assist the Board and Management obtain assurance on the adequacy and effectiveness of the
system of internal controls during the year.
Based on the results of the Enterprise Risk Assessment and findings on the risks and system
of internal controls made by both external and internal auditors as well as the Control Self-
Assessment review, the Board, with the concurrence of the AC, is generally satisfied that the
risk management and system of internal controls and procedures are adequate and effective in
achieving its objectives and addressing financial, operational and compliance and information
technology control risks.
ANNUAL REPORT 2015 47
Corporate Governance Report (cont’d)
The Board has received assurance from the Chief Executive Officer and Chief Financial Officer:-
(a) that the financial records have been properly maintained and the financial statements
give a true and fair view of the Group’s operations and finances; and
(b) the Group’s risk management and internal control systems were adequate and operating
effectively.
Guideline 11.3 of the Code:
Board to receive assurance from CEO
and CFO
Principle 12: Audit Committee
The AC comprises:
Mr David Chia Tian Bin (Chairman)
Mr Loh Weng Whye (Member)
Mr Winston Kwek Choon Lin (Member)
The AC members are all non-executive and independent Directors capable of discharging
their responsibilities appropriately. The members collectively have many years of experience
in accounting and audit, business and financial management, law and engineering. The
Board considers that the members of the AC are appropriately qualified to discharge the
responsibilities of the AC.
Guideline 12.1 and 12.2 of the Code:
AC should comprise at least three
directors, all non-executives and
the majority of whom, including the
chairman, are independent and Board
to ensure AC members are qualified
The AC has explicit authority to investigate any matter within its terms of reference. It has full
access to and the co-operation of Management and the full discretion to invite any Director or
executive officer to attend its meetings, and has reasonable resources to enable it to discharge
its functions properly.
Guideline 12.3 of the Code: AC to have
explicit authority to investigate and
have full access to management and
reasonable resources
The AC’s scope of work is governed by written terms of reference. Specifically, the AC meets
on a periodic basis to perform the following functions:
(a) Assist the Board of Directors in the identification and monitoring of areas of significant
business risks with the help of internal and external auditors;
(b) Review the effectiveness of the financial and accounting control systems and
management of financial and business risks;
(c) Review compliance with the Listing Manual and the Code of Corporate Governance;
(d) Review with the external and internal auditors their respective audit plans, reports and
their evaluation of the Group’s system of risk management and internal controls;
(e) Recommend the appointment of auditors and to review the level of audit fees;
(f) Review the independence of the Company’s auditors on an annual basis;
(g) Review the adequacy of the internal audit function;
(h) Review the Group’s quarterly and annual reports and announcements before they are
submitted to the Board for approval;
(i) Review interested person transactions.
Guideline 12.4 of the Code: Duties of
AC
ANNUAL REPORT 201548
Corporate Governance Report (cont’d)
The AC has reviewed and is satisfied with the level of co-operation rendered by Management
to the external auditors. The AC is also of the view that the scope of audit, experience levels of
staff and quality of the audits are adequate. The AC also convened a meeting with the external
auditors without the presence of Management to discuss matters relating to the audits.
Guideline 12.5 of the Code: AC to meet
internal and external auditors, without
presence of management, annually.
The AC, having reviewed all non-audit services provided by the external auditors, are satisfied
that the nature and extent of such services would not affect the independence and objectivity
of the external auditors.
Guideline 12.6 of the Code: AC to
review independence of external
auditors annually.
Both the AC and Board have reviewed the appointment of different auditors for its subsidiaries
and/or significant associated and joint venture companies and are satisfied that the appointment
of different auditors would not compromise the standard and effectiveness of the audit of the
Company and the Group.
Accordingly, the Company has complied with Rules 712 and 716 of the Listing Rules of the
Singapore Exchange Securities Trading Limited.
Management has put in place a whistle-blowing policy duly endorsed by the AC and approved
by the Board where employees of the Group can access an external service provider to raise
concerns about possible improprieties in matters of financial management and reporting or
other matters. The policy encourages employees to identify themselves because appropriate
follow-up enquiry or investigation may not be possible unless the source of information is
identified. Concerns expressed anonymously will nevertheless be investigated, with due
consideration given to:
(a) The seriousness of the issue raised;
(b) The credibility of the concern; and
(c) The likelihood of verification against known sources.
Guideline 12.7 of the Code: AC to
review arrangements for staff to raise
possible improprieties to AC
The AC members take measures to keep abreast of changes of accounting standards and
issues which have a direct impact on financial statements through attending training and
seminars as well as receiving updates from the Group’s external auditors.
Guideline 12.8 of the Code: AC to
keep abreast of changes to accounting
standards and issues
Principle 13: Internal audit
The Group outsourced its internal audit function to JF Virtus Pte Ltd, an independent assurance
service provider (“IA”) which specialises in risk management and internal auditing. The IA
reports directly to the AC Chairman on audit matters, and to the Executive Chairman or Chief
Executive Officer on administrative matters. The AC is satisfied that the appointed IA meets
and has carried out its function according to the standards set by internationally recognised
professional bodies including the Standards for the Professional Practice of Internal Auditing
set by The Institute of Internal Auditors.
Guideline 13.1, 13.2,13.3 and 13.4 of
the Code: IA to report to AC chairman,
and CEO administratively and is
adequately resourced and staffed with
persons with relevant qualifications and
experience. The IA should carry out its
function according to the standards
set by nationally or internationally
recognised professional bodies.
ANNUAL REPORT 2015 49
Corporate Governance Report (cont’d)
The primary objective of the internal audit is to assure the AC and the Board that sound risk
management processes and controls are in place and operating effectively.
The AC is satisfied that the internal audit function is adequately resourced and comprehensively
covers the major activities within the Group.
Principle 14 and 15: Shareholder Rights and Responsibilities
(a) Shareholder rights
It is the Group’s intention to ensure that all shareholders are treated fairly and equitably to
ensure their ownership rights are met. Timely and transparent disclosure are made to ensure
all shareholders are informed of any changes in the Group or its business which would be likely
to materially affect the price or value of the Company’s shares.
Guideline 14.1 of the Code: All share-
holders are treated fairly and equitably
Shareholders are given the opportunity to attend and vote at general meetings. The rules,
including voting procedures, that govern general meetings of shareholders are also clearly
communicated.
Guideline 14.2 of the Code: Sharehold-
ers have opportunity to participate and
vote at general meetings
(b) Communications with Shareholders
The Company has appointed an investor relation consultant, Financial PR Pte Ltd to support
the Group in facilitating communication with shareholders and the investment community.
The Company also ensures that timely and adequate disclosure of information on matters of
material impact or significance relating to the Group are made to shareholders of the Company
through SGXNET and other information channels, in compliance with the requirements set out
in the Listing Manual of the Singapore Exchange Securities Trading Limited, with particular
reference to the Corporate Disclosure Policy set out therein
Guideline 15.1, 15.2, 15.3 and 15.4 of
the Code: Company to regularly convey
pertinent information on a timely basis
All quarterly and full year results announcements, annual reports, dividend declaration and
notice of book closure are announced via SGXNET or issued within the prescribed period
under Listing Manual.
The Group does not presently have a prescribed dividend policy.
An interim one-tier tax exempt dividend of 0.5 Singapore cent per share was declared and paid
for the financial year ended 31 December 2015.
Guideline 15.5 of the Code: Company
to have a dividends payment policy.
Where dividends are not paid,
Company should disclose its reasons.
Principle 16 : Conduct of Shareholder Meetings
At general meetings, shareholders of the Company will be given the opportunity to present
their views and to put questions regarding the Group to Directors and Management. The
Directors and Management will be present at these meetings to address any questions that
shareholders may have. The external auditors will also be present to assist the Board in
addressing queries by shareholders.
Guideline 16.1 and 16.3 of the Code:
Shareholders have the opportunity to
participate and vote at general meet-
ings. Committee chairman and external
auditors to be present at AGMs
ANNUAL REPORT 201550
Corporate Governance Report (cont’d)
Currently, the Constitution of the Company allows a member of the Company to appoint
up to two proxies to attend and vote at general meetings. Pursuant to Section 181 of the
Companies Act, Chapter 50 (the “Companies Act”), a member of the Company who is a
relevant intermediary is entitled to appoint more than two proxies to attend and vote in his
stead. “Relevant intermediary” has the meaning ascribed to it in Section 181 of the Companies
Act.
Guideline 16.4 and 16.5 of the Code:
Companies encouraged to amend
Constitution to avoid imposing limit
on number of proxies for nominee
companies
Separate resolutions on each distinct issue are tabled at general meetings and voting on each
resolution by poll is carried out systematically with proper recording of votes cast and the
resolution passed.
ATTENDANCE AT BOARD & COMMITTEE MEETINGS
The number of Directors’ and board committees’ meetings and the record of attendance of each Director during the financial year ended
31 December 2015 is set out below:
Types of Meetings Board Audit CommitteeNominating
Committee
Remuneration
Committee
Names of Directors
No. of
Meetings
Held
No. of
Meetings
Attended
No. of
Meetings
Held
No. of
Meetings
Attended
No. of
Meetings
Held
No. of
Meetings
Attended
No. of
Meetings
Held
No. of
Meetings
Attended
Alvin Lim Hwee Hong 4 4 - - - - - -
Vincent Lim Hui Eng 4 4 - - 2 2 - -
Patrick Lim Hui Peng 4 4 - - - - - -
Winston Kwek Choon Lin 4 4 4 4 2 2 2 2
Loh Weng Whye 4 4 4 4 2 2 2 2
David Chia Tian Bin 4 4 4 4 - - 2 2
ADDITIONAL INFORMATION
Dealings in Securities
The Company has procedures in place in line with Rule 1207(19) in relation to dealings in the Company’s securities by its officers. The
Company has informed its officers not to deal in the Company’s shares whilst they are in possession of unpublished material price
sensitive information and during the period commencing two weeks before quarterly announcement and one month before the full year
announcement, as the case may be, and ending on the date of announcement of such financial results. The Officers of the Company are
discouraged from dealing in the Company’s securities on a short-term basis.
ANNUAL REPORT 2015 51
Corporate Governance Report (cont’d)
Interested Person Transactions
The Company has set out the procedures for review and approval of the Company’s interested person transactions.
Disclosure according to Rule 907 of the SGX-ST Listing Manual in respect of interested person transactions for the financial year ended 31
December 2015 are stated in the table below:
Name of Interested
Persons
Aggregate value of all interested person
transactions during the financial year under review
(excluding transactions less than S$100,000 and
transactions conducted under shareholders’
mandate pursuant to Rule 920 of the Listing Manual)
Aggregate value of all interested
person transactions conducted under a
shareholders’ mandate pursuant to Rule
920 (excluding transactions less than
S$100,000)
Global Eduhub Pte Ltd(1)
Rental of office premises$124,290-(2) -
(1) subsidiary of the controlling shareholder of the Company, Beng Hui Holding (S) Pte Ltd, in which the Directors, Messrs Alvin Lim Hwee
Hong, Vincent Lim Hui Eng and Patrick Lim Hui Peng together with their family members hold an aggregate interest of 100%.
(2) The rental agreement is for 3 years and commenced in 2013. The total contract amount is $378,438 and $124,290 had been
charged during FY2015.
The Audit Committee and the Board of Directors have reviewed the transaction and were satisfied that the terms were fair and reasonable
and were not prejudicial to the interests of the Company and its minority shareholders.
Material Contracts
Save for the service contracts entered into between the executive Directors and the Company and the rental agreement with Global Eduhub
Pte Ltd as disclosed in this report, there were no other material contracts entered into by the Company or its subsidiaries, involving the
interests of the CEO or any director or controlling shareholder either subsisting at the end of the financial year or if not then subsisting, which
were entered into since the end of the previous financial year.
52
Directors’ Statement 53
Independent Auditor’s Report 57
Consolidated Income Statement 58
Consolidated Statement of Comprehensive Income 59
Statements of Financial Posit ion 60
Statements of Changes in Equity 62
Consolidated Statement of Cash Flows 65
Notes to the Financial Statements 67
FINANCIAL CONTENTS
53ANNUAL REPORT 2015
The directors present their statement to the members together with the audited consolidated financial statements of BH Global Corporation Limited (the “Company”) and its subsidiary corporations (collectively, the “Group”) and the statement of financial position and statement of changes in equity of the Company for the financial year ended 31 December 2015.
In the opinion of the directors:
(i) the consolidated financial statements of the Group and the statement of financial position and statement of changes in equity of the Company as set out on pages 58 to 133 are drawn up so as to give a true and fair view of the financial position of the Group and of the Company as at 31 December 2015 and of the financial performance, changes in equity and cash flows of the Group and changes in equity of the Company for the financial year then ended in accordance with the provisions of the Singapore Companies Act and Singapore Financial Reporting Standards; and
(ii) at the date of this statement, there are reasonable grounds to believe that the Company will be able to pay its debts as and when they fall due.
Directors
The directors in office at the date of this statement are:
Alvin Lim Hwee Hong (Executive Chairman)Vincent Lim Hui Eng (Executive Director and Chief Executive Officer)Patrick Lim Hui Peng (Executive Director and Chief Operating Officer)Loh Weng Whye (Lead Independent Non-executive)David Chia Tian Bin (Independent Non-executive)Winston Kwek Choon Lin (Independent Non-executive)
Arrangement to enable directors to acquire benefits
Neither at the end of nor at any time during the financial year was the Company a party to any arrangement whose objects are, or one of whose objects is, to enable the directors of the Company to acquire benefits by means of the acquisition of shares in or debentures of the Company or any other body corporate.
DIRECTORS’ STATEMENT
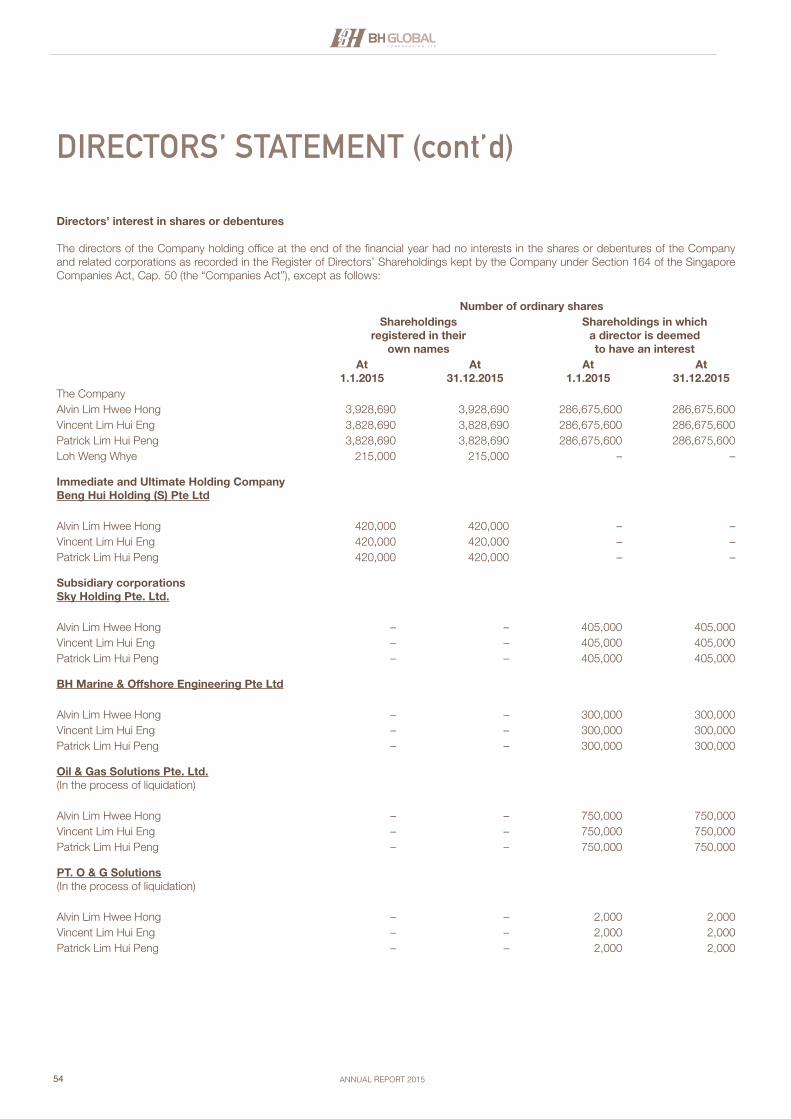
54 ANNUAL REPORT 2015
Directors’ interest in shares or debentures
The directors of the Company holding office at the end of the financial year had no interests in the shares or debentures of the Company and related corporations as recorded in the Register of Directors’ Shareholdings kept by the Company under Section 164 of the Singapore Companies Act, Cap. 50 (the “Companies Act”), except as follows:
Number of ordinary sharesShareholdings
registered in their own names
Shareholdings in which a director is deemed to have an interest
At1.1.2015
At31.12.2015
At1.1.2015
At31.12.2015
The CompanyAlvin Lim Hwee Hong 3,928,690 3,928,690 286,675,600 286,675,600Vincent Lim Hui Eng 3,828,690 3,828,690 286,675,600 286,675,600Patrick Lim Hui Peng 3,828,690 3,828,690 286,675,600 286,675,600Loh Weng Whye 215,000 215,000 – –
Immediate and Ultimate Holding CompanyBeng Hui Holding (S) Pte Ltd
Alvin Lim Hwee Hong 420,000 420,000 – –Vincent Lim Hui Eng 420,000 420,000 – –Patrick Lim Hui Peng 420,000 420,000 – –
Subsidiary corporationsSky Holding Pte. Ltd.
Alvin Lim Hwee Hong – – 405,000 405,000Vincent Lim Hui Eng – – 405,000 405,000Patrick Lim Hui Peng – – 405,000 405,000
BH Marine & Offshore Engineering Pte Ltd
Alvin Lim Hwee Hong – – 300,000 300,000Vincent Lim Hui Eng – – 300,000 300,000Patrick Lim Hui Peng – – 300,000 300,000
Oil & Gas Solutions Pte. Ltd.(In the process of liquidation)
Alvin Lim Hwee Hong – – 750,000 750,000Vincent Lim Hui Eng – – 750,000 750,000Patrick Lim Hui Peng – – 750,000 750,000
PT. O & G Solutions(In the process of liquidation)
Alvin Lim Hwee Hong – – 2,000 2,000Vincent Lim Hui Eng – – 2,000 2,000Patrick Lim Hui Peng – – 2,000 2,000
DIRECTORS’ STATEMENT (cont’d)
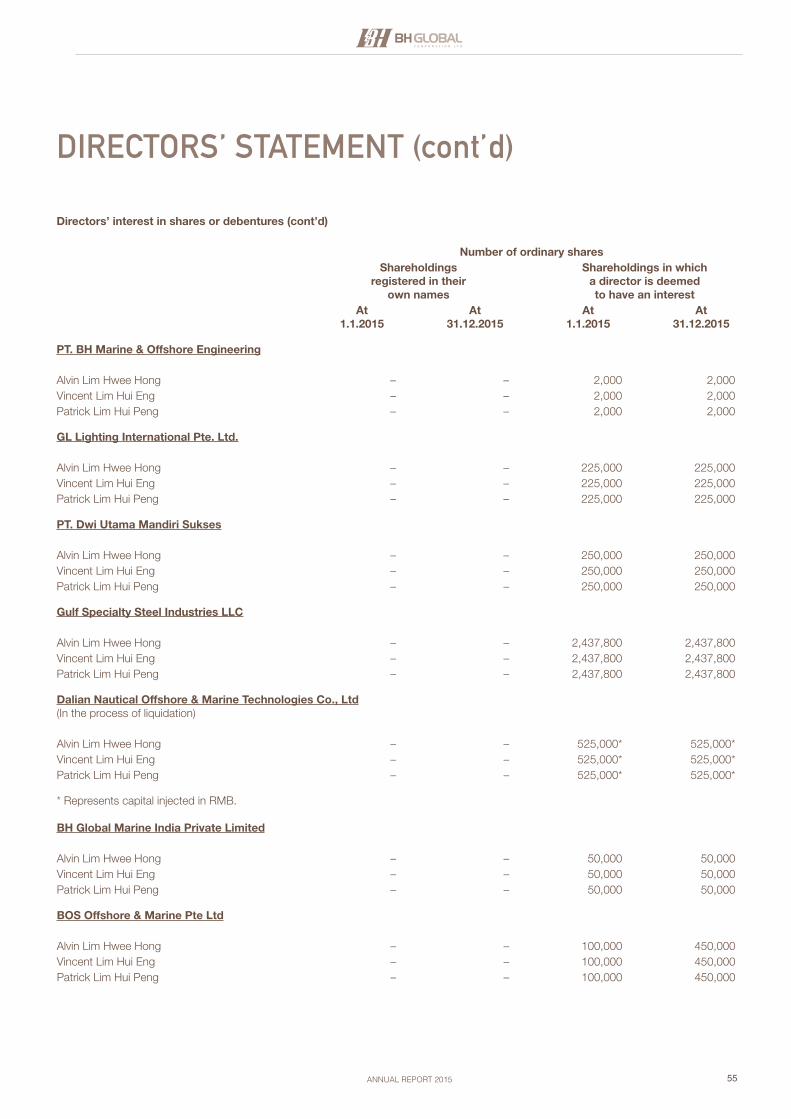
55ANNUAL REPORT 2015
Directors’ interest in shares or debentures (cont’d)
Number of ordinary sharesShareholdings
registered in their own names
Shareholdings in which a director is deemed to have an interest
At1.1.2015
At31.12.2015
At1.1.2015
At31.12.2015
PT. BH Marine & Offshore Engineering
Alvin Lim Hwee Hong – – 2,000 2,000Vincent Lim Hui Eng – – 2,000 2,000Patrick Lim Hui Peng – – 2,000 2,000
GL Lighting International Pte. Ltd.
Alvin Lim Hwee Hong – – 225,000 225,000Vincent Lim Hui Eng – – 225,000 225,000Patrick Lim Hui Peng – – 225,000 225,000
PT. Dwi Utama Mandiri Sukses
Alvin Lim Hwee Hong – – 250,000 250,000Vincent Lim Hui Eng – – 250,000 250,000Patrick Lim Hui Peng – – 250,000 250,000
Gulf Specialty Steel Industries LLC
Alvin Lim Hwee Hong – – 2,437,800 2,437,800Vincent Lim Hui Eng – – 2,437,800 2,437,800Patrick Lim Hui Peng – – 2,437,800 2,437,800
Dalian Nautical Offshore & Marine Technologies Co., Ltd(In the process of liquidation)
Alvin Lim Hwee Hong – – 525,000* 525,000*Vincent Lim Hui Eng – – 525,000* 525,000*Patrick Lim Hui Peng – – 525,000* 525,000*
* Represents capital injected in RMB.
BH Global Marine India Private Limited
Alvin Lim Hwee Hong – – 50,000 50,000Vincent Lim Hui Eng – – 50,000 50,000Patrick Lim Hui Peng – – 50,000 50,000
BOS Offshore & Marine Pte Ltd
Alvin Lim Hwee Hong – – 100,000 450,000Vincent Lim Hui Eng – – 100,000 450,000Patrick Lim Hui Peng – – 100,000 450,000
DIRECTORS’ STATEMENT (cont’d)
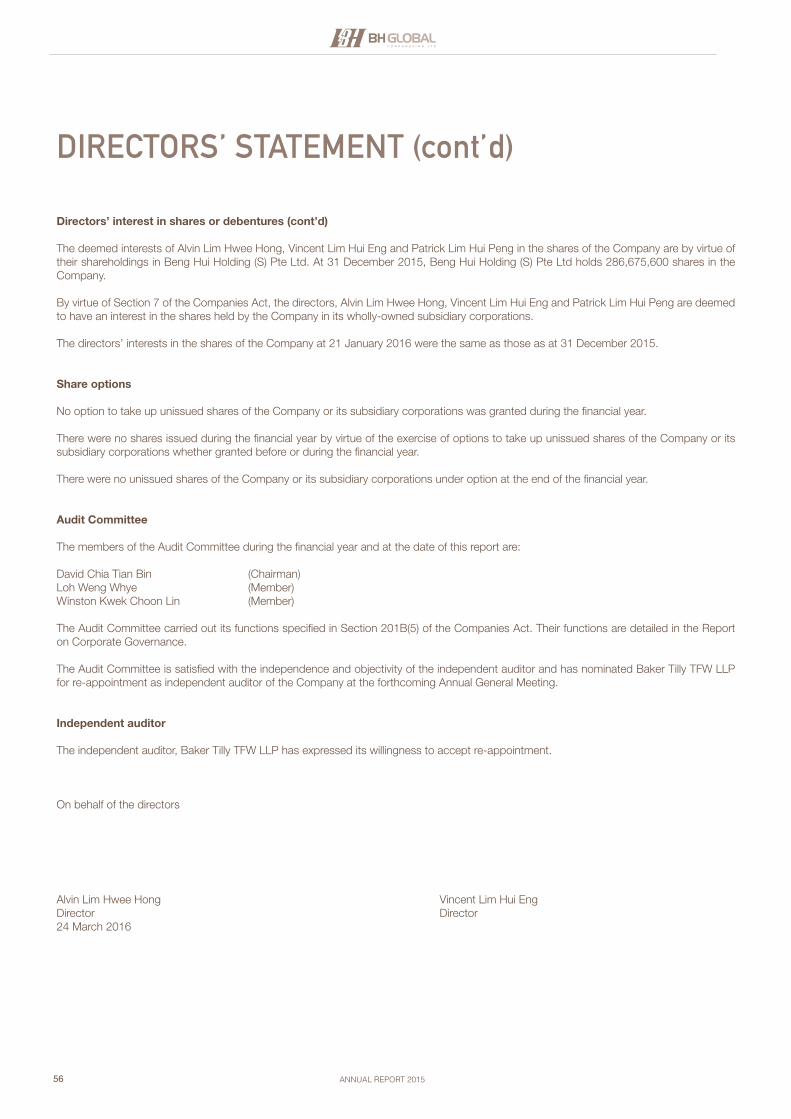
56 ANNUAL REPORT 2015
Directors’ interest in shares or debentures (cont’d)
The deemed interests of Alvin Lim Hwee Hong, Vincent Lim Hui Eng and Patrick Lim Hui Peng in the shares of the Company are by virtue of their shareholdings in Beng Hui Holding (S) Pte Ltd. At 31 December 2015, Beng Hui Holding (S) Pte Ltd holds 286,675,600 shares in the Company.
By virtue of Section 7 of the Companies Act, the directors, Alvin Lim Hwee Hong, Vincent Lim Hui Eng and Patrick Lim Hui Peng are deemed to have an interest in the shares held by the Company in its wholly-owned subsidiary corporations.
The directors’ interests in the shares of the Company at 21 January 2016 were the same as those as at 31 December 2015.
Share options
No option to take up unissued shares of the Company or its subsidiary corporations was granted during the financial year.
There were no shares issued during the financial year by virtue of the exercise of options to take up unissued shares of the Company or its subsidiary corporations whether granted before or during the financial year.
There were no unissued shares of the Company or its subsidiary corporations under option at the end of the financial year.
Audit Committee
The members of the Audit Committee during the financial year and at the date of this report are:
David Chia Tian Bin (Chairman)Loh Weng Whye (Member)Winston Kwek Choon Lin (Member)
The Audit Committee carried out its functions specified in Section 201B(5) of the Companies Act. Their functions are detailed in the Report on Corporate Governance.
The Audit Committee is satisfied with the independence and objectivity of the independent auditor and has nominated Baker Tilly TFW LLP for re-appointment as independent auditor of the Company at the forthcoming Annual General Meeting.
Independent auditor
The independent auditor, Baker Tilly TFW LLP has expressed its willingness to accept re-appointment.
On behalf of the directors
Alvin Lim Hwee Hong Vincent Lim Hui EngDirector Director24 March 2016
DIRECTORS’ STATEMENT (cont’d)

57ANNUAL REPORT 2015
Report on the Financial Statements
We have audited the accompanying financial statements of BH Global Corporation Limited (the “Company”) and its subsidiaries (the “Group”) as set out on pages 58 to 133, which comprise the statements of financial position of the Group and Company as at 31 December 2015, and the consolidated income statement, consolidated statement of comprehensive income, consolidated statement of changes in equity and consolidated statement of cash flows of the Group and statement of changes in equity of the Company for the financial year then ended, and a summary of significant accounting policies and other explanatory information.
Management’s Responsibility for the Financial Statements Management is responsible for the preparation of financial statements that give a true and fair view in accordance with the provisions of the Singapore Companies Act (the “Act”) and Singapore Financial Reporting Standards, and for devising and maintaining a system of internal accounting controls sufficient to provide a reasonable assurance that assets are safeguarded against loss from unauthorised use or disposition; and transactions are properly authorised and that they are recorded as necessary to permit the preparation of true and fair financial statements and to maintain accountability of assets.
Auditor’s Responsibility Our responsibility is to express an opinion on these financial statements based on our audit. We conducted our audit in accordance with Singapore Standards on Auditing. Those standards require that we comply with ethical requirements and plan and perform the audit to obtain reasonable assurance about whether the financial statements are free from material misstatement.
An audit involves performing procedures to obtain audit evidence about the amounts and disclosures in the financial statements. The procedures selected depend on the auditor’s judgment, including the assessment of the risks of material misstatement of the financial statements, whether due to fraud or error. In making those risk assessments, the auditor considers internal control relevant to the entity’s preparation of financial statements that give a true and fair view in order to design audit procedures that are appropriate in the circumstances, but not for the purpose of expressing an opinion on the effectiveness of the entity’s internal control.
An audit also includes evaluating the appropriateness of accounting policies used and the reasonableness of accounting estimates made by management, as well as evaluating the overall presentation of the financial statements.
We believe that the audit evidence we have obtained is sufficient and appropriate to provide a basis for our audit opinion.
OpinionIn our opinion, the consolidated financial statements of the Group and the statement of financial position and statement of changes in equity of the Company are properly drawn up in accordance with the provisions of the Act and Singapore Financial Reporting Standards so as to give a true and fair view of the financial position of the Group and Company as at 31 December 2015 and the financial performance, changes in equity and cash flows of the Group and changes in equity of the Company for the financial year ended on that date.
Report on Other Legal and Regulatory Requirements
In our opinion, the accounting and other records required by the Act to be kept by the Company and by those subsidiary corporations incorporated in Singapore of which we are the auditors, have been properly kept in accordance with the provisions of the Act.
Baker Tilly TFW LLPPublic Accountants andChartered AccountantsSingapore
24 March 2016
INDEPENDENT AUDITOR’S REPORTTo The Members Of BH Global Corporation Limited
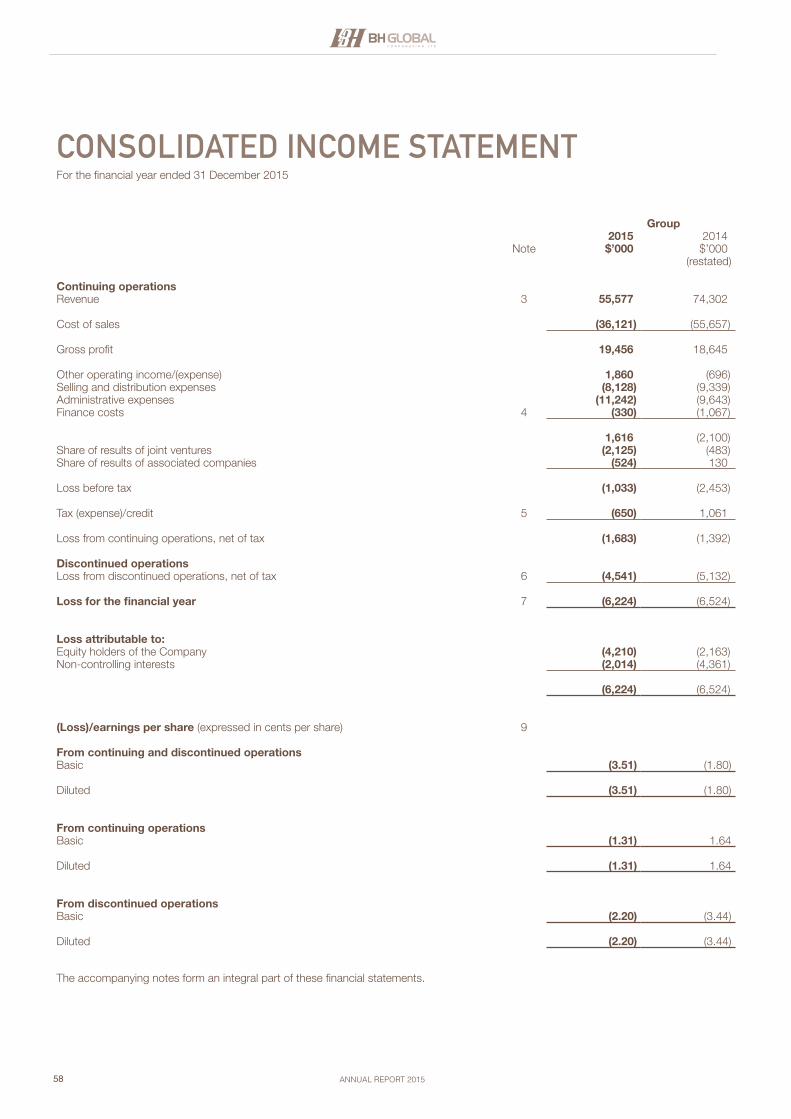
58 ANNUAL REPORT 2015
Group2015 2014
Note $’000 $’000(restated)
Continuing operationsRevenue 3 55,577 74,302
Cost of sales (36,121) (55,657)
Gross profit 19,456 18,645
Other operating income/(expense) 1,860 (696)Selling and distribution expenses (8,128) (9,339)Administrative expenses (11,242) (9,643)Finance costs 4 (330) (1,067)
1,616 (2,100)Share of results of joint ventures (2,125) (483)Share of results of associated companies (524) 130
Loss before tax (1,033) (2,453)
Tax (expense)/credit 5 (650) 1,061
Loss from continuing operations, net of tax (1,683) (1,392)
Discontinued operationsLoss from discontinued operations, net of tax 6 (4,541) (5,132)
Loss for the financial year 7 (6,224) (6,524)
Loss attributable to:Equity holders of the Company (4,210) (2,163)Non-controlling interests (2,014) (4,361)
(6,224) (6,524)
(Loss)/earnings per share (expressed in cents per share) 9
From continuing and discontinued operationsBasic (3.51) (1.80)
Diluted (3.51) (1.80)
From continuing operationsBasic (1.31) 1.64
Diluted (1.31) 1.64
From discontinued operationsBasic (2.20) (3.44)
Diluted (2.20) (3.44)
The accompanying notes form an integral part of these financial statements.
CONSOLIDATED INCOME STATEMENTFor the financial year ended 31 December 2015
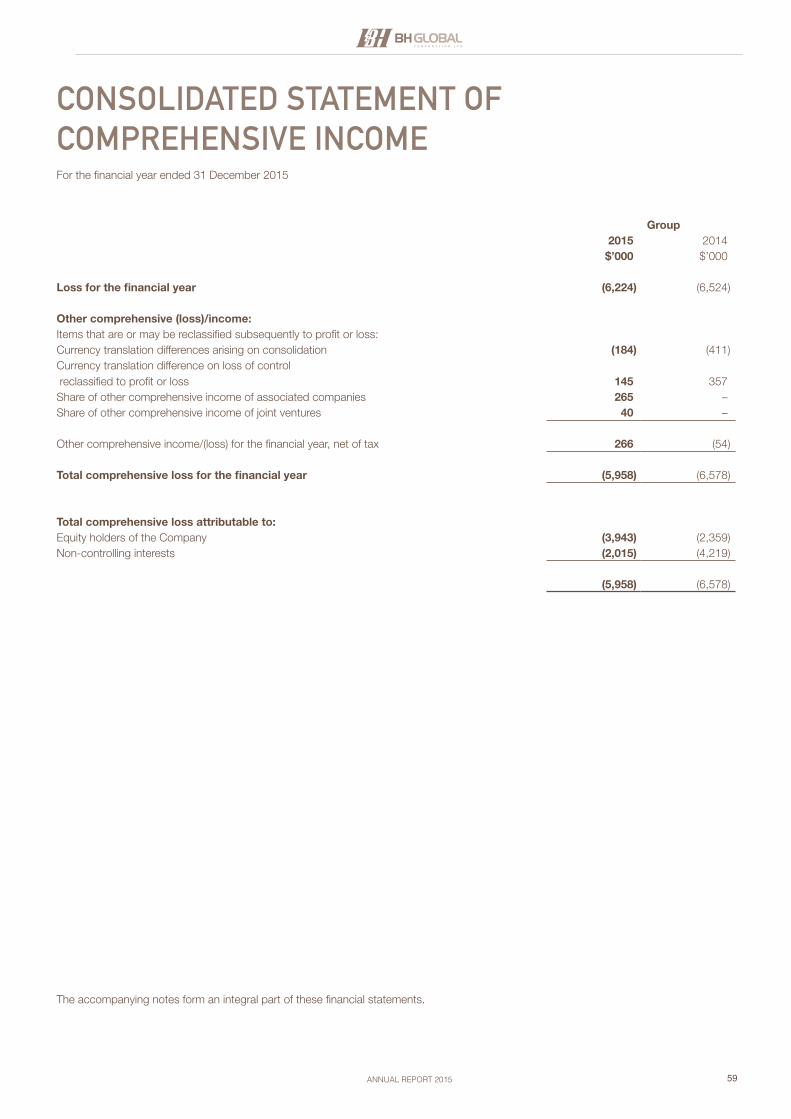
59ANNUAL REPORT 2015
Group2015 2014
$’000 $’000
Loss for the financial year (6,224) (6,524)
Other comprehensive (loss)/income:Items that are or may be reclassified subsequently to profit or loss:Currency translation differences arising on consolidation (184) (411)Currency translation difference on loss of control reclassified to profit or loss 145 357Share of other comprehensive income of associated companies 265 –Share of other comprehensive income of joint ventures 40 –
Other comprehensive income/(loss) for the financial year, net of tax 266 (54)
Total comprehensive loss for the financial year (5,958) (6,578)
Total comprehensive loss attributable to:Equity holders of the Company (3,943) (2,359)Non-controlling interests (2,015) (4,219)
(5,958) (6,578)
The accompanying notes form an integral part of these financial statements.
CONSOLIDATED STATEMENT OF COMPREHENSIVE INCOMEFor the financial year ended 31 December 2015

60 ANNUAL REPORT 2015
Group Company2015 2014 2015 2014
Note $’000 $’000 $’000 $’000
Non-current assetsProperty, plant and equipment 10 16,499 19,109 2 3Investment in subsidiaries 11 – – 10,384 12,229Investment in joint ventures 12 2,416 2,093 1,006 909Investment in associated companies 13 12,149 11,085 12,005 10,682Deferred tax assets 14 44 79 – –Intangible assets 15 49 49 49 49Purchase deposit to a supplier 16 5,756 – – –Non-current receivable 17 162 – 162 –
Total non-current assets 37,075 32,415 23,608 23,872
Current assetsInventories 18 30,123 32,761 – –Due from customers on construction contracts 19 129 37 – –Trade receivables 20 16,223 20,636 – –Other receivables 21 2,427 1,978 13,133 13,860Restricted cash 23 1,369 2,050 – –Cash and cash equivalents 24 4,349 2,987 153 211
54,620 60,449 13,286 14,071Property held for sale 25 – 1,527 – –Disposal group assets classified as held for sale 6 – 18,714 – –
Total current assets 54,620 80,690 13,286 14,071
Total assets 91,695 113,105 36,894 37,943
Non-current liabilitiesDeferred tax liabilities 14 915 836 – –Finance lease liabilities 26 354 521 – –
Total non-current liabilities 1,269 1,357 – –
Current liabilitiesDue to customers on construction contracts 19 – 3,081 – –Trade payables 5,873 8,406 – –Other payables 27 1,746 3,539 1,074 4,432Provisions 28 4,845 172 4,161 88Bank borrowings 29 9,310 13,255 – –Finance lease liabilities 26 166 166 – –Tax payable 1,197 1,493 51 101
23,137 30,112 5,286 4,621Liabilities directly associated with disposal group classified as held for sale 6 – 10,429 – –
Total current liabilities 23,137 40,541 5,286 4,621
Total liabilities 24,406 41,898 5,286 4,621
Net assets 67,289 71,207 31,608 33,322
The accompanying notes form an integral part of these financial statements.
STATEMENTS OF FINANCIAL POSITIONAt 31 December 2015
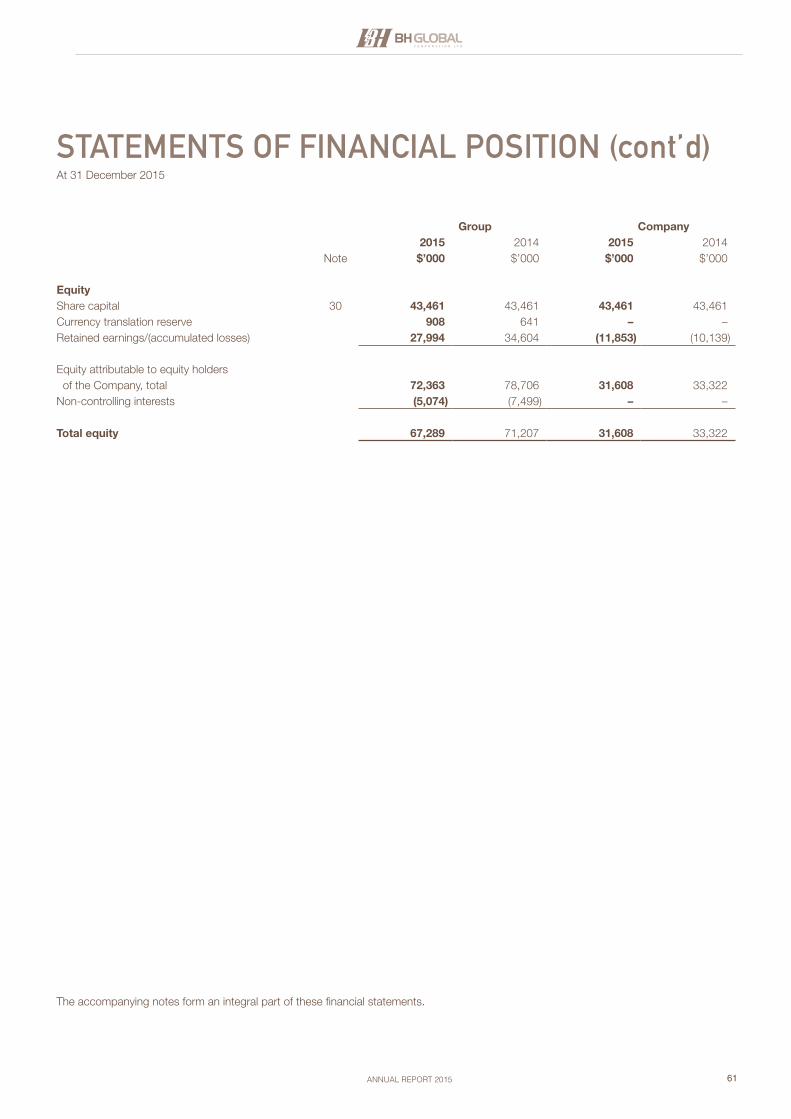
61ANNUAL REPORT 2015
Group Company2015 2014 2015 2014
Note $’000 $’000 $’000 $’000
EquityShare capital 30 43,461 43,461 43,461 43,461Currency translation reserve 908 641 – –Retained earnings/(accumulated losses) 27,994 34,604 (11,853) (10,139)
Equity attributable to equity holders of the Company, total 72,363 78,706 31,608 33,322Non-controlling interests (5,074) (7,499) – –
Total equity 67,289 71,207 31,608 33,322
The accompanying notes form an integral part of these financial statements.
STATEMENTS OF FINANCIAL POSITION (cont’d)At 31 December 2015
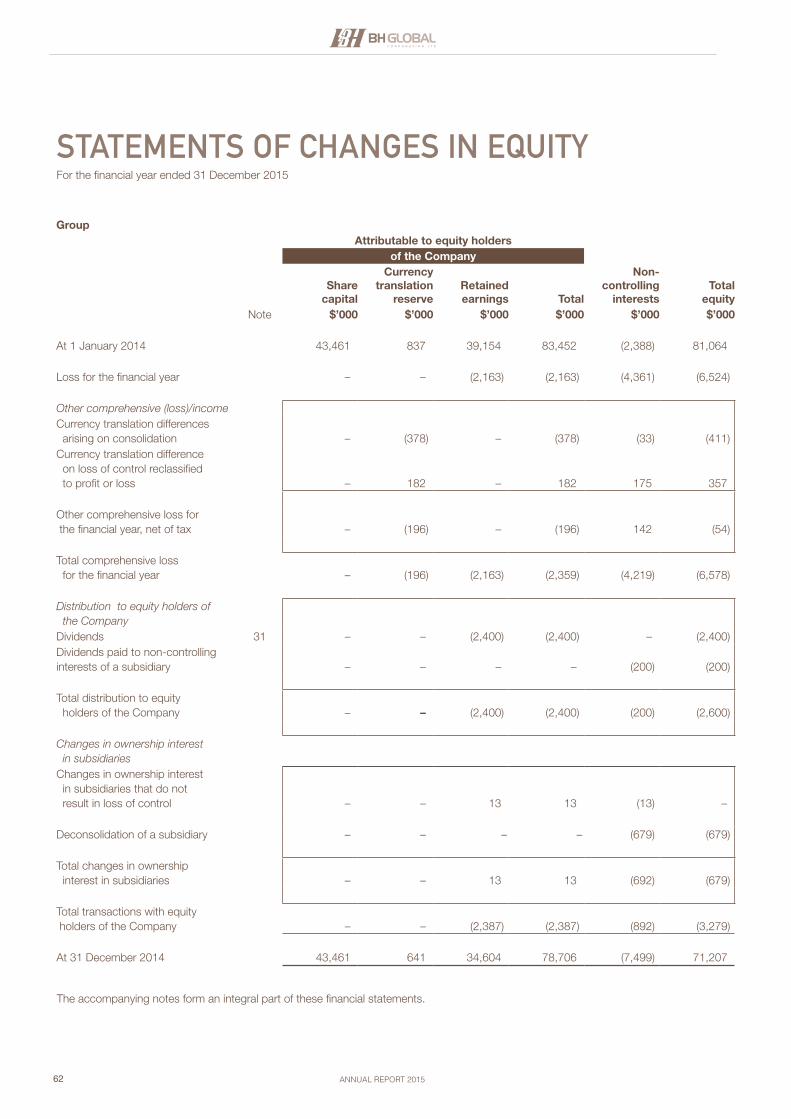
62 ANNUAL REPORT 2015
GroupAttributable to equity holders
of the Company
Share capital
Currency translation
reserveRetained earnings Total
Non-controlling
interests
Total
equityNote $’000 $’000 $’000 $’000 $’000 $’000
At 1 January 2014 43,461 837 39,154 83,452 (2,388) 81,064
Loss for the financial year – – (2,163) (2,163) (4,361) (6,524)
Other comprehensive (loss)/incomeCurrency translation differences arising on consolidation – (378) – (378) (33) (411)Currency translation difference on loss of control reclassified to profit or loss – 182 – 182 175 357
Other comprehensive loss for the financial year, net of tax – (196) – (196) 142 (54)
Total comprehensive loss for the financial year – (196) (2,163) (2,359) (4,219) (6,578)
Distribution to equity holders of the CompanyDividends 31 – – (2,400) (2,400) – (2,400)Dividends paid to non-controlling interests of a subsidiary – – – – (200) (200)
Total distribution to equity holders of the Company – – (2,400) (2,400) (200) (2,600)
Changes in ownership interest in subsidiariesChanges in ownership interest in subsidiaries that do not result in loss of control – – 13 13 (13) –
Deconsolidation of a subsidiary – – – – (679) (679)
Total changes in ownership interest in subsidiaries – – 13 13 (692) (679)
Total transactions with equity holders of the Company – – (2,387) (2,387) (892) (3,279)
At 31 December 2014 43,461 641 34,604 78,706 (7,499) 71,207
The accompanying notes form an integral part of these financial statements.
STATEMENTS OF CHANGES IN EQUITYFor the financial year ended 31 December 2015

63ANNUAL REPORT 2015
GroupAttributable to equity holders
of the Company
Share capital
Currency translation
reserveRetained earnings Total
Non-controlling
interests
Total
equityNote $’000 $’000 $’000 $’000 $’000 $’000
At 31 December 2014 (Balance brought forward) 43,461 641 34,604 78,706 (7,499) 71,207
Loss for the financial year – – (4,210) (4,210) (2,014) (6,224)
Other comprehensive (loss)/incomeCurrency translation differences arising on consolidation – (183) – (183) (1) (184)Currency translation difference on deconsolidation of subsidiaries reclassified to profit or loss 11(d) – 145 – 145 – 145Share of other comprehensive income of associated companies – 265 – 265 – 265Share of other comprehensive income of joint ventures – 40 – 40 – 40
Other comprehensive income/(loss) for the financial year, net of tax – 267 – 267 (1) 266
Total comprehensive income/(loss) for the financial year – 267 (4,210) (3,943) (2,015) (5,958)
Distribution to equity holders of the CompanyDividends 31 – – (2,400) (2,400) – (2,400)
Changes in ownership interest in subsidiariesContribution from a non-controlling interest 11(e) – – – – 50 50Disposal of a subsidiary 11(c) – – – – (3,401) (3,401)Deconsolidation of subsidiaries 11(d) – – – – 7,791 7,791
Total changes in ownership interest in subsidiaries – – – – 4,440 4,440
Total transactions with equity holders of the Company – – (2,400) (2,400) 4,440 2,040
At 31 December 2015 43,461 908 27,994 72,363 (5,074) 67,289
The accompanying notes form an integral part of these financial statements.
STATEMENTS OF CHANGES IN EQUITY (cont’d)For the financial year ended 31 December 2015
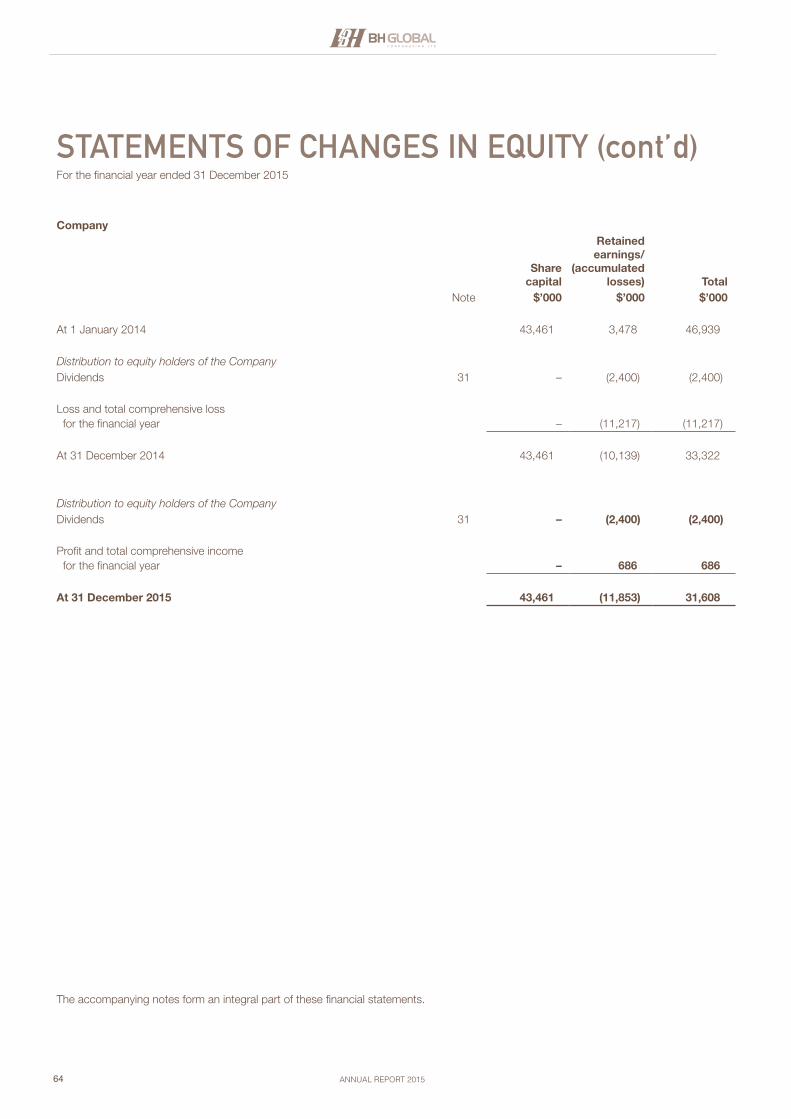
64 ANNUAL REPORT 2015
Company
Share capital
Retainedearnings/
(accumulated losses) Total
Note $’000 $’000 $’000
At 1 January 2014 43,461 3,478 46,939
Distribution to equity holders of the CompanyDividends 31 – (2,400) (2,400)
Loss and total comprehensive loss for the financial year – (11,217) (11,217)
At 31 December 2014 43,461 (10,139) 33,322
Distribution to equity holders of the CompanyDividends 31 – (2,400) (2,400)
Profit and total comprehensive income for the financial year – 686 686
At 31 December 2015 43,461 (11,853) 31,608
The accompanying notes form an integral part of these financial statements.
STATEMENTS OF CHANGES IN EQUITY (cont’d)For the financial year ended 31 December 2015
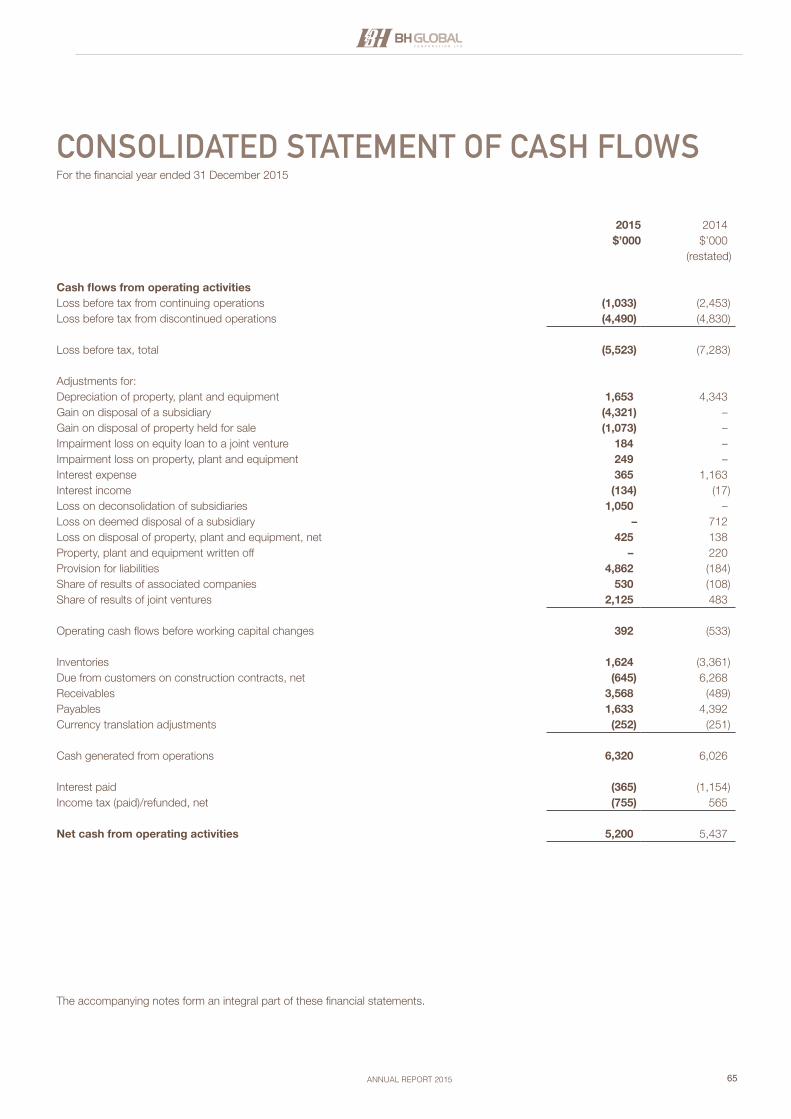
65ANNUAL REPORT 2015
2015 2014$’000 $’000
(restated)
Cash flows from operating activitiesLoss before tax from continuing operations (1,033) (2,453)Loss before tax from discontinued operations (4,490) (4,830)
Loss before tax, total (5,523) (7,283)
Adjustments for:Depreciation of property, plant and equipment 1,653 4,343Gain on disposal of a subsidiary (4,321) –Gain on disposal of property held for sale (1,073) –Impairment loss on equity loan to a joint venture 184 –Impairment loss on property, plant and equipment 249 –Interest expense 365 1,163Interest income (134) (17)Loss on deconsolidation of subsidiaries 1,050 –Loss on deemed disposal of a subsidiary – 712Loss on disposal of property, plant and equipment, net 425 138Property, plant and equipment written off – 220Provision for liabilities 4,862 (184)Share of results of associated companies 530 (108)Share of results of joint ventures 2,125 483
Operating cash flows before working capital changes 392 (533)
Inventories 1,624 (3,361)Due from customers on construction contracts, net (645) 6,268Receivables 3,568 (489)Payables 1,633 4,392Currency translation adjustments (252) (251)
Cash generated from operations 6,320 6,026
Interest paid (365) (1,154)Income tax (paid)/refunded, net (755) 565
Net cash from operating activities 5,200 5,437
The accompanying notes form an integral part of these financial statements.
CONSOLIDATED STATEMENT OF CASH FLOWSFor the financial year ended 31 December 2015
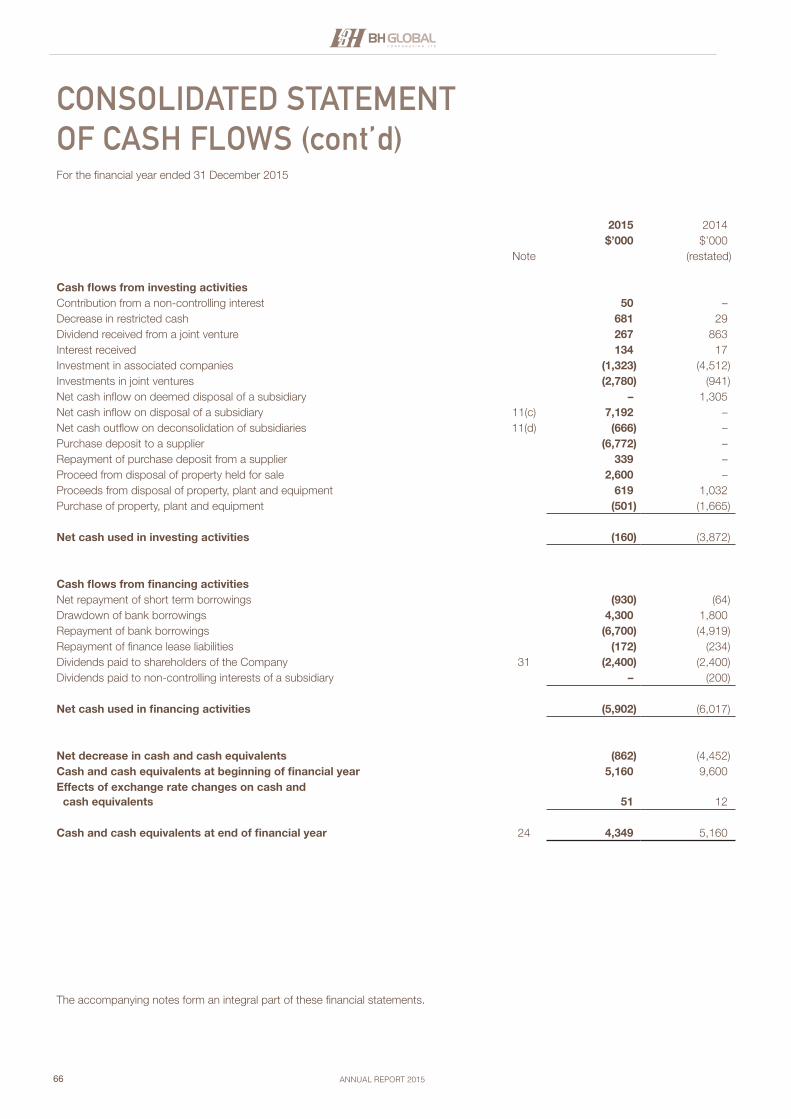
66 ANNUAL REPORT 2015
2015 2014$’000 $’000
Note (restated)
Cash flows from investing activitiesContribution from a non-controlling interest 50 –Decrease in restricted cash 681 29Dividend received from a joint venture 267 863Interest received 134 17Investment in associated companies (1,323) (4,512)Investments in joint ventures (2,780) (941)Net cash inflow on deemed disposal of a subsidiary – 1,305Net cash inflow on disposal of a subsidiary 11(c) 7,192 –Net cash outflow on deconsolidation of subsidiaries 11(d) (666) –Purchase deposit to a supplier (6,772) –Repayment of purchase deposit from a supplier 339 –Proceed from disposal of property held for sale 2,600 –Proceeds from disposal of property, plant and equipment 619 1,032Purchase of property, plant and equipment (501) (1,665)
Net cash used in investing activities (160) (3,872)
Cash flows from financing activitiesNet repayment of short term borrowings (930) (64)Drawdown of bank borrowings 4,300 1,800Repayment of bank borrowings (6,700) (4,919)Repayment of finance lease liabilities (172) (234)Dividends paid to shareholders of the Company 31 (2,400) (2,400)Dividends paid to non-controlling interests of a subsidiary – (200)
Net cash used in financing activities (5,902) (6,017)
Net decrease in cash and cash equivalents (862) (4,452)Cash and cash equivalents at beginning of financial year 5,160 9,600Effects of exchange rate changes on cash and cash equivalents 51 12
Cash and cash equivalents at end of financial year 24 4,349 5,160
The accompanying notes form an integral part of these financial statements.
CONSOLIDATED STATEMENT OF CASH FLOWS (cont’d)For the financial year ended 31 December 2015
67ANNUAL REPORT 2015
These notes form an integral part of and should be read in conjunction with the accompanying financial statements.
1 Corporate information
The Company (Co. Reg. No. 200404900H), is incorporated and domiciled in Singapore. The address of its registered office is at 8 Penjuru Lane, Singapore 609189.
The principal activity of the Company is that of investment holding. The principal activities of its subsidiaries are disclosed in Note 11 to the financial statements.
The Company’s immediate and ultimate holding company is Beng Hui Holding (S) Pte Ltd, incorporated in Singapore. Related companies are subsidiaries of Beng Hui Holding (S) Pte Ltd.
2 Summary of significant accounting policies
a) Basis of preparation
The financial statements are presented in Singapore dollar ($), which is the Company’s functional currency and all financial information presented in Singapore dollar are rounded to the nearest thousand ($’000) except when otherwise indicated. The financial statements have been prepared in accordance with the provisions of the Singapore Companies Act and Singapore Financial Reporting Standards (“FRS”). The financial statements have been prepared under the historical cost convention except as disclosed in the accounting policies below.
The preparation of financial statements in conformity with FRS requires the use of estimates and assumptions that affect the reported amounts of assets and liabilities and disclosure of contingent assets and liabilities at the date of the financial statements and the reported amounts of revenues and expenses during the financial year. Although these estimates are based on management’s best knowledge of current events and actions and historical experiences and various other factors that are believed to be reasonable under the circumstances, actual results may ultimately differ from those estimates.
The estimates and underlying assumptions are reviewed on an ongoing basis. Revisions to accounting estimates are recognised in the period in which the estimate is revised if the revision affects only that period, or in the period of the revision and future periods if the revision affects both current and future periods.
The areas involving a higher degree of judgment in applying accounting policies, or areas where assumptions and estimates have a significant risk of resulting in material adjustment within the next financial year are disclosed in Note 2(cc) to the financial statements.
The carrying amounts of cash and cash equivalents, trade and other current receivables and payables approximate their respective fair values due to the relatively short-term maturity of these financial instruments.
NOTES TO THE FINANCIAL STATEMENTSFor the financial year ended 31 December 2015
68
NOTES TO THE FINANCIAL STATEMENTS (cont’d)For the financial year ended 31 December 2015
ANNUAL REPORT 2015
2 Summary of significant accounting policies (cont’d)
a) Basis of preparation (cont’d)
In the current financial year, the Group has adopted all the new and revised FRS and Interpretations of FRS (“INT FRS”) that are relevant to its operations and effective for the current financial year. Changes to the Group’s accounting policies have been made as required, in accordance with the transitional provisions in the respective FRS and INT FRS.
The adoption of these new and revised FRS and INT FRS did not have any material effect on the financial results or position of the Group and the Company.
New standards, amendments to standards and interpretations that have been issued at the end of the reporting period but are not yet effective for the financial year ended 31 December 2015 have not been applied in preparing these financial statements. None of these are expected to have a significant effect on the financial statements of the Group and the Company except as disclosed below:
(i) FRS 115 Revenue from Contracts with Customers
FRS 115 replaces FRS 18 ‘Revenue’, FRS 11 ‘Construction contracts’ and other revenue-related interpretations. It applies to all contracts with customers, except for leases, financial instruments, insurance contracts and certain guarantee contracts and non-monetary exchange contracts. FRS 115 provides a single, principle-based model to be applied to all contracts with customers. It provides guidance on whether revenue should be recognised at a point in time or over time, replacing the previous distinction between goods and services. The standard introduces new guidance on specific circumstances where cost should be capitalised and new requirements for disclosure of revenue in the financial statements. The standard is effective for annual periods beginning on or after 1 January 2018. The Group will reassess its contracts with customers in accordance with FRS 115.
(ii) FRS 109 Financial Instruments
FRS 109 includes guidance on (i) the classification and measurement of financial assets and financial liabilities; (ii) impairment requirements for financial assets; and (iii) general hedge accounting. FRS 109, when effective will replace FRS 39 Financial Instruments: Recognition and Measurement. This standard is effective for annual periods beginning on or after 1 January 2018. The Group will reassess the potential impact of FRS 109 and plans to adopt the standard on the required effective date.
b) Revenue recognition
Revenue comprises the fair value for the consideration received or receivable for the sale of goods and rendering of services, net of goods and services tax, rebates and discounts, and after eliminating sales within the Group. Revenue is recognised to the extent that it is probable that the economic benefits associated with the transaction will flow to the entity, and the amount of revenue and related cost can be reliably measured.
Revenue from sale of goods is recognised when a Group entity has delivered the products to the customer and significant risks and rewards of ownership of the goods have been passed to the customer.
Revenue from services is recognised during the financial year in which the services are rendered, by reference to completion of the specific transaction assessed on the basis of the actual service provided as a proportion of the total services to be performed.

69
NOTES TO THE FINANCIAL STATEMENTS (cont’d)For the financial year ended 31 December 2015
ANNUAL REPORT 2015
2 Summary of significant accounting policies (cont’d)
b) Revenue recognition (cont’d)
The accounting policy for revenue from construction contracts is disclosed in Note 2(j).
Interest income is recognised on a time proportion basis using the effective interest method.
Dividend income is recognised when the right to receive payment is established.
Rental income from operating leases are recognised on a straight-line basis over the lease term.
c) Subsidiaries
Subsidiaries are entities controlled by the Group. The Group controls an entity when the Group is exposed to, or has rights to, variable returns from its involvement with the entity and has the ability to affect those returns through its power over the entity.
In the Company’s statement of financial position, investment in subsidiaries are accounted for at cost less accumulated impairment losses, if any. On disposal of the investment, the difference between disposal proceeds and the carrying amounts of the investments are recognised in profit or loss.
d) Basis of consolidation
The consolidated financial statements comprise the financial statements of the Company and its subsidiaries as at the end of the reporting period. Subsidiaries are consolidated from the date on which the Group obtains control, and continue to be consolidated until the date that such control ceases.
The financial statements of the subsidiaries are prepared for the same reporting date as the parent company. Consistent accounting policies are applied for like transactions and events in similar circumstances.
Intragroup balances and transactions, including income, expenses and dividends, are eliminated in full. Profits and losses resulting from intragroup transactions that are recognised in assets, such as inventory and property, plant and equipment, are eliminated in full.
Business combinations are accounted for using the acquisition method. The consideration transferred for the acquisition comprises the fair value of the assets transferred, the liabilities incurred and the equity interests issued by the Group. The consideration transferred also includes the fair value of any contingent consideration arrangement and the fair value of any pre-existing equity interest in the subsidiary. Acquisition-related costs are recognised as expenses as incurred. Identifiable assets acquired and liabilities and contingent liabilities assumed in a business combination are measured initially at their fair values at the acquisition date.
Any excess of the fair value of the consideration transferred in the business combination, the amount of any non-controlling interest in the acquiree (if any) and the fair value of the Group’s previously held equity interest in the acquiree (if any), over the fair value of the net identifiable assets acquired is recorded as goodwill. In instances where the latter amount exceeds the former and the measurement of all amounts has been reviewed, the excess is recognised as gain from bargain purchase in profit or loss on the date of acquisition.
70
NOTES TO THE FINANCIAL STATEMENTS (cont’d)For the financial year ended 31 December 2015
ANNUAL REPORT 2015
2 Summary of significant accounting policies (cont’d)
d) Basis of consolidation (cont’d)
Non-controlling interests are that part of the net results of operations and of net assets of a subsidiary attributable to the interests which are not owned directly or indirectly by the equity holders of the Company. They are shown separately in the consolidated income statement, statement of comprehensive income, statement of changes in equity and statement of financial position. Total comprehensive income is attributed to the non-controlling interests based on their respective interests in a subsidiary, even if this results in the non-controlling interests having a deficit balance.
For non-controlling interests that are present ownership interests and entitle their holders to a proportionate share of the acquiree’s net assets in the event of liquidation, the Group elects on an acquisition-by-acquisition basis whether to measure them at fair value, or at the non-controlling interests’ proportionate share of the acquiree’s net identifiable assets, at the acquisition date. All other non-controlling interests are measured at acquisition-date fair value or, when applicable, on the basis specified in another standard.
In business combinations achieved in stages, previously held equity interests in the acquiree are remeasured to fair value at the acquisition date (i.e. the date the Group attains control) and any corresponding gain or loss, if any, is recognised in profit or loss.
Changes in the Company’s ownership interest in a subsidiary that do not result in a loss of control are accounted for as equity transactions (ie transactions with owners in their capacity as owners). The carrying amount of the controlling and non-controlling interests are adjusted to reflect the changes in their relative interests in the subsidiary. Any difference between the amount by which the non-controlling interest is adjusted and the fair value of the consideration paid or received is recognised directly in equity and attributable to owners of the Company.
When a change in the Company’s ownership interest in a subsidiary results in a loss of control over the subsidiary, the assets and liabilities of the subsidiary including any goodwill, non-controlling interest and other components of equity related to the subsidiary are derecognised. Amounts recognised in other comprehensive income in respect of that entity are also reclassified to profit or loss or transferred directly to retained earnings if required by a specific FRS.
Any retained equity interest in the previous subsidiary is remeasured at fair value at the date that control is lost. The difference between the carrying amount of the retained interest at the date control is lost, and its fair value is recognised in profit or loss.
e) Associated companies and joint ventures
An associated company is an entity over which the Group has significant influence but not control or joint control, over the financial and operating policies of the entity. Significant influence is presumed to exist generally when the Group holds 20% or more but not exceeding 50% of the voting power of another entity.
A joint venture is an arrangement in which the Group has joint control, whereby the Group has rights to the net assets of the arrangement, rather than rights to its assets and obligations for its liabilities.
Investments in associated companies and joint ventures are accounted for in the consolidated financial statements using the equity method of accounting, less impairment losses, if any.
71
NOTES TO THE FINANCIAL STATEMENTS (cont’d)For the financial year ended 31 December 2015
ANNUAL REPORT 2015
2 Summary of significant accounting policies (cont’d)
e) Associated companies and joint ventures (cont’d)
Investments in associated companies and joint ventures are initially recognised at cost. The cost of an acquisition is measured at the fair value of the assets given, equity instruments issued or liabilities incurred or assumed at the date of exchange, plus costs directly attributable to the acquisition.
Subsequent to initial recognition, the Group’s share of its associated companies’ and joint ventures’ post-acquisition profits or losses is recognised in the profit or loss and its share of post-acquisition other comprehensive income is recognised in other comprehensive income. These post-acquisition movements and distributions received from associated companies and joint ventures are adjusted against the carrying amount of the investment. When the Group’s share of losses in an associated company and joint venture equals or exceeds its interest in the associated company and joint venture, including any other unsecured non-current receivables, the Group does not recognise further losses, unless it has obligations or has made payments on behalf of the associated company and joint venture.
Any excess of the cost of acquisition over the Group’s share of the net fair value of the identifiable assets, liabilities and contingent liabilities of the associated company or joint venture recognised at the date of acquisition is recognised as goodwill. The goodwill is included within the carrying amount of the investment and is assessed for impairment as part of the investment. Any excess of the Group’s share of the net fair value of the identifiable assets, liabilities and contingent liabilities over the cost of acquisition, after reassessment, is recognised immediately as income in the Group’s profit or loss.
Where a group entity transacts with an associated company or joint venture of the Group, profits and losses are eliminated to the extent of the Group’s interest in the relevant associated company or joint venture.
Upon loss of significant influence over the associated company or joint control over the joint venture, the Group measures any retained investment at its fair value. Any difference between the carrying amount of the associated company or joint venture upon loss of significant influence or joint control and the fair value of the aggregate of the retained investment and proceeds from disposal is recognised in profit or loss.
If the Group’s ownership interest in an associated company or a joint venture is reduced, but the Group continues to apply the equity method, the Group shall reclassify to profit or loss the proportion of the gain or loss that had previously been recognised in other comprehensive income relating to that reduction in ownership interest if that gain or loss would be required to be reclassified to profit or loss on the disposal of the related assets or liabilities.
In the Company’s financial statements, investments in associated companies and joint ventures are carried at cost less accumulated impairment loss, if any. On disposal of investment in associated companies or joint ventures, the difference between the disposal proceeds and the carrying amount of the investment is recognised in profit or loss.
72
NOTES TO THE FINANCIAL STATEMENTS (cont’d)For the financial year ended 31 December 2015
ANNUAL REPORT 2015
2 Summary of significant accounting policies (cont’d)
f) Property, plant and equipment
All items of property, plant and equipment are initially recognised at cost and subsequently carried at cost less accumulated depreciation and any impairment in value.
The cost of property, plant and equipment initially recognised includes its purchase price and any cost that is directly attributable to bringing the asset to the location and condition necessary for it to be capable of operating in the manner intended by management.
Dismantlement, removal or restoration costs are included as part of the cost of property, plant and equipment if the obligation for dismantlement, removal or restoration is incurred as a consequence of acquiring or using the asset.
The cost of replacing a component of an item of property, plant and equipment is recognised in the carrying amount of the item if it is probable that the future economic benefits embodied within the component will flow to the Group, and its cost can be measured reliably. The carrying amount of the replaced component is derecognised.
On disposal of a property, plant and equipment, the difference between the net disposal proceeds and its carrying amount is taken to profit or loss.
Depreciation is calculated on a straight-line basis to write off the depreciable amount of property, plant and equipment over their expected useful lives. The estimated useful lives are as follows:
Number of years
Extension, addition and alteration works 10-50Yard facilities 10Motor vehicles 5Warehouse equipment and fittings 5Computer and office equipment 3Furniture, fittings and renovation 5Plant and machinery 5
The leasehold properties are depreciated based on the shorter of 50 years or lease period.
The residual values, estimated useful lives and depreciation method of property, plant and equipment are reviewed, and adjusted as appropriate, at each reporting date. The effects of any revision are recognised in profit or loss when the changes arise.
Fully depreciated assets are retained in the financial statements until they are no longer in use.
g) Intangible assets
Club membership
Club membership is stated at cost less impairment losses, if any. Club membership with indefinite useful live is tested for impairment annually, or more frequently if the events or circumstances indicate that the carrying value may be impaired.
73
NOTES TO THE FINANCIAL STATEMENTS (cont’d)For the financial year ended 31 December 2015
ANNUAL REPORT 2015
2 Summary of significant accounting policies (cont’d)
h) Impairment of non-financial assets excluding goodwill
At each reporting date, the Group assesses the carrying amounts of its non-financial assets to determine whether there is any indication that those assets have suffered an impairment loss. If any such indication exists, the recoverable amount of the asset is estimated in order to determine the extent of the impairment loss (if any). Where it is not possible to estimate the recoverable amount of an individual asset, the Group estimates the recoverable amount of the cash-generating unit to which the asset belongs.
Recoverable amount is the higher of fair value less costs to sell and value in use. In assessing value in use, the estimated future cash flows are discounted to their present value using a pre-tax discount rate that reflects current market assessments of the time value of money and the risks specific to the asset.
If the recoverable amount of an asset (or cash-generating unit) is estimated to be less than its carrying amount, the carrying amount of the asset (cash-generating unit) is reduced to its recoverable amount. An impairment loss is recognised immediately in profit or loss.
Where an impairment loss subsequently reverses, the carrying amount of the asset (cash-generating unit) is increased to the revised estimate of its recoverable amount, but so that the increased carrying amount does not exceed the carrying amount that would have been determined had no impairment loss been recognised for the asset (cash-generating unit) in prior years. A previously recognised impairment loss for an asset other than goodwill is only reversed if there has been a change in the estimates used to determine the asset’s recoverable amount since the last impairment loss was recognised. A reversal of an impairment loss is recognised immediately in profit or loss.
i) Inventories
Inventories are stated at the lower of cost and net realisable value. The cost of inventories comprises costs of purchases and those costs that have been incurred in bringing the inventories to their present condition and location.
Cost is determined on the following basis:
Marine electrical equipment, steel products and consumables - first-in first-out Armouring steel - weighted average
Net realisable value is the estimated selling price in the ordinary course of business, less the costs of completion and selling expenses.
j) Construction contracts
When the outcome of a construction contract can be estimated reliably, contract revenue and contract costs are recognised as revenue and expenses respectively by reference to the stage of completion of the contract activity at the end of the reporting period (“percentage-of-completion method”). When the outcome of a construction contract cannot be estimated reliably, contract revenue is recognised to the extent of contract costs incurred that are likely to be recoverable. When it is probable that total contract costs will exceed total contract revenue, the expected loss is recognised as an expense immediately.
74
NOTES TO THE FINANCIAL STATEMENTS (cont’d)For the financial year ended 31 December 2015
ANNUAL REPORT 2015
2 Summary of significant accounting policies (cont’d)
j) Construction contracts (cont’d)
The stage of completion is measured by reference to the proportion of contract costs incurred for work performed to date relative to the estimated total costs for the contract. Costs incurred during the financial year in connection with future activity on a contract are excluded from the costs incurred to date when determining the stage of completion of a contract. Such costs are shown as construction contract work-in progress on the statement of financial position unless it is not probable that such contract costs are recoverable from the customers, in which case, such costs are recognised as an expense immediately. Variations in contract work, claims and incentive payments are included to the extent that the amount can be measured reliably and its receipt is considered probable.
At the end of the reporting date, the cumulative costs incurred plus recognised profit (less recognised loss) on each contract is compared against the progress billings. Where the cumulative costs incurred plus the recognised profits (less recognised losses) exceed progress billings, the balance is presented as due from customers on construction contracts. Where progress billings exceed the cumulative costs incurred plus recognised profits (less recognised losses), the balance is presented as due to customers on construction contracts.
Progress billings not yet paid by customers and retentions by customers are included within “trade receivables”. Advances received are included within “other payables”.
k) Leases
Finance leases
Leases of property, plant and equipment where the Group assumes substantially all the risks and rewards incidental to ownership are classified as finance leases. Finance leases are capitalised at the inception of the lease at the lower of the fair value of the leased asset or the present value of the minimum lease payments. Each lease payment is allocated between reduction of the liability and finance charges. The corresponding lease liabilities, net of finance charges, are included in borrowings. The interest element of the finance cost is taken to profit or loss over the lease period so as to produce a constant periodic rate of interest on the remaining balance of the liability for each period. The asset acquired under finance leases are depreciated over the shorter of the useful life of the assets or the lease term.
Operating leases
Leases where a significant portion of the risks and rewards incidental to ownership are retained by the lessor are classified as operating leases. Payments made under operating leases (net of any incentives received from the lessor) are taken to profit or loss on a straight-line basis over the period of the lease. Contingent rents, if any, are charged as expenses in the periods in which they are incurred.
When an operating lease is terminated before the lease period expires, any payment required to be made to the lessor by way of penalty is recognised as an expense in the period in which termination takes place.
75
NOTES TO THE FINANCIAL STATEMENTS (cont’d)For the financial year ended 31 December 2015
ANNUAL REPORT 2015
2 Summary of significant accounting policies (cont’d)
l) Income taxes
Income tax on the profit or loss for the year comprises current and deferred tax. Income tax is recognised in profit or loss except to the extent that it relates to items recognised outside profit or loss, either in other comprehensive income or directly in equity.
Current tax is the expected tax payable or recoverable on the taxable income for the current year, using tax rates enacted or substantively enacted at the end of the reporting period, and any adjustment to tax payable or recoverable in respect of previous years.
Deferred income tax is provided using the liability method, on all temporary differences at the end of the reporting period arising between the tax bases of assets and liabilities and their carrying amounts in the financial statements except where the deferred income tax arises from the initial recognition of goodwill or an asset or liability in a transaction that is not a business combination, and at the time of the transaction, affects neither the accounting nor taxable profit or loss.
Deferred income tax is provided on temporary differences arising on investments in subsidiaries, associated companies and joint ventures, except where the timing of the reversal of the temporary difference can be controlled by the Group and it is probable that the temporary difference will not reverse in the foreseeable future.
Deferred tax assets are recognised to the extent that it is probable that future taxable profit will be available against which the deductible temporary differences can be utilised.
Deferred tax assets and liabilities are measured at the tax rates that are expected to apply in the year when the asset is realised or the liability is settled, based on currently enacted or substantively enacted tax rates at the end of the reporting period.
Deferred tax are charged or credited to equity if the tax relates to items that are credited or charged, in the same or a different period, directly to equity.
m) Financial assets
i) Classification
The Group classifies its financial assets in the following categories: at fair value through profit or loss and loans and receivables. The classification depends on the nature of the asset and the purpose for which the assets were acquired. Management determines the classification of its financial assets at initial recognition.
Financial assets, at fair value through profit or loss
This category has two sub-categories: “financial assets held for trading”, and those designated upon initial recognition at fair value through profit or loss. A financial asset is classified as held for trading if acquired principally for the purpose of selling in the short term. Financial assets designated as at fair value through profit or loss at initial recognition are those that are managed and their performance are evaluated on a fair value basis, in accordance with a documented Group’s investment strategy. Derivatives are also categorised as “held for trading” unless they are designated as effective hedging instruments. Assets in this category are classified as current assets if they are either held for trading or are expected to be realised within 12 months after the end of the reporting period.
76
NOTES TO THE FINANCIAL STATEMENTS (cont’d)For the financial year ended 31 December 2015
ANNUAL REPORT 2015
2 Summary of significant accounting policies (cont’d)
m) Financial assets (cont’d)
i) Classification (cont’d)
Loans and receivables
Loans and receivables are non-derivative financial assets with fixed or determinable payments that are not quoted in an active market. They are included in current assets, except those maturing later than 12 months after the end of the reporting period which are classified as non-current assets. Loans and receivables are classified within “trade and other receivables” (excluding prepayments and advance payment to suppliers) and “cash and cash equivalents” on the statement of financial position.
ii) Recognition and derecognition
Regular purchases and sales of financial assets are recognised on trade-date – the date on which the Group commits to purchase or sell the asset. Financial assets are derecognised when the rights to receive cash flows from the financial assets have expired or have been transferred and the Group has transferred substantially all risks and rewards of ownership. On disposal of a financial asset, the difference between the net sale proceeds and its carrying amount is recognised in profit or loss.
iii) Initial measurement
Financial assets are initially recognised at fair value plus transaction costs except for financial assets at fair value through profit or loss, which are recognised at fair value. Transaction costs for financial assets at fair value through profit and loss are recognised as expenses.
iv) Subsequent measurement
Financial assets at fair value through profit or loss are subsequently carried at fair value. Loans and receivables are carried at amortised cost using the effective interest method, less impairment.
Gains or losses arising from changes in the fair value of financial assets at fair value through profit or loss, including effects of currency translation, are recognised in profit or loss in the financial year in which the changes in fair values arise.
Interest income on financial assets are recognised separately in profit or loss.
v) Impairment
The Group assesses at each reporting date whether there is objective evidence that a financial asset or a group of financial assets is impaired.
Loans and receivables
Significant financial difficulties of the debtor, probability that the debtor will enter bankruptcy or financial reorganisation, and default or delinquency in payments are considered indicators that the receivable is impaired.
77
NOTES TO THE FINANCIAL STATEMENTS (cont’d)For the financial year ended 31 December 2015
ANNUAL REPORT 2015
2 Summary of significant accounting policies (cont’d)
m) Financial assets (cont’d)
v) Impairment (cont’d)
Loans and receivables (cont’d)
The carrying amount of these assets is reduced through the use of an impairment allowance account, and the amount of the loss is recognised in profit or loss. The allowance amount is the difference between the asset’s carrying amount and the present value of estimated future cash flows, discounted at the original effective interest rate. When the asset becomes uncollectible, it is written off against the allowance account. Subsequent recoveries of amounts previously written off are recognised against the same line item in profit or loss.
If in subsequent periods, the impairment loss decreases, and the decrease can be related objectively to an event occurring after the impairment loss was recognised, the previously recognised impairment loss is reversed through profit or loss to the extent that the carrying amount of the asset does not exceed its amortised cost at the reversal date.
n) Cash and cash equivalents
For the purpose of presentation in the consolidated statement of cash flows, cash and cash equivalents comprise cash on hand, deposits with financial institutions which are subject to an insignificant risk of change in value, bank overdrafts that form an integral part of the Group’s cash management, and other short-term highly liquid investments that are readily convertible to a known amount of cash and are subject to an insignificant risk of changes in value and excludes pledged deposits. Bank overdrafts are presented as current borrowings on the statement of financial position.
o) Financial liabilities
Financial liabilities are recognised on the statement of financial position when, and only when, the Group becomes a party to the contractual provisions of the financial instrument.
Financial liabilities are recognised initially at fair value, plus, in the case of financial liabilities other than derivatives, directly attributable transaction costs.
Subsequent to initial recognition, derivatives are measured at fair value. Other financial liabilities (except for the financial guarantees) are measured at amortised cost using the effective interest method.
For financial liabilities other than derivatives, gains and losses are recognised in profit or loss when the liabilities are derecognised, and through the amortisation process. Any gains or losses arising from changes in fair value of derivatives are recognised in profit or loss. Net gains or losses on derivatives include exchange differences. A financial liability is derecognised when the obligation under the liability is extinguished.
p) Financial guarantees
A financial guarantee contract is a contract that requires the issuer to make specified payments to reimburse the holder for a loss it incurs because a specific debtor fails to make payment when due.
Financial guarantee contracts are initially recognised at their fair values plus transaction costs. Financial guarantees are classified as financial liabilities.
Subsequent to initial measurement, the financial guarantees are stated at the higher of the initial fair value less cumulative amortisation and the expected amount payable to the holder. Financial guarantees contracts are amortised in profit or loss over the period of the guarantee.
78
NOTES TO THE FINANCIAL STATEMENTS (cont’d)For the financial year ended 31 December 2015
ANNUAL REPORT 2015
2 Summary of significant accounting policies (cont’d)
q) Derivative financial instruments
Derivative financial instruments are initially measured at fair value on the contract date, and are remeasured to fair value at subsequent reporting dates.
Changes in the fair value of derivative financial instruments that do not qualify for hedge accounting are recognised in profit or loss as they arise.
r) Share capital
Proceeds from issuance of ordinary shares are recognised as share capital in equity. Incremental costs directly attributable to the issuance of ordinary shares are deducted against share capital.
s) Provisions for other liabilities
Provisions are recognised when the Group has a present legal or constructive obligation as a result of past event, and it is probable that an outflow of economic resources will be required to settle that obligation and the amount can be estimated reliably. Provisions are measured at management’s best estimate of the expenditure required to settle the obligation at the end of the reporting date. Where the effect of the time value of money is material, the amount of the provision shall be discounted to present value using a pre-tax discount rate that reflects the current market assessment of the time value of money and risks specific to the obligation.
When discounting is used, the increase in the provision due to passage of time is recognised as a finance cost in profit or loss.
The Group recognises the estimated liability to repair or replace products still under warranty at the end of the reporting date. This provision is calculated based on historical experience of the level of repairs and replacements.
t) Contingencies
A contingent liability is:
(a) a possible obligation that arises from past events and whose existence will be confirmed only by the occurrence or non-occurrence of one or more uncertain future events not wholly within the control of the Group; or
(b) a present obligation that arises from past events but is not recognised because:
(i) it is not probable that an outflow of resources embodying economic benefits will be required to settle the obligation; or
(ii) the amount of the obligation cannot be measured with sufficient reliability.
A contingent asset is a possible asset that arises from past events and whose existence will be confirmed only by the occurrence or non-occurrence of one or more uncertain future events not wholly within the control of the Group.
Contingent liabilities and assets are not recognised on the statements of financial position of the Group and the Company, except for contingent liabilities assumed in a business combination that are present obligations and which the fair values can be reliably determined.
79
NOTES TO THE FINANCIAL STATEMENTS (cont’d)For the financial year ended 31 December 2015
ANNUAL REPORT 2015
2 Summary of significant accounting policies (cont’d)
u) Borrowing costs
Borrowing costs, which comprise interest and other costs incurred in connection with the borrowing of funds, are capitalised as part of the cost of a qualifying asset if they are directly attributable to the acquisition, construction or production of that asset. Capitalisation of borrowing costs commences when the activities to prepare the asset for its intended use or sale are in progress and the expenditures and borrowing costs are incurred. Borrowing costs are capitalised until the assets are substantially completed for their intended use or sale. All other borrowing costs are recognised in the profit or loss using the effective interest method.
v) Employee benefits
Defined contribution plans
Defined contribution plans are post-employment benefit plans under which the Group pays fixed contributions into separate entities such as the Central Provident Fund, and will have no legal or constructive obligation to pay further contributions once the contributions have been paid. Contributions to defined contribution plans are recognised as an expense in the period in which the related service is performed.
Employee leave entitlement
Employee entitlements to annual leave are recognised when they accrue to employees. A provision is made for the estimated liability for annual leave as a result of services rendered by employees up to the end of the reporting period.
w) Foreign currencies
Functional and presentation currency
Items included in the financial statements of each entity in the Group are measured using the currency of the primary economic environment in which that entity operates (‘the functional currency’). The financial statements of the Group and the Company are presented in Singapore dollar, which is the Company’s functional currency.
Transactions and balances
Transactions in a currency other than the functional currency (“foreign currency”) are translated into the functional currency using the exchange rates prevailing at the dates of the transactions. Currency translation gains and losses resulting from the settlement of such transactions and from the translation at year-end exchange rates of monetary assets and liabilities denominated in foreign currencies are recognised in profit or loss.
Non-monetary items measured at fair values in foreign currencies are translated using the exchange rates at the date when the fair values are determined.
80
NOTES TO THE FINANCIAL STATEMENTS (cont’d)For the financial year ended 31 December 2015
ANNUAL REPORT 2015
2 Summary of significant accounting policies (cont’d)
w) Foreign currencies (cont’d)
Translation of Group entities’ financial statements
The results and financial position of all the Group entities (none of which has the currency of a hyperinflationary economy) that have a functional currency different from the Group’s presentation currency are translated into the presentation currency as follows:
(i) Assets and liabilities are translated at the closing rates at the end of the reporting period;
(ii) Income and expenses are translated at average exchange rates (unless the average is not a reasonable approximation of the cumulative effect of the rates prevailing on the transaction dates, in which case income and expenses are translated using the exchange rates at the dates of the transactions); and
(iii) All resulting exchange differences are recognised in the currency translation reserve within equity.
On consolidation, exchange differences arising from the translation of the net investment in foreign operations (including monetary items that, in substance, form part of the net investment in foreign entities), and of borrowings and other currency instruments designated as hedges of such investments, are recognised in other comprehensive income and accumulated in a separate component of equity under the header Currency Translation Reserve.
Goodwill and fair value adjustments arising on the acquisition of a foreign operation are treated as assets and liabilities of the foreign operation and translated at the closing rate.
On disposal of a foreign group entity, the cumulative amount of the currency translation reserve relating to that particular foreign entity is reclassified from equity and recognised in profit or loss when the gain or loss on disposal is recognised.
x) Dividends
Interim dividends are recorded during the financial year in which they are declared payable.
Final dividends are recorded in the Group’s financial statements in the period in which they are approved by the Company’s shareholders.
y) Government grants
Government grants are recognised at their fair value where there is reasonable assurance that the grant will be received and all attaching conditions will be complied with. Where the grant relates to an asset, the fair value is recognised as deferred capital grant on the statement of financial position and is amortised to profit or loss over the expected useful life of the relevant asset by equal annual instalments.
When the grant relates to an expense item, it is recognised in profit or loss over the period necessary to match them on a systematic basis to the costs that it is intended to compensate.
z) Segment reporting
An operating segment is a component of the Group that engages in business activities from which it may earn revenues and incur expenses, including revenues and expenses that relate to transactions with other components of the Group. Operating segments are reported in a manner consistent with the internal reporting provided to the Group’s chief operating decision maker for making decisions about allocating resources and assessing performance of the operating segments.
81
NOTES TO THE FINANCIAL STATEMENTS (cont’d)For the financial year ended 31 December 2015
ANNUAL REPORT 2015
2 Summary of significant accounting policies (cont’d)
aa) Related parties
A related party is an entity or person that directly or indirectly through one or more intermediaries controls, is controlled by, or is under common or joint control with, the entity in governing the financial and operating policies, or that has an interest in the entity that gives it significant influence over the entity in financial and operating decisions. It also includes members of the key management personnel or close members of the family of any individual referred to herein and others who have the ability to control, jointly control or significantly influence by or for which significant voting power in such entity resides with, directly or indirectly, any such individual.
bb) Non-current assets (or disposal groups) held for sale and discontinued operations
Non-current assets (or disposal groups) are classified as assets held for sale and stated at the lower of carrying amount and fair value less costs to sell if their carrying amount is recovered principally through a sale transaction rather than through continuing use. Any impairment loss on initial classification and subsequent measurement is recognised as an expense. Any subsequent increase in fair value less costs to sell (not exceeding the accumulated impairment loss that has been previously recognised) is recognised in profit or loss.
The assets are not depreciated or amortised while they are classified as held for sale. In addition, equity accounting of associates ceases once classified as held for sale.
A discontinued operation is a component of an entity that either has been disposed of, or that is classified as held for sale and
(a) represents a separate major line of business or geographical area of operations; or(b) is part of a single co-ordinated plan to dispose of a separate major line of business or geographical area of operations;
or(c) is a subsidiary acquired exclusively with a view to resale.
Classification as a discontinued operation occurs upon disposal or when the operation meets the criteria to be classified as held for sale, if earlier. When an operation is classified as a discontinued operation, the comparative statement of comprehensive income is re-presented as if the operation had been discontinued from the start of the comparative year.
cc) Critical accounting judgments and key sources of estimation uncertainty
Critical judgment in applying the entity’s accounting policies
In the process of applying the Group’s accounting policies, management has made the following judgment that has the most significant effect on the amounts recognised in the financial statements (apart from those involving estimations, which are dealt in the subsequent paragraphs).
Functional currency
The Group measures foreign currency transactions in the respective functional currencies of the Company and its subsidiaries. In determining the functional currencies of the entities in the Group, judgment is required by management to determine the primary economic environment in which the entities operate, the entities’ process of determining sales prices and the currency of the country whose competitive forces and regulations mainly influences the prices of its goods and services. Management has assessed that prices are mainly denominated and settled in the respective local currency of the entities of the Group. In addition, most of the entities’ cost base is mainly denominated in their respective local currency. Therefore, management concluded that the functional currency of the entities of the Group is their respective local currency.
82
NOTES TO THE FINANCIAL STATEMENTS (cont’d)For the financial year ended 31 December 2015
ANNUAL REPORT 2015
2 Summary of significant accounting policies (cont’d)
cc) Critical accounting judgments and key sources of estimation uncertainty (cont’d)
Critical judgment in applying the entity’s accounting policies (cont’d)
Joint control over Dream Marine Ship Spare Parts LLC (“DMS”)
As described in Note 12, the Company’s equity interest held in DMS is 34%. However, the Company is entitled to 70% of the net profit of DMS based on the shareholders agreement between the Company and other joint venturers.
The Company has joint control over this investee as under the contractual arrangement, unanimous consent is required from all parties to the agreements for all relevant activities.
Management considered that the joint arrangement is structured as a limited company and provides the Company and the parties to the agreement with rights to the net assets of the limited company under the arrangement. Accordingly, this arrangement is classified as a joint venture.
Discontinued operations
In 2012, the Group discontinued the operations of a subsidiary group in Batam which were reported under the Engineering Services Segment. The subsidiary group consists of BH Marine & Offshore Engineering Pte Ltd, PT. BH Marine & Offshore Engineering and PT. Dwi Utama Mandiri Sukses (collectively “the Batam Subsidiary Group”). Despite ongoing negotiations with potential buyers, the Group has not been able to conclude the sale of all assets (primarily property, plant and equipment) of the Batam Subsidiary Group. In compliance with FRS 105 - Non-current assets held for sale and discontinued operations, the Group has reclassified all property, plant and equipment of the Batam Subsidiary Group to Continuing Operations since financial year 2014. Nevertheless, all income and expenses relating to the Batam Subsidiary Group are accounted for as Discontinued Operations in view that Batam Subsidiary Group has completely ceased business operations.
No change to the above classification is required for the financial year ended 31 December 2015 as it remains the Group’s intention to dispose of the assets of the Batam Subsidiary Group.
Key sources of estimation uncertainty
The key assumptions concerning the future, and other key sources of estimation uncertainty at the end of the reporting period, that have a significant risk of causing a material adjustment to the carrying amounts of assets and liabilities within the next financial year, are discussed below.
Income taxes
Uncertainties exist with respect to the interpretation of complex tax regulations, the amount and timing of future taxable income and deductibility of certain expenditure. Accordingly, there are certain transactions and computations for which the ultimate tax determination is uncertain during the ordinary course of business. The Group recognises liabilities for expected tax issues based on reasonable estimates of whether additional taxes will be due. Where the final tax outcome of these matters is different from the amounts that were initially recognised, such differences will impact the income tax and deferred tax provisions in the period in which such determination is made. The carrying amount of the Group’s income tax payable, deferred tax assets and liabilities at 31 December 2015 are $1,197,000, $44,000 and $915,000 (2014: $1,493,000, $79,000 and $836,000) respectively.
83
NOTES TO THE FINANCIAL STATEMENTS (cont’d)For the financial year ended 31 December 2015
ANNUAL REPORT 2015
2 Summary of significant accounting policies (cont’d)
cc) Critical accounting judgments and key sources of estimation uncertainty (cont’d)
Key sources of estimation uncertainty (cont’d)
Impairment of trade and other receivables
The Group assesses at the end of each reporting period whether there is any objective evidence that a financial asset is impaired. To determine whether there is objective evidence of impairment, the Group considers factors such as the probability of insolvency or significant financial difficulties of the debtor and default or significant delay in payments.
Where there is objective evidence of impairment, the amount and timing of future cash flows are estimated based on historical loss experience for assets with similar credit risk characteristics. The carrying amounts of the Group’s trade and other receivables at 31 December 2015 are disclosed in Notes 20 and 21. If the present value of estimated future cash flows differ from management’s estimates, the Group’s allowance for impairment for trade and other receivables balance at the end of the reporting period will be affected accordingly.
Write down for slow-moving inventories
Management reviews the inventory ageing listing on a periodic basis. This review involves comparison of the carrying amount of the aged inventory items with the respective net realisable value. The purpose is to ascertain whether a write down is required to be made in the financial statements for slow-moving items. The carrying amount of inventories at 31 December 2015 as disclosed in Note 18 is $30,123,000 (2014: $32,761,000) after write-down of $445,000 (2014: $810,000) during the financial year.
Impairment of investments in subsidiaries, joint ventures and associated companies
The Group assesses whether there are any indicators of impairment for its investments in subsidiaries, joint ventures and associated companies at each reporting date. These investments are tested for impairment when there are indicators that the carrying amounts may not be recoverable. An impairment exists when the carrying value of the investments exceeds its recoverable amount, which is the higher of its fair value less costs to sell and its value in use.
When value in use calculations are undertaken, management must estimate the expected future cash flows generated by the investments and choose a suitable discount rate in order to calculate the present value of those cash flows.
The carrying amounts of the investments in subsidiaries, joint ventures and associated companies and disclosed in Notes 11, 12 and 13.
During the financial year, the Group performed an impairment testing on its investment in associated companies using value in use calculations. Based on the impairment test performed, the management is satisfied that the estimated recoverable amount of investment in associated companies is higher than its carrying value and no impairment is required.
The management has considered that a reasonably possible change in two key assumptions, discount rate and terminal year growth rate, will not result in any impairment charge to be recorded.
84
NOTES TO THE FINANCIAL STATEMENTS (cont’d)For the financial year ended 31 December 2015
ANNUAL REPORT 2015
2 Summary of significant accounting policies (cont’d)
cc) Critical accounting judgments and key sources of estimation uncertainty (cont’d)
Key sources of estimation uncertainty (cont’d)
Property, plant and equipment
The Group reviews the useful lives and residual values of property, plant and equipment at each reporting date in accordance with the accounting policy in Note 2(f). The estimation of the useful lives and residual amount involves assumptions concerning the future and estimations of the assets common life expectancies and expected level of usage.
During the financial year, the management determined that the estimated residual amount for the leasehold land in Batam, Indonesia should be revised as the current market condition suggested that the estimated residual amount for the leasehold land at the end of lease period should be higher than previously estimated. The financial effect of this reassessment, assuming the assets are held until the end of their estimated useful lives, resulted in the decrease in depreciation expense in the current financial year and annual depreciation charge in future periods by $32,000 and $128,000 respectively.
The net carrying amount of property, plant and equipment at 31 December 2015 and annual depreciation charge for the financial year ended 31 December 2015 are disclosed in Note 10 and Note 7 respectively.
Construction contracts
The Group recognises contract revenue by reference to the stage of completion of the contract activity at the end of reporting period, when the outcome of a construction contract can be estimated reliably. The stage of completion is measured by reference to the proportion of contract costs incurred for work performed to-date compared to the estimated total costs for the contract.
Significant assumptions are required in determining the stage of completion, the extent of the contract costs incurred, the estimated total contract revenue and contract costs, as well as the recoverability of the contracts. Total contract revenue also includes an estimation of the variation works and claims that are recoverable from the customers. In making these estimates, the Group relied on past experience and knowledge of the project managers/engineers. The carrying amounts of assets and liabilities arising from construction contracts at 31 December 2015 are disclosed in Note 19.
3 Revenue
Group2015 2014
$’000 $’000Restated
Sales of goods 55,577 74,302
85
NOTES TO THE FINANCIAL STATEMENTS (cont’d)For the financial year ended 31 December 2015
ANNUAL REPORT 2015
4 Finance costs
Group2015 2014
$’000 $’000Restated
Interests on borrowings- finance leases 23 22- loans 224 767- overdraft 4 134- trust receipts 79 135- unwinding of discount – 9
330 1,067
5 Tax expense/(credit)
Tax expense/(credit) attributable to losses is made up of:
Group2015 2014
$’000 $’000Restated
From continuing operations- Current income tax 910 1,101- Deferred tax (Note 14) 201 (131)
1,111 970
Over provision of income tax in prior year (461) (2,031)
650 (1,061)
From discontinued operations (Note 6)- Income tax 81 349- Deferred tax (Note 14) (30) 3- Over provision of income tax in prior year – (61)- Under provision of deferred tax in prior year (Note 14) – 11
51 302
701 (759)
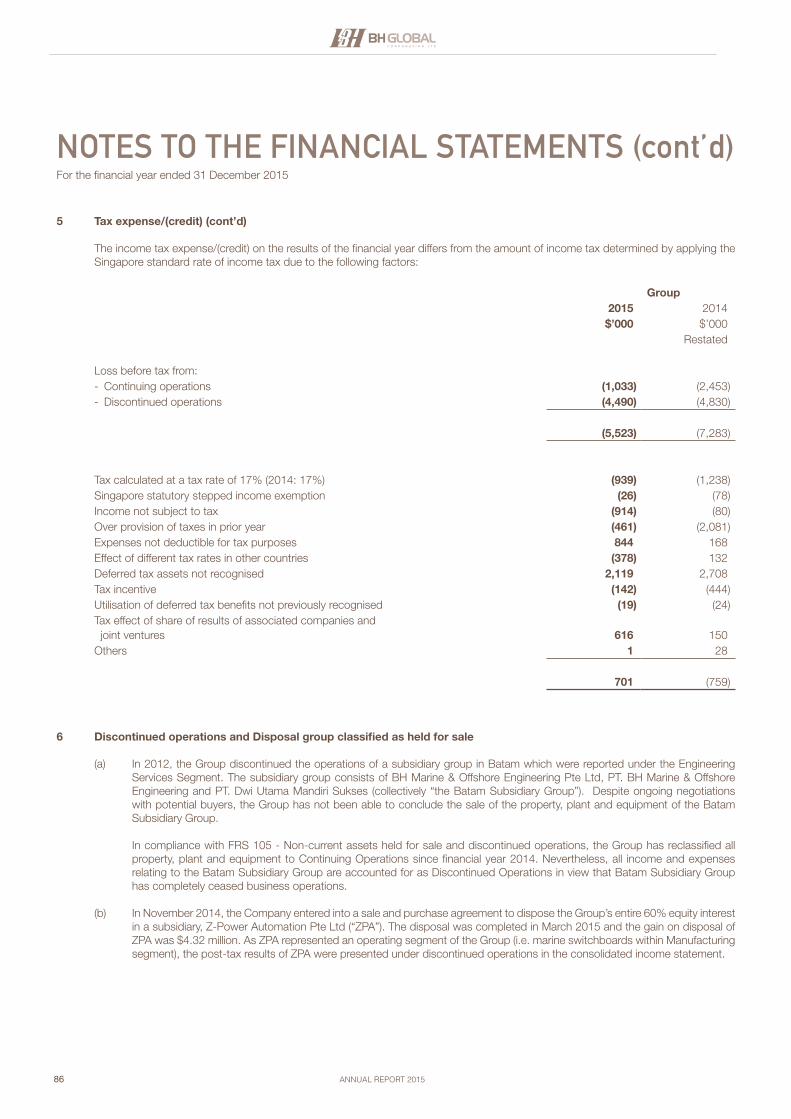
86
NOTES TO THE FINANCIAL STATEMENTS (cont’d)For the financial year ended 31 December 2015
ANNUAL REPORT 2015
5 Tax expense/(credit) (cont’d)
The income tax expense/(credit) on the results of the financial year differs from the amount of income tax determined by applying the Singapore standard rate of income tax due to the following factors:
Group2015 2014
$’000 $’000Restated
Loss before tax from:- Continuing operations (1,033) (2,453)- Discontinued operations (4,490) (4,830)
(5,523) (7,283)
Tax calculated at a tax rate of 17% (2014: 17%) (939) (1,238)Singapore statutory stepped income exemption (26) (78)Income not subject to tax (914) (80)Over provision of taxes in prior year (461) (2,081)Expenses not deductible for tax purposes 844 168Effect of different tax rates in other countries (378) 132Deferred tax assets not recognised 2,119 2,708Tax incentive (142) (444)Utilisation of deferred tax benefits not previously recognised (19) (24)Tax effect of share of results of associated companies and joint ventures 616 150Others 1 28
701 (759)
6 Discontinued operations and Disposal group classified as held for sale
(a) In 2012, the Group discontinued the operations of a subsidiary group in Batam which were reported under the Engineering Services Segment. The subsidiary group consists of BH Marine & Offshore Engineering Pte Ltd, PT. BH Marine & Offshore Engineering and PT. Dwi Utama Mandiri Sukses (collectively “the Batam Subsidiary Group”). Despite ongoing negotiations with potential buyers, the Group has not been able to conclude the sale of the property, plant and equipment of the Batam Subsidiary Group.
In compliance with FRS 105 - Non-current assets held for sale and discontinued operations, the Group has reclassified all property, plant and equipment to Continuing Operations since financial year 2014. Nevertheless, all income and expenses relating to the Batam Subsidiary Group are accounted for as Discontinued Operations in view that Batam Subsidiary Group has completely ceased business operations.
(b) In November 2014, the Company entered into a sale and purchase agreement to dispose the Group’s entire 60% equity interest in a subsidiary, Z-Power Automation Pte Ltd (“ZPA”). The disposal was completed in March 2015 and the gain on disposal of ZPA was $4.32 million. As ZPA represented an operating segment of the Group (i.e. marine switchboards within Manufacturing segment), the post-tax results of ZPA were presented under discontinued operations in the consolidated income statement.
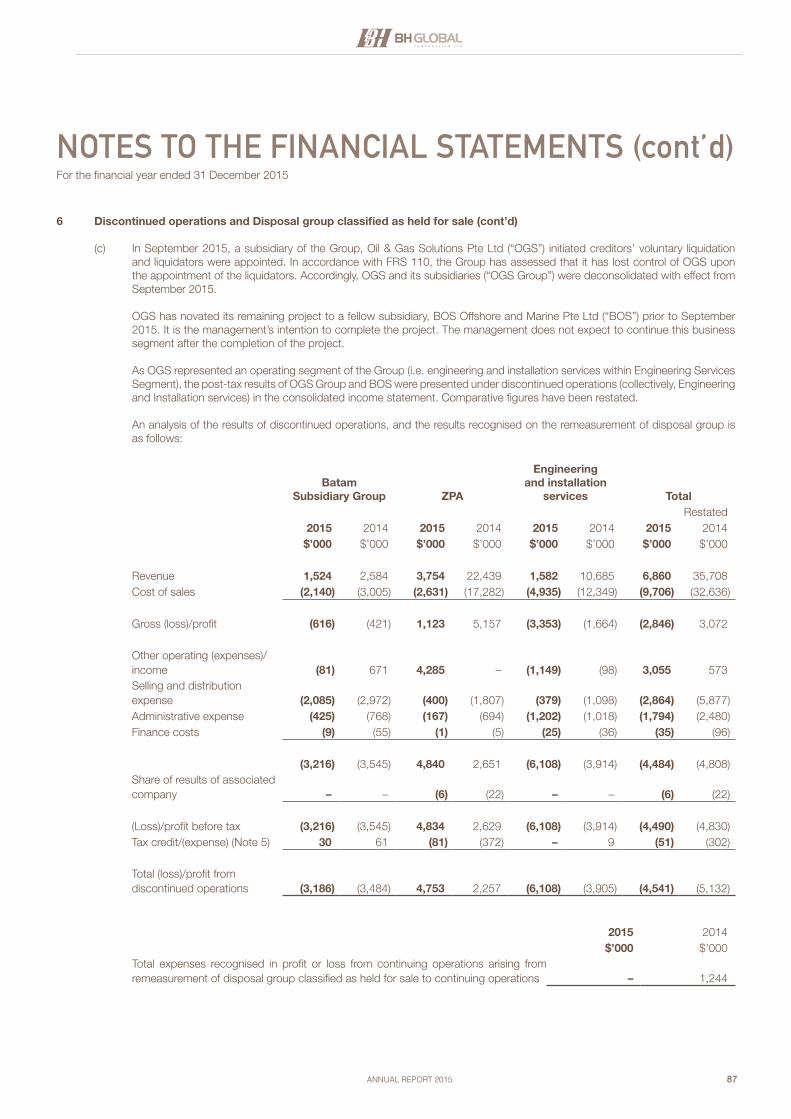
87
NOTES TO THE FINANCIAL STATEMENTS (cont’d)For the financial year ended 31 December 2015
ANNUAL REPORT 2015
6 Discontinued operations and Disposal group classified as held for sale (cont’d)
(c) In September 2015, a subsidiary of the Group, Oil & Gas Solutions Pte Ltd (“OGS”) initiated creditors’ voluntary liquidation and liquidators were appointed. In accordance with FRS 110, the Group has assessed that it has lost control of OGS upon the appointment of the liquidators. Accordingly, OGS and its subsidiaries (“OGS Group”) were deconsolidated with effect from September 2015.
OGS has novated its remaining project to a fellow subsidiary, BOS Offshore and Marine Pte Ltd (“BOS”) prior to September 2015. It is the management’s intention to complete the project. The management does not expect to continue this business segment after the completion of the project.
As OGS represented an operating segment of the Group (i.e. engineering and installation services within Engineering Services Segment), the post-tax results of OGS Group and BOS were presented under discontinued operations (collectively, Engineering and Installation services) in the consolidated income statement. Comparative figures have been restated.
An analysis of the results of discontinued operations, and the results recognised on the remeasurement of disposal group is as follows:
Batam Subsidiary Group ZPA
Engineering and installation
services TotalRestated
2015 2014 2015 2014 2015 2014 2015 2014$’000 $’000 $’000 $’000 $’000 $’000 $’000 $’000
Revenue 1,524 2,584 3,754 22,439 1,582 10,685 6,860 35,708Cost of sales (2,140) (3,005) (2,631) (17,282) (4,935) (12,349) (9,706) (32,636)
Gross (loss)/profit (616) (421) 1,123 5,157 (3,353) (1,664) (2,846) 3,072
Other operating (expenses)/income (81) 671 4,285 – (1,149) (98) 3,055 573Selling and distribution expense (2,085) (2,972) (400) (1,807) (379) (1,098) (2,864) (5,877)Administrative expense (425) (768) (167) (694) (1,202) (1,018) (1,794) (2,480)Finance costs (9) (55) (1) (5) (25) (36) (35) (96)
(3,216) (3,545) 4,840 2,651 (6,108) (3,914) (4,484) (4,808)Share of results of associated company – – (6) (22) – – (6) (22)
(Loss)/profit before tax (3,216) (3,545) 4,834 2,629 (6,108) (3,914) (4,490) (4,830)Tax credit/(expense) (Note 5) 30 61 (81) (372) – 9 (51) (302)
Total (loss)/profit from discontinued operations (3,186) (3,484) 4,753 2,257 (6,108) (3,905) (4,541) (5,132)
2015 2014$’000 $’000
Total expenses recognised in profit or loss from continuing operations arising from remeasurement of disposal group classified as held for sale to continuing operations – 1,244
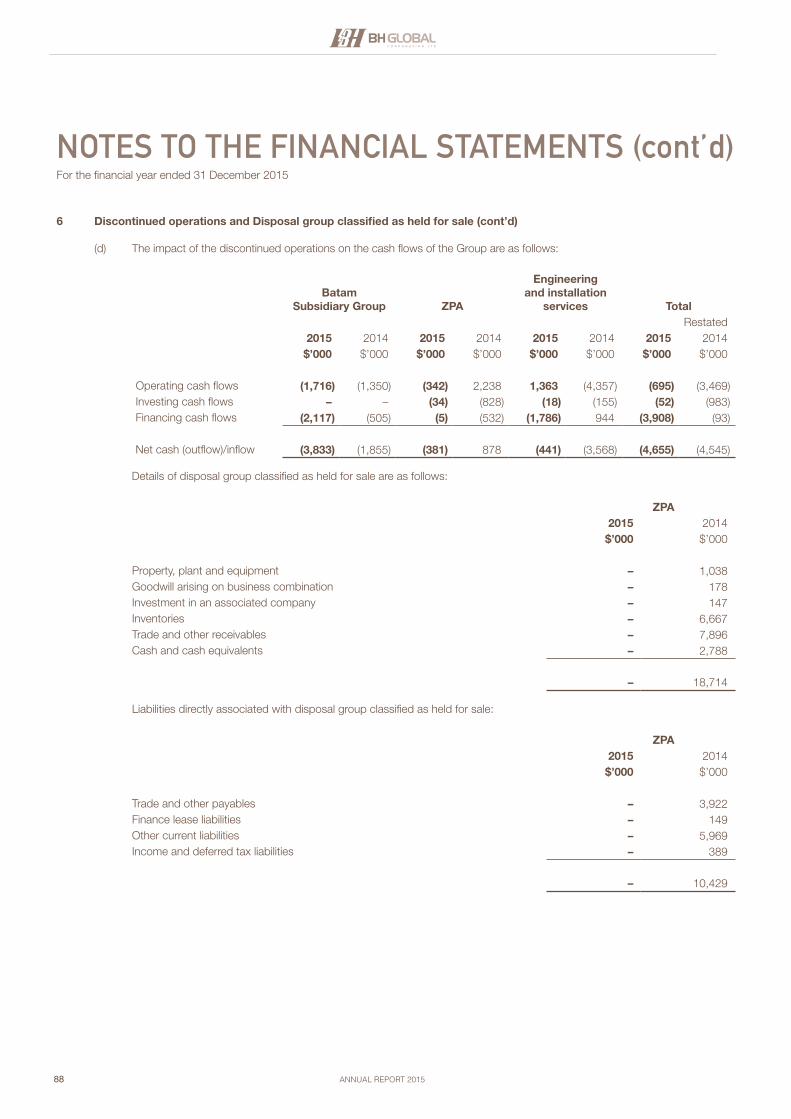
88
NOTES TO THE FINANCIAL STATEMENTS (cont’d)For the financial year ended 31 December 2015
ANNUAL REPORT 2015
6 Discontinued operations and Disposal group classified as held for sale (cont’d)
(d) The impact of the discontinued operations on the cash flows of the Group are as follows:
Batam Subsidiary Group ZPA
Engineering and installation
services TotalRestated
2015 2014 2015 2014 2015 2014 2015 2014$’000 $’000 $’000 $’000 $’000 $’000 $’000 $’000
Operating cash flows (1,716) (1,350) (342) 2,238 1,363 (4,357) (695) (3,469)Investing cash flows – – (34) (828) (18) (155) (52) (983)Financing cash flows (2,117) (505) (5) (532) (1,786) 944 (3,908) (93)
Net cash (outflow)/inflow (3,833) (1,855) (381) 878 (441) (3,568) (4,655) (4,545)
Details of disposal group classified as held for sale are as follows:
ZPA2015 2014
$’000 $’000
Property, plant and equipment – 1,038Goodwill arising on business combination – 178Investment in an associated company – 147Inventories – 6,667Trade and other receivables – 7,896Cash and cash equivalents – 2,788
– 18,714
Liabilities directly associated with disposal group classified as held for sale:
ZPA2015 2014
$’000 $’000
Trade and other payables – 3,922Finance lease liabilities – 149Other current liabilities – 5,969Income and deferred tax liabilities – 389
– 10,429
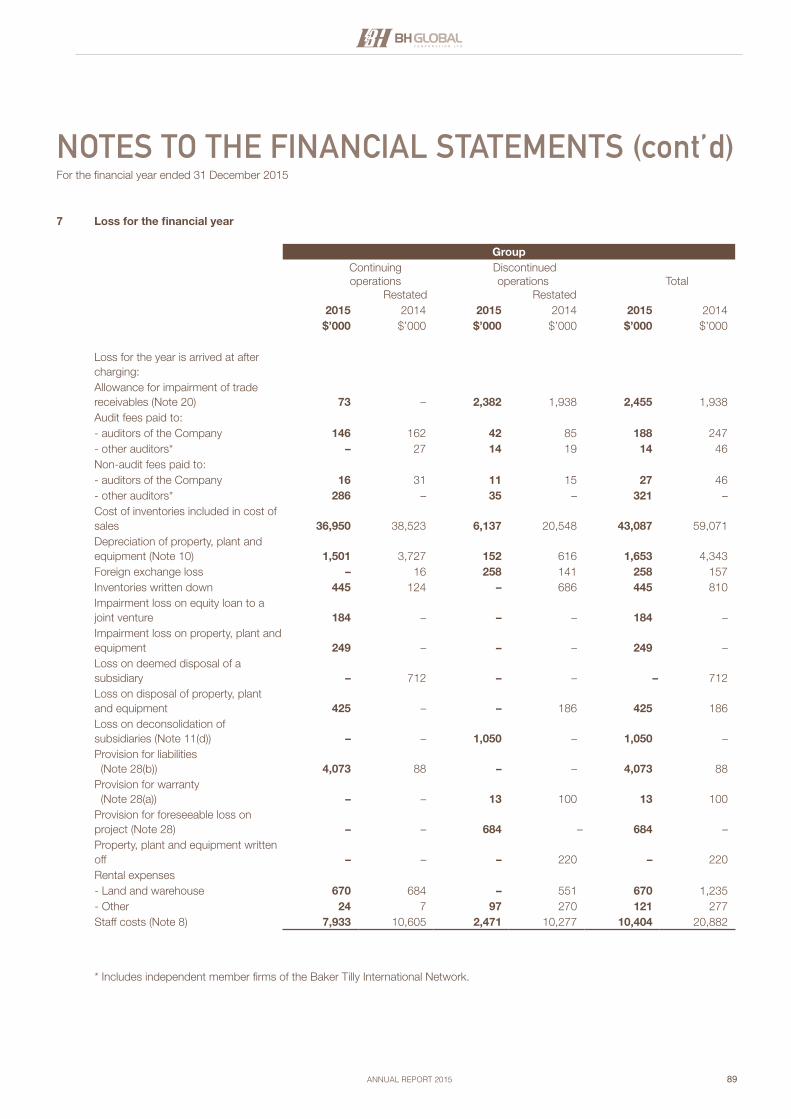
89
NOTES TO THE FINANCIAL STATEMENTS (cont’d)For the financial year ended 31 December 2015
ANNUAL REPORT 2015
7 Loss for the financial year
Group Continuing operations
Restated
Discontinued operations
Restated Total
2015 2014 2015 2014 2015 2014$’000 $’000 $’000 $’000 $’000 $’000
Loss for the year is arrived at after charging:Allowance for impairment of trade receivables (Note 20) 73 – 2,382 1,938 2,455 1,938Audit fees paid to:- auditors of the Company 146 162 42 85 188 247- other auditors* – 27 14 19 14 46Non-audit fees paid to: - auditors of the Company 16 31 11 15 27 46- other auditors* 286 – 35 – 321 –Cost of inventories included in cost of sales 36,950 38,523 6,137 20,548 43,087 59,071Depreciation of property, plant and equipment (Note 10) 1,501 3,727 152 616 1,653 4,343Foreign exchange loss – 16 258 141 258 157Inventories written down 445 124 – 686 445 810Impairment loss on equity loan to a joint venture 184 – – – 184 –Impairment loss on property, plant and equipment 249 – – – 249 –Loss on deemed disposal of a subsidiary – 712 – – – 712Loss on disposal of property, plant and equipment 425 – – 186 425 186Loss on deconsolidation of subsidiaries (Note 11(d)) – – 1,050 – 1,050 –Provision for liabilities (Note 28(b)) 4,073 88 – – 4,073 88Provision for warranty (Note 28(a)) – – 13 100 13 100Provision for foreseeable loss on project (Note 28) – – 684 – 684 –Property, plant and equipment written off – – – 220 – 220Rental expenses- Land and warehouse 670 684 – 551 670 1,235- Other 24 7 97 270 121 277Staff costs (Note 8) 7,933 10,605 2,471 10,277 10,404 20,882
* Includes independent member firms of the Baker Tilly International Network.
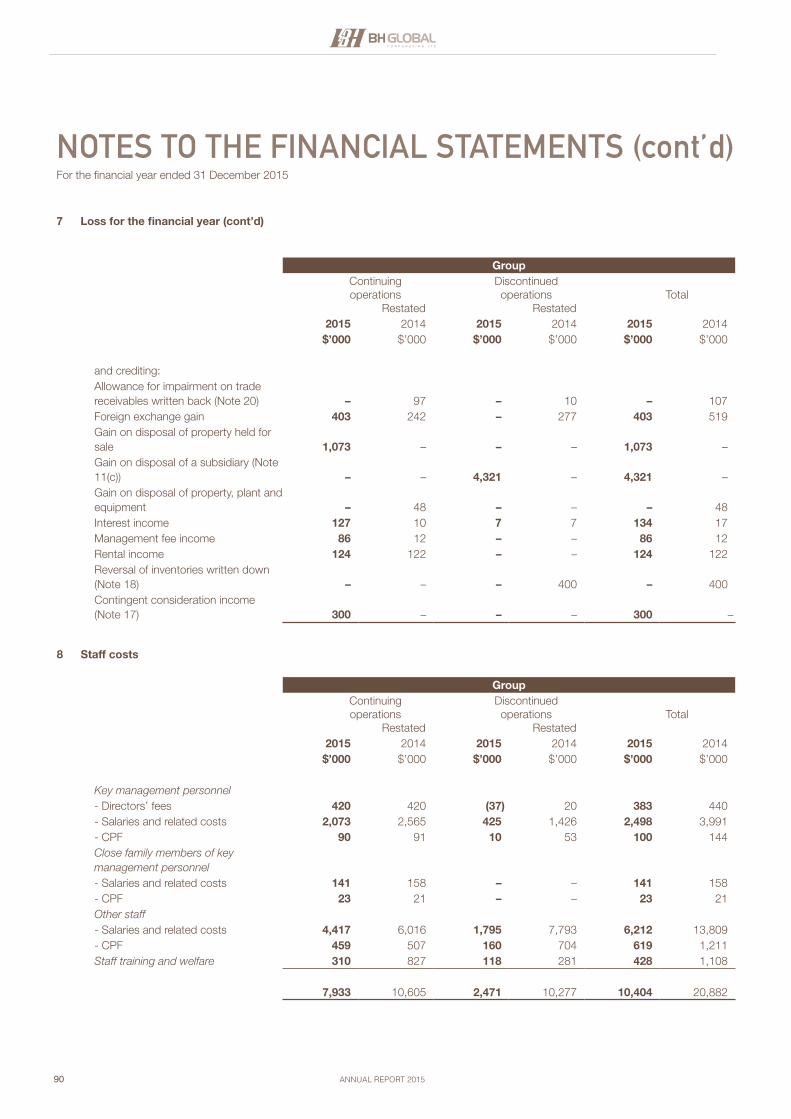
90
NOTES TO THE FINANCIAL STATEMENTS (cont’d)For the financial year ended 31 December 2015
ANNUAL REPORT 2015
7 Loss for the financial year (cont’d)
Group Continuing operations
Restated
Discontinued operations
Restated Total
2015 2014 2015 2014 2015 2014$’000 $’000 $’000 $’000 $’000 $’000
and crediting:Allowance for impairment on trade receivables written back (Note 20) – 97 – 10 – 107Foreign exchange gain 403 242 – 277 403 519Gain on disposal of property held for sale 1,073 – – – 1,073 –Gain on disposal of a subsidiary (Note 11(c)) – – 4,321 – 4,321 –Gain on disposal of property, plant and equipment – 48 – – – 48Interest income 127 10 7 7 134 17Management fee income 86 12 – – 86 12Rental income 124 122 – – 124 122Reversal of inventories written down (Note 18) – – – 400 – 400Contingent consideration income (Note 17) 300 – – – 300 –
8 Staff costs
Group Continuing operations
Restated
Discontinued operations
Restated Total
2015 2014 2015 2014 2015 2014$’000 $’000 $’000 $’000 $’000 $’000
Key management personnel - Directors’ fees 420 420 (37) 20 383 440- Salaries and related costs 2,073 2,565 425 1,426 2,498 3,991- CPF 90 91 10 53 100 144Close family members of key management personnel- Salaries and related costs 141 158 – – 141 158- CPF 23 21 – – 23 21Other staff- Salaries and related costs 4,417 6,016 1,795 7,793 6,212 13,809- CPF 459 507 160 704 619 1,211Staff training and welfare 310 827 118 281 428 1,108
7,933 10,605 2,471 10,277 10,404 20,882
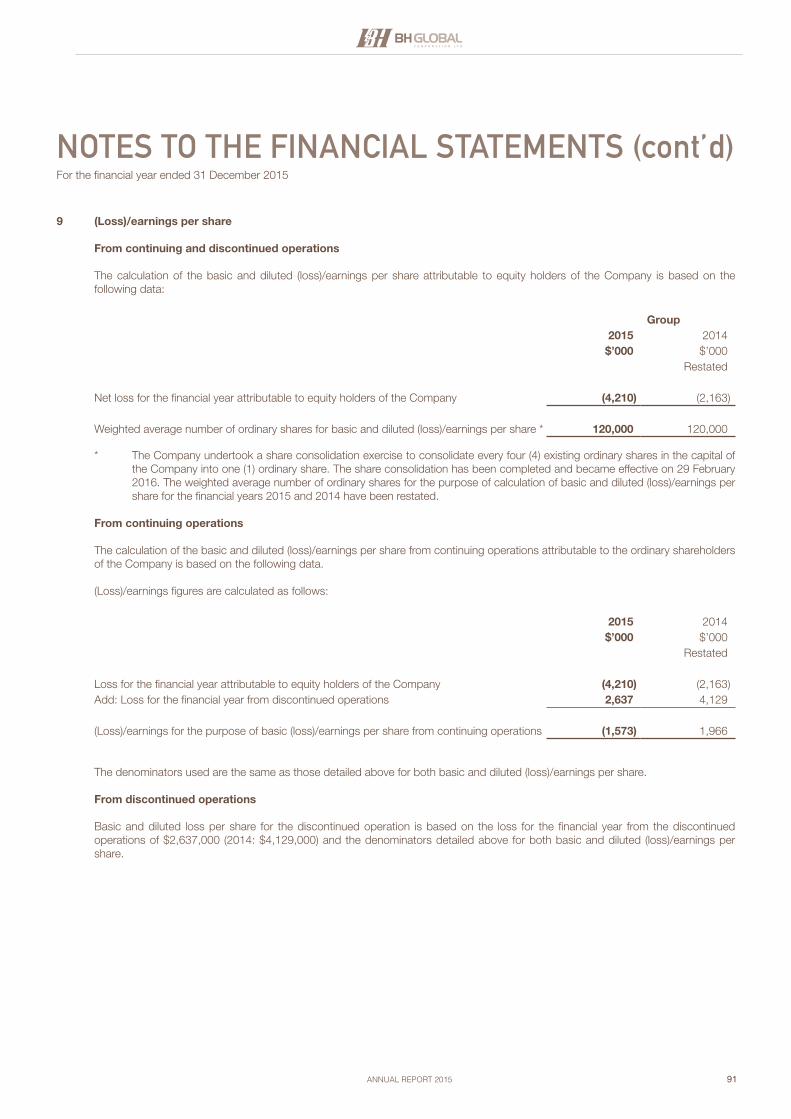
91
NOTES TO THE FINANCIAL STATEMENTS (cont’d)For the financial year ended 31 December 2015
ANNUAL REPORT 2015
9 (Loss)/earnings per share
From continuing and discontinued operations
The calculation of the basic and diluted (loss)/earnings per share attributable to equity holders of the Company is based on the following data:
Group2015 2014
$’000 $’000Restated
Net loss for the financial year attributable to equity holders of the Company (4,210) (2,163)
Weighted average number of ordinary shares for basic and diluted (loss)/earnings per share * 120,000 120,000
* The Company undertook a share consolidation exercise to consolidate every four (4) existing ordinary shares in the capital of the Company into one (1) ordinary share. The share consolidation has been completed and became effective on 29 February 2016. The weighted average number of ordinary shares for the purpose of calculation of basic and diluted (loss)/earnings per share for the financial years 2015 and 2014 have been restated.
From continuing operations
The calculation of the basic and diluted (loss)/earnings per share from continuing operations attributable to the ordinary shareholders of the Company is based on the following data.
(Loss)/earnings figures are calculated as follows:
2015 2014$’000 $’000
Restated
Loss for the financial year attributable to equity holders of the Company (4,210) (2,163)Add: Loss for the financial year from discontinued operations 2,637 4,129
(Loss)/earnings for the purpose of basic (loss)/earnings per share from continuing operations (1,573) 1,966
The denominators used are the same as those detailed above for both basic and diluted (loss)/earnings per share.
From discontinued operations
Basic and diluted loss per share for the discontinued operation is based on the loss for the financial year from the discontinued operations of $2,637,000 (2014: $4,129,000) and the denominators detailed above for both basic and diluted (loss)/earnings per share.
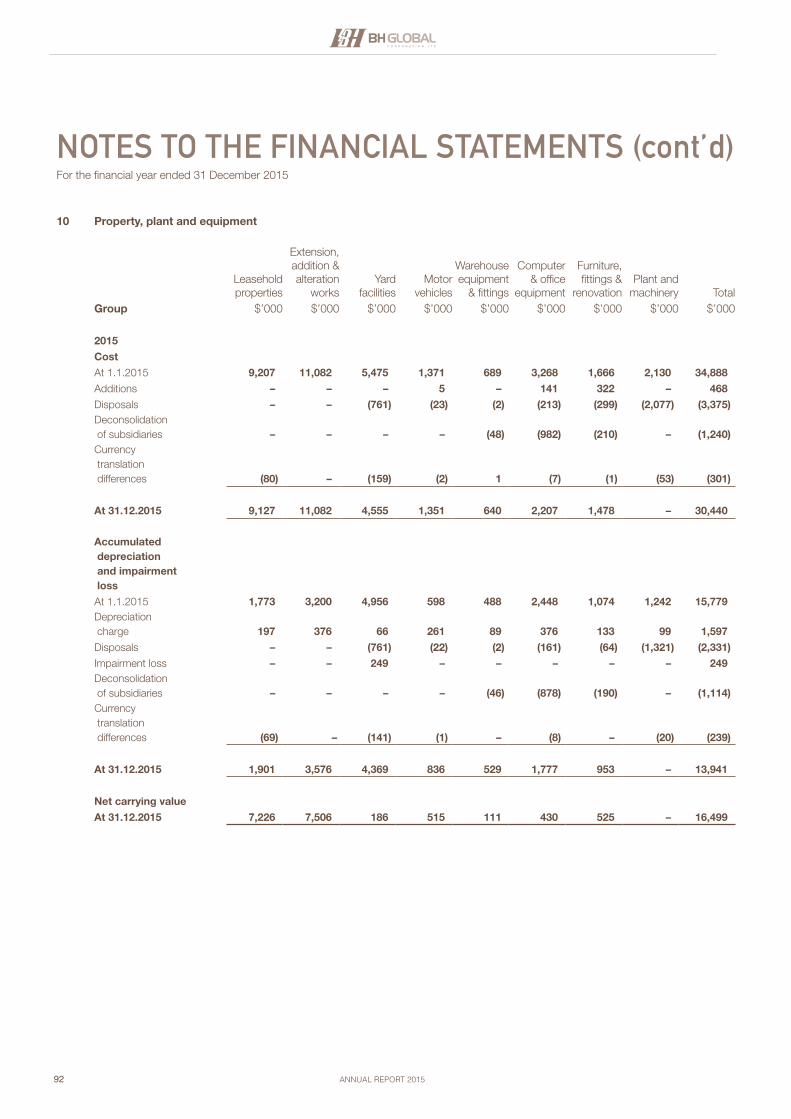
92
NOTES TO THE FINANCIAL STATEMENTS (cont’d)For the financial year ended 31 December 2015
ANNUAL REPORT 2015
10 Property, plant and equipment
Leasehold properties
Extension, addition & alteration
worksYard
facilitiesMotor
vehicles
Warehouse equipment
& fittings
Computer & office
equipment
Furniture, fittings &
renovationPlant and
machinery TotalGroup $’000 $’000 $’000 $’000 $’000 $’000 $’000 $’000 $’000
2015
Cost
At 1.1.2015 9,207 11,082 5,475 1,371 689 3,268 1,666 2,130 34,888
Additions – – – 5 – 141 322 – 468
Disposals – – (761) (23) (2) (213) (299) (2,077) (3,375)Deconsolidation of subsidiaries – – – – (48) (982) (210) – (1,240)Currency translation differences (80) – (159) (2) 1 (7) (1) (53) (301)
At 31.12.2015 9,127 11,082 4,555 1,351 640 2,207 1,478 – 30,440
Accumulated depreciation and impairment loss
At 1.1.2015 1,773 3,200 4,956 598 488 2,448 1,074 1,242 15,779Depreciation charge 197 376 66 261 89 376 133 99 1,597
Disposals – – (761) (22) (2) (161) (64) (1,321) (2,331)
Impairment loss – – 249 – – – – – 249Deconsolidation of subsidiaries – – – – (46) (878) (190) – (1,114)Currency translation differences (69) – (141) (1) – (8) – (20) (239)
At 31.12.2015 1,901 3,576 4,369 836 529 1,777 953 – 13,941
Net carrying value
At 31.12.2015 7,226 7,506 186 515 111 430 525 – 16,499
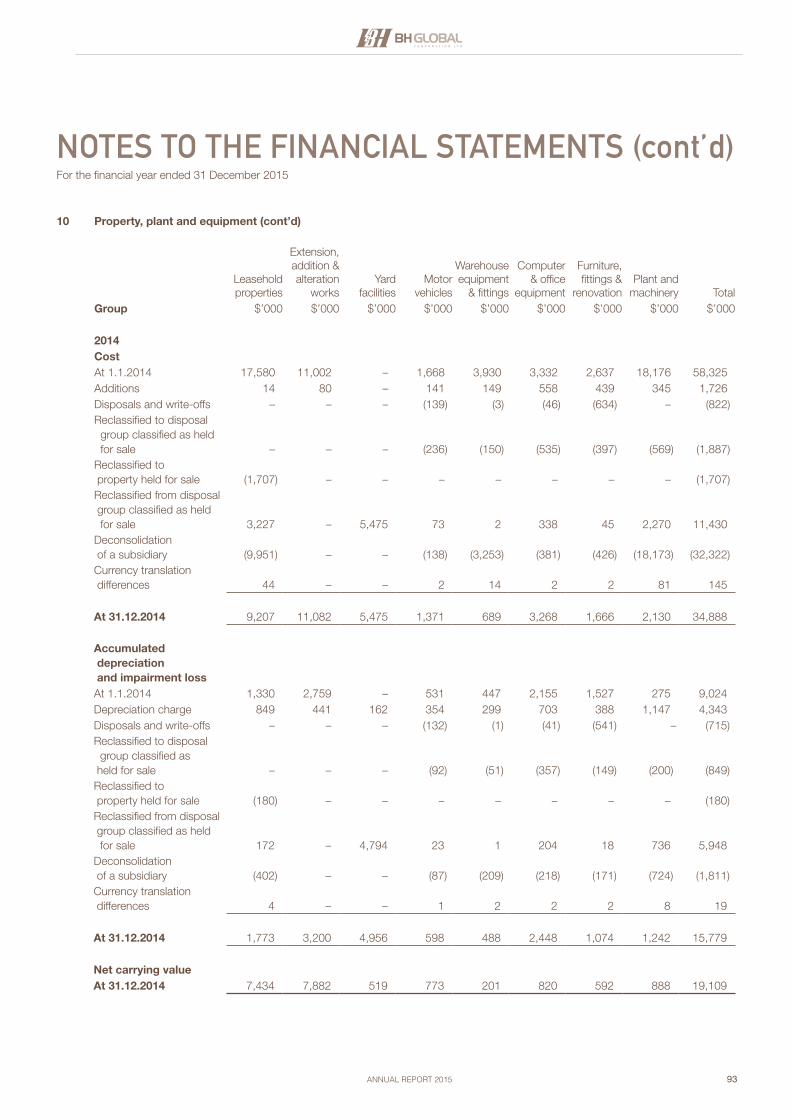
93
NOTES TO THE FINANCIAL STATEMENTS (cont’d)For the financial year ended 31 December 2015
ANNUAL REPORT 2015
10 Property, plant and equipment (cont’d)
Leasehold properties
Extension, addition & alteration
worksYard
facilitiesMotor
vehicles
Warehouse equipment
& fittings
Computer & office
equipment
Furniture, fittings &
renovationPlant and
machinery TotalGroup $’000 $’000 $’000 $’000 $’000 $’000 $’000 $’000 $’000
2014CostAt 1.1.2014 17,580 11,002 – 1,668 3,930 3,332 2,637 18,176 58,325Additions 14 80 – 141 149 558 439 345 1,726Disposals and write-offs – – – (139) (3) (46) (634) – (822)Reclassified to disposal group classified as held for sale – – – (236) (150) (535) (397) (569) (1,887)Reclassified to property held for sale (1,707) – – – – – – – (1,707)Reclassified from disposal group classified as held for sale 3,227 – 5,475 73 2 338 45 2,270 11,430Deconsolidation of a subsidiary (9,951) – – (138) (3,253) (381) (426) (18,173) (32,322)Currency translation differences 44 – – 2 14 2 2 81 145
At 31.12.2014 9,207 11,082 5,475 1,371 689 3,268 1,666 2,130 34,888
Accumulated depreciation and impairment lossAt 1.1.2014 1,330 2,759 – 531 447 2,155 1,527 275 9,024Depreciation charge 849 441 162 354 299 703 388 1,147 4,343Disposals and write-offs – – – (132) (1) (41) (541) – (715)Reclassified to disposal group classified as held for sale – – – (92) (51) (357) (149) (200) (849)Reclassified to property held for sale (180) – – – – – – – (180)Reclassified from disposal group classified as held for sale 172 – 4,794 23 1 204 18 736 5,948Deconsolidation of a subsidiary (402) – – (87) (209) (218) (171) (724) (1,811)Currency translation differences 4 – – 1 2 2 2 8 19
At 31.12.2014 1,773 3,200 4,956 598 488 2,448 1,074 1,242 15,779
Net carrying valueAt 31.12.2014 7,434 7,882 519 773 201 820 592 888 19,109
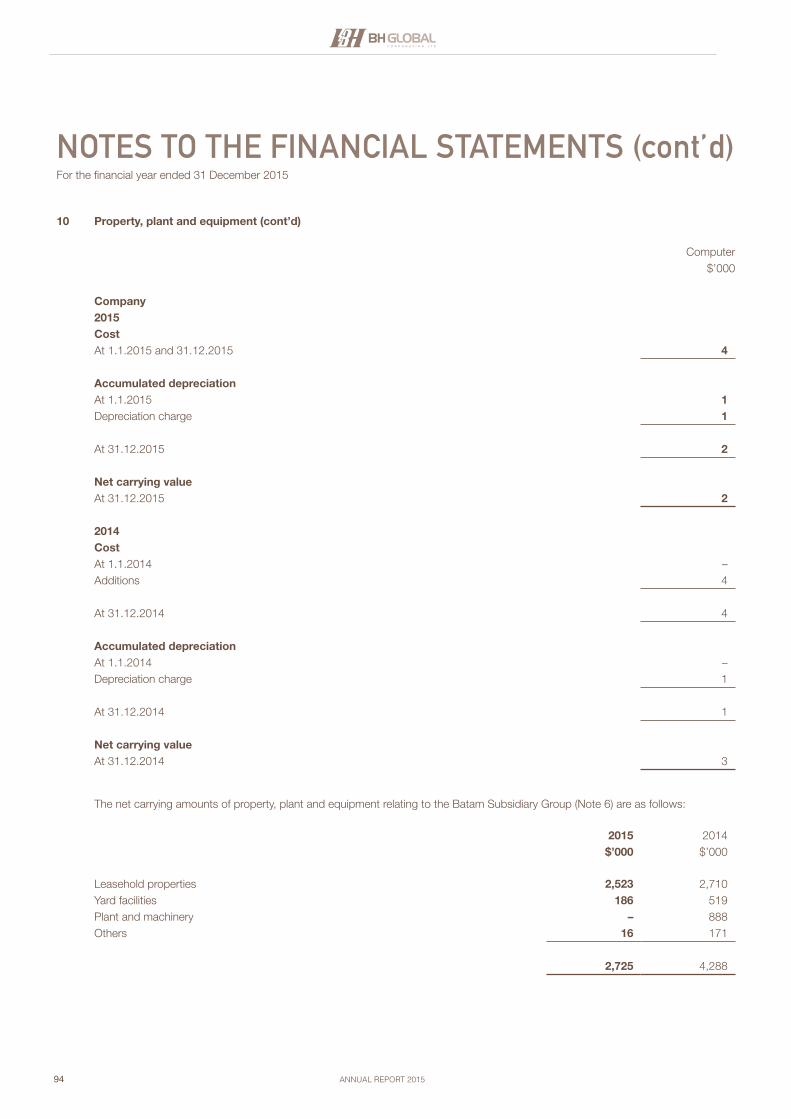
94
NOTES TO THE FINANCIAL STATEMENTS (cont’d)For the financial year ended 31 December 2015
ANNUAL REPORT 2015
10 Property, plant and equipment (cont’d)
Computer$’000
Company2015CostAt 1.1.2015 and 31.12.2015 4
Accumulated depreciationAt 1.1.2015 1Depreciation charge 1
At 31.12.2015 2
Net carrying valueAt 31.12.2015 2
2014CostAt 1.1.2014 –Additions 4
At 31.12.2014 4
Accumulated depreciationAt 1.1.2014 –Depreciation charge 1
At 31.12.2014 1
Net carrying valueAt 31.12.2014 3
The net carrying amounts of property, plant and equipment relating to the Batam Subsidiary Group (Note 6) are as follows:
2015 2014$’000 $’000
Leasehold properties 2,523 2,710Yard facilities 186 519Plant and machinery – 888Others 16 171
2,725 4,288
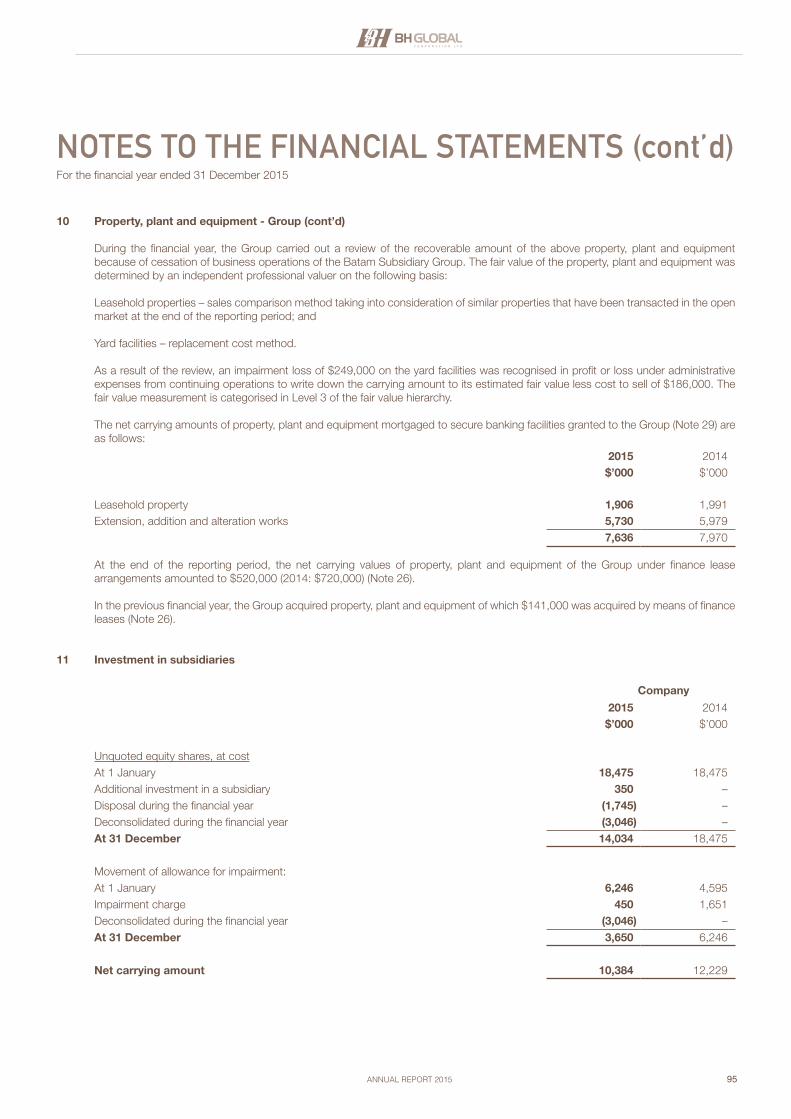
95
NOTES TO THE FINANCIAL STATEMENTS (cont’d)For the financial year ended 31 December 2015
ANNUAL REPORT 2015
10 Property, plant and equipment - Group (cont’d)
During the financial year, the Group carried out a review of the recoverable amount of the above property, plant and equipment because of cessation of business operations of the Batam Subsidiary Group. The fair value of the property, plant and equipment was determined by an independent professional valuer on the following basis: Leasehold properties – sales comparison method taking into consideration of similar properties that have been transacted in the open market at the end of the reporting period; and
Yard facilities – replacement cost method.
As a result of the review, an impairment loss of $249,000 on the yard facilities was recognised in profit or loss under administrative expenses from continuing operations to write down the carrying amount to its estimated fair value less cost to sell of $186,000. The fair value measurement is categorised in Level 3 of the fair value hierarchy.
The net carrying amounts of property, plant and equipment mortgaged to secure banking facilities granted to the Group (Note 29) are as follows:
2015 2014$’000 $’000
Leasehold property 1,906 1,991Extension, addition and alteration works 5,730 5,979
7,636 7,970
At the end of the reporting period, the net carrying values of property, plant and equipment of the Group under finance lease arrangements amounted to $520,000 (2014: $720,000) (Note 26).
In the previous financial year, the Group acquired property, plant and equipment of which $141,000 was acquired by means of finance leases (Note 26).
11 Investment in subsidiaries
Company
2015 2014$’000 $’000
Unquoted equity shares, at costAt 1 January 18,475 18,475Additional investment in a subsidiary 350 –Disposal during the financial year (1,745) –Deconsolidated during the financial year (3,046) –At 31 December 14,034 18,475
Movement of allowance for impairment:At 1 January 6,246 4,595Impairment charge 450 1,651Deconsolidated during the financial year (3,046) –At 31 December 3,650 6,246
Net carrying amount 10,384 12,229
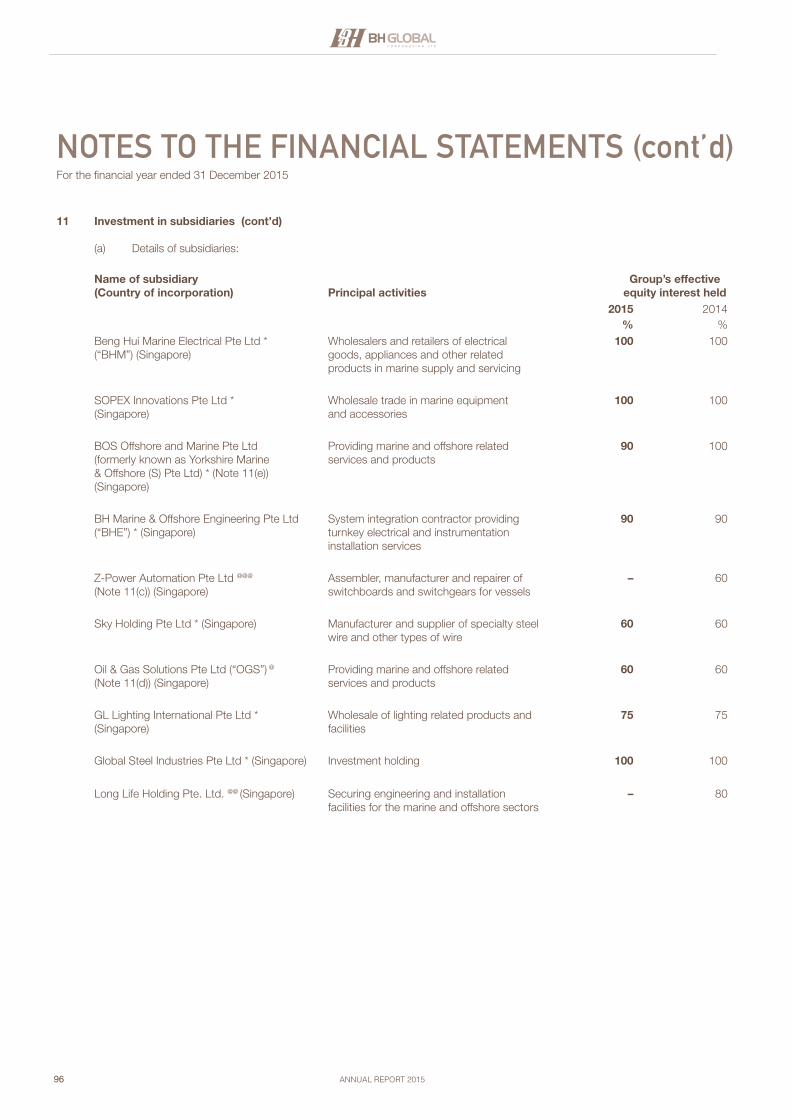
96
NOTES TO THE FINANCIAL STATEMENTS (cont’d)For the financial year ended 31 December 2015
ANNUAL REPORT 2015
11 Investment in subsidiaries (cont’d)
(a) Details of subsidiaries:
Name of subsidiary (Country of incorporation) Principal activities
Group’s effective equity interest held
2015 2014% %
Beng Hui Marine Electrical Pte Ltd * (“BHM”) (Singapore)
Wholesalers and retailers of electrical goods, appliances and other related products in marine supply and servicing
100 100
SOPEX Innovations Pte Ltd * (Singapore)
Wholesale trade in marine equipment and accessories
100 100
BOS Offshore and Marine Pte Ltd (formerly known as Yorkshire Marine & Offshore (S) Pte Ltd) * (Note 11(e)) (Singapore)
Providing marine and offshore related services and products
90 100
BH Marine & Offshore Engineering Pte Ltd (“BHE”) * (Singapore)
System integration contractor providing turnkey electrical and instrumentation installation services
90 90
Z-Power Automation Pte Ltd @@@ (Note 11(c)) (Singapore)
Assembler, manufacturer and repairer of switchboards and switchgears for vessels
– 60
Sky Holding Pte Ltd * (Singapore) Manufacturer and supplier of specialty steel wire and other types of wire
60 60
Oil & Gas Solutions Pte Ltd (“OGS”) @ (Note 11(d)) (Singapore)
Providing marine and offshore related services and products
60 60
GL Lighting International Pte Ltd * (Singapore)
Wholesale of lighting related products and facilities
75 75
Global Steel Industries Pte Ltd * (Singapore) Investment holding 100 100
Long Life Holding Pte. Ltd. @@ (Singapore) Securing engineering and installation facilities for the marine and offshore sectors
– 80
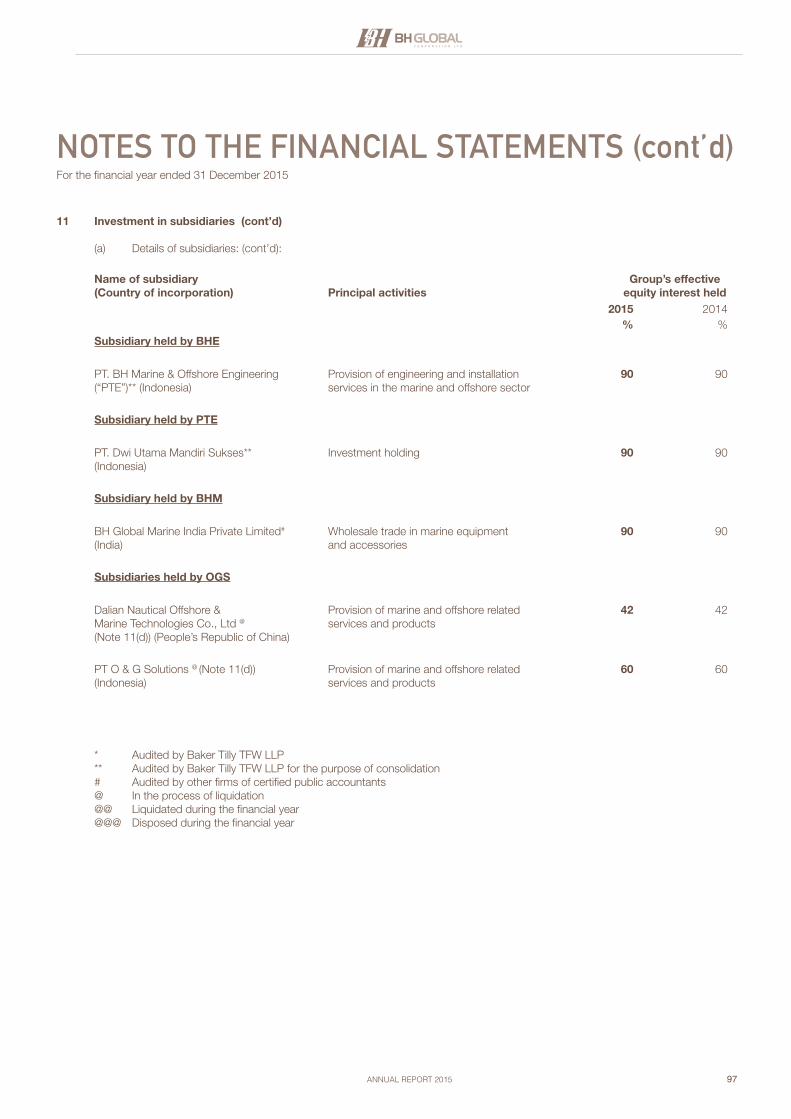
97
NOTES TO THE FINANCIAL STATEMENTS (cont’d)For the financial year ended 31 December 2015
ANNUAL REPORT 2015
11 Investment in subsidiaries (cont’d)
(a) Details of subsidiaries: (cont’d):
Name of subsidiary (Country of incorporation) Principal activities
Group’s effective equity interest held
2015 2014% %
Subsidiary held by BHE
PT. BH Marine & Offshore Engineering (“PTE”)** (Indonesia)
Provision of engineering and installation services in the marine and offshore sector
90 90
Subsidiary held by PTE
PT. Dwi Utama Mandiri Sukses** (Indonesia)
Investment holding 90 90
Subsidiary held by BHM
BH Global Marine India Private Limited#
(India)Wholesale trade in marine equipment and accessories
90 90
Subsidiaries held by OGS
Dalian Nautical Offshore & Marine Technologies Co., Ltd @
(Note 11(d)) (People’s Republic of China)
Provision of marine and offshore related services and products
42 42
PT O & G Solutions @ (Note 11(d)) (Indonesia)
Provision of marine and offshore related services and products
60 60
* Audited by Baker Tilly TFW LLP** Audited by Baker Tilly TFW LLP for the purpose of consolidation# Audited by other firms of certified public accountants@ In the process of liquidation@@ Liquidated during the financial year@@@ Disposed during the financial year
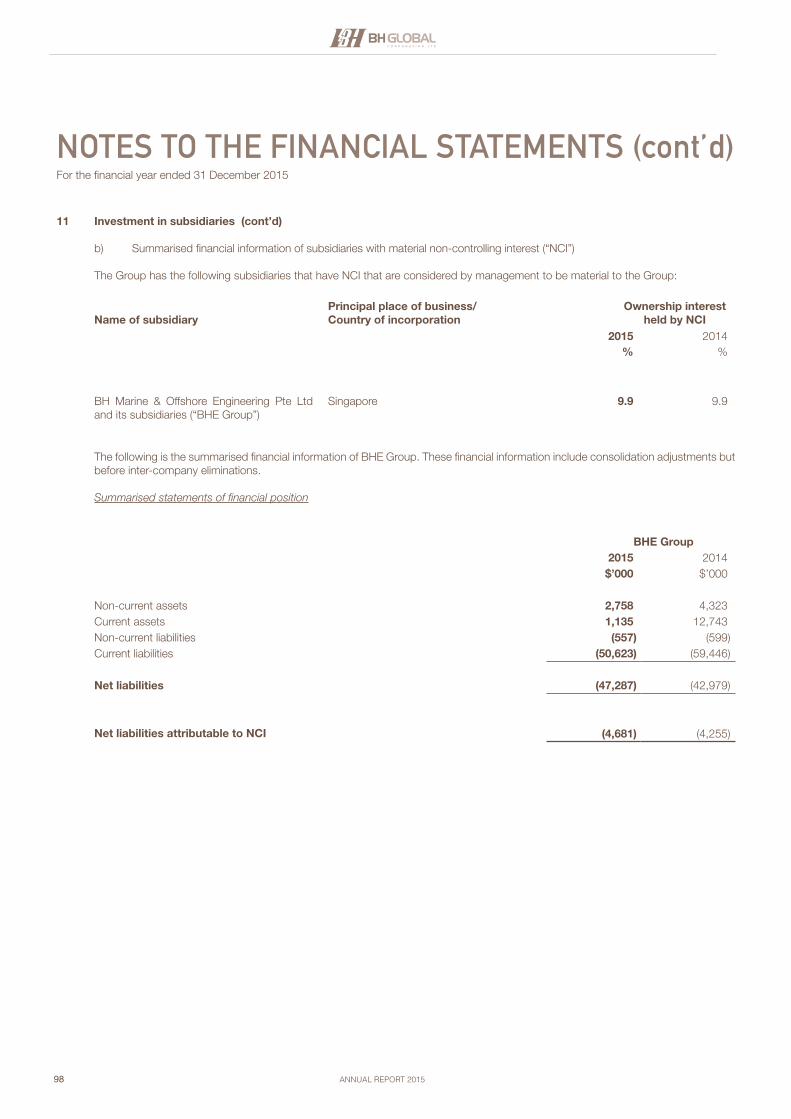
98
NOTES TO THE FINANCIAL STATEMENTS (cont’d)For the financial year ended 31 December 2015
ANNUAL REPORT 2015
11 Investment in subsidiaries (cont’d)
b) Summarised financial information of subsidiaries with material non-controlling interest (“NCI”)
The Group has the following subsidiaries that have NCI that are considered by management to be material to the Group:
Name of subsidiaryPrincipal place of business/ Country of incorporation
Ownership interest held by NCI
2015 2014% %
BH Marine & Offshore Engineering Pte Ltd and its subsidiaries (“BHE Group”)
Singapore 9.9 9.9
The following is the summarised financial information of BHE Group. These financial information include consolidation adjustments but before inter-company eliminations.
Summarised statements of financial position
BHE Group2015 2014
$’000 $’000
Non-current assets 2,758 4,323Current assets 1,135 12,743Non-current liabilities (557) (599)Current liabilities (50,623) (59,446)
Net liabilities (47,287) (42,979)
Net liabilities attributable to NCI (4,681) (4,255)
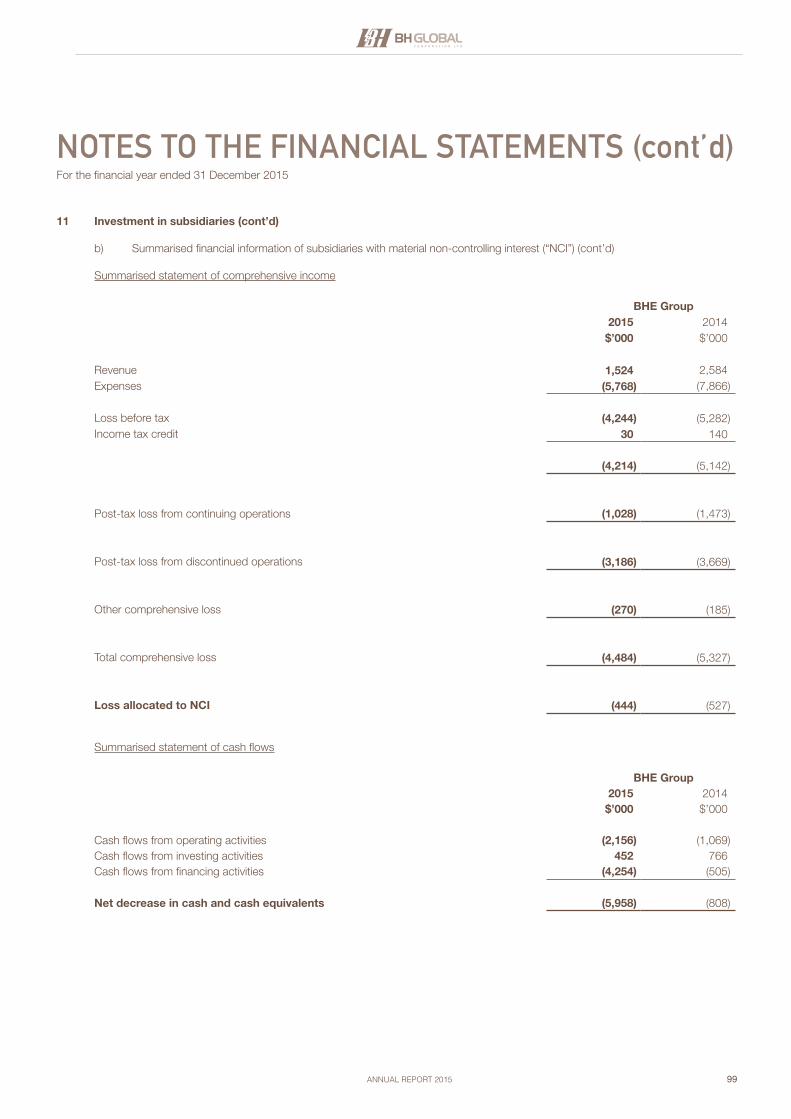
99
NOTES TO THE FINANCIAL STATEMENTS (cont’d)For the financial year ended 31 December 2015
ANNUAL REPORT 2015
11 Investment in subsidiaries (cont’d)
b) Summarised financial information of subsidiaries with material non-controlling interest (“NCI”) (cont’d)
Summarised statement of comprehensive income
BHE Group2015 2014$’000 $’000
Revenue 1,524 2,584Expenses (5,768) (7,866)
Loss before tax (4,244) (5,282)Income tax credit 30 140
(4,214) (5,142)
Post-tax loss from continuing operations (1,028) (1,473)
Post-tax loss from discontinued operations (3,186) (3,669)
Other comprehensive loss (270) (185)
Total comprehensive loss (4,484) (5,327)
Loss allocated to NCI (444) (527)
Summarised statement of cash flows
BHE Group2015 2014$’000 $’000
Cash flows from operating activities (2,156) (1,069)Cash flows from investing activities 452 766Cash flows from financing activities (4,254) (505)
Net decrease in cash and cash equivalents (5,958) (808)
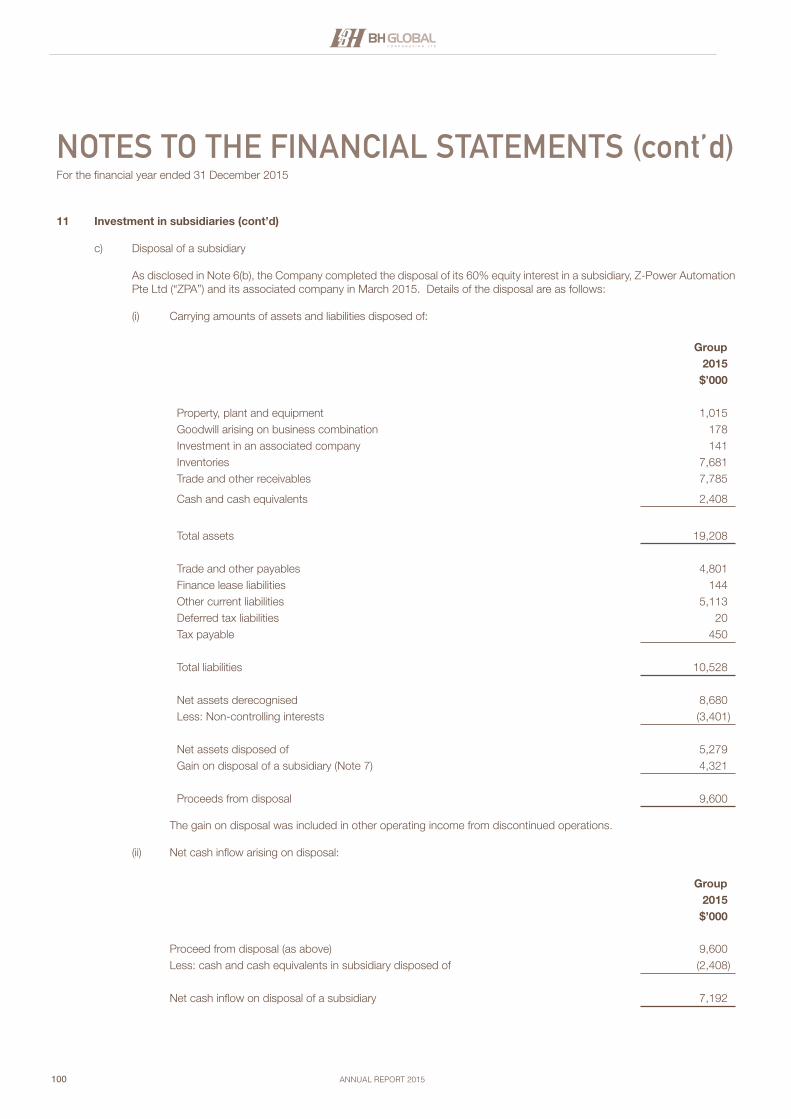
100
NOTES TO THE FINANCIAL STATEMENTS (cont’d)For the financial year ended 31 December 2015
ANNUAL REPORT 2015
11 Investment in subsidiaries (cont’d)
c) Disposal of a subsidiary
As disclosed in Note 6(b), the Company completed the disposal of its 60% equity interest in a subsidiary, Z-Power Automation Pte Ltd (“ZPA”) and its associated company in March 2015. Details of the disposal are as follows:
(i) Carrying amounts of assets and liabilities disposed of:
Group2015$’000
Property, plant and equipment 1,015Goodwill arising on business combination 178Investment in an associated company 141Inventories 7,681Trade and other receivables 7,785
Cash and cash equivalents 2,408
Total assets 19,208
Trade and other payables 4,801Finance lease liabilities 144Other current liabilities 5,113Deferred tax liabilities 20Tax payable 450
Total liabilities 10,528
Net assets derecognised 8,680Less: Non-controlling interests (3,401)
Net assets disposed of 5,279Gain on disposal of a subsidiary (Note 7) 4,321
Proceeds from disposal 9,600
The gain on disposal was included in other operating income from discontinued operations.
(ii) Net cash inflow arising on disposal:
Group2015$’000
Proceed from disposal (as above) 9,600Less: cash and cash equivalents in subsidiary disposed of (2,408)
Net cash inflow on disposal of a subsidiary 7,192
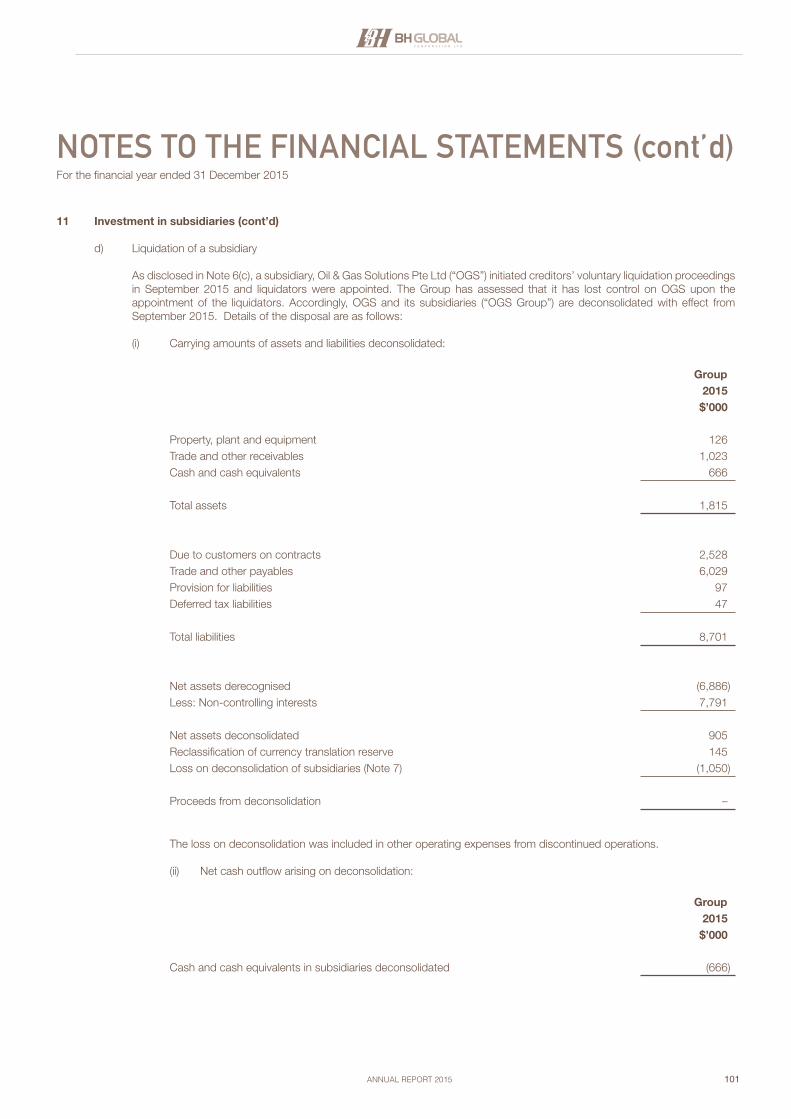
101
NOTES TO THE FINANCIAL STATEMENTS (cont’d)For the financial year ended 31 December 2015
ANNUAL REPORT 2015
11 Investment in subsidiaries (cont’d)
d) Liquidation of a subsidiary
As disclosed in Note 6(c), a subsidiary, Oil & Gas Solutions Pte Ltd (“OGS”) initiated creditors’ voluntary liquidation proceedings in September 2015 and liquidators were appointed. The Group has assessed that it has lost control on OGS upon the appointment of the liquidators. Accordingly, OGS and its subsidiaries (“OGS Group”) are deconsolidated with effect from September 2015. Details of the disposal are as follows:
(i) Carrying amounts of assets and liabilities deconsolidated:
Group2015$’000
Property, plant and equipment 126Trade and other receivables 1,023Cash and cash equivalents 666
Total assets 1,815
Due to customers on contracts 2,528Trade and other payables 6,029Provision for liabilities 97Deferred tax liabilities 47
Total liabilities 8,701
Net assets derecognised (6,886)Less: Non-controlling interests 7,791
Net assets deconsolidated 905Reclassification of currency translation reserve 145Loss on deconsolidation of subsidiaries (Note 7) (1,050)
Proceeds from deconsolidation –
The loss on deconsolidation was included in other operating expenses from discontinued operations.
(ii) Net cash outflow arising on deconsolidation:
Group2015$’000
Cash and cash equivalents in subsidiaries deconsolidated (666)
102
NOTES TO THE FINANCIAL STATEMENTS (cont’d)For the financial year ended 31 December 2015
ANNUAL REPORT 2015
11 Investment in subsidiaries (cont’d)
e) Changes in ownership interest in a subsidiary
During the financial year, a wholly-owned subsidiary, BOS Offshore and Marine Pte Ltd (“BOS”) issued 50,000 ordinary shares to a third party at consideration of $50,000. The effective equity interest in BOS is diluted to 90%.
The dilution of equity interest does not have material impact to the Group.
f) Company level - impairment review of investment in subsidiaries
During the financial year, the management performed an impairment review for its investment in BOS because of significant losses incurred by this subsidiary. Full impairment loss of $450,000 has been recognised for the financial year ended 31 December 2015 to write down the cost of investment in this subsidiary.
12 Investment in joint ventures
a) The Group’s investment in joint ventures are summarised below:
Group2015 2014
$’000 $’000
Carrying amountDream Marine Ship Spare Parts Trading LLC (“DMS”) 2,380 2,061Gulf Specialty Steel Industries LLC (“GSSI”) – –Other joint ventures 36 32
2,416 2,093
b) Included in investment in joint ventures of the Company and the Group is amounts of $824,000 (2014: $776,000) being equity loans due from joint ventures. These amounts are unsecured, interest-free and have no fixed repayment term.
c) The following information relates to the joint ventures at the end of the financial year:
Name of joint venture (Country of incorporation) Principal activities
Group’s effective equity interest held
2015 2014% %
Dream Marine Ship Spare Parts Trading LLC# (Dubai, UAE)
Trading in electrical components and spare parts of ships and boats
34 34
Gulf Specialty Steel Industries LLC # (Sultanate of Oman)
Manufacturer and supplier of specialty steel wire and other types of wire
51 51
103
NOTES TO THE FINANCIAL STATEMENTS (cont’d)For the financial year ended 31 December 2015
ANNUAL REPORT 2015
12 Investment in joint ventures (cont’d)
c) The following information relates to the joint ventures at the end of the financial year: (cont’d)
Name of joint venture (Country of incorporation) Principal activities
Group’s effective equity interest held
2015 2014% %
Athena Dynamics Pte Ltd* (Singapore) Provision of IT electronic products and solutions
49 49
BH Global HNS Pte Ltd* (Singapore) Design, development, marketing and sales of nitrogen steel products
49 49
In accordance with the shareholders’ agreements between the Company and other joint venturers of DMS,the Company is entitled to 70% of the net profit of DMS. However, the Company’s equity interest held in DMS is 34%.
* Audited by Baker Tilly TFW LLP# Audited by other firms of certified public accountants
All of the above joint ventures are accounted for using the equity method in these consolidated financial statements. The activities of DMS and GSSI provide the Group access to markets in the Middle East.
d) Summarised financial information for material joint ventures based on their FRS financial statements (adjusted by the Group for equity accounting purpose) and a reconciliation to the carrying amounts of the investments in the consolidated financial statements are as follows:
DMS GSSI2015 2014 2015 2014
$’000 $’000 $’000 $’000
Income Statement items:Revenue 3,435 3,654 36,506 4,839Profit/(loss) after tax from continuing operations 886 902 (4,965) (2,146)Other comprehensive income 82 142 (33) 107Total comprehensive income 968 1,044 (4,998) (2,039)
Dividend received from joint ventures 267 863 – –
The above profit/(loss) for the financial year include the following:
$’000 $’000 $’000 $’000
Depreciation and amortisation 25 25 1,718 410Impairment of property, plant and equipment – – 6,863 –Interest expense – – 1,233 301
GSSI was a subsidiary of the Group prior to 1 October 2014. The Group assessed that the Group had lost control in GSSI in the previous financial year. Accordingly, GSSI was deconsolidated with effect from 1 October 2014 and reclassified as a joint venture. The income statement items for GSSI in the comparatives disclosed above were for the period from 1 October 2014 to 31 December 2014.
104
NOTES TO THE FINANCIAL STATEMENTS (cont’d)For the financial year ended 31 December 2015
ANNUAL REPORT 2015
12 Investment in joint ventures (cont’d)
d) Summarised financial information for material joint ventures based on their FRS financial statements (adjusted by the Group for equity accounting purpose) and a reconciliation to the carrying amounts of the investments in the consolidated financial statements are as follows (cont’d):
DMS GSSI2015 2014 2015 2014
$’000 $’000 $’000 $’000
Statement of financial position items:Non-current assets 61 78 23,764 30,211Current assets 3,728 3,222 12,498 7,324Non-current liabilities – – (20,352) (21,095)Current liabilities (1,540) (1,436) (22,841) (16,567)
Net assets 2,249 1,864 (6,931) (127)
The above amounts of assets and liabilities include the following:
$’000 $’000 $’000 $’000
Cash and cash equivalents 782 597 755 1Current financial liabilities (excluding trade and other payables and provisions) – – 13,515 11,659Non-current financial liabilities (excluding trade and other payables and provisions) – – 21,377 20,716
Reconciliation of the above summarised financial information to the carrying amount of the interest in joint ventures recognised in the consolidated financial statements:
DMS GSSI2015 2014 2015 2014
$’000 $’000 $’000 $’000
Net assets of the joint ventures 2,249 1,864 (6,931) (127)
Group’s share of net assets/(liabilities) based on proportion of ownership interest 1,574 1,305 (3,535) (65)Equity loan to a joint venture 806 756 – –Provision for liabilities (Note 28(b)(i)) – – 3,500 88Others – – 35 (23)
Carrying amount of investment 2,380 2,061 – –
Aggregate information about the Group’s investment in joint ventures that are not individually material are as follows:
2015 2014$’000 $’000
Loss after tax from continuing operations and total comprehensive loss for the financial year 127 35
105
NOTES TO THE FINANCIAL STATEMENTS (cont’d)For the financial year ended 31 December 2015
ANNUAL REPORT 2015
12 Investment in joint ventures (cont’d)
e) In March 2016, the Group acquired additional 102,000 ordinary shares, representing 51% equity interest in Athena Dynamics Pte Ltd (“ADPL”) from a third party at cash consideration of $200,000. Subsequent to the acquisition, ADPL became a wholly-owned subsidiary of the Group.
The acquisition is not expected to have any material impact on the financial position and performance of the Group for the financial year ending 31 December 2016.
13 Investment in associated companies
a) The Group’s investment in associated companies are summarised below:
Group2015 2014
$’000 $’000
Carrying amount:
GL Lighting Holding Pte Ltd (“GLH”) and its subsidiaries (“GLH Group”) 12,149 11,085
b) The following information relates to the associated companies:
Name of associates (Country of incorporation) Principal activities
Group’s effective equity interest held
2015 2014% %
GL Lighting Holding Pte Ltd* (Singapore) Investment holding 39 37
Z-Power Automation (Vietnam) Co., Ltd
@ (Vietnam)Manufacturing of industrial electrical equipment
– 30
Subsidiaries held by GLH
General Luminaire (Shanghai) Co., Ltd (“SGL”)** (People’s Republic of China)
Research and development, manufacturing and selling LED lighting modules and fixtures
39 37
General Luminaire (Kunshan) Co., Ltd (“KGL”)** (People’s Republic of China)
Design, manufacturing and trading LED lighting modules and fixtures
39 37
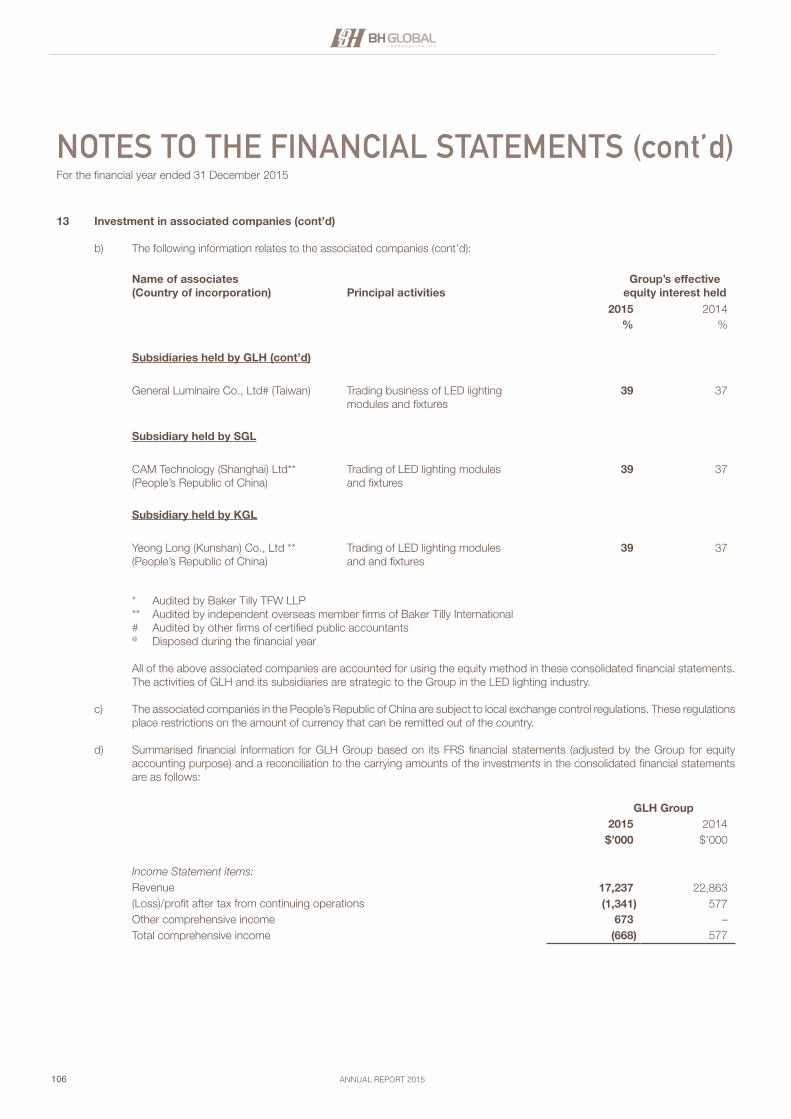
106
NOTES TO THE FINANCIAL STATEMENTS (cont’d)For the financial year ended 31 December 2015
ANNUAL REPORT 2015
13 Investment in associated companies (cont’d)
b) The following information relates to the associated companies (cont’d):
Name of associates (Country of incorporation) Principal activities
Group’s effective equity interest held
2015 2014% %
Subsidiaries held by GLH (cont’d)
General Luminaire Co., Ltd# (Taiwan) Trading business of LED lighting modules and fixtures
39 37
Subsidiary held by SGL
CAM Technology (Shanghai) Ltd** (People’s Republic of China)
Trading of LED lighting modules and fixtures
39 37
Subsidiary held by KGL
Yeong Long (Kunshan) Co., Ltd ** (People’s Republic of China)
Trading of LED lighting modules and and fixtures
39 37
* Audited by Baker Tilly TFW LLP** Audited by independent overseas member firms of Baker Tilly International# Audited by other firms of certified public accountants@ Disposed during the financial year
All of the above associated companies are accounted for using the equity method in these consolidated financial statements. The activities of GLH and its subsidiaries are strategic to the Group in the LED lighting industry.
c) The associated companies in the People’s Republic of China are subject to local exchange control regulations. These regulations place restrictions on the amount of currency that can be remitted out of the country.
d) Summarised financial information for GLH Group based on its FRS financial statements (adjusted by the Group for equity accounting purpose) and a reconciliation to the carrying amounts of the investments in the consolidated financial statements are as follows:
GLH Group2015 2014$’000 $’000
Income Statement items:Revenue 17,237 22,863(Loss)/profit after tax from continuing operations (1,341) 577Other comprehensive income 673 –Total comprehensive income (668) 577
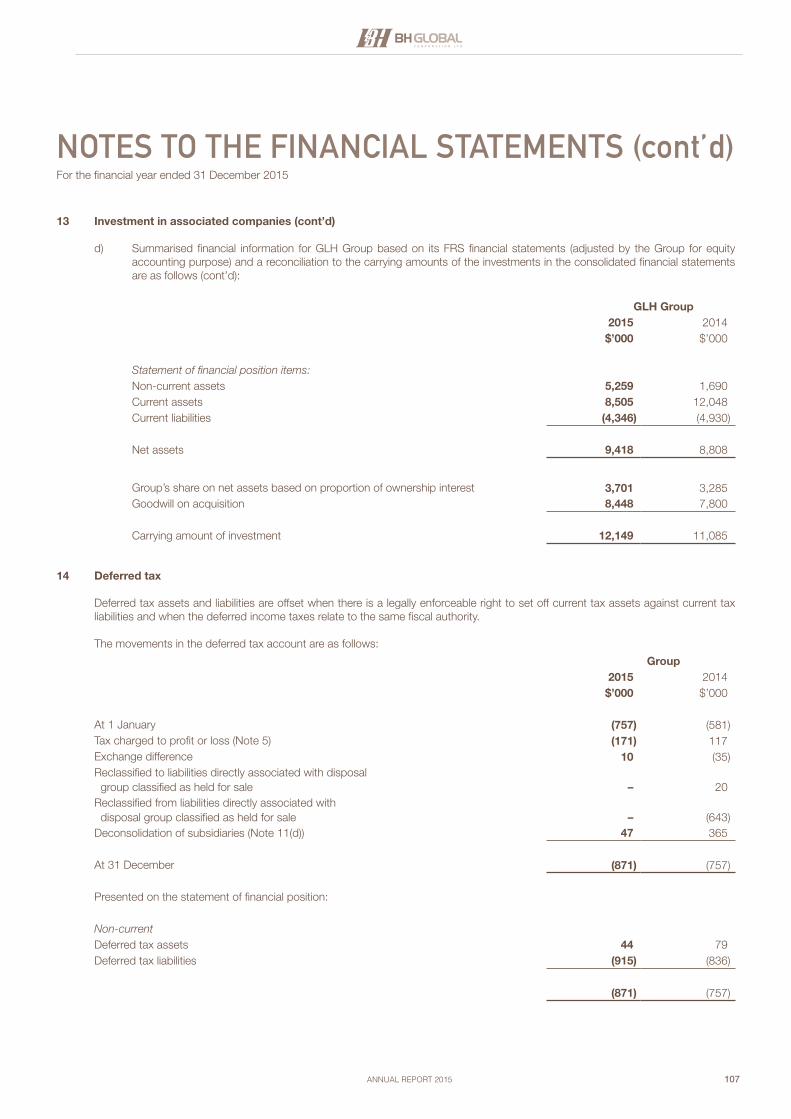
107
NOTES TO THE FINANCIAL STATEMENTS (cont’d)For the financial year ended 31 December 2015
ANNUAL REPORT 2015
13 Investment in associated companies (cont’d)
d) Summarised financial information for GLH Group based on its FRS financial statements (adjusted by the Group for equity accounting purpose) and a reconciliation to the carrying amounts of the investments in the consolidated financial statements are as follows (cont’d):
GLH Group2015 2014$’000 $’000
Statement of financial position items:Non-current assets 5,259 1,690Current assets 8,505 12,048Current liabilities (4,346) (4,930)
Net assets 9,418 8,808
Group’s share on net assets based on proportion of ownership interest 3,701 3,285Goodwill on acquisition 8,448 7,800
Carrying amount of investment 12,149 11,085
14 Deferred tax
Deferred tax assets and liabilities are offset when there is a legally enforceable right to set off current tax assets against current tax liabilities and when the deferred income taxes relate to the same fiscal authority.
The movements in the deferred tax account are as follows:
Group2015 2014
$’000 $’000
At 1 January (757) (581)Tax charged to profit or loss (Note 5) (171) 117Exchange difference 10 (35)Reclassified to liabilities directly associated with disposal group classified as held for sale – 20Reclassified from liabilities directly associated with disposal group classified as held for sale – (643)Deconsolidation of subsidiaries (Note 11(d)) 47 365
At 31 December (871) (757)
Presented on the statement of financial position:
Non-currentDeferred tax assets 44 79Deferred tax liabilities (915) (836)
(871) (757)
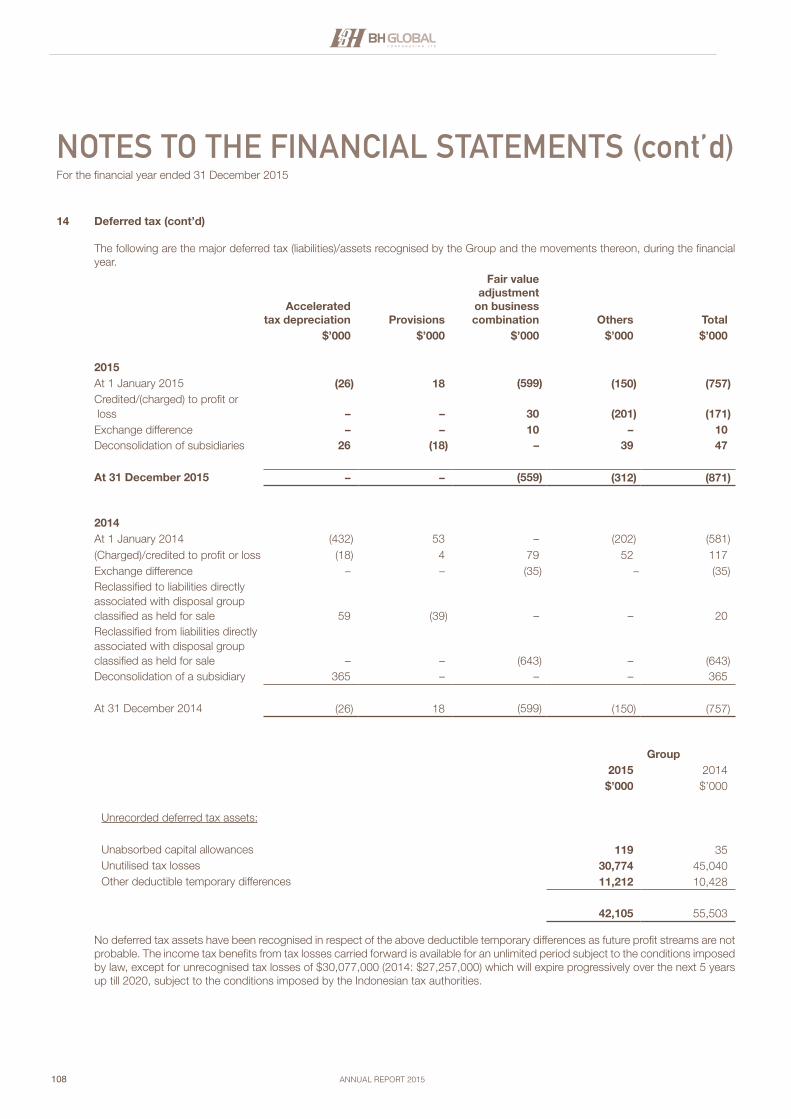
108
NOTES TO THE FINANCIAL STATEMENTS (cont’d)For the financial year ended 31 December 2015
ANNUAL REPORT 2015
14 Deferred tax (cont’d)
The following are the major deferred tax (liabilities)/assets recognised by the Group and the movements thereon, during the financial year.
Accelerated tax depreciation Provisions
Fair value adjustment
on business combination Others Total
$’000 $’000 $’000 $’000 $’000
2015At 1 January 2015 (26) 18 (599) (150) (757)Credited/(charged) to profit or loss – – 30 (201) (171)Exchange difference – – 10 – 10Deconsolidation of subsidiaries 26 (18) – 39 47
At 31 December 2015 – – (559) (312) (871)
2014At 1 January 2014 (432) 53 – (202) (581)(Charged)/credited to profit or loss (18) 4 79 52 117Exchange difference – – (35) – (35)Reclassified to liabilities directly associated with disposal group classified as held for sale 59 (39) – – 20Reclassified from liabilities directly associated with disposal group classified as held for sale – – (643) – (643)Deconsolidation of a subsidiary 365 – – – 365
At 31 December 2014 (26) 18 (599) (150) (757)
Group2015 2014
$’000 $’000
Unrecorded deferred tax assets:
Unabsorbed capital allowances 119 35Unutilised tax losses 30,774 45,040Other deductible temporary differences 11,212 10,428
42,105 55,503
No deferred tax assets have been recognised in respect of the above deductible temporary differences as future profit streams are not probable. The income tax benefits from tax losses carried forward is available for an unlimited period subject to the conditions imposed by law, except for unrecognised tax losses of $30,077,000 (2014: $27,257,000) which will expire progressively over the next 5 years up till 2020, subject to the conditions imposed by the Indonesian tax authorities.
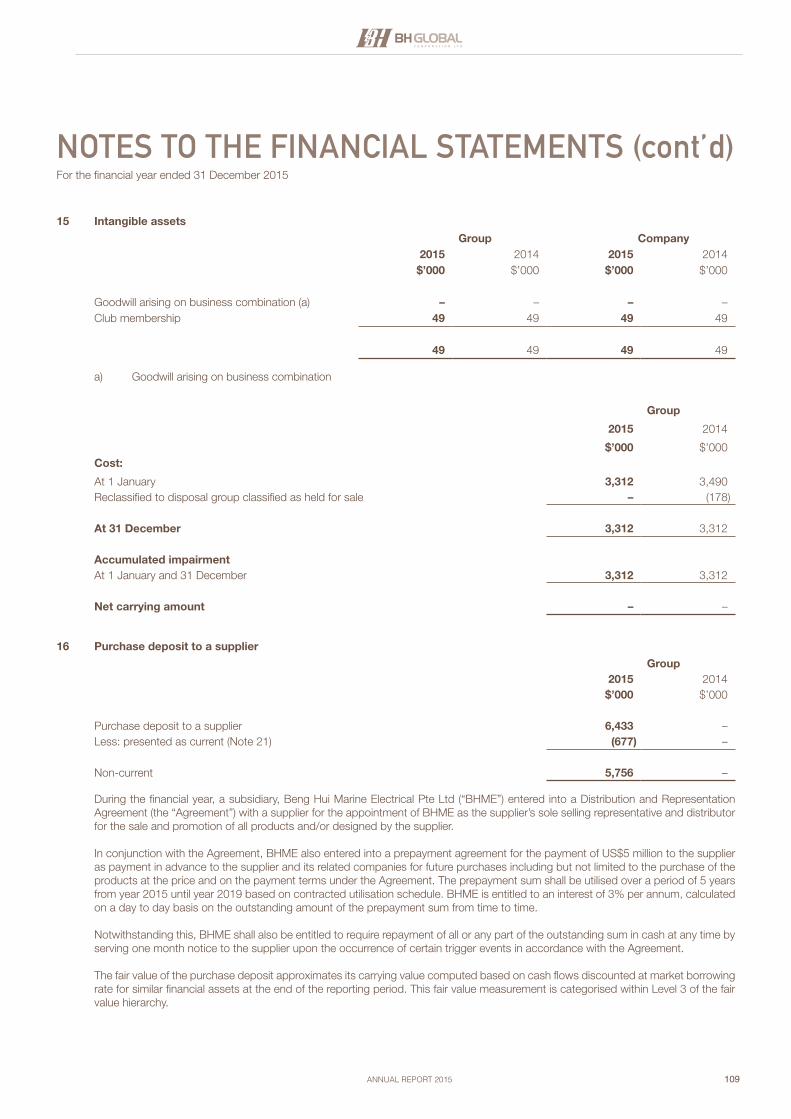
109
NOTES TO THE FINANCIAL STATEMENTS (cont’d)For the financial year ended 31 December 2015
ANNUAL REPORT 2015
15 Intangible assets
Group Company2015 2014 2015 2014
$’000 $’000 $’000 $’000
Goodwill arising on business combination (a) – – – –Club membership 49 49 49 49
49 49 49 49
a) Goodwill arising on business combination
Group
2015 2014
$’000 $’000Cost:
At 1 January 3,312 3,490Reclassified to disposal group classified as held for sale – (178)
At 31 December 3,312 3,312
Accumulated impairmentAt 1 January and 31 December 3,312 3,312
Net carrying amount – –
16 Purchase deposit to a supplier
Group2015 2014
$’000 $’000
Purchase deposit to a supplier 6,433 –Less: presented as current (Note 21) (677) –
Non-current 5,756 –
During the financial year, a subsidiary, Beng Hui Marine Electrical Pte Ltd (“BHME”) entered into a Distribution and Representation Agreement (the “Agreement”) with a supplier for the appointment of BHME as the supplier’s sole selling representative and distributor for the sale and promotion of all products and/or designed by the supplier.
In conjunction with the Agreement, BHME also entered into a prepayment agreement for the payment of US$5 million to the supplier as payment in advance to the supplier and its related companies for future purchases including but not limited to the purchase of the products at the price and on the payment terms under the Agreement. The prepayment sum shall be utilised over a period of 5 years from year 2015 until year 2019 based on contracted utilisation schedule. BHME is entitled to an interest of 3% per annum, calculated on a day to day basis on the outstanding amount of the prepayment sum from time to time.
Notwithstanding this, BHME shall also be entitled to require repayment of all or any part of the outstanding sum in cash at any time by serving one month notice to the supplier upon the occurrence of certain trigger events in accordance with the Agreement.
The fair value of the purchase deposit approximates its carrying value computed based on cash flows discounted at market borrowing rate for similar financial assets at the end of the reporting period. This fair value measurement is categorised within Level 3 of the fair value hierarchy.
110
NOTES TO THE FINANCIAL STATEMENTS (cont’d)For the financial year ended 31 December 2015
ANNUAL REPORT 2015
17 Non-current receivable
Group and Company2015 2014
$’000 $’000
Contingent consideration receivable 228 –Less: Presented as current (Note 21) (66) –
Non-current 162 –
This represents contingent consideration receivable from a non-controlling shareholder of a subsidiary for shortfall in profits target in relation to the Company’s acquisition of 60% equity interest in a subsidiary, Sky Holding Pte Ltd in year 2009.
During the financial year, the Company recognised contingent consideration income of $300,000 in profit or loss from continuing operations. This amount will be collected in 37 instalments from year 2015 to 2018.
The fair value of the contingent consideration receivable approximates its carrying value computed based on cash flows discounted at market borrowing rate for similar financial assets at the end of the reporting period. This fair value measurement is categorised within Level 2 of the fair value hierarchy.
18 Inventories
Group2015 2014
$’000 $’000
Raw material – 2,294Work-in-progress – 417Finished goods 30,123 30,050
30,123 32,761
Raw materials, consumables and changes in finished goods and work in progress included as cost of sales amounted to $43,087,000 (2014: $59,071,000).
In the previous financial year, the Group recognised a reversal of $400,000 being part of the inventory write down made in previous years, as the inventories were sold above the carrying amounts subsequent to year end. The reversal was included in selling and distribution expenses.
111
NOTES TO THE FINANCIAL STATEMENTS (cont’d)For the financial year ended 31 December 2015
ANNUAL REPORT 2015
19 Due from/(to) customers on construction contracts
Group2015 2014
$’000 $’000
Aggregate costs incurred and profits recognised (less losses recognised) to-date on uncompleted construction contracts 263 8,825Less : Progress billing (134) (11,869)
129 (3,044)
Presented as:Due from customers on construction contracts 129 37Due to customers on construction contracts – (3,081)
129 (3,044)
20 Trade receivables
Group2015 2014
$’000 $’000
Trade receivables 19,607 22,606Less: allowance for impairment (3,384) (1,970)
16,223 20,636
Trade receivables are non-interest bearing and are generally on 30 to 90 day’s terms.
Movements of allowance for impairment of trade receivables are as follows:
$’000 $’000
At 1 January 1,970 316Allowance made during the financial year (Note 7) 2,455 1,938Allowance written back during the financial year (Note 7) – (107)Bad debt written off (25) (163)Reclassified to disposal group classified as held for sale (Note 6) – (14)Deconsolidated during the financial year (866) –Currency translation differences (150) –
At 31 December 3,384 1,970
Included in trade receivables is an amount of $257,000 (2014: $41,000) due from a joint venture company.
112
NOTES TO THE FINANCIAL STATEMENTS (cont’d)For the financial year ended 31 December 2015
ANNUAL REPORT 2015
21 Other receivables
Group Company2015 2014 2015 2014
$’000 $’000 $’000 $’000
Amount due from a joint venture 3 – 3 –Amount due from an associated company 155 135 155 135Amount due from related companies 119 – – –Dividend receivable from a joint venture 267 506 267 506Purchase deposit to a supplier (Note 16) 677 – – –Sundry deposits 2,926 2,984 – –Prepayments 149 250 15 7Amounts due from subsidiaries (Note 22) – – 81,741 73,780Advance payment to suppliers 89 89 – –Sundry receivables 470 538 274 34Contingent consideration receivable (Note 17) 66 – 66 –
4,921 4,502 82,521 74,462
Less: allowance for impairment - Sundry deposits (2,494) (2,494) – – - Amounts due from subsidiaries (Note 22) – – (69,388) (60,602) - Sundry receivable – (30) – –
(2,494) (2,524) (69,388) (60,602)
2,427 1,978 13,133 13,860
113
NOTES TO THE FINANCIAL STATEMENTS (cont’d)For the financial year ended 31 December 2015
ANNUAL REPORT 2015
21 Other receivables (cont’d)
Group Company2015 2014 2015 2014
$’000 $’000 $’000 $’000
Movement in allowance for impairment:
At 1 January 2,524 2,524 60,602 50,387Allowance made during the financial year – – 8,786 10,355Allowance written back during the financial year – – – (140)Allowance written off during the financial year (30) – – –At 31 December 2,494 2,524 69,388 60,602
The amount due from an associated company is non-trade in nature, unsecured, interest-free and repayable on demand.
22 Amounts due from subsidiaries
Company2015 2014
$’000 $’000
Interest-free advances 30,842 22,881Loans at variable interest rates 50,899 50,899
81,741 73,780Less: allowance for impairment (69,388) (60,602)
12,353 13,178
The amounts due from subsidiaries are non-trade in nature, unsecured and repayable on demand. Loan to subsidiaries are at variable interest rates ranging from 2.231% to 2.669% (2014: 2.216% to 2.329%) per annum based on the average cost of funds incurred by the Group. During the financial year, the Company has waived interest charges on principal loans amount of $46,011,000 (2014: $46,011,000).
During the financial year ended 31 December 2015, a net impairment loss of $8,786,000 (2014: $10,215,000) was recognised to write down the amounts due from subsidiaries to their recoverable amounts.
23 Restricted cash
Group2015 2014
$’000 $’000
Cash at bank (restricted in use) 853 –Fixed deposit (pledged) 516 2,050
1,369 2,050
Fixed deposits of $516,000 (2014: $2,050,000) are pledged to banks to cover bankers’ letter of guarantees, credit facilities and bank overdraft. The interest rates of fixed deposits at 31 December 2015 range from 0.10% to 0.47% (2014: 0.23% to 0.75%) per annum.
The cash at bank is restricted in use for performance bond of a former subsidiary.
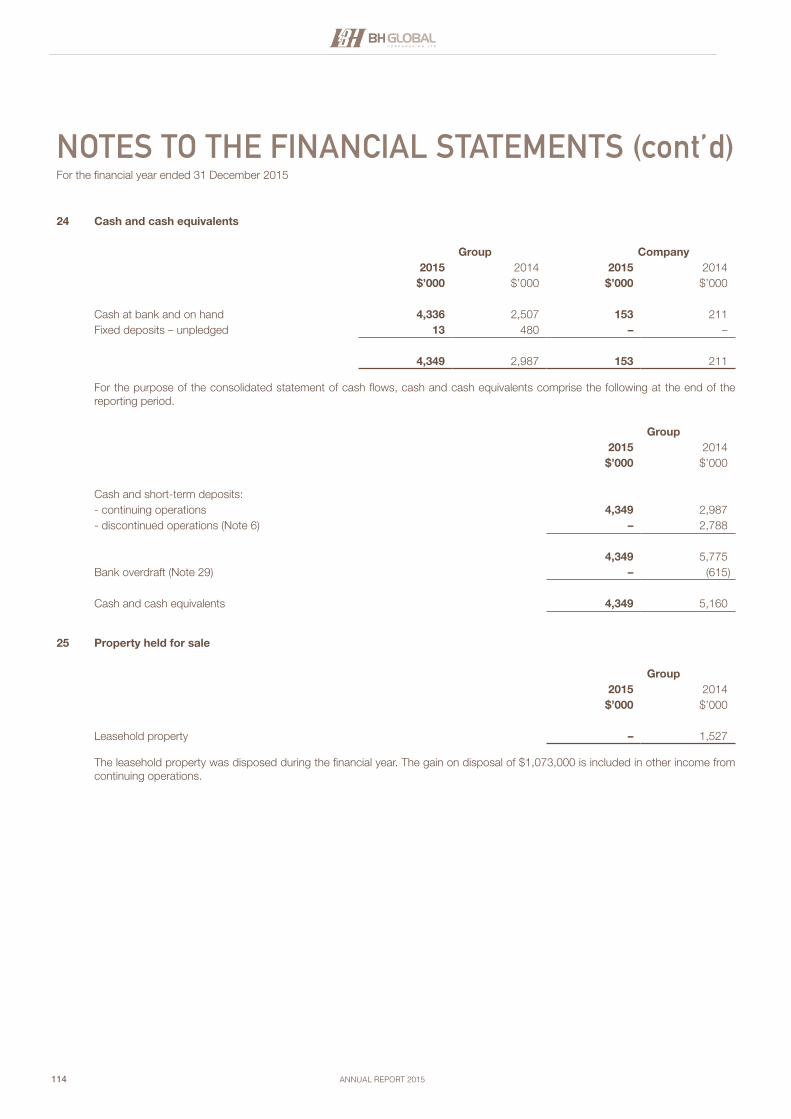
114
NOTES TO THE FINANCIAL STATEMENTS (cont’d)For the financial year ended 31 December 2015
ANNUAL REPORT 2015
24 Cash and cash equivalents
Group Company2015 2014 2015 2014
$’000 $’000 $’000 $’000
Cash at bank and on hand 4,336 2,507 153 211Fixed deposits – unpledged 13 480 – –
4,349 2,987 153 211
For the purpose of the consolidated statement of cash flows, cash and cash equivalents comprise the following at the end of the reporting period.
Group2015 2014
$’000 $’000
Cash and short-term deposits:- continuing operations 4,349 2,987- discontinued operations (Note 6) – 2,788
4,349 5,775Bank overdraft (Note 29) – (615)
Cash and cash equivalents 4,349 5,160
25 Property held for sale
Group2015 2014
$’000 $’000
Leasehold property – 1,527
The leasehold property was disposed during the financial year. The gain on disposal of $1,073,000 is included in other income from continuing operations.

115
NOTES TO THE FINANCIAL STATEMENTS (cont’d)For the financial year ended 31 December 2015
ANNUAL REPORT 2015
26 Finance lease liabilities
The minimum lease payment under the finance lease liabilities are payable as follows:
Group2015 2014
$’000 $’000
Not later than one financial year 189 209Later than one financial year but not later than five financial years 411 553More than five financial years – 27
Total minimum lease payments 600 789Less: Future finance charges (80) (102)
Present value of finance lease liabilities 520 687
Representing finance lease liabilities:- Current 166 166- Non-current 354 521
520 687
The weighted average effective interest rate of the finance lease liabilities at the end of the reporting period is 4.76% (2014: 4.41%) per annum. The net carrying values of motor vehicles acquired under finance lease agreements are disclosed in Note 10.
Based on the discounted cash flow analysis using market interest rates for similar finance lease agreements at the end of the reporting period, the fair values of finance lease liabilities at the end of the reporting period approximate their carrying amounts as the market interest rate at the end of the reporting period is close to the effective interest rates of the Group’s existing finance lease liabilities. This fair value measurement for disclosures purposes is categorised in Level 2 of the fair value hierarchy.
27 Other payables
Group Company2015 2014 2015 2014
$’000 $’000 $’000 $’000
Accrued operating expenses 1,145 2,353 283 338Provision for directors’ fees- directors of the Company 360 360 360 360- directors of subsidiaries 60 60 – –Amounts due to subsidiaries – – 294 3,663Advance payment from customers 4 203 – –Other creditors 177 563 137 71
1,746 3,539 1,074 4,432
The amounts due to directors and a subsidiary are non-trade in nature, unsecured, interest-free and repayable on demand.
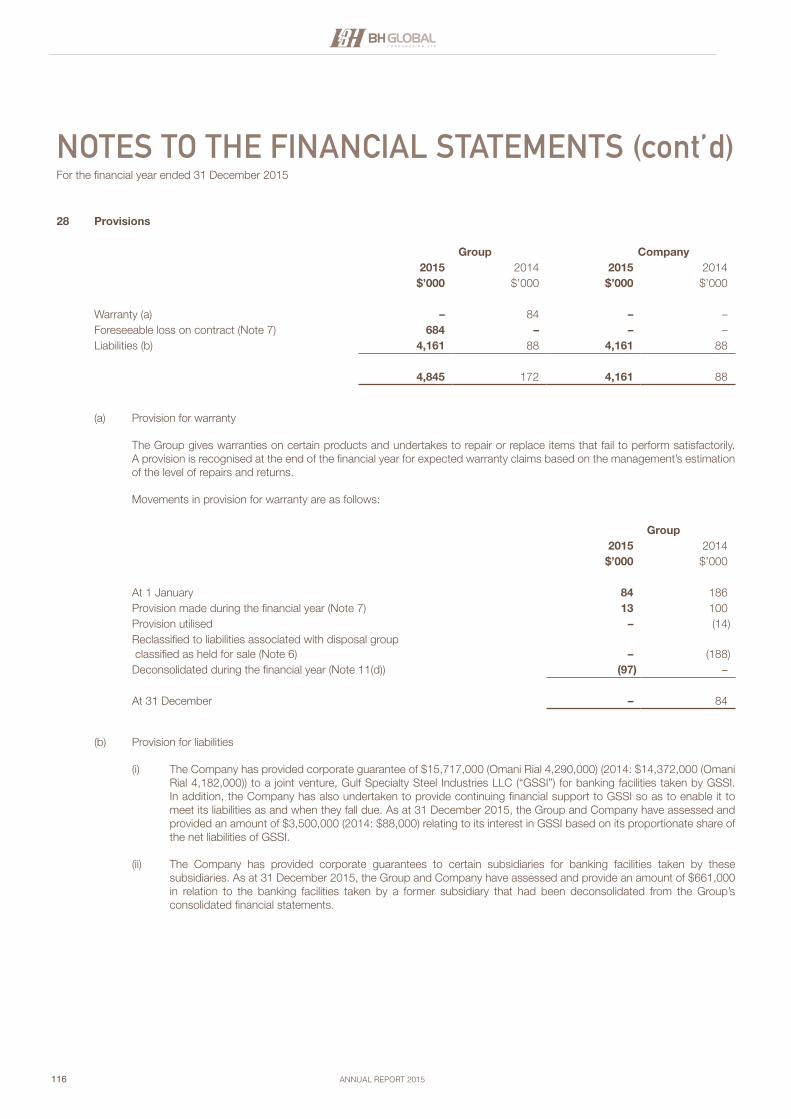
116
NOTES TO THE FINANCIAL STATEMENTS (cont’d)For the financial year ended 31 December 2015
ANNUAL REPORT 2015
28 Provisions
Group Company2015 2014 2015 2014
$’000 $’000 $’000 $’000
Warranty (a) – 84 – –Foreseeable loss on contract (Note 7) 684 – – –Liabilities (b) 4,161 88 4,161 88
4,845 172 4,161 88
(a) Provision for warranty
The Group gives warranties on certain products and undertakes to repair or replace items that fail to perform satisfactorily. A provision is recognised at the end of the financial year for expected warranty claims based on the management’s estimation of the level of repairs and returns.
Movements in provision for warranty are as follows:
Group2015 2014
$’000 $’000
At 1 January 84 186Provision made during the financial year (Note 7) 13 100Provision utilised – (14)Reclassified to liabilities associated with disposal group classified as held for sale (Note 6) – (188)Deconsolidated during the financial year (Note 11(d)) (97) –
At 31 December – 84
(b) Provision for liabilities
(i) The Company has provided corporate guarantee of $15,717,000 (Omani Rial 4,290,000) (2014: $14,372,000 (Omani Rial 4,182,000)) to a joint venture, Gulf Specialty Steel Industries LLC (“GSSI”) for banking facilities taken by GSSI. In addition, the Company has also undertaken to provide continuing financial support to GSSI so as to enable it to meet its liabilities as and when they fall due. As at 31 December 2015, the Group and Company have assessed and provided an amount of $3,500,000 (2014: $88,000) relating to its interest in GSSI based on its proportionate share of the net liabilities of GSSI.
(ii) The Company has provided corporate guarantees to certain subsidiaries for banking facilities taken by these subsidiaries. As at 31 December 2015, the Group and Company have assessed and provide an amount of $661,000 in relation to the banking facilities taken by a former subsidiary that had been deconsolidated from the Group’s consolidated financial statements.

117
NOTES TO THE FINANCIAL STATEMENTS (cont’d)For the financial year ended 31 December 2015
ANNUAL REPORT 2015
28 Provisions (Cont’d)
(b) Provision for liabilities (Cont’d)
Movements in provision for liabilities are as follows:
Group2015 2014
$’000 $’000
At 1 January 88 –Provision made during the financial year (Note 7) 4,073 88
At 31 December 4,161 88
29 Bank borrowings
Group2015 2014
$’000 $’000
Term loan 1 (unsecured) – 718Term loan 2 (unsecured) 1,283 1,700Working capital loans (secured) 3,300 4,330Working capital loans (unsecured) 2,500 1,500Trust receipts 2,227 4,392Bank overdraft (Note 24) – 615
Total borrowings 9,310 13,255
Term loan 1 was repayable over 48 monthly instalments of $46,667 each commencing in May 2012 and a final instalment of $46,666. The loan was repaid fully during the year. Term loan 2 is repayable over 48 monthly instalments of $42,000 each commencing in October 2014. Notwithstanding to the above, these term loans are subjected to review, recall, alter or cancel from time to time at the lender’s discretion. Accordingly, these loans are classified under current liabilities.
The working capital loans (secured) and trust receipts are secured by legal mortgage of the Group’s leasehold property and extension, addition and alteration works (Note 10) and covered by corporate guarantee from the Company.
Bank overdraft was secured by fixed deposits of the Group in the previous financial year (Note 23).
Interest rates at the end of the reporting period were as follows:
Term loan 2 - Fixed rate at 3.00% per annum.
Working capital loans - Variable rates ranging from 2.23% to 2.66% (2014: 2.216% to 2.329%) per annum.
Trust receipts - Variable rate range from 2.70% to 3.42% (2014: 1.63% to 3.00%) per annum above SIBOR.
Based on the discounted cash flow analysis using a discount rate based upon market lending rates for similar borrowings which the directors expect would be available to the Group at the end of the reporting period, the fair value of the fixed rate term loans at the end of the reporting period approximate their carrying values as there are no significant changes in the interest rates available to the Group. The working capital loans and trust receipts are floating rate instruments that are repriced to market interest rates on or near the end of the reporting period. Accordingly, the fair values of these floating rates borrowings approximate their carrying amounts at the end of the reporting period. This fair value measurement for disclosures purposes is categorised in Level 2 of the fair value hierarchy.
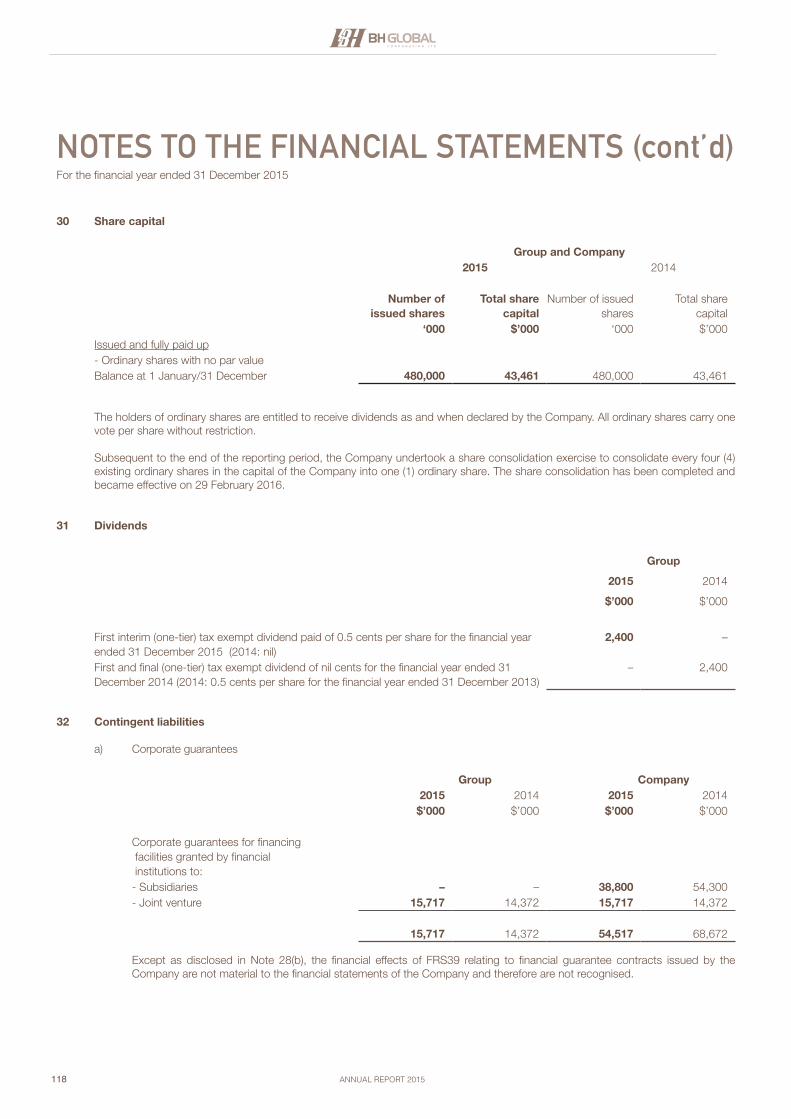
118
NOTES TO THE FINANCIAL STATEMENTS (cont’d)For the financial year ended 31 December 2015
ANNUAL REPORT 2015
30 Share capital
Group and Company2015 2014
Number of issued shares
Total share capital
Number of issued shares
Total share capital
‘000 $’000 ‘000 $’000Issued and fully paid up- Ordinary shares with no par valueBalance at 1 January/31 December 480,000 43,461 480,000 43,461
The holders of ordinary shares are entitled to receive dividends as and when declared by the Company. All ordinary shares carry one vote per share without restriction.
Subsequent to the end of the reporting period, the Company undertook a share consolidation exercise to consolidate every four (4) existing ordinary shares in the capital of the Company into one (1) ordinary share. The share consolidation has been completed and became effective on 29 February 2016.
31 Dividends
Group
2015 2014
$’000 $’000
First interim (one-tier) tax exempt dividend paid of 0.5 cents per share for the financial year ended 31 December 2015 (2014: nil)
2,400 –
First and final (one-tier) tax exempt dividend of nil cents for the financial year ended 31 December 2014 (2014: 0.5 cents per share for the financial year ended 31 December 2013)
– 2,400
32 Contingent liabilities
a) Corporate guarantees
Group Company2015 2014 2015 2014
$’000 $’000 $’000 $’000
Corporate guarantees for financing facilities granted by financial institutions to:- Subsidiaries – – 38,800 54,300- Joint venture 15,717 14,372 15,717 14,372
15,717 14,372 54,517 68,672
Except as disclosed in Note 28(b), the financial effects of FRS39 relating to financial guarantee contracts issued by the Company are not material to the financial statements of the Company and therefore are not recognised.
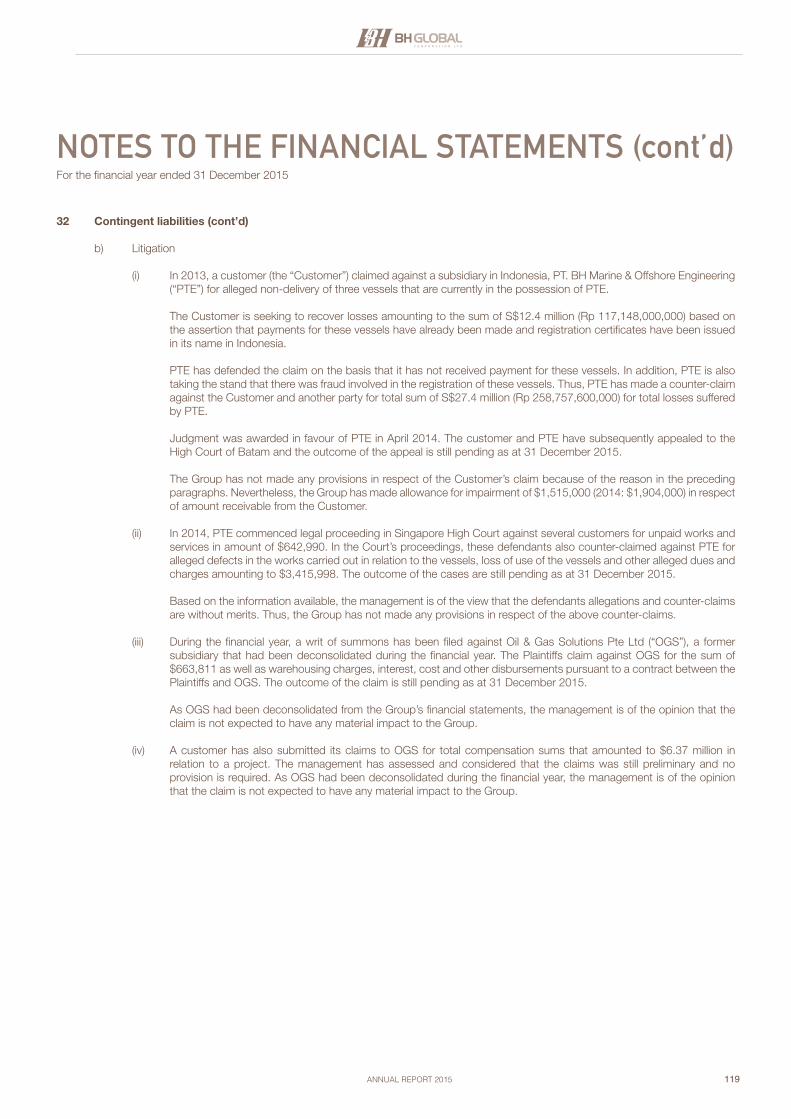
119
NOTES TO THE FINANCIAL STATEMENTS (cont’d)For the financial year ended 31 December 2015
ANNUAL REPORT 2015
32 Contingent liabilities (cont’d)
b) Litigation
(i) In 2013, a customer (the “Customer”) claimed against a subsidiary in Indonesia, PT. BH Marine & Offshore Engineering (“PTE”) for alleged non-delivery of three vessels that are currently in the possession of PTE.
The Customer is seeking to recover losses amounting to the sum of S$12.4 million (Rp 117,148,000,000) based on the assertion that payments for these vessels have already been made and registration certificates have been issued in its name in Indonesia.
PTE has defended the claim on the basis that it has not received payment for these vessels. In addition, PTE is also taking the stand that there was fraud involved in the registration of these vessels. Thus, PTE has made a counter-claim against the Customer and another party for total sum of S$27.4 million (Rp 258,757,600,000) for total losses suffered by PTE.
Judgment was awarded in favour of PTE in April 2014. The customer and PTE have subsequently appealed to the High Court of Batam and the outcome of the appeal is still pending as at 31 December 2015.
The Group has not made any provisions in respect of the Customer’s claim because of the reason in the preceding paragraphs. Nevertheless, the Group has made allowance for impairment of $1,515,000 (2014: $1,904,000) in respect of amount receivable from the Customer.
(ii) In 2014, PTE commenced legal proceeding in Singapore High Court against several customers for unpaid works and services in amount of $642,990. In the Court’s proceedings, these defendants also counter-claimed against PTE for alleged defects in the works carried out in relation to the vessels, loss of use of the vessels and other alleged dues and charges amounting to $3,415,998. The outcome of the cases are still pending as at 31 December 2015.
Based on the information available, the management is of the view that the defendants allegations and counter-claims are without merits. Thus, the Group has not made any provisions in respect of the above counter-claims.
(iii) During the financial year, a writ of summons has been filed against Oil & Gas Solutions Pte Ltd (“OGS”), a former subsidiary that had been deconsolidated during the financial year. The Plaintiffs claim against OGS for the sum of $663,811 as well as warehousing charges, interest, cost and other disbursements pursuant to a contract between the Plaintiffs and OGS. The outcome of the claim is still pending as at 31 December 2015.
As OGS had been deconsolidated from the Group’s financial statements, the management is of the opinion that the claim is not expected to have any material impact to the Group.
(iv) A customer has also submitted its claims to OGS for total compensation sums that amounted to $6.37 million in relation to a project. The management has assessed and considered that the claims was still preliminary and no provision is required. As OGS had been deconsolidated during the financial year, the management is of the opinion that the claim is not expected to have any material impact to the Group.
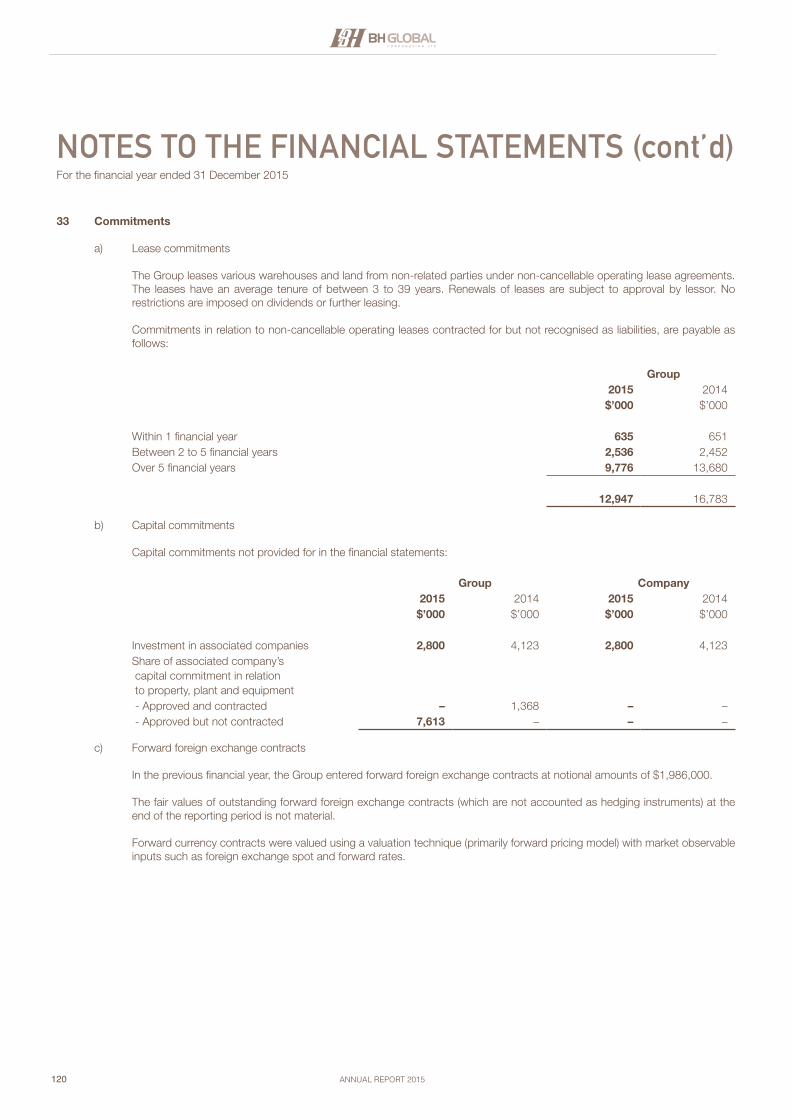
120
NOTES TO THE FINANCIAL STATEMENTS (cont’d)For the financial year ended 31 December 2015
ANNUAL REPORT 2015
33 Commitments
a) Lease commitments
The Group leases various warehouses and land from non-related parties under non-cancellable operating lease agreements. The leases have an average tenure of between 3 to 39 years. Renewals of leases are subject to approval by lessor. No restrictions are imposed on dividends or further leasing.
Commitments in relation to non-cancellable operating leases contracted for but not recognised as liabilities, are payable as follows:
Group2015 2014
$’000 $’000
Within 1 financial year 635 651Between 2 to 5 financial years 2,536 2,452Over 5 financial years 9,776 13,680
12,947 16,783
b) Capital commitments
Capital commitments not provided for in the financial statements:
Group Company2015 2014 2015 2014
$’000 $’000 $’000 $’000
Investment in associated companies 2,800 4,123 2,800 4,123Share of associated company’s capital commitment in relation to property, plant and equipment - Approved and contracted – 1,368 – – - Approved but not contracted 7,613 – – –
c) Forward foreign exchange contracts
In the previous financial year, the Group entered forward foreign exchange contracts at notional amounts of $1,986,000.
The fair values of outstanding forward foreign exchange contracts (which are not accounted as hedging instruments) at the end of the reporting period is not material.
Forward currency contracts were valued using a valuation technique (primarily forward pricing model) with market observable inputs such as foreign exchange spot and forward rates.
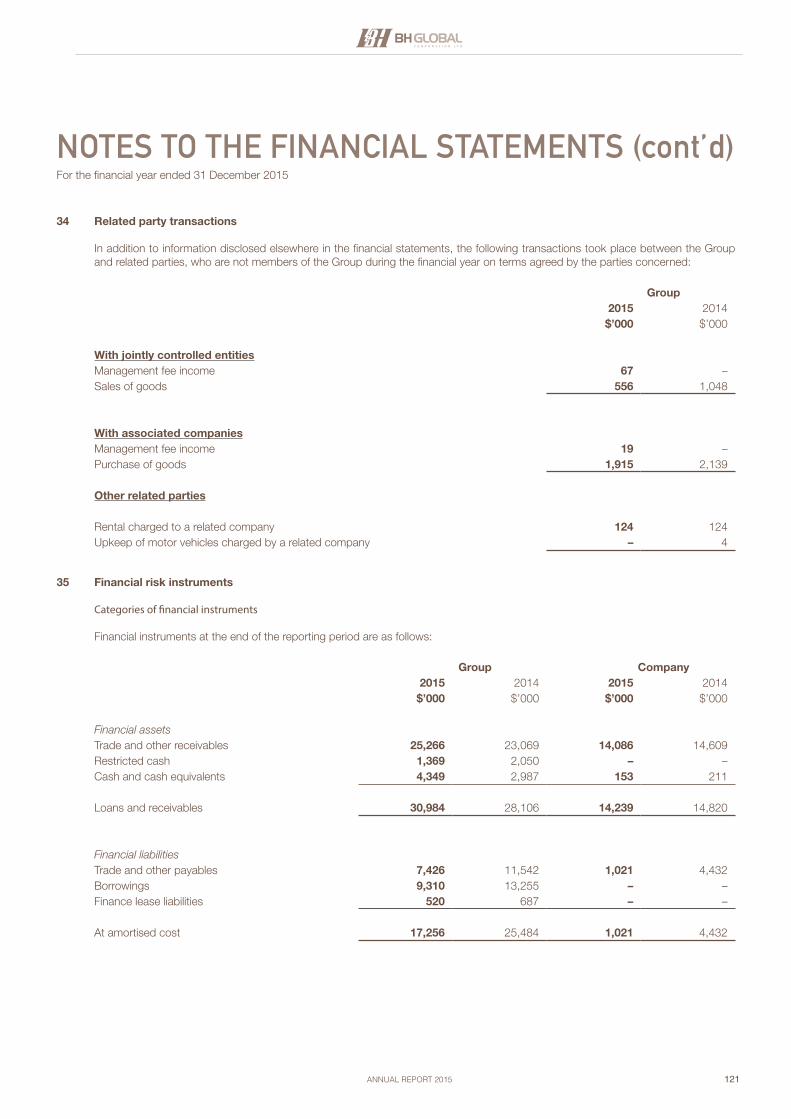
121
NOTES TO THE FINANCIAL STATEMENTS (cont’d)For the financial year ended 31 December 2015
ANNUAL REPORT 2015
34 Related party transactions
In addition to information disclosed elsewhere in the financial statements, the following transactions took place between the Group and related parties, who are not members of the Group during the financial year on terms agreed by the parties concerned:
Group2015 2014
$’000 $’000
With jointly controlled entitiesManagement fee income 67 –Sales of goods 556 1,048
With associated companiesManagement fee income 19 –Purchase of goods 1,915 2,139
Other related parties
Rental charged to a related company 124 124Upkeep of motor vehicles charged by a related company – 4
35 Financial risk instruments
Categories of financial instruments
Financial instruments at the end of the reporting period are as follows:
Group Company2015 2014 2015 2014
$’000 $’000 $’000 $’000
Financial assetsTrade and other receivables 25,266 23,069 14,086 14,609Restricted cash 1,369 2,050 – –Cash and cash equivalents 4,349 2,987 153 211
Loans and receivables 30,984 28,106 14,239 14,820
Financial liabilitiesTrade and other payables 7,426 11,542 1,021 4,432Borrowings 9,310 13,255 – –Finance lease liabilities 520 687 – –
At amortised cost 17,256 25,484 1,021 4,432
122
NOTES TO THE FINANCIAL STATEMENTS (cont’d)For the financial year ended 31 December 2015
ANNUAL REPORT 2015
35 Financial risk instruments (cont’d)
Financial risk management
The Group’s activities expose it to market risk (including foreign exchange risk, interest rate risk and commodity price risk), liquidity risk and credit risk. The Group’s overall financial risk management strategy seeks to minimise adverse effects from the unpredictability of financial markets on the Group’s financial performance.
The Board of Directors provides written principles for overall financial risk management and written policies covering the specific areas above. Such written policies are reviewed periodically by the Board of Directors.
There has been no significant change to the Group’s exposure to these financial risks or the manner in which it manages and measures financial risk. Market risk and credit risk exposures are measured using sensitivity analysis indicated below.
a) Market risk
Foreign exchange risk
Foreign currency risk arises on certain sales and purchases transactions that are denominated in currencies other than the respective functional currencies of entities in the Group. The currencies that give rise to this risk are primarily United States dollar, Euro and United Arab Emirates dirham.
The Group’s financial risk management policy is to hedge any exposure exceeding US$100,000 or EUR70,000 based on the weekly foreign exchange requirement report and cash flow of the Group. The use of financial derivatives primarily foreign currency forward contracts is governed by the Group’s policies approved by the Board of Directors. The Group does not use derivative financial instruments for speculative purposes.
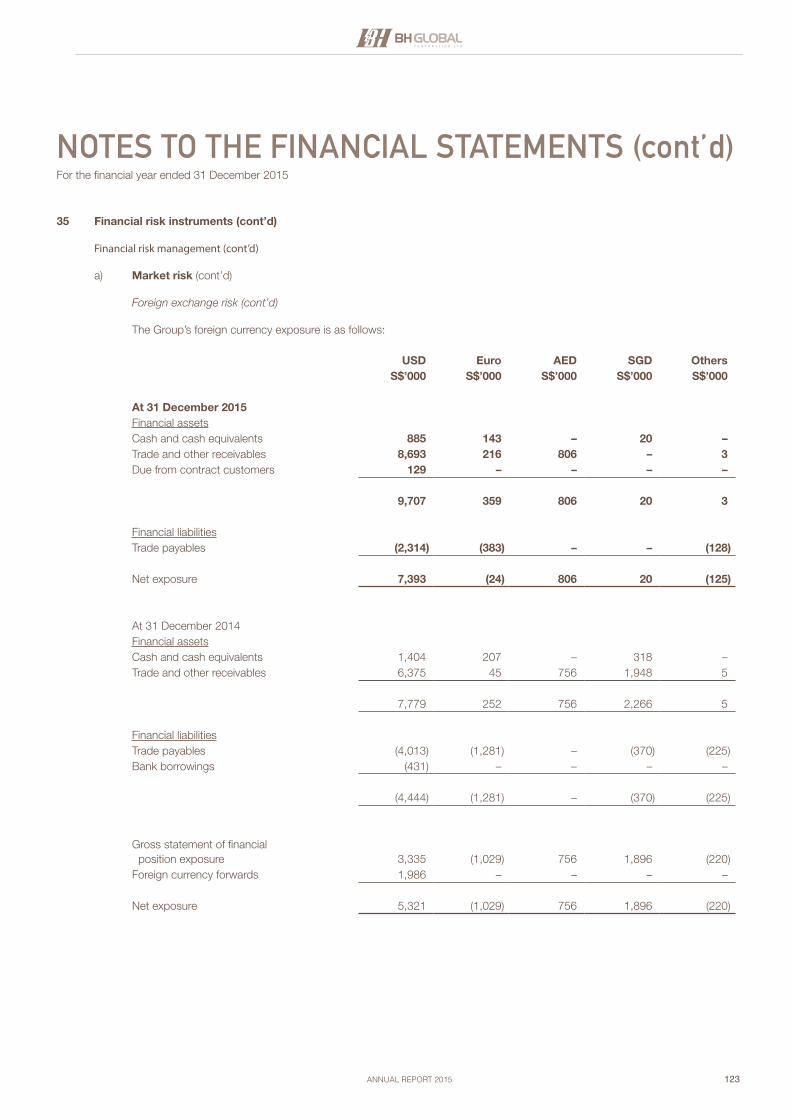
123
NOTES TO THE FINANCIAL STATEMENTS (cont’d)For the financial year ended 31 December 2015
ANNUAL REPORT 2015
35 Financial risk instruments (cont’d)
Financial risk management (cont’d)
a) Market risk (cont’d)
Foreign exchange risk (cont’d)
The Group’s foreign currency exposure is as follows:
USD Euro AED SGD OthersS$’000 S$’000 S$’000 S$’000 S$’000
At 31 December 2015Financial assetsCash and cash equivalents 885 143 – 20 –Trade and other receivables 8,693 216 806 – 3Due from contract customers 129 – – – –
9,707 359 806 20 3
Financial liabilitiesTrade payables (2,314) (383) – – (128)
Net exposure 7,393 (24) 806 20 (125)
At 31 December 2014Financial assetsCash and cash equivalents 1,404 207 – 318 –Trade and other receivables 6,375 45 756 1,948 5
7,779 252 756 2,266 5
Financial liabilitiesTrade payables (4,013) (1,281) – (370) (225)Bank borrowings (431) – – – –
(4,444) (1,281) – (370) (225)
Gross statement of financial position exposure 3,335 (1,029) 756 1,896 (220)Foreign currency forwards 1,986 – – – –
Net exposure 5,321 (1,029) 756 1,896 (220)
124
NOTES TO THE FINANCIAL STATEMENTS (cont’d)For the financial year ended 31 December 2015
ANNUAL REPORT 2015
35 Financial risk instruments (cont’d)
Financial risk management (cont’d)
a) Market risk (cont’d)
Foreign exchange risk (cont’d)
The Company’s foreign currency exposure based on the information provided by key management is $806,000 (2014: $756,000) included in other receivables and amount due from joint venture companies which is denominated in United Arab Emirates dirham.
Sensitivity analysis of the Group’s and Company’s foreign exchange risk exposure are not presented as a reasonably possible change of 5% in the foreign currencies exchange rates against the respective functional currencies of the Group’s entities, with all other variables held constant will have no significant impact on the Group’s and Company’s net loss.
Interest rate risk
The Group’s exposure to the risk of changes in interest rates arise mainly from the Group’s fixed deposits placed with financial institutions and bank borrowings. For interest income from the fixed deposits, the Group manages the interest rate risks by placing fixed deposits with reputable financial institutions on varying maturities and interest rate terms. Interest expense from bank borrowings arises from term loans, working capital loans, trust receipts and bank overdrafts (Note 29).
The Company’s exposure to interest rate risk is minimal as the impact of interest rate fluctuations on loans to subsidiaries (Note 22) are insignificant, and the Company has no other interest-bearing liabilities.
Sensitivity analysis of the Group’s and Company’s interest rate risk exposures are not presented as the impact of an increase/decrease of 50 basis points in interest rates are not expected to be significant.
Commodity price risk
The Group has commodity price risk as copper and steel are its main raw materials. Copper and steel are traded commodities and their prices are subject to the fluctuations of the world commodity markets. Any significant increases in the prices for copper and steel will have a material adverse impact on the financial position and results of operation. The Group’s profitability will be adversely affected if the Group is unable to pass on any increase in raw material prices to its customers on a timely basis or find cheaper alternative sources of supply.
b) Liquidity risk
Liquidity risk is the risk that the Group will encounter difficulty in meeting financial obligations due to shortage of funds. The Group’s exposure to liquidity risk arises primarily from mismatches of the maturities of financial assets and liabilities. The Group manages the liquidity risk by maintaining sufficient cash to enable them to meet their normal operating commitments and having an adequate amount of committed credit facilities (Note 29).
125
NOTES TO THE FINANCIAL STATEMENTS (cont’d)For the financial year ended 31 December 2015
ANNUAL REPORT 2015
35 Financial risk instruments (cont’d)
Financial risk management (cont’d)
b) Liquidity risk (cont’d)
The table below summarises the maturity profile of the Group’s and Company’s non-derivative financial liabilities at the end of the reporting period based on contractual undiscounted repayment obligations.
1 year or less
1 to 5 year
More than 5 years Total
$’000 $’000 $’000 $’000
Group2015Trade and other payables 7,426 – – 7,426Bank borrowings 9,413 – – 9,413Finance lease obligations 189 411 – 600Financial guarantee contracts 15,717 – – 15,717
32,745 411 – 33,156
2014Trade and other payables 11,542 – – 11,542Bank borrowings 13,350 159 – 13,509Finance lease obligations 209 553 27 789Financial guarantee contracts 14,372 – – 14,372
39,473 712 27 40,212
1 year or less
$’000
Company2015Trade and other payables 1,021Financial guarantee contracts 54,517
55,538
2014Trade and other payables 479Financial guarantee contracts 68,672
69,151
126
NOTES TO THE FINANCIAL STATEMENTS (cont’d)For the financial year ended 31 December 2015
ANNUAL REPORT 2015
35 Financial risk instruments (cont’d)
Financial risk management (cont’d)
b) Liquidity risk (cont’d)
The table below analyses the Group’s derivative financial instruments for which contractual maturities are essential for an understanding of the timing of the cash flows into relevant maturity groups based on the contractual maturity date. The amounts disclosed in the table below are the contractual undiscounted cash flows.
GroupLess than 1 year
2015 2014$’000 $’000
Gross - settled currency forwards- Receipts – 1,986- Payments – (1,935)
c) Credit risk
Credit risk refers to the risk that counterparty will default on its contractual obligations resulting in financial loss to the Group. The Group has credit policies in place to ensure that sale of products are made to customers with appropriate credit histories and the exposure to credit risk is monitored on an ongoing basis by the directors. Credit evaluations are performed on all customers requiring credit extension or credit limit. The maximum exposure to credit risk is represented by the carrying amount of loans and receivables in the statement of financial position and the following:
Group Company2015 2014 2015 2014
$’000 $’000 $’000 $’000
Corporate guarantees provided to banks for financing facilities granted to (Note 29):- Subsidiaries – – 38,800 54,300- Joint venture 15,717 14,372 15,717 14,372
15,717 14,372 54,517 68,672
At the end of the reporting period, there were significant concentrations of credit risks primarily on trade receivables.
The Group’s 3 (2014: 4) largest trade receivables amounted to $3,349,000 (2014: $11,589,000) and this represented 21% (2014: 50%) of total trade receivables and of which one major corporate customer represented 9% (2014: 22%) of total trade receivables.
The Company has significant credit risk exposures arising on amount due from subsidiaries of $12,353,000 (2014: $13,178,000) which represented 88% (2014: 90%) of total receivables.
Non-trade balances due from subsidiaries, associated companies and joint ventures are generally repayable on demand and are not past due as at the end of the reporting period.
Except as disclosed in Note 28(b), no additional material adjustment was required in the separate financial statements of the Company to recognise the financial guarantee liability.
127
NOTES TO THE FINANCIAL STATEMENTS (cont’d)For the financial year ended 31 December 2015
ANNUAL REPORT 2015
35 Financial risk instruments (cont’d)
Financial risk management (cont’d)
c) Credit risk (cont’d)
The Group’s trade receivables comprise the following:
Group2015 2014
$’000 $’000
Not past due 9,669 8,463Past due but not impaired 6,554 12,173Past due and impaired 3,384 1,970
19,607 22,606
Financial assets that are past due but not impaired
Past due 0 to 3 months 4,967 8,231Past due 3 to 6 months 1,017 1,391Past due over 6 months 570 2,551
6,554 12,173
Included in trade receivables is an amount due from a customer of $3,269,000 (Rp31,884,758,000) (2014: $3,450,000 (Rp32,508,541,000)) of which the customer is currently claiming against a subsidiary in Indonesia, PT. BH Marine & Offshore Engineering (“PTE”) for alleged non-delivery of three vessels (Note 32(b)(i)). During the financial year, the Group has made an allowance for impairment amounted to $1,515,000 (2014: $1,904,000) in view of the uncertainty of collection.
Financial assets that are past due and impaired
Full allowance for impairment of trade receivables had been provided for debts which are past due and impaired.
36 Fair value of assets and liabilities
a) Fair value hierarchy
The tables below analyse the fair value measurements by the levels in the fair value hierarchy based on the inputs to the valuation techniques. The different levels are defined as follows:
i) Level 1 – quoted prices (unadjusted) in active markets for identical assets or liabilities;ii) Level 2 – inputs other than quoted prices included within Level 1 that are observable for the asset or liability,
either directly or indirectly (i.e. derived from prices); andiii) Level 3 – inputs for the asset or liability that are not based on observable market data (unobservable inputs).
128
NOTES TO THE FINANCIAL STATEMENTS (cont’d)For the financial year ended 31 December 2015
ANNUAL REPORT 2015
36 Fairvalueofassetsandliabilities(cont’d)b) Fair value measurements of assets and liabilities that are measured at fair value
The following table presents the level of fair value hierarchy for each class of assets and liabilities measured at fair value on the statements of financial position at the end of the reporting period:
Level 1 Level 2 Level 3 Total$’000 $’000 $’000 $’000
2014GroupRecurring fair value measurementsFinancial assetsDerivatives- Forward currency contracts – –* – –
* Forward currency contracts are included in Level 2 of the fair value hierarchy. The fair value of these contracts is insignificant at the end of the reporting date.
c) Fair value of other assets and liabilities
The carrying amounts of other financial assets and financial liabilities recorded in the consolidated financial statements of the Group and the statement of financial position of the Company approximate their respective fair values due to the relatively short-term maturity of these financial instruments or that there are no significant changes in the interest borrowing rates available to the Group at the end of the reporting period.
d) Determination of fair values
Fair values have been determined for measurement and/or disclosure purposes based on the following methods:
Derivatives
The fair values of forward exchange contracts (Level 2 fair values) are based on broker quotes for equivalent instruments valued at the market forward rates applicable to the remaining period to maturity of the contracts.
Purchase deposit to a supplier, contingent consideration receivable, finance lease liabilities and bank borrowings
The basis of determining fair value for disclosure at the end of the reporting period is disclosed in Notes 16, 17, 26 and 29.
129
NOTES TO THE FINANCIAL STATEMENTS (cont’d)For the financial year ended 31 December 2015
ANNUAL REPORT 2015
7 Segment information
For management purpose, the Group is organised into business segments, with each segment representing a strategic business segment that offers different products/services. The Group has two main business segments, Supply Chain Management and Manufacturing segments.
Supply Chain Management is further sub-divided into:
a. Marine cables and accessories; b. Marine lighting equipment and accessories; andc. Others
During the financial year, the Group discontinued the operations of a subsidiary, Oil & Gas Solutions Pte Ltd, which was previously reported under the Engineering Services Segment (Note 6).
The following tables present revenue, segment results, assets and liabilities, depreciation, other significant non-cash expenses and capital expenditure information for the Group.
GroupRestated
2015 2014$’000 $’000
Segment revenue
Supply Chain ManagementSales to external customersMarine cables and accessories 35,796 36,370Marine lighting equipment and accessories 10,953 12,077Others 7,204 7,286
53,953 55,733Intersegment sales – 1,793
Subtotal 53,953 57,526
ManufacturingSales to external customersGalvanised steel wire 1,624 18,569Intersegment sales – 10
Subtotal 1,624 18,579
Less: Eliminations – (1,803)
Total revenue from continuing operations 55,577 74,302
130
NOTES TO THE FINANCIAL STATEMENTS (cont’d)For the financial year ended 31 December 2015
ANNUAL REPORT 2015
37 Segment information (cont’d)
GroupRestated
2015 2014$’000 $’000
Segment results
Supply Chain ManagementMarine cables and accessories 812 712Marine lighting equipment and accessories 2,078 1,810Others 1,344 1,197
4,234 3,719ManufacturingGalvanised steel wire (2,618) (5,819)
Total segment results 1,616 (2,100)
Share of results of joint ventures (2,125) (483)Share of results of associated companies (524) 130
Net loss before tax (1,033) (2,453)Tax (expense)/credit (650) 1,061
Net loss from continuing operations, net of tax (1,683) (1,392)Loss from discontinued operations, net of tax (4,541) (5,132)
Net loss for the financial year (6,224) (6,524)Non-controlling interests 2,014 4,361
Net loss attributable to equity holders of the Company (4,210) (2,163)
Group Assets and Liabilities
AssetsSupply Chain ManagementMarine cables and accessories 63,621 51,947Marine lighting equipment and accessories 16,819 13,219Others 9,938 7,536ManufacturingGalvanised steel wire 1,273 3,456Engineering ServicesEngineering and installation – 16,627Unallocated corporate assets 44 79Disposal group assets classified as held for sale – 18,714Property held for sale – 1,527
Total assets 91,695 113,105

131
NOTES TO THE FINANCIAL STATEMENTS (cont’d)For the financial year ended 31 December 2015
ANNUAL REPORT 2015
37 Segment information (cont’d)
Group2015 2014
$’000 $’000Group Assets and Liabilities (cont’d)Segment assets includes:Investment in joint ventures and associated companiesSupply Chain ManagementMarine cables and accessories 1,579 1,345Marine lighting equipment and accessories 483 447Others 354 301Manufacturing 12,149 11,085
14,565 13,178Additions to non-current assetsSupply Chain ManagementMarine cables and accessories 299 430Marine lighting equipment and accessories 91 143Others 60 86ManufacturingMarine switchboards – 800Galvanised steel wire – 110Engineering ServicesEngineering and installation 18 157
468 1,726LiabilitiesSupply Chain ManagementMarine cables and accessories 14,765 11,450Marine lighting equipment and accessories 4,518 3,802Others 2,971 2,294ManufacturingGalvanised steel wire 40 137Engineering ServicesEngineering and installation – 11,457Unallocated corporate liabilities 2,112 2,329Liabilities directly associated with disposal group classified as held for sale – 10,429
Total liabilities 24,406 41,898
Other segment informationDepreciation RestatedSupply Chain ManagementMarine cables and accessories 993 1,667Marine lighting equipment and accessories 304 554Others 200 334ManufacturingGalvanised steel wire 4 1,172
1,501 3,727
132
NOTES TO THE FINANCIAL STATEMENTS (cont’d)For the financial year ended 31 December 2015
ANNUAL REPORT 2015
37 Segment information (cont’d)
Group2015 2014
$’000 $’000Impairment lossSupply Chain ManagementMarine cables and accessories 165 –Marine lighting equipment and accessories 51 –Others 33 –ManufacturingGalvanised steel wire 184 –
433 –
RestatedOther significant non-cash expensesSupply Chain ManagementMarine cables and accessories 3,046 75Marine lighting equipment and accessories 932 25Others 613 15ManufacturingGalvanised steel wire – 712
4,591 827
Significant non-cash expenses (other than depreciation) consist of the following:
Allowance for impairment of receivable 73 –Allowance for impairment of receivable written back – (97)Inventories written down 445 124Loss on deemed disposal of a subsidiary – 712Provision for liabilities 4,073 88
4,591 827
Segment results
Performance of each segment is evaluated based on segment profit or loss which is measured differently from the net profit or loss before tax in the consolidated financial statements.
Segment assets
The amounts provided to the Management with respect to total assets are measured in a manner consistent with that of the financial statements. Management monitors the assets attributable to each segment for the purposes of monitoring segment performance and for allocating resources between segments. All assets are allocated to reportable segments other than deferred income tax assets which are classified as unallocated assets.
Segment liabilities
The amounts provided to the Management with respect to total liabilities are measured in a manner consistent with that of the financial statements. All liabilities are allocated to the reportable segments based on the operations of the segments other than current and deferred tax liabilities which are classified as unallocated liabilities.

133
NOTES TO THE FINANCIAL STATEMENTS (cont’d)For the financial year ended 31 December 2015
ANNUAL REPORT 2015
37 Segment information (cont’d)
Geographical Information
Revenue and non-current assets information based on the billing location of customers and assets respectively are as follows:
Revenue Non-current assets(Restated)
2015 2014 2015 2014$’000 $’000 $’000 $’000
Singapore 33,322 38,213 13,837 14,880China 4,811 4,789 12,149 11,085Japan 3,754 3,672 – –Vietnam 3,530 1,203 – –India 2,509 1,135 24 25Sultanate of Oman 8 12,627 – –United Arab Emirates 1,312 4,479 2,380 2,061Indonesia 2,335 1,075 2,723 4,285Malaysia 2,243 2,229 – –Other countries 1,753 4,880 – –
55,577 74,302 31,113 32,336
Other countries comprise Australia, Korea, Maldives, Philippines, Sri Lanka, Saudi Arabia; Thailand, United Kingdom, United States of America and etc.
Non-current assets information presented above are non-current assets as presented on the consolidated statement of financial position excluding deferred tax assets and other financial assets.
Information about major customer
Revenue of approximately $5,722,000 (2014: $7,499,000) are derived from one external customer that contributes more than 10% of the Group revenue and are attributable to the Supply Chain Management Segment.
38 Capital management
The Group’s objective when managing capital are to safeguard the Group’s ability to continue as a going concern and to maintain an optimal capital structure so as to maximise shareholders’ value. In order to maintain or achieve an optimal capital structure, the Group may adjust the amount of dividend payment, return capital to shareholders, issue new shares, buy back issued shares, obtain new borrowings or sell assets to reduce borrowings.
The capital structure of the Group mainly consists of equity and borrowings and the Group’s overall strategy remains unchanged from 2014.
39 Authorisation of financial statements
The consolidated financial statements of the Group and the statement of financial position and statement of changes in equity of the Company for the financial year ended 31 December 2015 were authorised for issue in accordance with a resolution of the directors dated 24 March 2016.
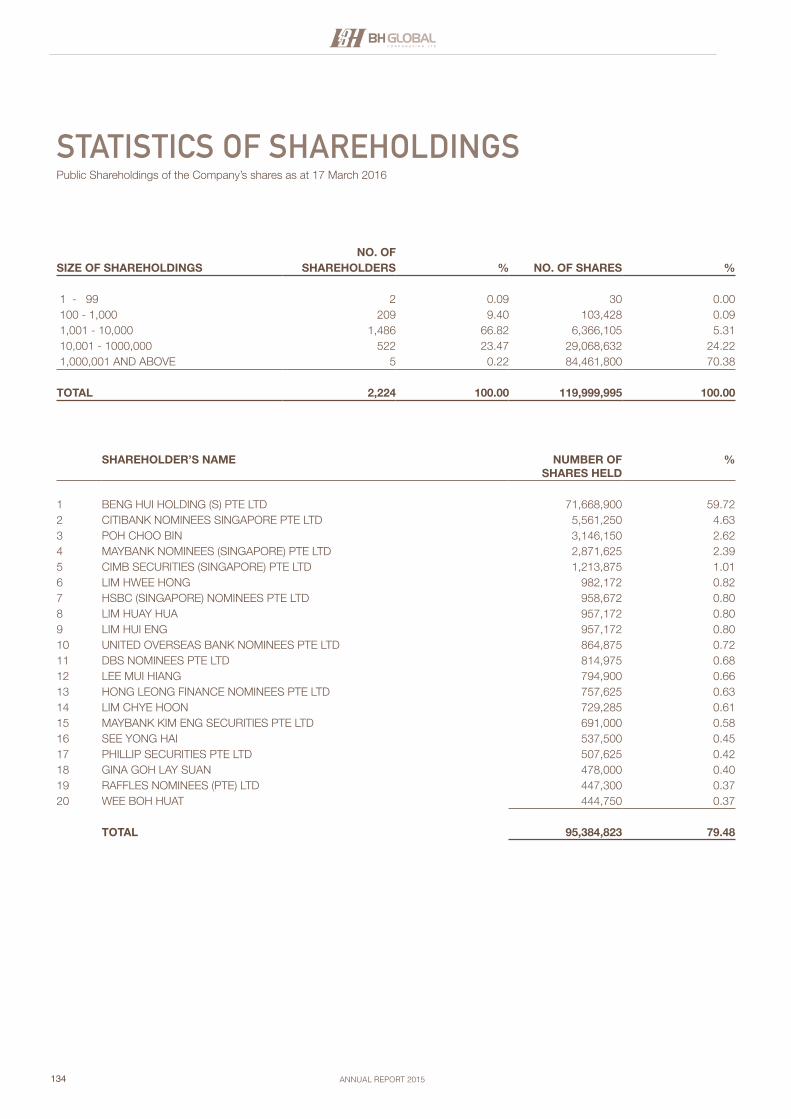
134 ANNUAL REPORT 2015
STATISTICS OF SHAREHOLDINGSPublic Shareholdings of the Company’s shares as at 17 March 2016
SHAREHOLDER’S NAME NUMBER OF SHARES HELD
%
1 BENG HUI HOLDING (S) PTE LTD 71,668,900 59.722 CITIBANK NOMINEES SINGAPORE PTE LTD 5,561,250 4.633 POH CHOO BIN 3,146,150 2.624 MAYBANK NOMINEES (SINGAPORE) PTE LTD 2,871,625 2.395 CIMB SECURITIES (SINGAPORE) PTE LTD 1,213,875 1.016 LIM HWEE HONG 982,172 0.827 HSBC (SINGAPORE) NOMINEES PTE LTD 958,672 0.808 LIM HUAY HUA 957,172 0.809 LIM HUI ENG 957,172 0.8010 UNITED OVERSEAS BANK NOMINEES PTE LTD 864,875 0.7211 DBS NOMINEES PTE LTD 814,975 0.6812 LEE MUI HIANG 794,900 0.6613 HONG LEONG FINANCE NOMINEES PTE LTD 757,625 0.6314 LIM CHYE HOON 729,285 0.6115 MAYBANK KIM ENG SECURITIES PTE LTD 691,000 0.5816 SEE YONG HAI 537,500 0.4517 PHILLIP SECURITIES PTE LTD 507,625 0.4218 GINA GOH LAY SUAN 478,000 0.4019 RAFFLES NOMINEES (PTE) LTD 447,300 0.3720 WEE BOH HUAT 444,750 0.37
TOTAL 95,384,823 79.48
NO. OFSIZE OF SHAREHOLDINGS SHAREHOLDERS % NO. OF SHARES %
1 - 99 2 0.09 30 0.00 100 - 1,000 209 9.40 103,428 0.09 1,001 - 10,000 1,486 66.82 6,366,105 5.31 10,001 - 1000,000 522 23.47 29,068,632 24.22 1,000,001 AND ABOVE 5 0.22 84,461,800 70.38
TOTAL 2,224 100.00 119,999,995 100.00
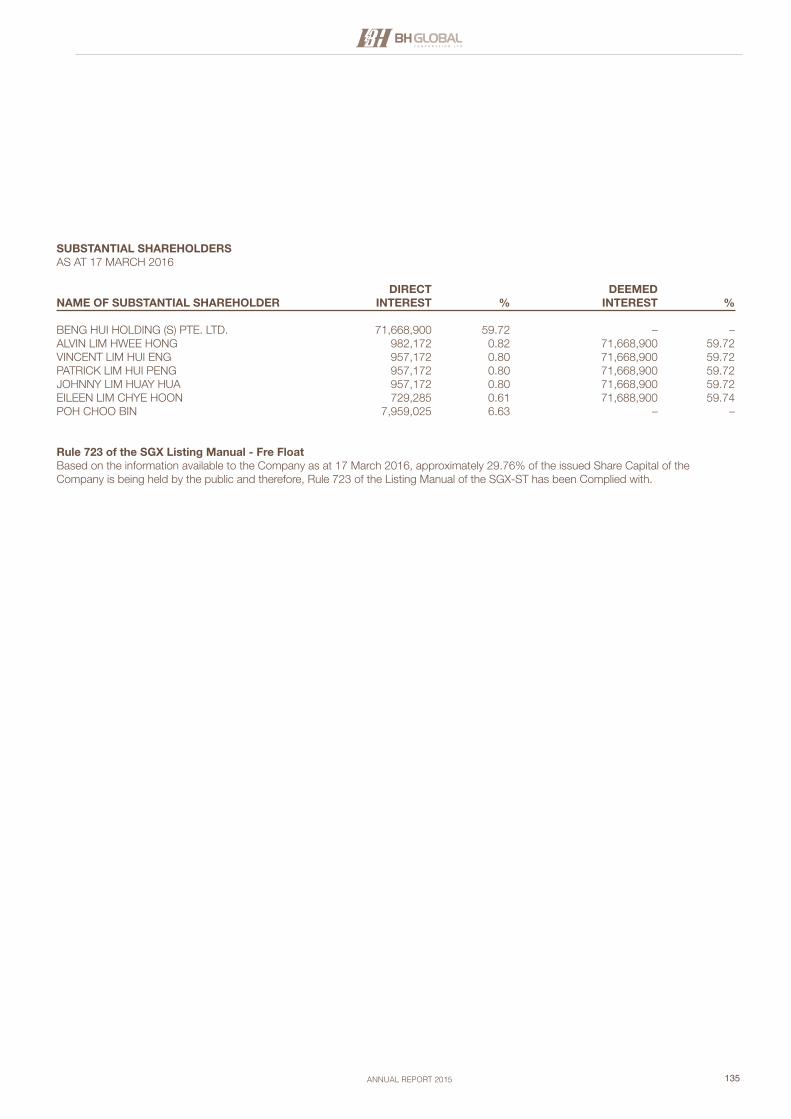
135ANNUAL REPORT 2015
SUBSTANTIAL SHAREHOLDERSAS AT 17 MARCH 2016
DIRECT DEEMEDNAME OF SUBSTANTIAL SHAREHOLDER INTEREST % INTEREST %
BENG HUI HOLDING (S) PTE. LTD. 71,668,900 59.72 – –ALVIN LIM HWEE HONG 982,172 0.82 71,668,900 59.72VINCENT LIM HUI ENG 957,172 0.80 71,668,900 59.72PATRICK LIM HUI PENG 957,172 0.80 71,668,900 59.72JOHNNY LIM HUAY HUA 957,172 0.80 71,668,900 59.72 EILEEN LIM CHYE HOON 729,285 0.61 71,688,900 59.74POH CHOO BIN 7,959,025 6.63 – –
Rule 723 of the SGX Listing Manual - Fre FloatBased on the information available to the Company as at 17 March 2016, approximately 29.76% of the issued Share Capital of theCompany is being held by the public and therefore, Rule 723 of the Listing Manual of the SGX-ST has been Complied with.
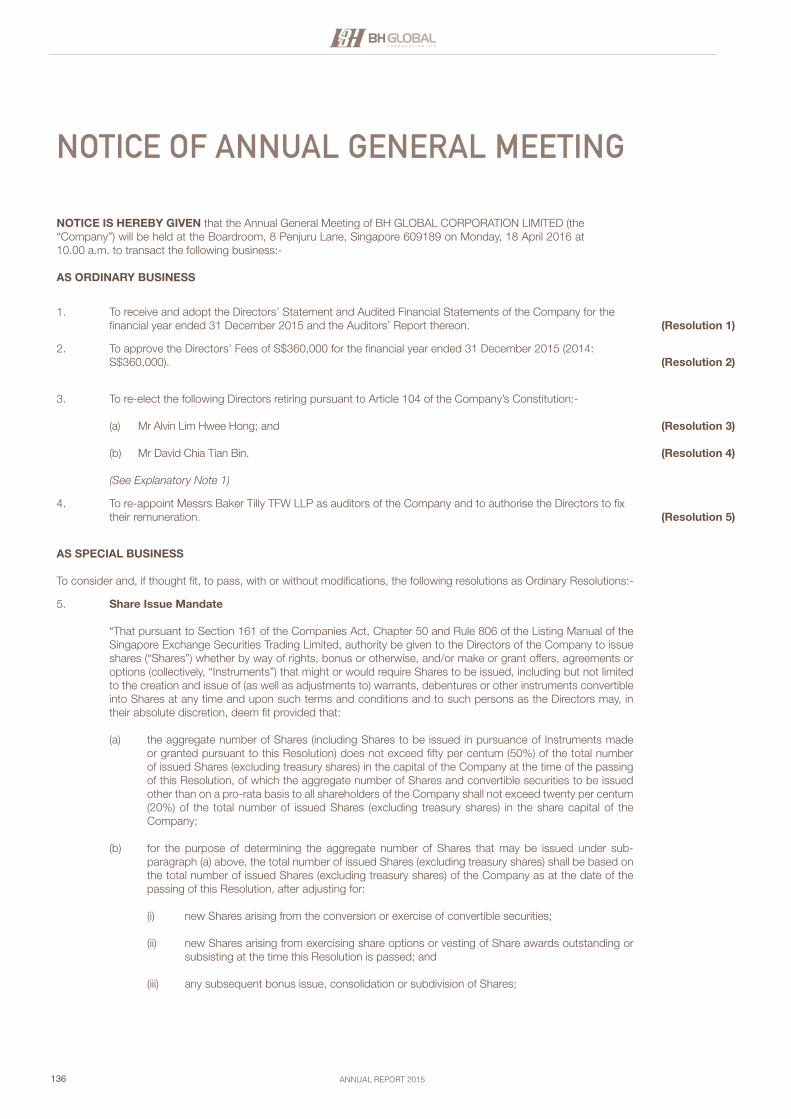
136 ANNUAL REPORT 2015
NOTICE OF ANNUAL GENERAL MEETING
NOTICE IS HEREBY GIVEN that the Annual General Meeting of BH GLOBAL CORPORATION LIMITED (the “Company”) will be held at the Boardroom, 8 Penjuru Lane, Singapore 609189 on Monday, 18 April 2016 at 10.00 a.m. to transact the following business:-
AS ORDINARY BUSINESS
1. To receive and adopt the Directors’ Statement and Audited Financial Statements of the Company for the financial year ended 31 December 2015 and the Auditors’ Report thereon. (Resolution 1)
2. To approve the Directors’ Fees of S$360,000 for the financial year ended 31 December 2015 (2014: S$360,000). (Resolution 2)
3. To re-elect the following Directors retiring pursuant to Article 104 of the Company’s Constitution:-
(a) Mr Alvin Lim Hwee Hong; and
(b) Mr David Chia Tian Bin.
(See Explanatory Note 1)
(Resolution 3)
(Resolution 4)
4. To re-appoint Messrs Baker Tilly TFW LLP as auditors of the Company and to authorise the Directors to fix their remuneration. (Resolution 5)
AS SPECIAL BUSINESS
To consider and, if thought fit, to pass, with or without modifications, the following resolutions as Ordinary Resolutions:-
5. Share Issue Mandate
“That pursuant to Section 161 of the Companies Act, Chapter 50 and Rule 806 of the Listing Manual of the Singapore Exchange Securities Trading Limited, authority be given to the Directors of the Company to issue shares (“Shares”) whether by way of rights, bonus or otherwise, and/or make or grant offers, agreements or options (collectively, “Instruments”) that might or would require Shares to be issued, including but not limited to the creation and issue of (as well as adjustments to) warrants, debentures or other instruments convertible into Shares at any time and upon such terms and conditions and to such persons as the Directors may, in their absolute discretion, deem fit provided that:
(a) the aggregate number of Shares (including Shares to be issued in pursuance of Instruments made or granted pursuant to this Resolution) does not exceed fifty per centum (50%) of the total number of issued Shares (excluding treasury shares) in the capital of the Company at the time of the passing of this Resolution, of which the aggregate number of Shares and convertible securities to be issued other than on a pro-rata basis to all shareholders of the Company shall not exceed twenty per centum (20%) of the total number of issued Shares (excluding treasury shares) in the share capital of the Company;
(b) for the purpose of determining the aggregate number of Shares that may be issued under sub-paragraph (a) above, the total number of issued Shares (excluding treasury shares) shall be based on the total number of issued Shares (excluding treasury shares) of the Company as at the date of the passing of this Resolution, after adjusting for:
(i) new Shares arising from the conversion or exercise of convertible securities;
(ii) new Shares arising from exercising share options or vesting of Share awards outstanding or subsisting at the time this Resolution is passed; and
(iii) any subsequent bonus issue, consolidation or subdivision of Shares;
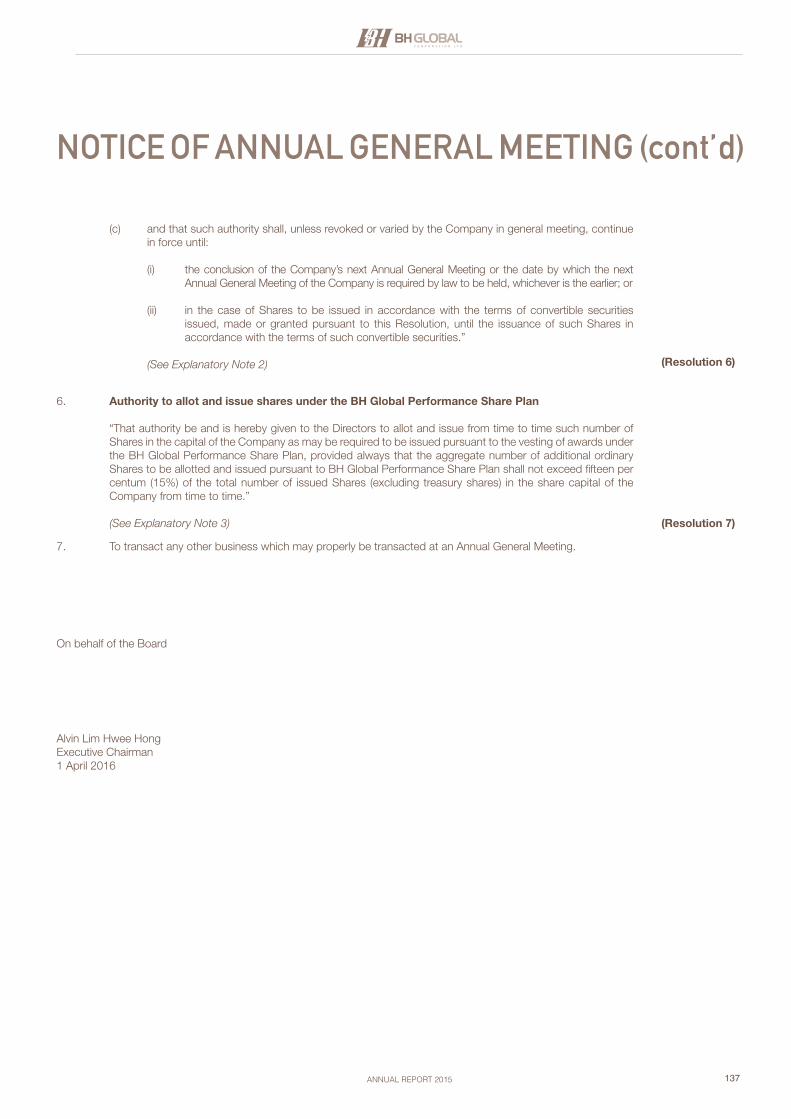
137ANNUAL REPORT 2015
(c) and that such authority shall, unless revoked or varied by the Company in general meeting, continue in force until:
(i) the conclusion of the Company’s next Annual General Meeting or the date by which the next Annual General Meeting of the Company is required by law to be held, whichever is the earlier; or
(ii) in the case of Shares to be issued in accordance with the terms of convertible securities issued, made or granted pursuant to this Resolution, until the issuance of such Shares in accordance with the terms of such convertible securities.”
(See Explanatory Note 2) (Resolution 6)
6. Authority to allot and issue shares under the BH Global Performance Share Plan
“That authority be and is hereby given to the Directors to allot and issue from time to time such number of Shares in the capital of the Company as may be required to be issued pursuant to the vesting of awards under the BH Global Performance Share Plan, provided always that the aggregate number of additional ordinary Shares to be allotted and issued pursuant to BH Global Performance Share Plan shall not exceed fifteen per centum (15%) of the total number of issued Shares (excluding treasury shares) in the share capital of the Company from time to time.”
(See Explanatory Note 3) (Resolution 7)
7. To transact any other business which may properly be transacted at an Annual General Meeting.
On behalf of the Board
Alvin Lim Hwee HongExecutive Chairman1 April 2016
NOTICE OF ANNUAL GENERAL MEETING (cont’d)
Explanatory Notes:-
1. Mr Alvin Lim Hwee Hong (Executive Chairman) is the sibling of the Executive Directors, Mr Vincent Lim Hui Eng and Mr Patrick Lim Hui Peng.
Mr David Chia Tian Bin (Independent Non-executive) will, upon re-election as Director of the Company, continue to serve as the Chairman of the Audit Committee as well as a member of the Remuneration Committee. He will be considered independent for the purposes of Rule 704(8) of the Listing Manual of the Singapore Exchange Securities Trading Limited.
Detailed information on Mr Alvin Lim Hwee Hong and Mr David Chia Tian Bin can be found under the “Directors’ Profile” section in the Company’s Annual Report 2015.
2. The proposed Ordinary Resolution 6, if passed, will empower the Directors from the date of the Annual General Meeting until the date of the next Annual General Meeting, to allot and issue Shares and convertible securities in the Company up to an amount not exceeding fifty per centum (50%) of the total number of issued Shares (excluding treasury shares) in the capital of the Company, of which up to twenty per centum (20%) may be issued other than on a pro-rata basis. For the purpose of this resolution, the total number of issued Shares (excluding treasury shares) is based on the Company’s total number of issued Shares (excluding treasury shares) at the time this proposed Ordinary Resolution is passed after adjusting for new Shares arising from the conversion or exercise of convertible securities, the exercise of share options or the vesting of share awards outstanding or subsisting at the time when this proposed Ordinary Resolution is passed and any subsequent bonus issue, consolidation or subdivision of Shares.
3. The proposed Ordinary Resolution 7, if passed, will empower the Directors of the Company, to allot and issue Shares in the Company of up to a number not exceeding in total fifteen per centum (15%) of the total number of issued Shares (excluding treasury shares) in the share capital of the Company from time to time pursuant to the grant of share awards under the BH Global Performance Share Plan.
Notes:-
(1) (a) A member of the Company who is entitled to attend and vote at the Annual General Meeting and who is not a relevant intermediary is entitled to appoint not more than two (2) proxies to attend and vote in his stead. Where such member appoints more than one (1) proxy, he/she shall specify the proportion of his/her shareholding to be represented by each proxy. A proxy need not be a member of the Company. If the appointer is a corporation, the proxy must be executed under seal or the hand of its duly authorised officer or attorney.
(b) A member of the Company who is entitled to attend and vote at the Annual General Meeting and who is a relevant intermediary is entitled to appoint more than two (2) proxies to attend and vote in his stead. Where such member appoints more than one (1) proxy, the number and class of shares in relation to which each proxy has been appointed shall be specified in the form of proxy.
“Relevant intermediary” has the meaning ascribed to it in Section 181 of the Companies Act, Chapter 50.
(2) A proxy need not be a member of the Company.
(3) A member of the Company, which is a corporation, is entitled to appoint its authorised representative or proxy to vote on its behalf.
(4) The instrument or form appointing a proxy, duly executed, must be deposited at the office of the Company’s Share Registrar, Tricor Barbinder Share Registration Services at 80 Robinson Road #11-02, Singapore 068898 not less than 48 hours before the time appointed for holding the Annual General Meeting in order for the proxy to be entitled to attend and vote at the Annual General Meeting.
PERSONAL DATA PRIVACYBy submitting an instrument appointing a proxy(ies) and/or representative(s) to attend, speak and vote at the Annual General Meeting and/or any adjournment thereof, a member of the Company (i) consents to the collection, use and disclosure of the member’s personal data by the Company (or its agents or service providers) for the purpose of the processing, administration and analysis by the Company (or its agents or service providers) of proxies and representatives appointed for the Annual General Meeting (including any adjournment thereof) and the preparation and compilation of the attendance lists, minutes and other documents relating to the Annual General Meeting (including any adjournment thereof), and in order for the Company (or its agents or service providers) to comply with any applicable laws, listing rules, regulations and/or guidelines (collectively, the “Purposes”), (ii) warrants that where the member discloses the personal data of the member’s proxy(ies) and/or representative(s) to the Company (or its agents or service providers), the member has obtained the prior consent of such proxy(ies) and/or representative(s) for the collection, use and disclosure by the Company (or its agents or service providers) of the personal data of such proxy(ies) and/or representative(s) for the Purposes, and (iii) agrees that the member will indemnify the Company in respect of any penalties, liabilities, claims, demands, losses and damages as a result of the member’s breach of warranty.
NOTICE OF ANNUAL GENERAL MEETING (cont’d)
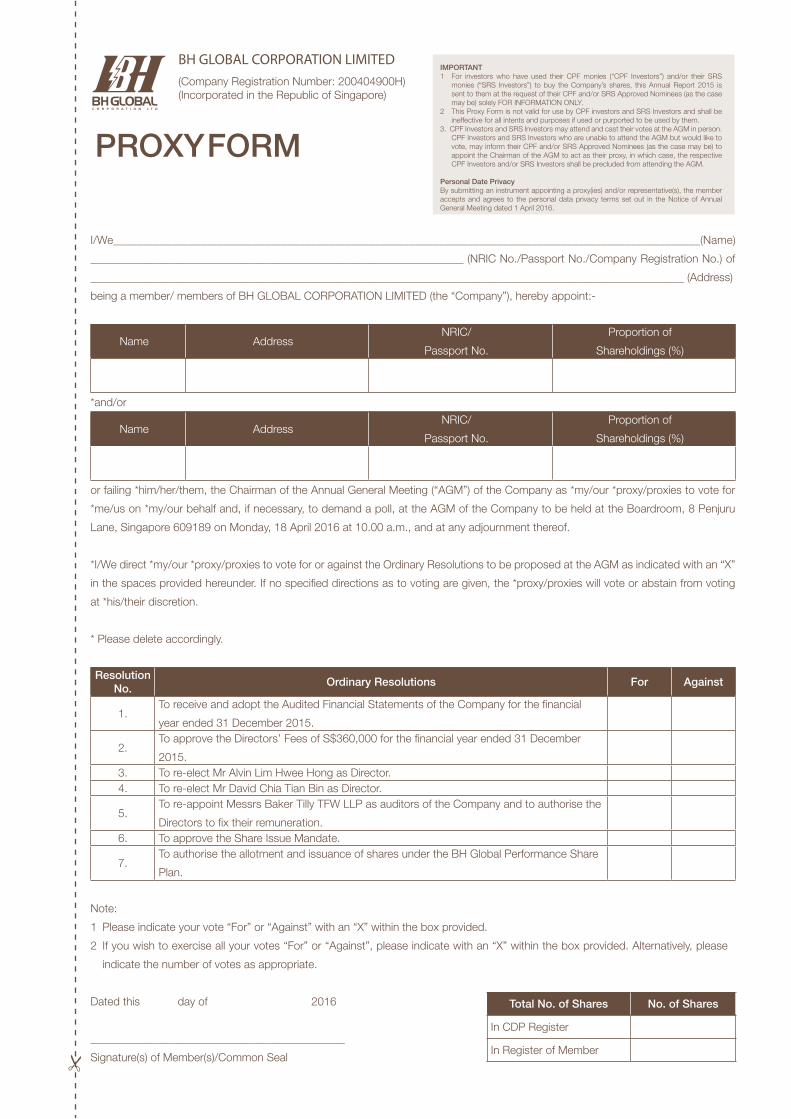
PROXY FORM
BH GLOBAL CORPORATION LIMITED(Company Registration Number: 200404900H)(Incorporated in the Republic of Singapore)
IMPORTANT1 For investors who have used their CPF monies (“CPF Investors”) and/or their SRS
monies (“SRS Investors”) to buy the Company’s shares, this Annual Report 2015 is sent to them at the request of their CPF and/or SRS Approved Nominees (as the case may be) solely FOR INFORMATION ONLY.
2 This Proxy Form is not valid for use by CPF investors and SRS Investors and shall be ineffective for all intents and purposes if used or purported to be used by them.
3. CPF Investors and SRS Investors may attend and cast their votes at the AGM in person. CPF Investors and SRS Investors who are unable to attend the AGM but would like to vote, may inform their CPF and/or SRS Approved Nominees (as the case may be) to appoint the Chairman of the AGM to act as their proxy, in which case, the respective CPF Investors and/or SRS Investors shall be precluded from attending the AGM.
Personal Date PrivacyBy submitting an instrument appointing a proxy(ies) and/or representative(s), the member accepts and agrees to the personal data privacy terms set out in the Notice of Annual General Meeting dated 1 April 2016.
I/We_____________________________________________________________________________________________________(Name)
__________________________________________________________________ (NRIC No./Passport No./Company Registration No.) of
_________________________________________________________________________________________________________ (Address)
being a member/ members of BH GLOBAL CORPORATION LIMITED (the “Company”), hereby appoint:-
Name AddressNRIC/
Passport No.
Proportion of
Shareholdings (%)
*and/or
Name AddressNRIC/
Passport No.
Proportion of
Shareholdings (%)
or failing *him/her/them, the Chairman of the Annual General Meeting (“AGM”) of the Company as *my/our *proxy/proxies to vote for
*me/us on *my/our behalf and, if necessary, to demand a poll, at the AGM of the Company to be held at the Boardroom, 8 Penjuru
Lane, Singapore 609189 on Monday, 18 April 2016 at 10.00 a.m., and at any adjournment thereof.
*I/We direct *my/our *proxy/proxies to vote for or against the Ordinary Resolutions to be proposed at the AGM as indicated with an “X”
in the spaces provided hereunder. If no specified directions as to voting are given, the *proxy/proxies will vote or abstain from voting
at *his/their discretion.
* Please delete accordingly.
Resolution No.
Ordinary Resolutions For Against
1.To receive and adopt the Audited Financial Statements of the Company for the financial
year ended 31 December 2015.
2.To approve the Directors’ Fees of S$360,000 for the financial year ended 31 December
2015.3. To re-elect Mr Alvin Lim Hwee Hong as Director.4. To re-elect Mr David Chia Tian Bin as Director.
5.To re-appoint Messrs Baker Tilly TFW LLP as auditors of the Company and to authorise the
Directors to fix their remuneration.6. To approve the Share Issue Mandate.
7.To authorise the allotment and issuance of shares under the BH Global Performance Share
Plan.
Note:
1 Please indicate your vote “For” or “Against” with an “X” within the box provided.
2 If you wish to exercise all your votes “For” or “Against”, please indicate with an “X” within the box provided. Alternatively, please
indicate the number of votes as appropriate.
Dated this day of 2016
_____________________________________________
Signature(s) of Member(s)/Common Seal
Total No. of Shares No. of Shares
In CDP Register
In Register of Member
IMPORTANT: PLEASE READ FOLLOWING NOTES BEFORE COMPLETING THIS PROXY FORM
Notes:
1 Please insert the total number of shares held by you. If you have shares entered against your name in the Depository Register (as defined in Section 81SF of the Securities and Futures Act (Cap 289) of Singapore), you should insert that number. If you have shares registered in your name in the Register of Members of the Company, you should insert that number. If you have shares entered against your name in the Depository Register and shares registered in your name in the Register of Members, you should insert the aggregate number. If no number is inserted, this form of proxy will be deemed to relate to all the shares held by you.
2 (a) A member of the Company who is entitled to attend and vote at the Annual General Meeting and who is not a relevant intermediary is entitled to appoint not more than two (2) proxies to attend and vote on his behalf. Where such member appoints more than one (1) proxy, he/she shall specify the proportion of his/her shareholding to be represented by each proxy. A proxy need not be a member of the Company. If the appointer is a corporation, the proxy must be executed under seal or the hand of its duly authorised officer or attorney.
(b) A member of the Company who is entitled to attend and vote at the Annual General Meeting and who is a relevant intermediary is entitled to appoint more than two (2) proxies to attend and vote in his stead. Where such member appoints more than one (1) proxy, the number and class of shares in relation to which each proxy has been appointed shall be specified in the form of proxy.
“Relevant intermediary” has the meaning ascribed to it in Section 181 of the Companies Act, Chapter 50.
3 The instrument appointing a proxy or proxies must be deposited at the office of the Company’s Share Registrar, Tricor Barbinder Share Registration Services at 80 Robinson Road #11-02, Singapore 068898 not less than 48 hours before the time appointed for the meeting.
4 Where a member appoints two (2) proxies, the appointments shall be invalid unless he specifies the proportion of his shareholding (expressed as a percentage of the whole) to be represented by each proxy.
5 The instrument appointing a proxy or proxies must be under the hand of the appointer or his attorney duly authorised in writing. Where the instrument appointing a proxy or proxies is executed by a corporation, it must be executed under its common seal or under the hand of its attorney or a duly authorised officer.
6 Where an instrument appointing a proxy or proxies is signed on behalf of the appointor by an attorney, the letter or power of attorney or a duly certified copy thereof must (failing previous registration with the Company) be lodged with the instrument of proxy, failing which the instrument may be treated as invalid.
7 A corporation that is a member may authorise by resolution of its directors or other governing body such person as it thinks fit to act as its representative at the meeting, in accordance with Section 179 of the Companies Act (Chapter 50) of Singapore.
8 The Company shall be entitled to reject an instrument of proxy which is incomplete, improperly completed, illegible or where the true intentions of the appointor are not ascertainable from the instructions of the appointor specified on the instrument of proxy. In addition, in the case of shares entered in the Depository Register, the Company may reject an instrument of proxy if the member, being the appointor, is not shown to have shares against his name in the Depository Register as at 72 hours before the time appointed for holding the meeting, as certified by The Central Depository (Pte) Limited to the Company.

C O N T E N T S1 Vison, Mission and Values
2 Corporate Profile
4 At a Glance
5 Corporate Structure
8 Business Profile
15 Corporate Milestones
16 Financial Highlights
20 Chairman Statement
22 CEO’s Operational and Financial Review
25 Corporate Information
28 Board of Directors
30 Key Management
34 Investor Relations
35 Employees & Organisation
36 Corporate Social Responsibility
37 Corporate Governance
52 Financial Contents

BH
GLO
BA
L CORPO
RATION
LTD AN
NUAL REPORT 2015
BH GLOBAL CORPORATION LTD 8 Penjuru Lane, Singapore 609189Tel: +65 6291 4444 Fax: +65 6291 5777Email: [email protected]
A N N U A L R E P O R T 2 0 1 5
Stay ing Focused | Remain ing Resi l ient
Recommended
![OUR DEALINGS WITH THE INDIANS. · 2015-02-25 · 1896.] Our Dealings with the Indians. 23 OUR DEALINGS WITH THE INDIANS. BY J. EVAETS GREENE. FROM the earliest occupation of North](https://img.pdfslide.us/doc/110x75/5f25836708bc1f6bb95f21b5/our-dealings-with-the-2015-02-25-1896-our-dealings-with-the-indians-23-our.jpg)