Benjamin Franklin Sch
School Improvement Plan
07/01/2014 - 06/30/2019
2
School Profile
Demographics
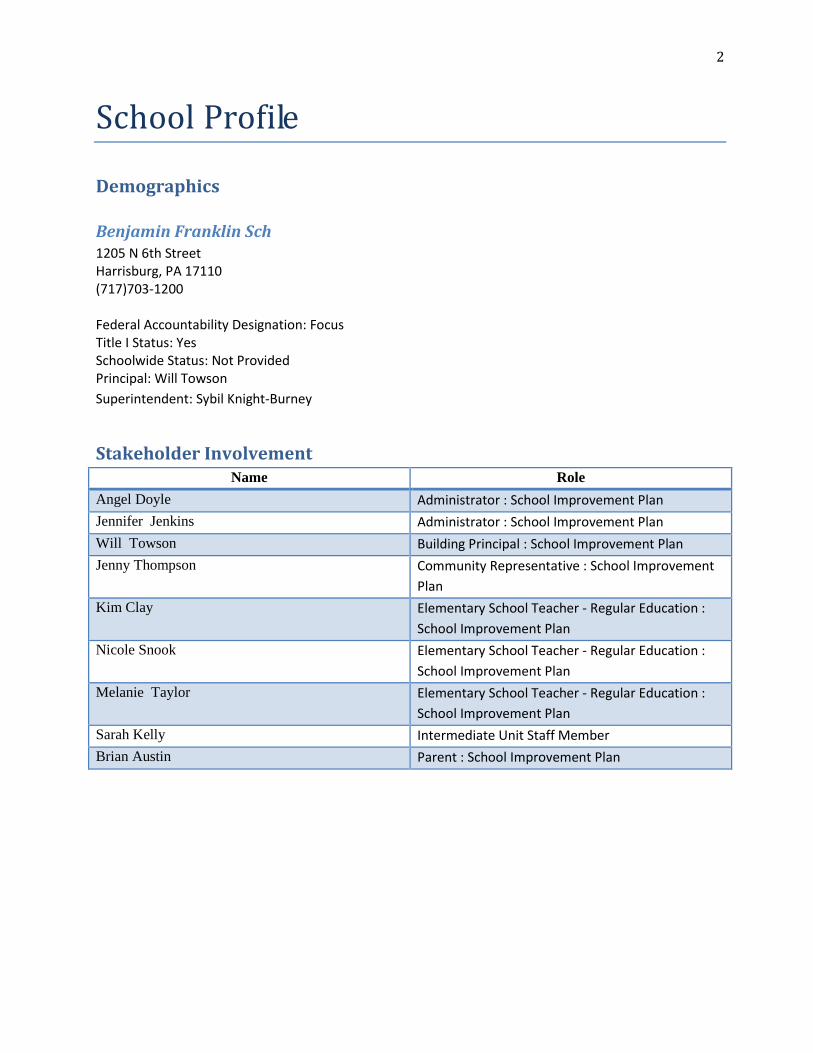
Benjamin Franklin Sch 1205 N 6th Street Harrisburg, PA 17110 (717)703-1200 Federal Accountability Designation: Focus Title I Status: Yes Schoolwide Status: Not Provided Principal: Will Towson
Superintendent: Sybil Knight-Burney
Stakeholder Involvement Name Role
Angel Doyle Administrator : School Improvement Plan
Jennifer Jenkins Administrator : School Improvement Plan
Will Towson Building Principal : School Improvement Plan
Jenny Thompson Community Representative : School Improvement
Plan
Kim Clay Elementary School Teacher - Regular Education :
School Improvement Plan
Nicole Snook Elementary School Teacher - Regular Education :
School Improvement Plan
Melanie Taylor Elementary School Teacher - Regular Education :
School Improvement Plan
Sarah Kelly Intermediate Unit Staff Member
Brian Austin Parent : School Improvement Plan

3
Assurances
School Improvement
All Title I Schools required to complete improvement plans must assure to the Pennsylvania
Department of Education the school's compliance with the following expectations by developing
and implementing an improvement plan or otherwise taking actions that meet the expectations
described by the Assurances listed below.Assurances 1 through 12
No assurances have been identified
Assurance 13
The school is communicating with parents regarding school improvement efforts via the
following strategies:
School web site
School newsletter
District web page
WikiSpaces, Yahoo, Facebook, etc.
Board meeting presentations
District's annual report
District report card
Yearly letter to parents
Periodic mailings/letters, postcards, etc.
Short Message Systems (phone blasts)
Short Message Systems (email blasts)
Invitations to planning (etc.) meetings
Family Night/ Open House / Back to School Night/ Meet-the-Teachers Night, etc.
Special all-school evening event to present improvement plan
Monthly PTO meetings

4
Regular Title 1 meetings
Parent advisory committee meetings
Parent-Teacher Conferences
Student Handbook
Assurance for Priority Schools (Annually Updated SIP)
The school has completed an evaluation of previous school plan and updated the current
plan based on the evaluation.
No
5
Needs Assessment
School Accomplishments
Accomplishment #1:
Behavior
For the first two quarters of 2013-14 school year, 5 out of 6 months of behavior referrals are below
the national average.
Approximately 80% of the school's population received no major behavioral referrals during the
14/15 SY
After target interventions were put into place in the 2015-2016 school year, referrals for defiance
decreased from 42% of major office discipline referrals to 30% of major office discipline referrals.
After targeted interventions were put into place by the PBIS team, referrals for physical aggression
have decreased from 36% of all referrals during the 15/16 school year to 22% of referrals for the
16/17 school year.
Accomplishment #2:
Discipline referrals show 3.5% of students have Tier 2 behavioral needs.
Referrals for physical aggression decreased in targeted 1st grade classrooms implementing 2nd step
curriculum.
In the 2015-2016 school year, 57% of Ben Franklin's population received zero major office
discipline.
During the 15/16 school year 26% of students with ODR's had received 4 or more ODR's. This
number has increased with 33% of students with ODR's receiving 4 or more referrals during the
16/17 school year. 53% of the students with 4 or more ODR's are receiving Tier 2 support during
the 16/17 school year. Of the students receiving Tier 2 support, 76% improved from their baseline
goal.
Accomplishment #3:
PVAAS Math
6
According to PVAAS data during the 2016-2017 school year, 4th grade showed significant evidence
that the school exceeded the standard growt for PA Academic growth in Mathematics. In addition,
students who were predicted to be Below Basic showed moderate evidence of exceeding the
standard for PA Academic Growth.
According to the PVAAS data during the 2012-2013 school year, 4th grade students showed
significant evidence that they exceeded the standard for PA academic growth in mathematics.
Accomplishment #4:
PVAAS ELA
According to the PVAAS data during the 2016-2017 school year, 4th grade showed evidence that the
school met the standard for PA Academic growth in English Language Arts. In addition, students who
were predicted to be Basic and Below basic showed moderate evidence of exceeding the standard,
and students who were predicted to be Proficient met the standard for PA Academic Growth.
According to the PVAAS data during the 2012-2013 school year, 4th grade students
showed moderate evidence that they exceeded the standard for PA academic growth in Reading.
Accomplishment #5:
PVAAS Science
For 2016-2017, students in 4th grade showed significant evidence of exceeding the standard for PA
Academic Growth. In addition, students in all performance categories (except Advanced) showed
moderate evidence of exceeding the standard for PA Academic growth.
Accomplishment #6:
DIBELS
According to the DIBELS data 2017-2018, the percentage of students at the beginning of the year to
the middle of the year revealed that the 4th grade core support increased by 7%.
According to the DIBELS data 2016-2017, the percentage of students at the beginning of the year to
the middle of the year revealed that Kindergarden core support increased by 12%.
According to the DIBELS data 2014-2015 school year. The percentage of students at the beginning
of the year to the middle of the year revealed that 2nd grade At Risk decreased from 60% to 54%.
Accomplishment #7:
EasyCBM
According to the easyCBM data for the 2014-2015 school year. The percentage of students at the
beginning of the year to the middle of the year Proficient increased from 30% to 45%.
7
According to the easyCBM data for the 2014-2015 school year. The percentage of the students at the
beginning of the year to the middle of the year revealed that 2nd grade At Risk decreased from 43%
to 36%.
According to the easyCBM data 2014-2015 school year. The percentage of students at the beginning
of the year to the middle of the year revealed that 1st grade Proficient increased from 19% to 26%.
According to the easyCBM data 2015-2016 school year. The percentage of students at the beginning
of the year to the middle of the year revealed that 4th grade At Risk students decreased from 62% to
57%.
Accomplishment #8:
Local Assessments
For the 2015-2016 school year, we are using formative assessment data, ASPIRE curriculum with
itargeteach data, to make strong instructional decisions in the classroom.
School Concerns
Concern #1:
DIBELS
The DIBELS data for the 2013-14 school year: The composite score at the beginning of year to the
middle of year revealed that 2nd grade intensive increased by 11%. The DIBELS data for the 2013-
14 school year: The percentage of students at the beginning of year to the middle of year revealed
that 1st grade intensive increased from 65% to 66%.
The DIBELS data for the 2015-2016 school year revealed that overall, Ben Franklin's intensive
students increases from 59% of the students at the beginning of the year to 63% of the students at
the middle of the year. The DIBELS data for the 2015-2016 school year shows evidence that the 1st
grade intensive increased from 62% to 73% from the beginning of the year to the middle of the year.
The DIBELS data for the 2016-2017 school year revealed that overall, 59% of Ben Franklin's
students are intensive at the middle of the year. The DIBELS data for the 2016-2017 school year
shows evidence that the 1st grade intensive increased by 7% from the beginning of the year to the
middle of the year.
The DIBELS data for the 2017-2018 school year revealed that overall, 63% of Ben Franklin's
students are intensive at the middle of the year.The DIBELS data for the 2017-2018 school year: The
percentage of students at the beginning of the year to the middle of the year revealed that the 1st
grade intensive increased from 59% to 68%.

8
Concern #2:
Behavior
For the first two quarters of 2013-14 school year, 2nd grade has accumulated 89 referrals which
equates to 32.4% of referrals for the entire school.
Major Office Discipline referrals for physical aggression have increased since the 13/14 SY
In the 2015-2016 school year, approximately 26% of Ben Franklin's students have 4 or more major
office referrals.
Concern #3:
PSSA ELA
Only 28.5% of students in Grade 3 scored in the Proficient or Advanced performance categories on
the Reading PSSA in 2013, and only 28.5% of students in Grade 4 scored in the Proficient or
Advanced performance categories on the Reading PSSA in 2013.
Only 22% of students in Grade 3 scored in the Proficient or Advanced performance categories on
the Reading PSSA in 2014, and only 20.9% of students in Grade 4 scored in the Proficient or
Advanced performance categories on the Reading PSSA in 2014.
Only 16.7% of students in Grade 3 scored in the Proficient or Advanced performance categories on
the Reading PSSA in 2015, and only 17.9% of students in Grade 4 scored in the Proficient or
Advanced perrformance categories on the Reading PSSA in 2015.
Only 23.7% of students in Grade 3 scored in the Proficient or Advanced performance categories on
the Reading PSSA in 2015, and only 15.1% of students in Grade 4 scored in the Proficient or
Advanced perrformance categories on the Reading PSSA in 2016.
Concern #4:
PSSA Math
Only 40% of students in Grade 3 scored in the Proficient or Advanced performance categories on the
Math PSSA in 2013, and only 35.7% of students in Grade 4 scored in the Proficient or Advanced
performance categories on the Mathematics PSSA in 2013.
Only 36.2% of students in Grade 3 scored in the Proficient or Advanced performance categories on
the Math PSSA in 2014 and only 36.2% of students in Grade 4 scored in the Proficient or Advanced
performance categories on the Mathematics PSSA in 2014.
Only 8.4% of students in Grade 3 scored in the Proficient or Advanced performance categories on
the Math PSSA in 2015 and only 6.0% of students in Grade 4 scored in the Proficient or Advanced
performance catefories on the Mathematics PSSA in 2015.
9
Only 18.3% of students in Grade 3 scored in the Proficient or Advanced performance categories on
the Math PSSA in 2015, and only 11.7% of students in Grade 4 scored in the Proficient or Advanced
performance catefories on the Mathematics PSSA in 2016.
Concern #5:
PSSA Science
Only 38.6% of students in Grade 4 scored in the Proficient or Advanced performance categories on
the Science PSSA in 2013.
Only 38% of students in Grade 4 scored in the Proficient or Advanced performance categories on
the Science PSSA in 2014.
Only 8.2% of students in Grade 4 scored in the Proficient or Advanced performance categories on
the Science PSSA in 2015.
Only 27.7% of students in Grade 4 scored in the Proficient or Advanced performance categories on
the Science PSSA in 2016.
Concern #6:
PVAAS ELA
For 2014, only 19% of the students in grade 4 have a 40% to 70% projected probability to score in
the proficient or advanced category on the 4th grade Reading PSSA.
For 2017, only 7% of the students in grade 4 have a 40% to 70% projected probability to score in the
proficient or advanced category on the 4th grade Reading PSSA
For 2016, only 6% of the students in grade 4 have a 40% to 70% projected probability to score in the
proficient or advanced category on the 4th grade Reading PSSA.
Based on the 2017 PVAAS
Concern #7:
PVAAS Math
Based on the 2014 PVAAS results there is evidence that only 32% of the students in grade 3 have a
40% to 70% projected probability to score in the proficient or advanced category on the 4th
grade Mathematics PSSA.
Based on the 2015 PVAAS results there is evidence that only 6% of the students in grade 3 have a
40% to 70% projected probability to score in the proficient or advanced category on the 4th grade
Mathematics PSSA.
10
Based on the 2016 PVAAS results there is evidence that only 3% of the students in grade 3 have a
40% to 70% projected probability to score in the proficient or advanced category on the 4th grade
Mathematics PSSA.
Prioritized Systemic Challenges
Systemic Challenge #1 (Guiding Question #2) Ensure that there is a system within the school that fully
ensures school-wide use of data that is focused on school improvement and the academic growth of all
students
Aligned Concerns:
DIBELS
The DIBELS data for the 2013-14 school year: The composite score at the beginning of
year to the middle of year revealed that 2nd grade intensive increased by 11%. The
DIBELS data for the 2013-14 school year: The percentage of students at the beginning of
year to the middle of year revealed that 1st grade intensive increased from 65% to 66%.
The DIBELS data for the 2015-2016 school year revealed that overall, Ben Franklin's
intensive students increases from 59% of the students at the beginning of the year to 63%
of the students at the middle of the year. The DIBELS data for the 2015-2016 school year
shows evidence that the 1st grade intensive increased from 62% to 73% from the
beginning of the year to the middle of the year.
The DIBELS data for the 2016-2017 school year revealed that overall, 59% of Ben
Franklin's students are intensive at the middle of the year. The DIBELS data for the 2016-
2017 school year shows evidence that the 1st grade intensive increased by 7% from the
beginning of the year to the middle of the year.
The DIBELS data for the 2017-2018 school year revealed that overall, 63% of Ben
Franklin's students are intensive at the middle of the year.The DIBELS data for the 2017-
2018 school year: The percentage of students at the beginning of the year to the middle of
the year revealed that the 1st grade intensive increased from 59% to 68%.
Behavior
For the first two quarters of 2013-14 school year, 2nd grade has accumulated 89 referrals
which equates to 32.4% of referrals for the entire school.
Major Office Discipline referrals for physical aggression have increased since the 13/14
SY
In the 2015-2016 school year, approximately 26% of Ben Franklin's students have 4 or
more major office referrals.

11
PSSA ELA
Only 28.5% of students in Grade 3 scored in the Proficient or Advanced performance
categories on the Reading PSSA in 2013, and only 28.5% of students in Grade 4 scored in
the Proficient or Advanced performance categories on the Reading PSSA in 2013.
Only 22% of students in Grade 3 scored in the Proficient or Advanced performance
categories on the Reading PSSA in 2014, and only 20.9% of students in Grade 4 scored in
the Proficient or Advanced performance categories on the Reading PSSA in 2014.
Only 16.7% of students in Grade 3 scored in the Proficient or Advanced performance
categories on the Reading PSSA in 2015, and only 17.9% of students in Grade 4 scored in
the Proficient or Advanced perrformance categories on the Reading PSSA in 2015.
Only 23.7% of students in Grade 3 scored in the Proficient or Advanced performance
categories on the Reading PSSA in 2015, and only 15.1% of students in Grade 4 scored in
the Proficient or Advanced perrformance categories on the Reading PSSA in 2016.
PSSA Math
Only 40% of students in Grade 3 scored in the Proficient or Advanced performance
categories on the Math PSSA in 2013, and only 35.7% of students in Grade 4 scored in the
Proficient or Advanced performance categories on the Mathematics PSSA in 2013.
Only 36.2% of students in Grade 3 scored in the Proficient or Advanced performance
categories on the Math PSSA in 2014 and only 36.2% of students in Grade 4 scored in the
Proficient or Advanced performance categories on the Mathematics PSSA in 2014.
Only 8.4% of students in Grade 3 scored in the Proficient or Advanced performance
categories on the Math PSSA in 2015 and only 6.0% of students in Grade 4 scored in the
Proficient or Advanced performance catefories on the Mathematics PSSA in 2015.
Only 18.3% of students in Grade 3 scored in the Proficient or Advanced performance
categories on the Math PSSA in 2015, and only 11.7% of students in Grade 4 scored in the
Proficient or Advanced performance catefories on the Mathematics PSSA in 2016.
PSSA Science
Only 38.6% of students in Grade 4 scored in the Proficient or Advanced performance
categories on the Science PSSA in 2013.
Only 38% of students in Grade 4 scored in the Proficient or Advanced performance
categories on the Science PSSA in 2014.
Only 8.2% of students in Grade 4 scored in the Proficient or Advanced performance
categories on the Science PSSA in 2015.
Only 27.7% of students in Grade 4 scored in the Proficient or Advanced performance
categories on the Science PSSA in 2016.

12
PVAAS ELA
For 2014, only 19% of the students in grade 4 have a 40% to 70% projected probability to
score in the proficient or advanced category on the 4th grade Reading PSSA.
For 2017, only 7% of the students in grade 4 have a 40% to 70% projected probability to
score in the proficient or advanced category on the 4th grade Reading PSSA
For 2016, only 6% of the students in grade 4 have a 40% to 70% projected probability to
score in the proficient or advanced category on the 4th grade Reading PSSA.
Based on the 2017 PVAAS
PVAAS Math
Based on the 2014 PVAAS results there is evidence that only 32% of the students in grade
3 have a 40% to 70% projected probability to score in the proficient or advanced category
on the 4th grade Mathematics PSSA.
Based on the 2015 PVAAS results there is evidence that only 6% of the students in grade 3
have a 40% to 70% projected probability to score in the proficient or advanced category
on the 4th grade Mathematics PSSA.
Based on the 2016 PVAAS results there is evidence that only 3% of the students in grade 3
have a 40% to 70% projected probability to score in the proficient or advanced category
on the 4th grade Mathematics PSSA.
Systemic Challenge #2 (Guiding Question #3) Ensure that there is a system within the school that
fully ensures consistent implementation of a standards aligned curriculum framework across all
classrooms for all students.
Aligned Concerns:
PSSA ELA
Only 28.5% of students in Grade 3 scored in the Proficient or Advanced performance
categories on the Reading PSSA in 2013, and only 28.5% of students in Grade 4 scored in
the Proficient or Advanced performance categories on the Reading PSSA in 2013.
Only 22% of students in Grade 3 scored in the Proficient or Advanced performance
categories on the Reading PSSA in 2014, and only 20.9% of students in Grade 4 scored in
the Proficient or Advanced performance categories on the Reading PSSA in 2014.
Only 16.7% of students in Grade 3 scored in the Proficient or Advanced performance
categories on the Reading PSSA in 2015, and only 17.9% of students in Grade 4 scored in
the Proficient or Advanced perrformance categories on the Reading PSSA in 2015.

13
Only 23.7% of students in Grade 3 scored in the Proficient or Advanced performance
categories on the Reading PSSA in 2015, and only 15.1% of students in Grade 4 scored in
the Proficient or Advanced perrformance categories on the Reading PSSA in 2016.
PSSA Math
Only 40% of students in Grade 3 scored in the Proficient or Advanced performance
categories on the Math PSSA in 2013, and only 35.7% of students in Grade 4 scored in the
Proficient or Advanced performance categories on the Mathematics PSSA in 2013.
Only 36.2% of students in Grade 3 scored in the Proficient or Advanced performance
categories on the Math PSSA in 2014 and only 36.2% of students in Grade 4 scored in the
Proficient or Advanced performance categories on the Mathematics PSSA in 2014.
Only 8.4% of students in Grade 3 scored in the Proficient or Advanced performance
categories on the Math PSSA in 2015 and only 6.0% of students in Grade 4 scored in the
Proficient or Advanced performance catefories on the Mathematics PSSA in 2015.
Only 18.3% of students in Grade 3 scored in the Proficient or Advanced performance
categories on the Math PSSA in 2015, and only 11.7% of students in Grade 4 scored in the
Proficient or Advanced performance catefories on the Mathematics PSSA in 2016.
PSSA Science
Only 38.6% of students in Grade 4 scored in the Proficient or Advanced performance
categories on the Science PSSA in 2013.
Only 38% of students in Grade 4 scored in the Proficient or Advanced performance
categories on the Science PSSA in 2014.
Only 8.2% of students in Grade 4 scored in the Proficient or Advanced performance
categories on the Science PSSA in 2015.
Only 27.7% of students in Grade 4 scored in the Proficient or Advanced performance
categories on the Science PSSA in 2016.
PVAAS ELA
For 2014, only 19% of the students in grade 4 have a 40% to 70% projected probability to
score in the proficient or advanced category on the 4th grade Reading PSSA.
For 2017, only 7% of the students in grade 4 have a 40% to 70% projected probability to
score in the proficient or advanced category on the 4th grade Reading PSSA
For 2016, only 6% of the students in grade 4 have a 40% to 70% projected probability to
score in the proficient or advanced category on the 4th grade Reading PSSA.
Based on the 2017 PVAAS
14
PVAAS Math
Based on the 2014 PVAAS results there is evidence that only 32% of the students in grade
3 have a 40% to 70% projected probability to score in the proficient or advanced category
on the 4th grade Mathematics PSSA.
Based on the 2015 PVAAS results there is evidence that only 6% of the students in grade 3
have a 40% to 70% projected probability to score in the proficient or advanced category
on the 4th grade Mathematics PSSA.
Based on the 2016 PVAAS results there is evidence that only 3% of the students in grade 3
have a 40% to 70% projected probability to score in the proficient or advanced category
on the 4th grade Mathematics PSSA.
Systemic Challenge #3 (Guiding Question #4) Ensure that there is a system within the school that
fully ensures consistent implementation of effective instructional practices that meet the needs of all
students across all classrooms and aligns with the Pennsylvania Framework for Teaching
Aligned Concerns:
DIBELS
The DIBELS data for the 2013-14 school year: The composite score at the beginning of
year to the middle of year revealed that 2nd grade intensive increased by 11%. The
DIBELS data for the 2013-14 school year: The percentage of students at the beginning of
year to the middle of year revealed that 1st grade intensive increased from 65% to 66%.
The DIBELS data for the 2015-2016 school year revealed that overall, Ben Franklin's
intensive students increases from 59% of the students at the beginning of the year to 63%
of the students at the middle of the year. The DIBELS data for the 2015-2016 school year
shows evidence that the 1st grade intensive increased from 62% to 73% from the
beginning of the year to the middle of the year.
The DIBELS data for the 2016-2017 school year revealed that overall, 59% of Ben
Franklin's students are intensive at the middle of the year. The DIBELS data for the 2016-
2017 school year shows evidence that the 1st grade intensive increased by 7% from the
beginning of the year to the middle of the year.
The DIBELS data for the 2017-2018 school year revealed that overall, 63% of Ben
Franklin's students are intensive at the middle of the year.The DIBELS data for the 2017-
2018 school year: The percentage of students at the beginning of the year to the middle of
the year revealed that the 1st grade intensive increased from 59% to 68%.
PSSA ELA
15
Only 28.5% of students in Grade 3 scored in the Proficient or Advanced performance
categories on the Reading PSSA in 2013, and only 28.5% of students in Grade 4 scored in
the Proficient or Advanced performance categories on the Reading PSSA in 2013.
Only 22% of students in Grade 3 scored in the Proficient or Advanced performance
categories on the Reading PSSA in 2014, and only 20.9% of students in Grade 4 scored in
the Proficient or Advanced performance categories on the Reading PSSA in 2014.
Only 16.7% of students in Grade 3 scored in the Proficient or Advanced performance
categories on the Reading PSSA in 2015, and only 17.9% of students in Grade 4 scored in
the Proficient or Advanced perrformance categories on the Reading PSSA in 2015.
Only 23.7% of students in Grade 3 scored in the Proficient or Advanced performance
categories on the Reading PSSA in 2015, and only 15.1% of students in Grade 4 scored in
the Proficient or Advanced perrformance categories on the Reading PSSA in 2016.
PSSA Math
Only 40% of students in Grade 3 scored in the Proficient or Advanced performance
categories on the Math PSSA in 2013, and only 35.7% of students in Grade 4 scored in the
Proficient or Advanced performance categories on the Mathematics PSSA in 2013.
Only 36.2% of students in Grade 3 scored in the Proficient or Advanced performance
categories on the Math PSSA in 2014 and only 36.2% of students in Grade 4 scored in the
Proficient or Advanced performance categories on the Mathematics PSSA in 2014.
Only 8.4% of students in Grade 3 scored in the Proficient or Advanced performance
categories on the Math PSSA in 2015 and only 6.0% of students in Grade 4 scored in the
Proficient or Advanced performance catefories on the Mathematics PSSA in 2015.
Only 18.3% of students in Grade 3 scored in the Proficient or Advanced performance
categories on the Math PSSA in 2015, and only 11.7% of students in Grade 4 scored in the
Proficient or Advanced performance catefories on the Mathematics PSSA in 2016.
PSSA Science
Only 38.6% of students in Grade 4 scored in the Proficient or Advanced performance
categories on the Science PSSA in 2013.
Only 38% of students in Grade 4 scored in the Proficient or Advanced performance
categories on the Science PSSA in 2014.
Only 8.2% of students in Grade 4 scored in the Proficient or Advanced performance
categories on the Science PSSA in 2015.
Only 27.7% of students in Grade 4 scored in the Proficient or Advanced performance
categories on the Science PSSA in 2016.

16
PVAAS ELA
For 2014, only 19% of the students in grade 4 have a 40% to 70% projected probability to
score in the proficient or advanced category on the 4th grade Reading PSSA.
For 2017, only 7% of the students in grade 4 have a 40% to 70% projected probability to
score in the proficient or advanced category on the 4th grade Reading PSSA
For 2016, only 6% of the students in grade 4 have a 40% to 70% projected probability to
score in the proficient or advanced category on the 4th grade Reading PSSA.
Based on the 2017 PVAAS
PVAAS Math
Based on the 2014 PVAAS results there is evidence that only 32% of the students in grade
3 have a 40% to 70% projected probability to score in the proficient or advanced category
on the 4th grade Mathematics PSSA.
Based on the 2015 PVAAS results there is evidence that only 6% of the students in grade 3
have a 40% to 70% projected probability to score in the proficient or advanced category
on the 4th grade Mathematics PSSA.
Based on the 2016 PVAAS results there is evidence that only 3% of the students in grade 3
have a 40% to 70% projected probability to score in the proficient or advanced category
on the 4th grade Mathematics PSSA.
Systemic Challenge #4 (Guiding Question #5) Ensure that the organizational structure, processes,
materials, equipment, and human and fiscal resources within the school align with the school’s goals
for student growth and continuous school improvement.
Systemic Challenge #5 (Guiding Question #1) Ensure that there is a system in the school and/or
district that fully ensures the principal is enabled to serve as a strong instructional leader who, in
partnership with the school community (students, staff, parents, community, etc.) leads achievement
growth and continuous improvement within the school.
Systemic Challenge #6 (Guiding Question #6) Ensure that there is a system within the school that
fully ensures a safe and supportive environment for all students.
Aligned Concerns:
Behavior
For the first two quarters of 2013-14 school year, 2nd grade has accumulated 89 referrals
which equates to 32.4% of referrals for the entire school.
Major Office Discipline referrals for physical aggression have increased since the 13/14
SY
In the 2015-2016 school year, approximately 26% of Ben Franklin's students have 4 or
more major office referrals.

17
18
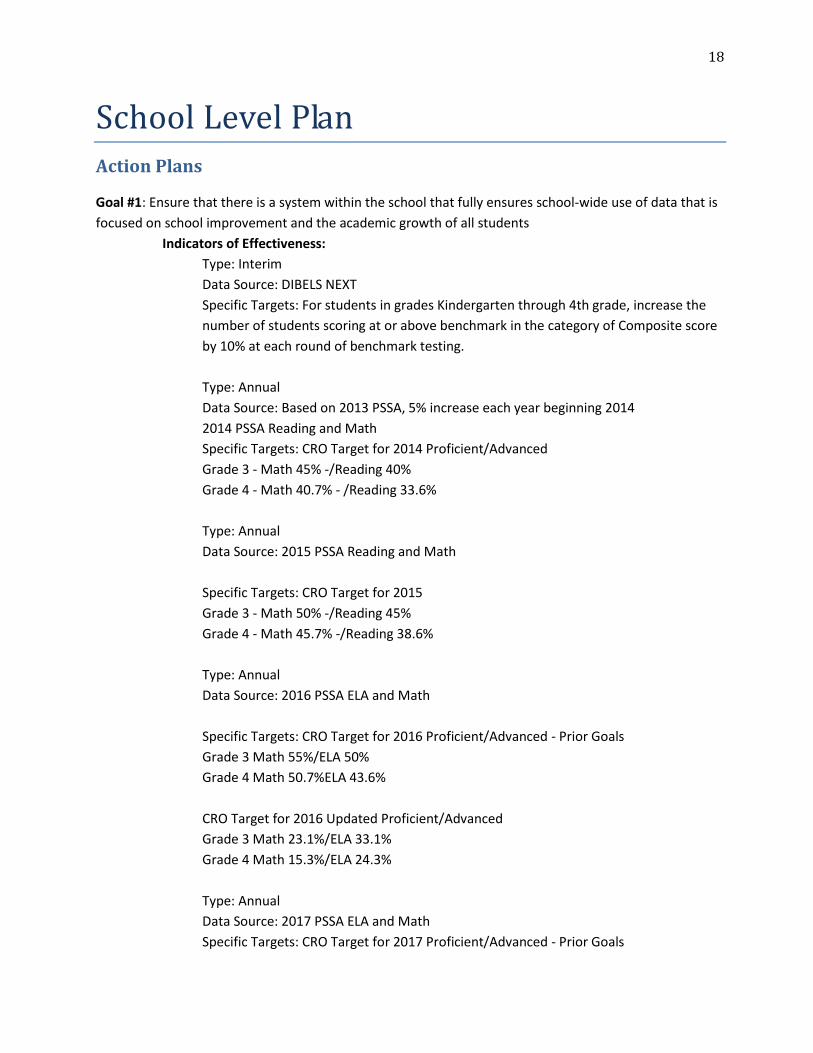
School Level Plan
Action Plans
Goal #1: Ensure that there is a system within the school that fully ensures school-wide use of data that is
focused on school improvement and the academic growth of all students
Indicators of Effectiveness: Type: Interim
Data Source: DIBELS NEXT
Specific Targets: For students in grades Kindergarten through 4th grade, increase the
number of students scoring at or above benchmark in the category of Composite score
by 10% at each round of benchmark testing.
Type: Annual
Data Source: Based on 2013 PSSA, 5% increase each year beginning 2014
2014 PSSA Reading and Math
Specific Targets: CRO Target for 2014 Proficient/Advanced
Grade 3 - Math 45% -/Reading 40%
Grade 4 - Math 40.7% - /Reading 33.6%
Type: Annual
Data Source: 2015 PSSA Reading and Math
Specific Targets: CRO Target for 2015
Grade 3 - Math 50% -/Reading 45%
Grade 4 - Math 45.7% -/Reading 38.6%
Type: Annual
Data Source: 2016 PSSA ELA and Math
Specific Targets: CRO Target for 2016 Proficient/Advanced - Prior Goals
Grade 3 Math 55%/ELA 50%
Grade 4 Math 50.7%ELA 43.6%
CRO Target for 2016 Updated Proficient/Advanced
Grade 3 Math 23.1%/ELA 33.1%
Grade 4 Math 15.3%/ELA 24.3%
Type: Annual
Data Source: 2017 PSSA ELA and Math
Specific Targets: CRO Target for 2017 Proficient/Advanced - Prior Goals
19
Grade 3 Math 60%/ELA 55%
Grade 4 Math 55.7%ELA 48.6%
CRO Target for 2017 Updated Proficient/Advanced
Grade 3 - Math 35.8%/ELA 47.6%
Grade 4 - Math 21.2%/ELA 31.2%
Type: Interim
Data Source: easyCBM
Specific Targets: For students in grades Kindergarten through 4th grade, increase the
number of students scoring within the National Percentile of 40th through 99th in the
category of Composite score by 10% at each round of benchmark testing.
Type: Annual
Data Source: PVAAS
Specific Targets: In grade 4, students who are predicted to be Below Basic or Basic will
exceed the standard for PA Academic Growth. In addition, students who are predicted
to score Proficient or Advanced will at least meet the standard for PA Academic
Growth.
Type: Annual
Data Source: 2018 PSSA Math and ELA
Specific Targets: CRO Target Proficient/Advanced
Grade 3 - Math 48.5%/ELA 62.1%
Grade 4 - Math 27.1%/ELA 38.1%
Strategies:
Student Learning Objectives Description:
Student Learning Objectives will now replace Teacher SMART goals. This has been enacted per Act 82 and part of a teacher's end of year rating.
SAS Alignment: Standards, Assessment, Curriculum Framework, Instruction
Grade Level Meetings
Description:
20
Grade level stakeholders meet once a 6-day cycle to review student data, student work, grade level IDEEAL plan, and assessment data. Interventions are established to support assessed areas of deficiency as well as develop strategies for students who are proficient and advanced.
SAS Alignment: Standards, Assessment, Curriculum Framework, Instruction
Implementation Steps:
Create SLOs
Description:
Teachers will use a variety of data sources (based on the the subject and grade) to determine a beginning of year and end of year measure that will capture the amount of growth a student has made.
Evidence: Completed SLO template
Start Date: 8/11/2014 End Date: 5/25/2019
Program Area(s):
Supported Strategies:
Student Learning Objectives
Analyze Student Data
Description:
Following the completion of each benchmark assessment, teams will meet to discuss and analyze reading and math data to drive core instruction and interventions. In addition, after SMART Goal review teachers will use this data to prepare their initial SMART Goals.
Evidence:
Review prior data for student profile and baseline
DIBELS NEXT & EasyCBM Data
PVAAS Data for 4th Grade
21
PLC Focus Team Cycle Planning Sheet
Agenda for Meeting
Data Binders / Folders
*This has been modified to reflect the 2013-2014 school year
Start Date: 9/8/2014 End Date: 6/5/2019
Program Area(s):
Supported Strategies:
Grade Level Meetings
Create Grade Level Meeting Schedule
Description:
After the master schedule has been completed, the grade level meeting scheduled will be created and shared with all staff. Teams will meet based on the 6-day cycle schedule. Once a quarter, PLCs will take place in lieu of the grade level meetings.
The team will use data in order to develop interventions and enrichment opportunities, create common assessments, discuss effective strategies for instruction and classroom management, as well as analyze data.
Evidence:
Meeting Forms and Meeting Notes – submitted following each meeting
Data Binders / Folders
Meeting Agenda
PLC norms
Start Date: 9/16/2014 End Date: 5/26/2019
Program Area(s):
Supported Strategies:
Grade Level Meetings

22
Discuss Data to Drive Instruction
Description:
At the grade level meetings, the teams will review all benchmark assessment data, report grades, interim reports, ON-Hands, and progress monitoring data.
Evidence: Lesson Plans, Grade Level Binders, Walkthroughs and student growth
Start Date: 9/29/2014 End Date: 6/5/2019
Program Area(s):
Supported Strategies:
Grade Level Meetings
Conduct Observations and Walkthroughs
Description:
Building Administration will monitor classroom instruction through 15 walk-throughs and/or 5 formal observations per week. Administrators will provide teachers with timely, meaningful feedback using the MyLearning Plan system. This step is complete to ensure fidelity.
Start Date: 8/11/2014 End Date: 6/5/2019
Program Area(s):
Supported Strategies:
Grade Level Meetings
Provide Feedback to the teachers
Description:
After observations are conducted, the teacher(s) will receive written feedback from MyLearning Plan, as well as verbal feedback from the administrators.
23
Evidence: MyLearning Plan
Start Date: 8/25/2014 End Date: 6/5/2019
Program Area(s):
Supported Strategies:
Grade Level Meetings
Goal #2: Ensure that there is a system within the school that fully ensures consistent implementation of effective instructional practices that meet the needs of all students across all classrooms and aligns with the Pennsylvania Framework for Teaching
Indicators of Effectiveness:
Type: Interim
Data Source: Administrative walk-throughs
Specific Targets: 90% of walkthroughs show teachers are using research-based instructional strategies in Reading and Math.
Strategies:
Instructional Professional Learning Community
Description:
Professional Learning Communities have shown to increase student achievement. Administration will group staff members according to academic discipline and/or areas of need. Members of each group will review the same material and discuss how to implement best practice strategies within the classroom. Once a quarter, professional learning community meetings will take place in lieu of grade level meetings.
SAS Alignment: None selected
Implementation Steps:

24
Establish Instructional PLC
Description:
The purpose for the Instructional PLC will be established before the start of the school year. Additionally, the protocol for the PLC meetings will be determined. This step will be conducted at the beginning of the school year for the next 3 years.
Evidence: Meeting protocol document
Start Date: 8/11/2014 End Date: 8/15/2018
Program Area(s):
Supported Strategies:
Instructional Professional Learning Community
Create Instructional PLC Schedule
Description:
The schedule for the PLC will be created after the master schedule is built for the school year. This step will be conducted each year before the beginning of the school year.
Evidence: PLC schedule
Start Date: 8/18/2014 End Date: 8/1/2018
Program Area(s):
Supported Strategies:
Instructional Professional Learning Community
Notify the Teachers of the Implementation of the PLC
Description:
Via email, teachers will be notified of the PLC. At the first building faculty meeting, a discussion will ensue about the expectations of the PLC, meeting protocol and the
25
POC. This step will be conducted at the beginning of the school year for the next 3 years.
Evidence: PLC Email notification
Start Date: 8/27/2014 End Date: 7/15/2018
Program Area(s):
Supported Strategies:
Instructional Professional Learning Community
Discuss Data to Drive Instruction
Description:
At the grade level meetings, the teams will review all benchmark assessment data, report grades, interim reports, ON-Hands, and progress monitoring data.
Evidence: Lesson Plans, Grade Level Binders, Walkthroughs and student growth
Start Date: 9/29/2014 End Date: 6/5/2019
Program Area(s):
Supported Strategies:
Instructional Professional Learning Community
Consistent and Pervasive Follow-up of the PLC
Description:
Student data will be reviewed and used to determine topics for future PLC meetings. POCs will conduct and record outcomes of the scheduled PLC meetings on the team feedback form. This step will be conducted regularly throughout the school year for the next 4 years.
Evidence: feedback form
Start Date: 9/1/2014 End Date: 6/5/2019
26
Program Area(s):
Supported Strategies:
Instructional Professional Learning Community
Goal #3: Ensure that there is a system in the school and/or district that fully ensures the principal is enabled to serve as a strong instructional leader who, in partnership with the school community (students, staff, parents, community, etc.) leads achievement growth and continuous improvement within the school.
Indicators of Effectiveness:
Type: Annual
Data Source: Back to School Night
Specific Targets: 5% increase in parent attendance each year
Strategies:
Sharing the Comprehensive Plan with All Stakeholders
Description:
Research shows that if all stakeholders take a part in developing, knowing, and implementing a school improvement plan, there will be more of a chance of building capacity and sustainability.
We will share this plan by numerous steps but reminders will be made periodically, by Connect-Ed phone call system to all stakeholders in our school, informing them of the plan and how to obtain it.
SAS Alignment: Safe and Supportive Schools
Positive School Climate
Description:

27
Ensure a positive climate/culture that promotes collegiality among/between staff, parents, and students.
Promote active partnerships within the community.
SAS Alignment: None selected
Implementation Steps:
Post comprehensive plan on school and district website
Description:
The appointed web administrator from the school will post the completed comprehensive plan on the school website under announcements.
Evidence: Posting on website and data from schoolwires will show how many times the plan was looked at.
Start Date: 8/11/2014 End Date: 8/15/2018
Program Area(s):
Supported Strategies:
Sharing the Comprehensive Plan with All Stakeholders
Share Comprehensive Plan with Teachers
Description:
Teachers will be given a copy of the final School Level Plan to review. This will be given to teachers before summer break.
Evidence: Copy of plan
Start Date: 5/29/2014 End Date: 6/5/2019
Program Area(s):
Supported Strategies:
Sharing the Comprehensive Plan with All Stakeholders
28
Share comprehensive plan with parents at PTA/Literacy Nights
Description:
Each month there will be a PTA/Literacy Night focused around a particular topic. The plan will be scheduled to be shared at one of these evenings.
Evidence: Meeting agenda, sign in sheets and plans available to take home by parents.
This will be done annually to accommodate new parents and stakeholders.
Start Date: 8/11/2014 End Date: 6/5/2019
Program Area(s):
Supported Strategies:
Sharing the Comprehensive Plan with All Stakeholders
Create and implement school survey
Description:
Climate survey was created and given to staff
results were analyzed
Climate committee formed
Start Date: 10/1/2015 End Date: 6/5/2019
Program Area(s):
Supported Strategies:
Positive School Climate
School Climate Committee Meetings

29
Description:
Meetings held weekly, day 2 of a 6 day cycle
Such activities include:
Kindness door decorating contest
Old School vs. New School Breakfast
Book Review
Naming the hallways of the school
Staff collage signs
Cleaning up the school
Start Date: 11/2/2015 End Date: 6/5/2019
Program Area(s):
Supported Strategies:
Positive School Climate
Post School Climate Survey
Description:
Follow up survey given to staff
Evidence:
Start Date: 4/1/2016 End Date: 6/5/2019
Program Area(s):
Supported Strategies:
Positive School Climate
30
Goal #4: Ensure that there is a system within the school that fully ensures a safe and supportive environment for all students.
Indicators of Effectiveness:
Type: Interim
Data Source: SWIS
Specific Targets: 2% decline in major office discipline referrels.
Strategies:
Positive Behavior Intervention and Supports
Description:
Building a positive school climate has shown to reduce the number of office referrals and provide a safe and supportive environment to foster students' learning and growth.
SAS Alignment: Safe and Supportive Schools
Implementation Steps:
Implement PBIS strategies with fidelity
Description:
Weekly incentives given to students, school wide; monthly school wide programs
A Check In/Check Out mentoring system will be put into place to mentor students who are at high risk.
Start Date: 8/17/2015 End Date: 6/5/2019
Program Area(s): Professional Education, Student Services
Supported Strategies:
Positive Behavior Intervention and Supports
31
Establish a Positive Climate
Description:
Increase collaboration among all stakeholders within the school wide community to improve student achievement and accountability through positive classroom behavior management.
Videos and strategies of the week/month will be presented for use in classrooms.
Start Date: 8/17/2015 End Date: 6/5/2019
Program Area(s): Professional Education, Student Services
Supported Strategies:
Positive Behavior Intervention and Supports
Evaluate trends and patterns in school wide discipline data at Collaborative Meetings
Description:
School-Wide discipline data quarterly is evaluated and shared with the faculty at the regularly scheduled collaborative meetings throughout the year.
Evidence: Agendas and notes
Start Date: 9/30/2015 End Date: 6/5/2019
Program Area(s): Professional Education
Supported Strategies:
Positive Behavior Intervention and Supports
Implement a common definition of discipline and processes
Description:
Discipline Process for both minor and majors are clearly described and/or depicted & includes documentation using the SWIS system.
32
Evidence: Policies
Start Date: 8/17/2015 End Date: 6/5/2019
Program Area(s): Professional Education, Student Services
Supported Strategies:
Positive Behavior Intervention and Supports
33
Appendix: Professional Development Implementation
Step Details
No Professional Development Implementation Steps have been identified for Benjamin Franklin Sch.

34
Assurance of Quality and
Accountability
We, the undersigned, hereby certify that the school level plan for Benjamin Franklin Sch in the
Harrisburg City SD has been duly reviewed by a Quality Review Team convened by the
Superintendent of Schools and formally approved by the district's Board of Education, per
guidelines required by the Pennsylvania Department of Education.
We hereby affirm and assure the Secretary of Education that the school level plan:
Addresses all the required components prescribed by the Pennsylvania Department of
Education
Meets ESSA requirements for Title I schools
Reflects sound educational practice
Has a high probability of improving student achievement
Has sufficient District leadership and support to ensure successful implementation
With this Assurance of Quality & Accountability, we, therefore, request that the Secretary of
Education and the Pennsylvania Department of Education grant formal approval to implement the
school level plan submitted by Benjamin Franklin Sch in the Harrisburg City SD for the 2014-
2019 school-year.
No signature has been provided
Superintendent/Chief Executive Officer
No signature has been provided
Board President
No signature has been provided
IU Executive Director

35
Evaluation of School Improvement
Plan
2017-2018 Improvement Evaluation
Describe the success from the past year. This narrative is empty.
Describe the continuing areas of concern from past the year.
This narrative is empty.
Describe the initiatives that have been revised.
This narrative is empty.
2016-2017 Improvement Evaluation
Describe the success from the past year. Perfect attendance is now celebrated every month which has positively impacted the attendance rates. Math and Reading Nights attendance at the beginning of the year compared to the end of the year has increased dramatically. Teachers and parents are working more collaboratively on achieving success at home by providing resources for homework help and additional practice. Teachers are more willing to volunteer outside of the school day for student-centered functions. Parents have provided that they feel better informed with school information than they have in the past years.
Describe the continuing areas of concern from the past year.
Instructional practices need to be implemented with fideltiy and shouldbe consistent and pervasive. The school would benefit from a full-time Instructional Coach. The school has been affected by a reduction in staff (Title 1 Reading Specialist). The number of students who are successful on the PSSAs will continue to be a concern although the school has shown Growth in Math and ELA.
Describe the initiatives that have been revised.
Teacher SMART Goals are now Student Learning Objectives.
2015-2016 Improvement Evaluation
Describe the success from the past year. Using ASPIRE curriculum data to drive instruction.
PLC were established.

36
The SIP was shared with all stakeholders.
Walkthroughs were completed fidelity
Decreased Teacher Turnover
Describe the continuing areas of concern from the past year.
We are continuing to monitor referrals.
We are working with PBIS consultants from the IU to decrease the amount of
referrals.
We will continue with DIBELS.
We will continue with EasyCBM
We will continue to improve teacher and student attendence.
Describe the initiatives that have been revised.
PBIS goal was added to the plan. School Climate Survey was added to the plan. Targets for ELA and Math PSSA were adjusted for 2016 and 2017 per CRO plan April 2016.
2014-2015 Improvement Evaluation
Describe the success from the first year plan. Using ASPIRE curriculum data to drive instruction.
PLC were established.
The SIP was shared with all stakeholders.
Walkthroughs were completed fidelity
Describe the continuing areas of concern from the first year plan.
We are continuing to monitor referrals.
We are working with PBIS consultants from the IU to decrease the amount of
referrals.
We will continue with DIBELS.
37
Decrease teacher turnover
Describe the initiatives that have been revised.
Teacher's smart goals were only used half 2013-2014 school year and were replaced with SLOs.
Recommended